 Open Access Article
Creative Commons Attribution 3.0 Unported Licence
Self-operating transpiration-driven electrokinetic power generator with an artificial hydrological cycle†
Jaehyeong
Bae‡
 a,
Tae Gwang
Yun‡
a,
Bong Lim
Suh
a,
Tae Gwang
Yun‡
a,
Bong Lim
Suh
 b,
Jihan
Kim
 b and
Il-Doo
Kim
 *a
*a
aDepartment of Materials Science and Engineering, Korea Advanced Institute of Science and Technology (KAIST), 291 Daehak-ro, Yuseong-gu, Daejeon, 34141, Republic of Korea. E-mail: idkim@kaist.ac.kr
bDepartment of Chemical and Biomolecular Engineering, Korea Advanced Institute of Science and Technology (KAIST), 291 Daehak-ro, Yuseong-gu, Daejeon, 34141, Republic of Korea
First published on 5th December 2019
Abstract
Autonomous energy scavenging from the ambient environment, or self-energy management, has attracted increasing attention because it could solve the energy problem of abundant Internet of things (IoT) devices. In recent years, several energy harvesters that generate electricity using water have been invented due to their simplicity, sustainability, and eco-friendliness. Until now, the devices have required periodic supplementation of water for continuous electricity generation, which hinders their practical use. Here, we built an artificial hydrological cycle in a transpiration-driven electrokinetic power generator (TEPG) to continuously and autonomously generate electric power. The TEPG, composed of carbon-coated cotton fabric, generates electricity by using a few drops of water (0.2 mL); the electric power originates from the potential difference in the asymmetrically wetted device and the pseudostreaming current. However, after only one hour, the TEPG stops generating electricity, as water inevitably evaporates from the device. For continuous self-operation, we utilized calcium chloride (CaCl2), a typical deliquescent chemical, to collect water vapor from the surrounding environment and continuously supply water to the TEPG. In the range of 15–60% relative humidity (RH), CaCl2 successfully compensates for the water loss by evaporation and maintains the electrical power generation in the closed system. In addition, CaCl2 enhances the generated voltage (0.74 V) and current (22.5 μA) by supplying additional Ca2+ ions to the carbon surface and reducing the resistance of the device, respectively. The developed self-operating transpiration-driven electrokinetic power generator (STEPG) is stable enough to light a light-emitting diode (LED) for a week and charge a commercialized supercapacitor (5 F) to 1.6 V for 8 days.
Broader contextWater is one of the most abundant renewable resources in nature. Due to its sustainability and eco-friendliness, numerous electricity generation technologies that utilize water as an energy source have emerged in recent years. However, like any other generators, water-powered generators need a periodical supply of water since it evaporates from the devices, which hinders their utility. Here, we built an artificial hydrological cycle by using deliquescent calcium chloride to continuously supply water to self-operating transpiration-driven electrokinetic power generators (STEPGs), as the natural hydrological cycle supplies water to the forest. The developed STEPG could directly light a light-emitting diode and charge a supercapacitor for a week, which shows its huge potential as an energy source for low-power electronics and IoT technologies. |
Introduction
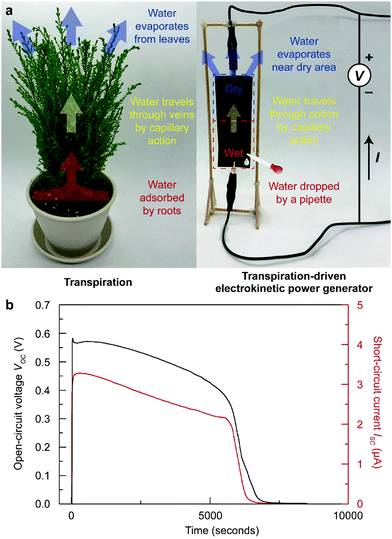
In recent years, energy harvesting devices that utilize water as an energy source have gained great attention since water is the most abundant and ubiquitous liquid on earth.1–3 A variety of devices have been reported, where each device requires their own methods for water supplementation.1–6 For example, Liang, et al. demonstrated a graphene oxide (GO) paper-based moisture-driven electric power generator,5 and Xu et al. presented a pristine GO film-based water diffusion-driven power generator.6 Unfortunately, all of these methods could only enable electricity generation over a short period since water naturally evaporates from the devices, terminating the generation of electricity. Therefore, a water-based energy harvester requires continuous or periodic water supply unless the device is installed at a large water source, such as a lake, a river, or an ocean. Nonetheless, these devices (maximum power of less than 1 mW) are highly suitable as an energy source for the vast number of Internet of things (IoT) devices placed in various locations.7,8 Desirably, the allocation of these devices should not be restricted by place, and a continuous water supply should be guaranteed for their practical use.Many scientists have learned from nature and have adopted the knowledge from nature to solve scientific and engineering problems.9,10 A transpiration-driven electrokinetic power generator (TEPG) is a good example of adopting the process of transpiration in plants to build a water-based energy harvester.11 In nature, plants uptake essential nutrients through the transpiration process, which drives water from the roots and leaves (Fig. 1a).12–15 During the process, water travels through the veins, driven by capillary action. A TEPG, composed of carbon-coated cotton fabric, utilizes a similar process to drive energy generation. For the operation of the TEPG, a small amount of water should be dropped on the negative electrode side to form an asymmetrically wetted carbon-coated cotton fabric (Fig. 1a).11 At the interface between wet and dry carbon, the water content gradient drives continuous capillary flow of water from the wet to dry side. This capillary action on the conductive carbon surface induces a unique electrokinetic charge transfer through the carbon networks, called a pseudostreaming current (Fig. 1b). The main difference between a conventional streaming current and a pseudostreaming current lies in the conductivity of the channel for the water stream; the conventional streaming current corresponds to the current through liquids, whereas the pseudostreaming current corresponds to the current through conducting channels.16 A potential difference originates from the electrical double layer on the wetted carbon surface compared with the dry carbon. Therefore, the presence of water maintaining the wetting asymmetry of the device is crucial for power generation in the TEPG. However, applied water eventually evaporates from the device, which limits continuous energy generation, similar to the aforementioned water-based energy harvesters. To overcome this limitation, water should be repeatedly applied to the TEPG, or the TEPG should somehow collect water from the environment by itself.
Water is indispensable for plants and is predominantly supplied through a process called the hydrological cycle.17–20 The primary hydrological cycle is composed of evaporation of oceans, precipitation in clouds and ground surface runoff.21,22 In addition, plants are involved in a subset of the hydrological cycle through the evapotranspiration process, by which plants uptake water from soil and vaporize it into the air through their roots and leaves.23,24 If a water-based energy harvester could adopt a hydrological cycle with the near environment similar to how plants acquire a stable water supply through the evapotranspiration process, then the management of the water supply for the harvester would be independent, realizing autonomous energy harvesting.
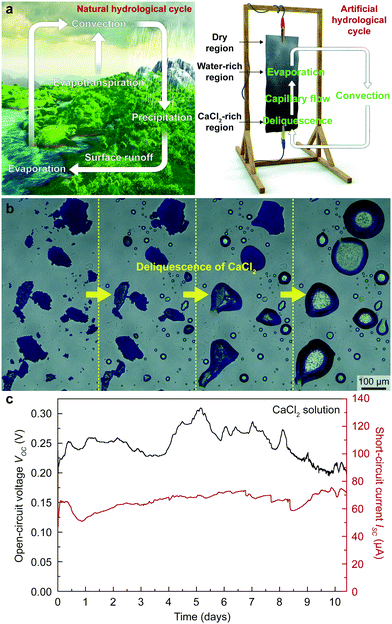
Here, we incorporated CaCl2 into a TEPG system to mimic the natural hydrological cycle to provide an autonomous supply of water to the TEPG (Fig. 2a). Calcium chloride, the main ingredient of desiccants, absorbs moisture from the surrounding air to form a saturated solution (Fig. 2b).25,26 By dropping a CaCl2 solution on the TEPG, we successfully eliminated repeated human work for continuous energy harvesting, i.e., a self-operating transpiration-driven electrokinetic power generator (STEPG; Fig. 2c) was realized. Since the deliquescence has a close relationship with the humidity, we systematically studied the power generation efficiency of the STEPG by varying the amount of CaCl2 and humidity level. The enhanced electrical power of the STEPG upon the addition of CaCl2 was verified by density functional theory (DFT) calculations and modeling of the electric circuit. Our simple and environmentally friendly approach could be easily applicable to other water-based energy harvesters and many other fields that require acquiring water in a self-driven way.
Experimental section
Fabrication and characterization of a self-operating transpiration-driven electrokinetic power generator (STEPG)
For the fabrication of the STEPG, 0.2 g of Ketjen black powder (Lion Specialty Chemicals Co., Ltd, ec600jd model) was dispersed in DI water (40 mL) with 0.4 g of cetrimonium bromide (CTAB, Sigma Aldrich) surfactant. For uniform dispersion of the Ketjen black, the solution was sonicated for 1 hour. Then, cotton fabric (3 cm × 9 cm × 0.12 mm) was dip-coated in the Ketjen black ink, and the Ketjen black-coated cotton fabric was dried in an oven at 80 °C for 30 min. STEPGs with resistances ranging from a few kΩ to tens of MΩ were prepared by controlling the mass loading of Ketjen black by varying the concentration of the ink and/or the number of times the fabric was dipped into the ink. The open-circuit voltage (VOC) and short-circuit current (ISC) of the STEPGs were measured by an electrometer (6517A, Keithley). For operation, saturated CaCl2 solution was gently applied on Ketjen black-coated cotton fabric. We installed the STEPGs in a vertical manner with the wetted area at the bottom to manage capillary action by gravity. The humidity of the closed environment was controlled by a humidifier (OA-HM250, K2C International Co.). After stabilization of humidity for 6 hours, humidity and temperature were measured by a digital thermos-hygrometer (TT-580, Tanita).Application of STEPGs in lighting a light-emitting diode (LED), charging a supercapacitor
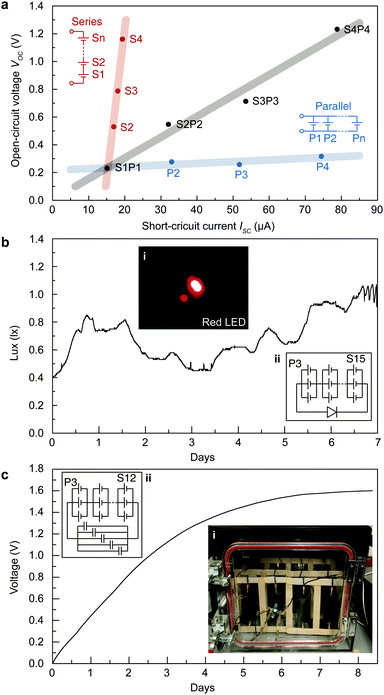
A red LED, YINHUI Photoelectric, with a drive voltage of 2.2 V and a drive current of 20 mA, was powered by a 15 series connection of 3 stacked STEPGs without a rectifier circuit (Fig. 5b). In addition, the electricity generated from the STEPGs (15 series connection of 3 stacked STEPGs) was stored in five commercialized supercapacitors (SAMXON, 1 F capacitance) without a rectifier component (Fig. 5c). The supercapacitor was charged up to 1.6 V for 8 days.Charge redistribution DFT calculations
First-principles calculations were performed with the Vienna ab initio simulation program (VASP)27 based on the plane-wave basis set to describe the charge transfer behavior of calcium cations on the carbon surface. Since the surface of Ketjen black is easily oxidized upon air exposure, we used oxygen-functionalized graphene for the simulation study. The projected-augmented wave (PAW)28 method was used to describe the electron–ion interactions, and for valence electrons, a plane-wave basis set was employed. The generalized gradient approximation method known as GGA-PBE29 was used for the exchange–correlation functional. A cut-off energy of 500 eV was imposed for the plane-wave basis set, and Γ-point sampling was used for the Brillouin zone integration. To nullify the interactions between periodic images along the axis perpendicular to the surface, all slabs were separated by 20 Å along this direction perpendicular. The initial structures were generated by Materials Studio,30 and the initial geometries were further relaxed via DFT simulations. To quantify the charge transfer properties between the cation and the graphene, charge partitioning was calculated with the Bader31 method as implemented in VASP27 and provided by the BADER tool.32Results and discussion
Autonomous and continuous energy generation of the STEPG by using CaCl2
Calcium chloride on the STEPG plays a pivotal role in forming an artificial hydrological cycle, which has the following three steps. (1) The CaCl2 region on the STEPG collects moisture from the air through deliquescence. (2) The dry region wicks water via the cotton fabric from the CaCl2 region, forming a water-wetted region. (3) Water evaporates from the water-wetted region into the air (Fig. 2a). After single dropping of CaCl2 solution, the STEPG maintains stable wetting asymmetry and spontaneously generates power through artificial hydrological circulation (Fig. 2c). The natural hydrological cycle process inevitably has intervals because rain only falls when the criteria for precipitation in clouds are satisfied. In contrast, the criteria for evaporation, diffusion, and deliquescence on the STEPG are satisfied across a broad range of temperatures and humidities, including at ambient conditions; therefore, the artificial hydrological cycle occurs all the time in lab conditions.Effect of CaCl2 content on energy generation of the STEPG
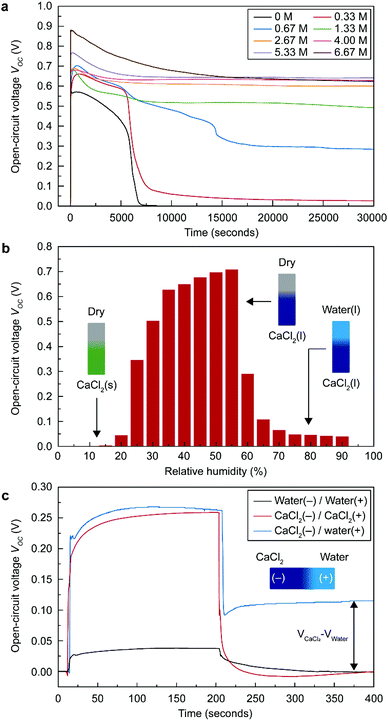
Because wetting asymmetry of the STEPG is key for energy generation, finding a suitable amount of CaCl2 to maintain the appropriate ratio of wet and dry regions is critical. The STEPG was installed vertically to manage the capillary flow driven by the gravity force. If too little CaCl2 is applied on the device, evaporation will dominate the deliquescence, reducing the wet area and thus abating the power generation. If the applied CaCl2 is too much, deliquescence will overwhelm evaporation, and the entire device will be wetted, thus terminating the energy generation. CaCl2 was applied to the STEPG in the form of solution by dissolving it in DI water; therefore, we controlled the optimal amount of CaCl2 by varying the concentration of the solution. As long as the dropped solution contained CaCl2, the STEPG produced continuous VOC and ISC (Fig. 3a and Fig. S1, ESI†). The CaCl2 concentration affects the generated voltage and current values because it determines the quality of the electrical double layer formed at the solution/carbon interface and the resistance of the liquid as well as the device. In ambient conditions, both dilute and supersaturated CaCl2 solutions gradually become saturated solutions, eventually forming a thermodynamic equilibrium. Water in the dilute CaCl2 solution evaporates, and the amount of solution decreases. Below the concentration of 2.67 M, the voltage profile shows a steep decrease around 7000 s, which is the time for evaporation of water to saturate the solution. The large amount of Ca2+ ions in a high concentration CaCl2 solution contributes to a higher charge density in the electrical double layer, resulting in increased VOC, which will be discussed later. Above 2.67 M, the amount of CaCl2 is large enough to develop a high and equal quality electrical double layer near the negative electrode (downside) due to the vertical setup of the STEPG; therefore, the measured VOC values are similar over time without a steep decrease. Compared to VOC, ISC is not saturated even at high concentrations (Fig. S1, ESI†). This result shows that the origins of the voltage and current generation are distinct for TEPGs.11 With a high concentration of CaCl2, the wet region collects more water to facilitate capillary flow and generate a higher current based on pseudostreaming theory. In addition to the enhanced capillary flow, the internal resistance of the device also affects the ISC value, which will be discussed later along with Fig. 4a. A high concentration salt solution exhibits lower resistance than DI water. Therefore, the resistance of the working STEPG operated by CaCl2 solution is lower than that of the TEPG operated by DI water. The lower internal resistance is attributed to the lower resistive loss during energy generation, which results in higher ISC (Fig. S2a, ESI†). In addition to the above reasons, the use of saturated CaCl2 solution is desirable for precise control of the wet and dry areas to maintain the wetting asymmetry of the device.Humidity effect on energy generation of the STEPG
The deliquescent property of CaCl2 is mainly governed by the humidity (Fig. 3b and Fig. S3, ESI†). Under 20% relative humidity (RH) at room temperature, CaCl2 exists in crystalline hydrate form.25 In this condition, no water molecules and solvated ions can be provided to the carbon surface for building the surface charge density; therefore, the STEPG does not generate VOC and ISC. Above 20% RH, CaCl2 collects water from the environment and supplies water to the STEPG, leading to stable VOC and ISC. At a humidity over 60% RH, the whole STEPG is fully wetted by excessive water collection of CaCl2. For the TEPG, loss of the wetting asymmetry results in no more power generation (Fig. 3c and Fig. S4, ESI†).11 The fully wetted STEPG, however, interestingly generates VOC and ISC. The vertical setup limits the diffusion of calcium chloride to the positive (upper) electrode by gravity, so the solutions near the positive electrode and negative (lower) electrode have different CaCl2 contents. In this situation, the potential difference comes from the different surface charge densities between the Ca2+-free positive electrode and the Ca2+-abundant negative electrode.Similarly, the fully wetted STEPG at a humidity over 60% RH can generate a stable current (Fig. S3, ESI†). Although the device is fully wetted, the amount of water on the negative electrode side is greater than that on the positive electrode due to the continuous collection of water from the environment, generating a water content difference. In addition to water molecules, abundant Ca2+ ions on the negative electrode side diffuse to the positive electrode side due to the ion concentration gradient. This combination of two gradients, i.e., protons and Ca2+ ions, contributes to the measured ISC.
Energy generation in a high humidity environment (fully wetted STEPG with CaCl2 content asymmetry)
To further investigate energy generation in the situation of CaCl2 asymmetry in high humidity conditions, we dropped various combinations of DI water and saturated CaCl2 solution at the negative and positive electrodes (Fig. 3c and Fig. S4, ESI†). When both the negative and positive electrodes are wetted by the same type of liquid, the generated VOC converges to 0 even when the liquids are dropped in different orders. When the negative and positive electrodes are wetted by CaCl2 solution and water, respectively, the STEPG produces a reduced VOC (Table 1). The persistent VOC is attributed to the potential difference between the carbons wetted by saturated CaCl2 solution and DI water (VOC,CaCl2–VOC,water). The value seems not to match the VOC measured in the wet/dry situation; however, considering that VOC changes with the internal resistance, the persistent voltage matches well with the voltage difference in terms of the potential difference due to the electrical double layer (VEDL or VEDL,CaCl2–VEDL,water) calculated by the equation below (Table 1, Table S1 and eqn (1); details in ESI†). | (1) |
| Carbon black-coated cotton fabric (7.4 kΩ) | V OC or VOC,CaCl2–VOC,water (V) | V EDL or VEDL,CaCl2–VEDL,water (V) |
|---|---|---|
| (1) CaCl2 (−)/dry (+) | 0.259 | 0.336 |
| (2) Water (−)/dry (+) | 0.038 | 0.190 |
| (3) CaCl2 (−)/water (+) | 0.115 | 0.123 |
| (1)–(2)–(3) | 0.106 | 0.023 |
For the pseudostreaming current (IPST), the measured ISC profile has a similar trend as VOC (Fig. S4, ESI†). From the calculation based on the analyzed electrical circuit (Fig. S2b, ESI†), we found that the IPST at high humidity (fully wetted configuration with CaCl2 asymmetry) is lower than that of the STEPG under ambient humidity and higher than that in the TEPG setting (Table S1 and eqn (2), details in ESI†).11
 | (2) |
Based on pseudostreaming theory, IPST should have the following proportionality.
| IPST ∝ Qσd | (3) |
Compared with the STEPG under ambient humidity, the reduced ISC at high humidity indicates that diminished flow occurs from the interface of the CaCl2 rich regions to that of the CaCl2 poor regions. In addition, the IPST under CaCl2 asymmetry is higher than that in the normal TEPG setting, showing that even though the flow rate is diminished, the diffusion of the surface charges (Ca2+) largely enhances IPST.
Evaluation of energy generated by the STEPG
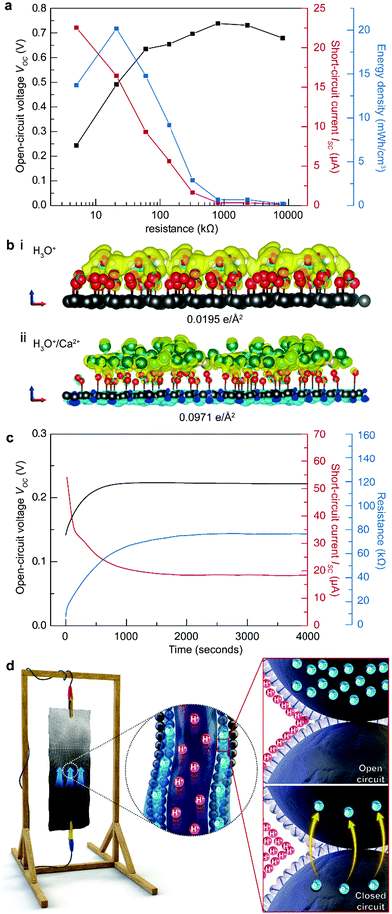
Compared to the TEPG, the STEPG exhibits enhanced maximum VOC (0.74 V), ISC (22.5 μA) and electric power (2.02 μW), exhibiting superior energy performance over other water-based electricity generators (Fig. 4a, Fig. S5, S6 and Table S2, ESI†).11 To verify the origin of the enhanced VOC with Ca2+ ions, we calculated the surface charge density in the double layer caused by adsorption of water molecules and water molecules with Ca2+ ions on oxygen-functionalized graphene by DFT calculation (details in the Experimental section). When oxygen-functionalized graphene is covered only by water, a double layer forms at the water/graphene interface with a surface charge density of 0.0195 e Å−2 on the graphene layer (Fig. 4b-i). In comparison, the surface charge density increases to 0.0971 e Å−2 when Ca2+ ions are included in the solution (Fig. 4b-ii). The Ca2+ ions form an additional charge at the outer Helmholtz layer, thus increasing the overall surface charge density at graphene and hence increasing VEDL as well as the measured VOC (Fig. 4b).33,34 In addition to the voltage, the conductivity of the solution would be increased by adding a salt, which minimizes the resistive loss during the operation of the STEPG and enhances the measured ISC (for details, see ESI†).35,36 Combining the above enhancement with a stable water supply, the STEPG exhibits an energy density of 22.4 mW h cm−3. Moreover, reducing the size of the device can further enhance the energy density up to 135.6 mW h cm−3, which is approximately 120-folds higher than that of the water-driven TEPG without Ca2+ addition (Fig. S7, ESI†).Electrical double layer scattering phenomena due to a flood of electrons at the beginning of STEPG operation
As the STEPG could fix the water content gradient through the artificial hydrological cycle, we were able to find interesting physical phenomena at the beginning of the STEPG operation. At the initial stage (before 1000 s in Fig. 4c), VOC and the resistance increase and ISC decreases. In open-circuit conditions, the electrical double layer is well arranged on the carbon surface, as are the water molecules (dielectric fields) (Fig. 4d with the upper inset). When the STEPG forms a closed circuit, electrons start to flow through the carbons and the surrounding double layer (Fig. 4d under inset, for details of electron transfer, see ESI†). This electron flow disrupts ordered adsorbed protons and water molecules, which increases the Debye length of protons and the permittivity of the solution in the double layer.37,38 The increase of VOC and the internal resistance in the initial operation is attributed to a combination of the two effects.Of course, an increase in the internal resistance should reduce ISC. However, the pseudostreaming current on the STEPG enables the accumulation of electrons at the wet/dry interface even in open-circuit conditions (Fig. 4d upper inset). The accumulated electrons flood toward the positive electrode side after the closed-circuit connection, which leads to a 3-fold larger current than the stabilized values after 1000 s (Fig. 4c). This double layer scattering phenomenon at the beginning of STEPG operation would be obscured without the stable artificial hydrological cycle that maintains the water content at each electrode.
Scaling up and demonstration of STEPG
The energy acquired from STEPGs can be scaled up by series and parallel (stacking manner) connection of STEPGs (Fig. 5a). The series connection of STEPGs multiplies the measured voltage, and the parallel connection multiplies the measured current in proportion to the number of connected STEPGs. The combination of series and parallel connections enlarges the measured voltage and current at the same time without any loss. This simple scaling allows us to design the connection of multiple STEPGs to run a device that has arbitrary voltage and current requirements. To emphasize the long-term energy generation, we successfully lighted a red LED (0.65 lux on average) for a week by using a 15 series connection of 3 stacked STEPGs without any additional elements (Fig. 5b). In addition, the generated power is capable of charging a commercialized supercapacitor (5 F) up to 1.6 V for 8 days using a 12 series connection of 3 stacked STEPGs (Fig. 5c).Conclusions
We successfully elongated the energy generation time of the STEPG through autonomous operation via incorporation of CaCl2 to establish an artificial hydrological cycle. Although the STEPG can operate above 20% RH, the optimum humidity range is 30–55% RH considering the electric power. In addition, the STEPG exhibits enhanced power and energy density 120-fold higher than those of the water-driven TEPG due to the enhanced surface charge density arising from Ca2+ ions and the conductivity of the device. In addition, systematic analysis revealed electrical double layer scattering phenomena at the beginning of operation. The excellent scalability with practical demonstrations verifies the feasibility of using the STEPG as an energy source. Adopting nature's ubiquity and sustainability, the STEPG clearly demonstrates a novel way to improve the utility of energy harvesters, making it highly suitable for large networks of low-power IoT devices.Conflicts of interest
There are no conflicts to declare.Acknowledgements
This work was supported by the Samsung Research Funding & Incubation Center of Samsung Electronics under Project Number SRFC-MA1802-05.Notes and references
- W. Olthuis, B. Schippers, J. Eijkel and A. Van Den Berg, Sens. Actuators, B, 2005, 111–112, 385–389 CrossRef CAS.
- T. Nguyen, Y. Xie, L. J. de Vreede, A. van den Berg and J. C. T. Eijkel, Lab Chip, 2013, 13, 3210–3216 RSC.
- B. Fan, A. Bhattacharya and P. R. Bandaru, Nat. Commun., 2018, 9, 4050 CrossRef CAS PubMed.
- G. Xue, Y. Xu, T. Ding, J. Li, J. Yin, W. Fei, Y. Cao, J. Yu, L. Yuan, L. Gong, J. Chen, S. Deng, J. Zhou and W. Guo, Nat. Nanotechnol., 2017, 12, 317–321 CrossRef CAS PubMed.
- Y. Liang, F. Zhao, Z. Cheng, Y. Deng, Y. Xiao, H. Cheng, P. Zhang, Y. Huang, H. Shao and L. Qu, Energy Environ. Sci., 2018, 11, 1730–1735 RSC.
- T. Xu, X. Ding, C. Shao, L. Song, T. Lin, X. Gao, J. Xue, Z. Zhang and L. Qu, Small, 2018, 14, 1704473 CrossRef PubMed.
- R. Want, W. Wang and S. Chesnutt, Computer, 2018, 51, 66–70 Search PubMed.
- X. Liu, Z. Qin, Y. Gao and J. A. McCann, IEEE Internet Things J., 2019, 6, 4935–4945 Search PubMed.
- B. Bhushan, Philos. Trans. R. Soc., A, 2009, 367, 1445–1486 CrossRef CAS PubMed.
- G. D. Scholes, G. R. Fleming, A. Olaya-Castro and R. Van Grondelle, Nat. Chem., 2011, 3, 763–774 CrossRef CAS PubMed.
- T. G. Yun, J. Bae and I.-D. Kim, ACS Nano, 2019, 13, 12703–12709 CrossRef CAS PubMed.
- R. K. Sinha, Modern Plant Physiology, Alpha Science International, Pangbourne, 2004 Search PubMed.
- L. Taiz, E. Zeiger, I. M. Moller and A. S. Murphy, Plant Physiology and Development, Oxford University Press, Sunderland, 2018 Search PubMed.
- S. Jasechko, Z. D. Sharp, J. J. Gibson, S. J. Birks, Y. Yi and P. J. Fawcett, Nature, 2013, 496, 347–350 CrossRef CAS PubMed.
- J. Evaristo, S. Jasechko and J. J. McDonnell, Nature, 2015, 525, 91–94 CrossRef CAS PubMed.
- A. V. Delgado, F. González-Caballero, R. J. Hunter, L. K. Koopal and J. Lyklema, Pure Appl. Chem., 2005, 77, 1753–1805 CAS.
- M. T. Chahine, Nature, 1992, 359, 373–380 CrossRef.
- W. R. L. Anderegg, A. G. Konings, A. T. Trugman, K. Yu, D. R. Bowling, R. Gabbitas, D. S. Karp, S. Pacala, J. S. Sperry, B. N. Sulman and N. Zenes, Nature, 2018, 561, 538–541 CrossRef CAS PubMed.
- T. Oki and S. Kanae, Science, 2006, 313, 1068–1072 CrossRef CAS PubMed.
- P. Falkowski, R. J. Scholes, E. Boyle, J. Canadell, D. Canfield, J. Elser, N. Gruber, K. Hibbard, P. Högberg, S. Linder, F. T. Mackenzie, B. Moore III, T. Pedersen, Y. Rosenthal, S. Seitzinger, V. Smetacek and W. Steffen, Science, 2000, 290, 291–296 CrossRef CAS PubMed.
- W. Brutsaert and M. B. Parlange, Nature, 1998, 396, 30 CrossRef CAS.
- V. Ramanathan, P. J. Crutzen, J. T. Kiehl and D. Rosenfeld, Science, 2001, 294, 2119–2124 CrossRef CAS PubMed.
- G. B. Bonan, Science, 2008, 320, 1444–1449 CrossRef CAS PubMed.
- P. B. Reich, K. M. Sendall, A. Stefanski, R. L. Rich, S. E. Hobbie and R. A. Montgomery, Nature, 2018, 562, 263–267 CrossRef CAS PubMed.
- R. V. Gough, V. F. Chevrier and M. A. Tolbert, Planet. Space Sci., 2016, 131, 79–87 CrossRef CAS.
- L. J. Mauer and L. S. Taylor, Annu. Rev. Food Sci. Technol., 2010, 1, 41–63 CrossRef CAS PubMed.
- G. Kresse and D. Joubert, Phys. Rev. B: Condens. Matter Mater. Phys., 1999, 59, 1758–1775 CrossRef CAS.
- P. E. Blöchl, Phys. Rev. B: Condens. Matter Mater. Phys., 1994, 50, 17953–17979 CrossRef.
- J. P. Perdew, K. Burke and Y. Wang, Phys. Rev. B: Condens. Matter Mater. Phys., 1996, 54, 16533–16539 CrossRef CAS.
- Materials Studio, Accelrys. co.
- R. F. W. Bader, Chem. Rev., 1991, 91, 893–928 CrossRef CAS.
- G. Henkelman, A. Arnaldsson and H. Jónsson, Comput. Mater. Sci., 2006, 36, 354–360 CrossRef.
- P. B. Antin, S. Forry-Schaudies and T. M. Friedman, J. Cell Biol., 1981, 91, 99–110 Search PubMed.
- R. K. Kalluri, T. A. Ho, J. Biener, M. M. Biener and A. Striolo, J. Phys. Chem. C, 2013, 117, 13609–13619 CrossRef CAS.
- A. V. Wolf, Aqueous Solutions and Body Fluids, New York, 1966 Search PubMed.
- R. C. Weast, CRC Handbook of Chemistry and Physics, CRC Press, Boca Raton, 70th edn, 1989 Search PubMed.
- H. Wang and L. Pilon, J. Phys. Chem. C, 2011, 115, 16711–16719 CrossRef CAS.
- E. Gongadze, U. van Rienen and A. Iglič, Cell. Mol. Biol. Lett., 2011, 16, 576–594 Search PubMed.
Footnotes |
| † Electronic supplementary information (ESI) available. See DOI: 10.1039/c9ee02616a |
| ‡ These authors contributed equally to this work. |
| This journal is © The Royal Society of Chemistry 2020 |

