Fine tuning of intra-lattice electron transfers through site doping in tetraoxolene-bridged iron honeycomb layers†
Yoshihiro
Sekine
 ab,
Jian
Chen
a,
Naoki
Eguchi
 b and
Hitoshi
Miyasaka
 *ab
*ab
aInstitute for Materials Research, Tohoku University, 2-1-1 Katahira, Aoba-ku, Sendai 980-8577, Japan. E-mail: miyasaka@imr.tohoku.ac.jp; Fax: +81-22-215-2031; Tel: +81-22-215-2030
bDepartment of Chemistry, Graduate School of Science, Tohoku University, 6-3 Aramaki-Aza-Aoba, Aoba-ku, Sendai 980-8578, Japan
First published on 7th August 2020
Abstract
The precise control of intra-lattice multiple electron transfers was demonstrated in the solvated and desolvated species of the tetraoxolene-bridged Fe honeycomb layer system, (NPr4)2[Fe2(Cl2An)3]·(solv) (Cl2Ann− = 2,5-dichloro-3,6-dihydroxy-1,4-benzoquinonate; NPr4+ = tetrapropylammonium cation), by the site-doping of the Cl2Ann− bridging unit using X2Ann− units with X = Br or F.
Exploring new stimuli-controllable functional systems is important in the field of materials science.1–4 These systems can be obtained by achieving thermally driven electron transfers (TDETs) in a material,5 which can successfully induce a state (or phase) change in materials at a transition temperature (T1/2). Moreover, modifications of the physical properties of materials such as electronic conductivity,6 magnetic properties,7 elasticity,8 and the dielectric property can be attained.9 Currently, the relevant systems in the charge-transfer metal complexes, which are composed of electron-donor (D) and -acceptor (A) moieties,9–20 and organic charge transfer systems,21–24 have been investigated. Nevertheless, the systematic fine tuning of the variable charge states is still challenging; however, it can potentially be used for the application of these systems in molecular devices and sensors.1–3
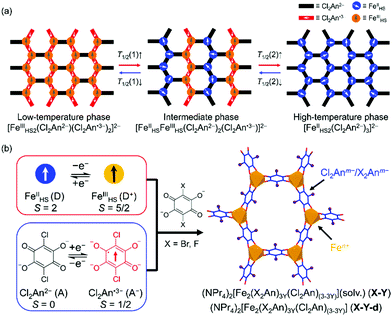
Recently, we have reported two kinds of tetraoxolene-bridged iron honeycomb layered compounds, (NPr4)2[Fe2(Cl2An)3]·2(acetone)·H2O (0; Cl2Ann− = 2,5-dichloro-3,6-dihydroxy-1,4-benzoquinonate; NPr4+ = tetrapropylammonium cation)15 and their desolvated compound (NPr4)2[Fe2(Cl2An)3] (0-d).16 The former exhibited a TDET at T1/2a = 236 K between the phases of [FeIII2(Cl2An2−)(Cl2An˙3−)2]2− at T < T1/2a and [FeIIFeIII(Cl2An2−)2(Cl2-An˙3−)]2− at T > T1/2a,15 while the latter underwent a stepwise TDET at T1/2b = 317 K and T1/2c = 354 K which changed phases from [FeIII2(Cl2An2−)(Cl2An˙3−)2]2− at T < T1/2b to [FeII2(Cl2An2−)3]2− at T > T1/2cvia the intermediate state of [FeIIFeIII(Cl2An2−)2(Cl2An˙3−)]2− at T1/2b < T < T1/2c (Scheme 1a).16 In addition, compounds 0 and 0-d are reversible via the solvation and desolvation processes, respectively. Hence, the systematic and continuous tuning of these phases were favorable due to being unprecedented in multiple TDET systems.
Herein, we report a precise tuning of the multiple transition temperatures T1/2a, T1/2b, and T1/2c based on a chemical technique of site-doping for the charge-transfer materials 0 and 0-d. A rational incorporation of the redox metal ions and bridging ligands into the charge-transfer skeleton is one of the efficient strategies in achieving the fine tuning of TDET.17,18,25–28 In this work, the Cl2Anm− unit in 0 and 0-d was replaced by X2Anm− with X = F or Br in several ratios in the isostructural series where F2Anm− = 2,5-difluoro-3,6-dihydroxy-1,4-benzoquinonate and Br2Anm− = 2,5-dibromo-3,6-dihydroxy-1,4-benzoquinonate. Because the F2An2− and Br2An2− units act as stronger and weaker electron acceptors than Cl2An2−, respectively, their solid-solution series revealed inverse trends in the doping rate dependence of T1/2s between the F-doped and Br-doped series, that is, proportional and inversely-proportional, respectively, despite being linearly variable in both cases.
The solvated compound series of the solid solutions (NPr4)2[Fe2(Cl2An)(3−3Y)(X2An)3Y]·2(acetone)·H2O (X-Y) as X = Br with Y = 0.10 (Br-0.10), 0.18 (Br-0.18), 0.35 (Br-0.35), 0.65 (Br-0.65) and X = F with Y = 0.06 (F-0.06), 0.12 (F-0.12), 0.17 (F-0.17), 0.24 (F-0.24), 0.31 (F-0.31), 0.42 (F-0.42) were synthesized using an identical procedure for 0. Specifically, H2Br2An or H2F2An was mixed into an H2Cl2An solution in various ratios (Scheme 1b),15 where the Y value was obtained from the halogen elemental analyses for the X-Y and their desolvated series, X-Y-d (ESI†). The Y doping ratio was approximately identical to the mixing ratio in the synthetic procedures.
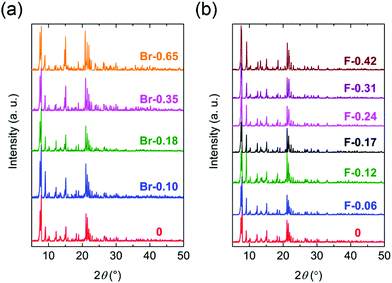
All compounds of the solvated form (X-Y) were isostructural to 0 in the Y-doped region of 0.65 ≥ Y and 0.42 ≥ Y for X = Br and F, respectively. The compounds crystalized in the monoclinic P21/c space group with an asymmetric unit containing two crystallographically independent Fen+ ions, three Cl2Anm−/X2Anm− ligands, and two NPr4+ cations (Fig. S1 and Table S1, S2, ESI†). The Fe ions and Cl2An/X2An ligands formed a honeycomb anionic layer [Fe2(Cl2An/X2An)3]2− in the (100) plane. The occupancy ratio (i.e., the X/Cl ratios) in the Cl2An/X2An ligands was fixed using the ratio obtained using the halogen elemental analyses (ESI†). The polycrystalline samples of the X-Y series were macroscopically evaluated using the powder X-ray diffractograms (PXRD) recorded at room temperature and compared with the simulated patterns determined using the single crystal XRD (SC-XRD) analyses (Fig. 1). We investigated the highly doped compounds beyond the doping rate of 0.65 < Y and 0.42 < Y for X = Br and F, respectively. The polycrystalline samples for the highly doped compounds and X2Anm−-pure compounds had different PXRD patterns from that of 0. Unfortunately, the SC-XRD analyses for the highly doped samples did not succeed because of their low quality single crystals.
The desolvated series X-Y-d were obtained by using the samples of X-Y; (NPr4)2[Fe2(Cl2An)(3–3Y)(X2An)3Y] (X = Br; Br-0.10-d for Y = 0.10, Br-0.18-d for Y = 0.18, Br-0.35-d for Y = 0.35, Br-0.65-d for Y = 0.65, X = F; F-0.06-d for Y = 0.06, F-0.12-d for Y = 0.12, F-0.17-d for Y = 0.17, F-0.24-d for Y = 0.24, F-0.31-d for Y = 0.31, F-0.42-d for Y = 0.42) (Scheme 1b, Fig. S2, ESI†). The SC-XRD analysis at 103 K revealed that the X-Y-d compounds successfully changed to an isostructural 2D honeycomb layer structure with 0-d (Fig. S3, S4 and Tables S3, S4, ESI†). Both the Br-Y-d and F-Y-d were crystallized in the monoclinic space group, P21/n, with an asymmetric unit containing one crystallographically unique Fen+ (Fe × 1), one and a half Cl2Anm−/X2Anm− ligands, and one NPr4+ cation (Fig. S3, ESI†) NPr4+ was located between the honeycomb anionic layers [Fe2(Cl2An/X2An)3]2− formed by the Fe ions and Cl2Anm−/X2Anm− ligands, which were parallel to the (10–1) plane (Fig. S3, ESI†).
The oxidation states of the Fen+ and X2Anm− ligands for the series of X-Y and X-Y-d at 103 K were estimated from the local bond lengths of Fe–O and C–O in the Cl2Anm−/X2Anm− because their bond distances characteristically changed depending on their oxidation states.15,16,19,29 At 103 K, the electronic states of all the site-doped compounds were estimated to be a low-temperature state, which was similarly observed in 0 and 0-d as ([(FeIII)2(Cl2An2−)(Cl2An˙3−)2]2−) (see the ESI†).
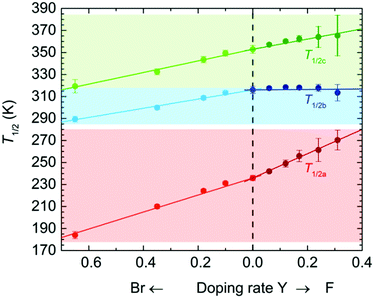
The temperature dependence of the magnetic susceptibilities (χ = M/H) of Br-Y (Y = 0.10, 0.18, 0.35, 0.65) and F-Y (Y = 0.06, 0.12, 0.17, 0.24, 0.31, 0.42) was measured by applying a 1 kOe dc field (Hdc) in the temperature range of 300 to 1.8 K (Fig. 2a and 3a and Fig. S5 and S6, ESI†). The χmT values at 300 K were in the range of 9.72–10.07 cm3 K mol−1 and 9.89–11.28 cm3 K mol−1 for the series of Br-Y and F-Y, respectively, which were varied in a narrow range (Table S5, ESI†). However, it is difficult to conclude that the variation of χmT values at 300 K was caused by the electronic state modulations in the series because of the presence of a strong antiferromagnetic spin coupling between the FeIII with S = 5/2 and X2An˙3− with S = 1/2 (Fig. S5, S6 and Table S5, ESI†).15,16,29–32 As the original 0 compound showed abrupt increases of χm and χmT at T1/2a = 236 K upon cooling concomitant with the one-step transition from the intermediate phase of [FeIIFeIII(Cl2An2−)2(Cl2An˙3−)]2− to a low temperature phase of [FeIII2(Cl2An2−)(Cl2An˙3−)2]2−, all doped X-Y compounds exhibited similar transition features in χm and χmT. However, their T1/2a shifted to lower and higher temperatures with increasing doping rate Y for Br-Y and F-Y, respectively, compared with T1/2a = 236 K for 0 (Fig. 2a and 3a); the T1/2a values reached 184 K (Δ51 K from T1/2a in 0) and 270 K (Δ34 K) for Br-0.65 and F-0.31, respectively. Specifically, T1/2as in both Br-Y and F-Y linearly varied whereas the doping rate of Y had inversely proportional and proportional trends on Y, respectively (Fig. 4 and Fig. S7, ESI†), where the T1/2a temperatures were determined from the peak in the dχmT/dT vs. T plots and their error bars were estimated from the half-value width of the peaks (Fig. S8, ESI†). The slopes of the T1/2a variations were −77.3 and 110.3 K Y−1 for Br-Y and F-Y, respectively. The F-Y series tended to have larger error bars with increasing Y than that of the Br-Y series, and T1/2a was not assigned in F-0.42, which could be due to the large random domain effect of F-X. Nevertheless, these trends of T1/2a in Br-Y and F-Y could be due to the site-doping of X2Anm− with different electron acceptabilities, that is, F2An2− > Cl2An2− > Br2An2− (electronegativity of halogen atom: F > Cl > Br).33,34 The magnetic profile in the entire temperature range from 300 to 1.8 K was similar to that for 0 excluding T1/2a; however, the magnetic correlation lengths at low temperatures were slightly different from each other. Br-Y had a tendency to have a longer correlation length in highly doped compounds, whereas it was approximately inversed for F-Y (Fig. S5 and S6, ESI†). Furthermore, the superparamagnetic behavior of single-chain magnets was observed at lower temperatures as shown in the original compound 0 (Fig. S9, ESI†), which can be attributed to the ferrimagnetic chain motif of [–FeIII–(Cl2An˙3−/X2An˙3−)–] (SFe = 5/2, Srad = 1/2) separated by the diamagnetic Cl2An2−/X2An2− bridges in the honeycomb layer (low-temperature phase in Scheme 1a).15
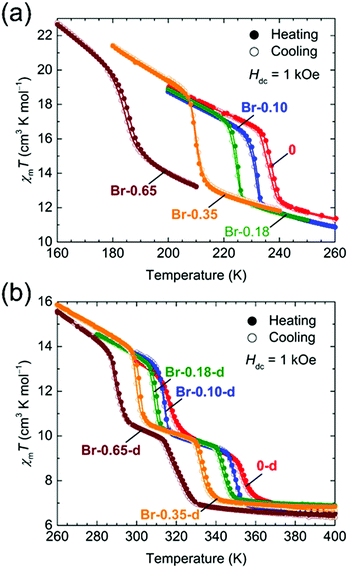 | ||
| Fig. 2 Temperature dependence of χmT for Br-Y (a) and Br-Y-d (b) measured at Hdc = 1 kOe (χm = Mm/Hdc), where the narrow temperature ranges of 160–260 K and 260–400 K, respectively, were used. | ||
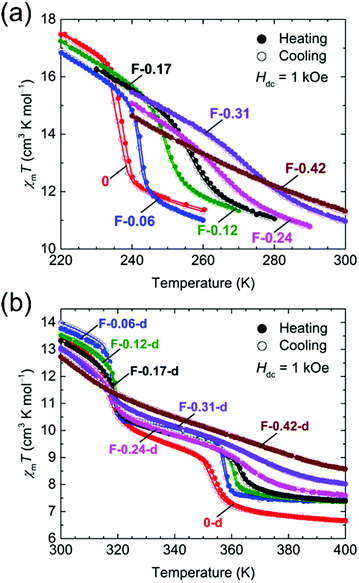 | ||
| Fig. 3 Temperature dependence of χmT for F-Y (a) and F-Y-d (b) measured at Hdc = 1 kOe (χm = Mm/Hdc), where narrow temperature ranges of 220–300 K and 300–400 K, respectively, were used. | ||
The temperature dependence of the magnetic susceptibility for the doped series of the desolvated compounds X-Y-d was measured in the temperature range of 400–1.8 K. As the χm–and χmT − T plots for 0-d showed a two-step transition (abrupt increasing of χm and χmT upon cooling) at T1/2b = 316 K and T1/2c = 353 K, corresponding to the variation of the electronic state from [FeII2(Cl2An2−)3]2− at T > T1/2c to [FeIII2(Cl2An2−)(Cl2An˙3−)2]2− at T < T1/2bvia an intermediate state of [FeIIFeIII(Cl2An2−)2(Cl2-An˙3−)]2− at T1/2b < T < T1/2c (Scheme 1a),16 the site-doped X-Y-d series showed similar two-step transitions. The error bar was larger in the highly doped species in F-X-d (Fig. 2b and 3b), owing to the characteristic domain effect. Moreover, the transition temperatures of T1/2b and T1/2c in Br-Y-d clearly shifted linearly to lower temperatures. On the other hand, the tendency in F-Y-d was slightly different from that of F-Y. The transition temperature of T1/2c in F-Y-d tended to shift to higher temperatures in the solid solution species with lower doping rates; however, T1/2b was approximately constant in the series. As mentioned above, the domain effect was characteristic in the series of F-Y-d and F-Y. Hence, it is difficult to conclude that T1/2b was not affected by the site-doping of F2Anm−. Although there was no clear reason, the transition temperatures in F-Y-d were slightly affected by the doping of the site-doping of F2Anm−. The slope of the T1/2b and T1/2c variations versus Y was −41.7 and –52.7 K Y−1 for Br-Y-d and 2.0 and 46.5 K Y−1 and F-Y-d (Fig. S7, ESI†). The difference in tendencies can be explained by the electron-acceptability of F2An2− > Cl2An2− > Br2An2−.
The site-doping of F2Anm− influenced the magnetic phase of the solid-solution materials of F-Y-d. The F-Y-d species with Y ≤ 0.24 have a maximum of χm at approximately 23 K followed by a steep decrease after further cooling. This was indicative of an antiferromagnetic ground state as similarly found in 0-d and Br-Y-d (Fig. S5, ESI†); however, the decrease of χm did not occur in the cases with higher doping rate. Instead, the superparamagnetic behavior of single-chain magnets was observed in the low-temperature phase of F-Y-d with 0.24 < Y (Scheme 1a).
In summary, we succeeded in the precise tuning of multiple TDET at three T1/2s transition temperatures through the chemical-site doping of two types of tetraoxolene-bridged Fe-based honeycomb layer compounds. This provided an “on-demand TDET” in a temperature range of 184 to 365 K.
We thank H. Sato (Rigaku Co. Ltd) for his assistance with single-crystal crystallography. This work was supported by a Grant-in-Aid for Scientific Research (No. 18K19050, 18H05208, 19K15518, and 20H00381) from the MEXT, Japan, and E-IMR project. Y. S. is thankful for financial support received from the Shorai Foundation for Science and Technology, and research grant from The Mazda Foundation. J. C. gratefully acknowledges the financial support received from the China Scholarship Council (CSC) and Institute for Materials Research, Tohoku University.
Conflicts of interest
There are no conflicts to declare.Notes and references
- O. Sato, Nat. Chem., 2016, 8, 644–656 CrossRef CAS PubMed.
- M. E. Guillermo and E. Coronado, Chem. Soc. Rev., 2018, 47, 533–557 RSC.
- A. Dei, D. Gatteschi, C. Sangregorio and L. Sorace, Acc. Chem. Res., 2004, 37, 827–835 CrossRef CAS PubMed.
- E. Coronado, Nat. Rev. Mater., 2019, 5, 87–104 CrossRef.
- J. S. Miller and K. S. Min, Angew. Chem., Int. Ed., 2009, 48, 262–272 CrossRef CAS PubMed.
- M. Mitsumi, T. Nishitani, S. Yamasaki, N. Shimada, Y. Komatsu, K. Toriumi, Y. Kitagawa, M. Okumura, Y. Miyazaki, N. Córska, A. Inaba, A. Kanda and N. Hanasaki, J. Am. Chem. Soc., 2014, 136, 7026–7037 CrossRef CAS PubMed.
- M. Nihei, Y. Sekine, N. Suganami, K. Nakazawa, A. Nakano, H. Nakano, Y. Murakami and H. Oshio, J. Am. Chem. Soc., 2011, 133, 3592–3600 CrossRef CAS PubMed.
- K. Boukheddaden, E. D. Loutete-Dangui, E. Codjovi, M. Castro, J. A. Rodriguéz-Velamazán, S. Ohkoshi, H. Tokoro, M. Koubaa, Y. Abid and F. Varret, J. Appl. Phys., 2011, 109, 013520 CrossRef.
- N. Hoshino, F. Iijima, G. N. Newton, N. Yoshida, T. Shiga, H. Nojiri, A. Nakao, R. Kumai, Y. Murakami and H. Oshio, Nat. Chem., 2012, 4, 921–926 CrossRef CAS PubMed.
- R. M. Buchanan and C. G. Pierpont, J. Am. Chem. Soc., 1980, 102, 4951–4957 CrossRef CAS.
- D. F. Li, R. Clérac, O. Roubeau, E. Harté, C. Mathonière, R. L. Bris and S. M. Holmes, J. Am. Chem. Soc., 2008, 130, 252–258 CrossRef CAS PubMed.
- D. Kiriya, H. C. Chang and S. Kitagawa, J. Am. Chem. Soc., 2008, 130, 5515–5522 CrossRef CAS PubMed.
- H. Miyasaka, N. Motokawa, T. Chiyo, M. Takemura, M. Yamashita, H. Sagayama and T. Arima, J. Am. Chem. Soc., 2011, 133, 5338–5345 CrossRef CAS PubMed.
- M. Nihei, Y. Okamoto, Y. Sekine, N. Hoshino, T. Shiga, I. P. C. Liu and H. Oshio, Angew. Chem., Int. Ed., 2012, 51, 6361–6364 CrossRef CAS PubMed.
- J. Chen, Y. Sekine, Y. Komatsumaru, S. Hayami and H. Miyasaka, Angew. Chem., Int. Ed., 2018, 57, 12043–12047 CrossRef CAS PubMed.
- J. Chen, Y. Sekine, A. Okazawa, H. Sato, W. Kosaka and H. Miyasaka, Chem. Sci., 2020, 11, 3610–3618 RSC.
- K. Nakabayashi and H. Miyasaka, Chem. – Eur. J., 2014, 20, 5121–5131 CrossRef PubMed.
- K. Nakabayashi, M. Nishio and H. Miyasaka, Inorg. Chem., 2016, 55, 2473–2480 CrossRef CAS PubMed.
- J. A. DeGayner, K. Y. Wang and T. D. Harris, J. Am. Chem. Soc., 2018, 140, 6550–6553 CrossRef CAS PubMed.
- W. Kosaka, Y. Takahashi, M. Nishio, K. Narushima, H. Fukunaga and H. Miyasaka, Adv. Sci., 2018, 5, 1700526 CrossRef PubMed.
- J. B. Torrance, A. Girlando, J. J. Mayerle, J. I. Crowley, V. Y. Lee and P. Batail, Phys. Rev. Lett., 1981, 47, 1747–1750 CrossRef CAS.
- S. Horiuchi, R. Kumai, Y. Okimoto and Y. Tokura, Chem. Phys., 2006, 325, 78–91 CrossRef CAS.
- S. Horiuchi, R. Kumai, Y. Okimoto and Y. Tokura, Phys. Rev. B: Condens. Matter Mater. Phys., 1999, 59, 11267–11275 CrossRef CAS.
- G. Saito and Y. Yoshida, Bull. Chem. Soc. Jpn., 2007, 80, 1–137 CrossRef CAS.
- M.-H. Zeng, B. Wang, X.-Y. Wang, W.-X. Zhang, X.-M. Chen and S. Gao, Inorg. Chem., 2006, 45, 7069–7076 CrossRef CAS PubMed.
- M. Nishio, N. Hoshino, W. Kosaka, T. Akutagawa and H. Miyasaka, J. Am. Chem. Soc., 2013, 135, 17715–17718 CrossRef CAS PubMed.
- S. Chorazy, J. J. Stanek, W. Nogas, A. M. Majcher, M. Rams, M. Kozieł, E. Juszyńska-Gałązka, K. Nakabayashi, S.-I. Ohkoshi, B. Sieklucka and R. Podgajny, J. Am. Chem. Soc., 2016, 138, 1635–1646 CrossRef CAS PubMed.
- L. Liu, L. Li, M. E. Ziebel and T. D. Harris, J. Am. Chem. Soc., 2020, 142, 4705–4713 CrossRef CAS PubMed.
- J. A. DeGayner, I. R. Jeon, L. Sun, M. Dincă and T. D. Harris, J. Am. Chem. Soc., 2017, 139, 4175–4184 CrossRef CAS PubMed.
- A. Dei, D. Gatteschi, L. Pardi and U. Russo, Inorg. Chem., 1991, 30, 2589–2594 CrossRef CAS.
- I. R. Jeon, B. Negru, R. P. Van Duyne and T. D. Harris, J. Am. Chem. Soc., 2015, 137, 15699–15702 CrossRef CAS PubMed.
- S. A. Sahadevan, A. Abhervé, N. Monni, D. P. Sáenz, J. R. Galán-Mascarós, J. C. Waerenborgh, B. J. C. Vieira, P. Auban-Senzier, S. Pillet, E. Bendeif, P. Alemany, E. Canadell, M. L. Mercuri and N. Avarvari, J. Am. Chem. Soc., 2018, 140, 12611–12621 CrossRef CAS PubMed.
- M. Atzori, S. Benmansour, G. Mínguez Espallargas, M. Clemente-León, A. Abhervé, P. Gómez-Claramunt, E. Coronado, F. Artizzu, E. Sessini, P. Deplano, A. Serpe, M. L. Mercuri and C. J. Gómez-García, Inorg. Chem., 2013, 52, 10031–10040 CrossRef CAS PubMed.
- R. Murase, B. F. Abrahams, D. M. D'Alessandro, C. G. Davies, T. A. Hudson, G. N. L. Jameson, B. Moubaraki, K. S. Murray, R. Robson and A. L. Sutton, Inorg. Chem., 2017, 56, 9025–9035 CrossRef CAS PubMed.
Footnote |
| † Electronic supplementary information (ESI) available: Experimental details associated with this research; Tables S1–S5, Fig. S1–S8. CCDC 2014803–2014822. For ESI and crystallographic data in CIF or other electronic format see DOI: 10.1039/d0cc03808c |
| This journal is © The Royal Society of Chemistry 2020 |

