 Open Access Article
Metabolic mapping with plasmonic nanoparticle assemblies†
Nguyen H.
Le
a,
Gang
Ye
b,
Chun
Peng
 bc and
Jennifer I. L.
Chen
 *a
*a
aDepartment of Chemistry, York University, 4700 Keele Street, Toronto, Ontario M3J 1P3, Canada. E-mail: jilchen@yorku.ca
bDepartment of Biology, York University, 4700 Keele Street, Toronto, Ontario M3J 1P3, Canada
cCentre for Research on Biomolecular Interactions, York University, 4700 Keele Street, Toronto, Ontario M3J 1P3, Canada
First published on 17th March 2020
Abstract
A rapid and simple methodology for the biomolecular analysis of single cells and microenvironments via a stick-and-peel plasmonic sensing platform is reported. Substrate-bound assemblies of plasmonic gold nanoparticles linked by reconfigurable oligonucleotides undergo disassembly upon target binding. Changes in the light scattering intensity of thousands of discrete nanoparticle assemblies are extrapolated concomitantly to yield the mapping of local target concentrations. The methodology is completely free of labelling, purification and separation steps. We quantified the intracellular ATP levels for two ovarian cancer cell lines to elucidate the differences and cellular distribution, and demonstrated the potential of the stick-and-peel platform for mapping the microenvironment of a 2D heterogeneous surface. The portable and economical analytical platform may broaden the affordability and applicability of single-cell based analyses and enable new opportunities in clinical care such as on-site molecular pathology.
Introduction
Molecular analyses at the single-cell level provide insight into cellular heterogeneity. These analyses elucidate the distribution of genomic, transcriptomic, proteomic and metabolomic levels in individual cells and enable the investigation of cell-to cell variations that are unattainable using common biochemical ensemble assays. The ability to probe cellular heterogeneity may lead to better disease diagnosis, prognosis and treatment1–5 by enabling the differentiation of subpopulations of disease-causing cells, the discovery of biochemical pathways and mechanisms, and the monitoring of the efficacy of therapeutic intervention. Technologies for performing molecular and chemical analyses at the single-cell level include fluorescence- or mass-spectrometry-based techniques6–11 coupled with flow cytometry,12–14 capillary electrophoresis15–17 or optical microscopy,18–20 in which the biomolecules of interest are labelled. They require complex instruments, centralized laboratory and personnel with expertise, and are often costly and time-consuming. Developing economical and portable analytical platforms for the rapid detection of biomolecules in single cells and microenvironments may broaden the affordability of such analyses and bridge the gap between fundamental biomedical research and clinical applications.Sensing platforms based on single plasmonic nanostructures can detect targets near the vicinity of the particles, and thus have the potential to provide quantitative analysis of volume-limited samples such as single cells. Detection is achieved via a spectral shift or a change in the intensity of the scattered light, arisen from the reconfiguration of multi-nanoparticle assemblies.21–26 Plasmonic nanostructures such as dimers21,23,24,27–29 and clusters30–33 have been developed for monitoring biomolecular interactions, including enzymatic activities32,33 and binding of nucleic acids;34,35 however the direct quantification of intracellular biomolecules from individual cells has not been achieved.
Our recent work demonstrated the detection of metabolites such as ATP using aptamer-linked core-satellite gold nanoparticle (AuNP) assemblies.22 ATP is the energy molecule and plays an important role in various processes that occur in living cells, such as muscle contraction, phosphorylation and active transport of ions, glucose, and amino acids. The level of ATP infers the state of cellular metabolism, and is explored as an indicator of heightened chemoresistance of cancer cells36 and tumorigenesis.37–39 ATP is conventionally detected via chemiluminescence of the luciferase enzyme,40,41 an ensemble assay that is affected by pH, oxygen, and the concentrations of the enzyme, cation, and the luciferin substrate. The analysis of ATP at the single-cell level has been performed via a FRET technique using engineered proteins, such as donor (mseCFP) and acceptor (mVenus) fluorescent proteins linked by an ATP-binding peptide subunit,42 or a specially designed single fluorescent protein quencher.43 The challenges with quantitation, protease sensitivity and photobleaching, combined with the need for protein engineering make the methodologies inaccessible to researchers in the broad scientific community.
Our previous work established core-satellite AuNP assemblies for the selective detection of ATP over ADP and AMP.22 As with most other chip-based sensors, we detected the target in the bulk sample such as the lysate of an ensemble of cells. In this work, we derived the methodology for detecting at ultra-low volume down to a single cell and for mapping the molecular distribution in microenvironments. We optimized the conditions for localizing the lysate of individual cells near the assemblies and established the method of extrapolating the local concentration based on the signal change of discrete nanoparticle sensors. We analysed the distribution of ATP levels of two ovarian cancer cell lines and showed that the average results corroborate the bulk measurements. In contrast to most single-cell technologies that aim to produce big data and complete “omics”, our work presents alternative opportunities to enable cost-effective, user-friendly and rapid validation of biomolecules of interest with high spatial resolution.
Results and discussion
Principle of detection at the single-cell level
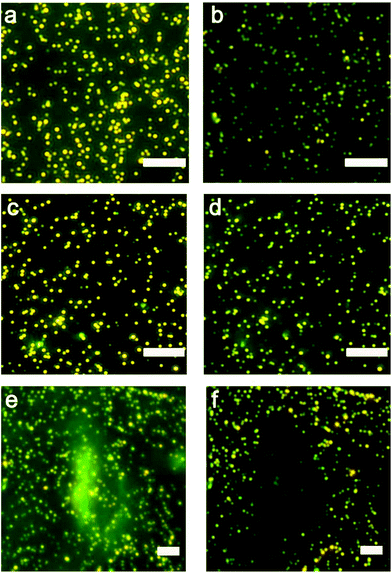
Nanoparticle clusters were fabricated via a layer-by-layer, DNA-directed self-assembly of satellite AuNPs around core AuNPs. We employed an ATP-aptamer and a partial complement as the linkers. The aptamer undergoes structural changes upon binding of ATP,44–46 leading to the dehybridization of the linkers, the disassembly of the structure and the decrease in the scattering intensity (Scheme 1a). To investigate the concentration of ATP in cells, we sandwiched the nanoparticle sensors, which were anchored on an elastomeric substrate, with cells cultured on an adherent cover slip in the presence of microlitres of lysis buffer (Scheme 1b).The initial work showed that the entire sensing area decreases in intensity as the expunged ATP binds to the nanoparticle assemblies throughout the substrate. In the analysis of two ovarian cancer cell lines, SKOV3.ip1![[thin space (1/6-em)]](https://www.rsc.org/images/entities/char_2009.gif) 47 and HEY,48 the scattering intensity decreased more significantly for SKOV3.ip1 (Fig. 1a vs. b) than HEY (Fig. 1c vs. d) cells; however no local intensity change corresponding to lysates from individual cells was achieved. Next, we incorporated glycerol and optimized its concentration in the lysis buffer (Fig. S1†) to increase the viscosity and decrease the diffusion of biomolecules while maintaining the ability to disassemble the clusters. Fig. 1e and f show the darkfield images of the nanoparticle assemblies before and after lysing using buffer containing 20% glycerol. We observed an overlap of locations between the cell and of decreased scattering intensity in the darkfield image. It suggests that the diffusion of small molecules, such as ATP, can in fact be confined to the vicinity of the cell and detected by nanoparticle assemblies within minutes.
47 and HEY,48 the scattering intensity decreased more significantly for SKOV3.ip1 (Fig. 1a vs. b) than HEY (Fig. 1c vs. d) cells; however no local intensity change corresponding to lysates from individual cells was achieved. Next, we incorporated glycerol and optimized its concentration in the lysis buffer (Fig. S1†) to increase the viscosity and decrease the diffusion of biomolecules while maintaining the ability to disassemble the clusters. Fig. 1e and f show the darkfield images of the nanoparticle assemblies before and after lysing using buffer containing 20% glycerol. We observed an overlap of locations between the cell and of decreased scattering intensity in the darkfield image. It suggests that the diffusion of small molecules, such as ATP, can in fact be confined to the vicinity of the cell and detected by nanoparticle assemblies within minutes.
Morphology of nanoparticle assemblies
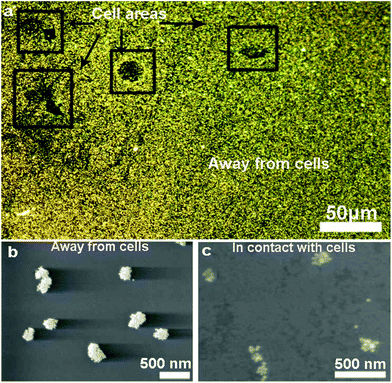
We characterized the morphology of the nanostructures at locations overlapping and away from the cells. Fig. 2a shows a low-magnification darkfield image and Fig. 2b and c show the representative SEM images of the nanostructures found at locations away from the cells and directly in contact with the cells, respectively. The assemblies that are far away from the cells remain large with >40 particles in the core-satellite structure (Fig. 2b). In contrast, the assemblies in contact with the cells show variations in size and structure (Fig. 2c and S2†). The disassembled structures exhibit a small number of satellite nanoparticles (ca. 6 to 20), while some dispersed single AuNPs and a few larger aggregates were also observed in the cell area (Fig. S3†).Detection based on individual nanostructures
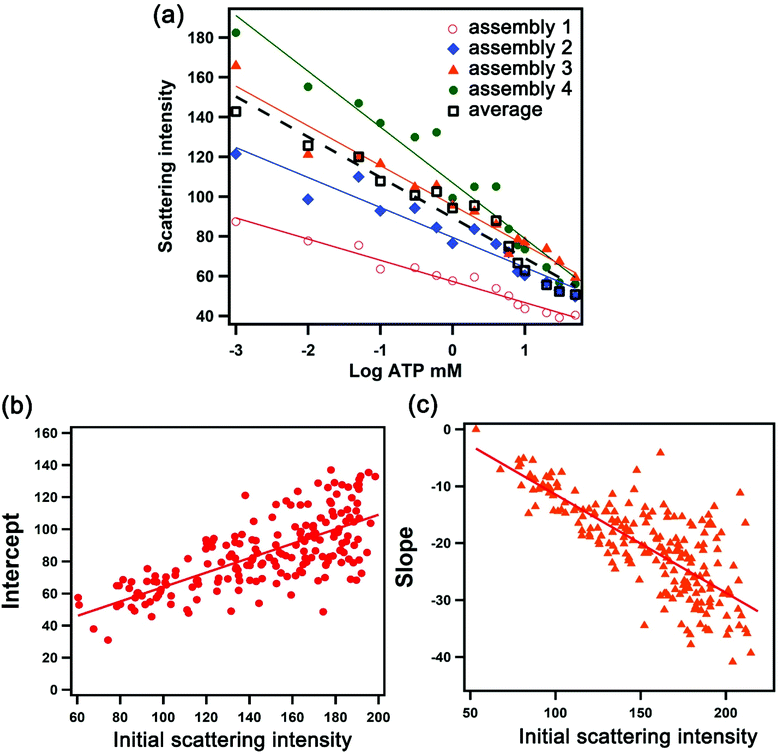
We exploited the scattering intensity from individual nanostructures for the quantification and mapping of ATP levels. As we established previously, the scattering intensity obtained from the darkfield image was found to correlate with the intensity measured spectroscopically.22 We can thus extrapolate the detection signal of hundreds of assemblies all in the field of view rapidly based on image processing and obtain the local concentration of ATP using a concentration-dependent calibration curve. However, in single-nanostructure analysis, differences in the morphology of the nanoparticles yield variations in the optical properties. A darkfield microscopy image therefore consists of thousands of assemblies that are variable in scattering intensity which do not follow a universal calibration curve. Fig. 3a shows the dependence of the scattering intensity on the logarithmic concentration of ATP for 4 selected assemblies, overlaid with the average values obtained from all of the assemblies captured in the entire image. A plasmonic AuNP assembly with a high initial scattering intensity shows a steeper dose–response compared to that with a low initial scattering intensity. The calibration curve has the general form I = mC + b, where I is the scattering intensity, C is the log concentration of ATP in mM, m is the slope, and b is the y-intercept. Upon examining >200 assemblies, we found that the slope and y-intercept of the calibration curve in the working range linearly depend on the initial scattering intensity, as shown in Fig. 3b and c. These parameters can be calculated based on the fits in Fig. 3b and c, where m = −0.18I0 + 6.82 and b = 0.50I0 + 13.7. As a result, the calibration curve for each nanoparticle assembly can be determined based on its initial scattering intensity. The concentration-dependent relationships show that the sensing performance varies depending on the size of the aggregate, with detection limits of 0.05–0.20 mM for assemblies with scattering intensities ranging from 100 ± 10 to 200 ± 10 counts (Table S1†). Moreover, the sensitivity of larger assemblies is greater than two-fold of the smaller assemblies, as indicated by the slope of the calibration response.Quantification and distribution of ATP levels
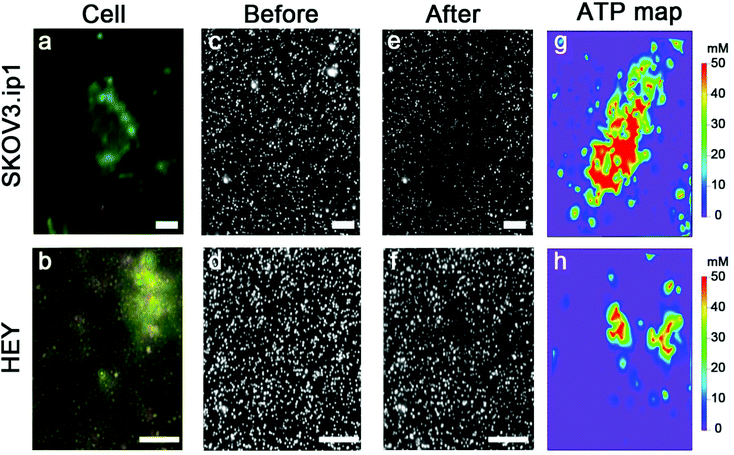
We examined over a hundred cells using the nanoparticle assembly sensing platform. Fig. 4 shows the darkfield microscopy images of a single SKOV3.ip1 and HEY cell on top of the nanoparticle assemblies (Fig. 4a and b), and gray-scale images of the sensors before (Fig. 4c and d) and after (Fig. 4e and f) being in contact with the corresponding lysed cells. The local decrease in the scattering intensity of the assemblies nearby the cells is significantly more prominent for SKOV3.ip1 (Fig. 4e) in comparison to HEY (Fig. 4f). We analysed the changes in the scattering intensity of individual nanostructures and applied their respective calibration equation to obtain the concentration of ATP localized at each assembly. We then used an image interpolation method to map out the concentration of ATP between the nanostructures which were anchored a few micrometers apart. Fig. 4g and h show the concentration maps of ATP from a single SKOV3.ip1 and HEY cell corresponding to Fig. 4a and b, respectively. The concentration of expunged ATP reaches as high as 50 mM locally for the SKOV3.ip1 cell, whereas it is lower for the HEY cell. The intracellular ATP levels of bacterial E. coli and human HeLa cells have been reported to be few millimolars using FRET-related techniques.42,49–51 The high concentration we obtained could be due to the evaporation of the small volume of lysis buffer, which concentrated the cell contents. It is also possible that the fluorescence-based studies achieved a saturation of signal at a concentration of ∼10 mM.To obtain the total amount of ATP per cell, we integrated the concentration map over the sensing volume, which was estimated to be 500 nm in height over the area of interest. The distributions of the intracellular ATP content for SKOV3.ip1 and HEY cells from the analyses of 110 and 60 cells, respectively, are shown in Fig. 5. When fitted to Gaussian distributions, the intracellular ATP of SKOV3.ip1 cells is centred at 5.53 fmole compared to 0.40 fmole for HEY cells, resulting in a 13.8-fold difference. On the other hand, the average value of ATP for SKOV3.ip1 is 11.6-fold higher than HEY cells.
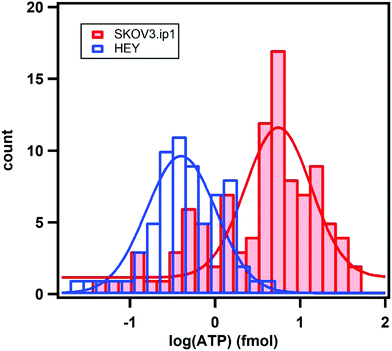 | ||
| Fig. 5 Distributions of the expunged intracellular ATP content for SKOV3.ip1 cells (red) and HEY cells (blue) from the analysis of 110 and 60 cells, respectively. The fits are Gaussian distributions. | ||
We performed comparative ensemble measurements to determine the ATP levels of the two cell lines. Similar numbers of SKOV3.ip1 and HEY cells were seeded separately; after 16 hours, the number of cells was counted again and HEY cells were observed to grow 2.7 times faster than SKOV3.ip1. The cell lysates were analysed using two bulk methods – the luciferase assay and the nanoparticle assemblies without the addition of glycerol (as in Fig. 1a–d). We obtained a 3.0-fold difference in the ATP levels between the two cell lines based on the analysis of the entire darkfield image containing the nanoparticle assemblies,22 in line with the 2.9-fold difference determined by the luciferase assay (Fig. S4†). When the faster growth rate and the greater number of HEY than SKOV3.ip1 cells in the ensemble measurements are taken into account, the difference of ATP levels between SKOV3.ip1 and HEY is ∼8.7-fold, in agreement with the single-cell analysis.
Control experiments
We carried out control experiments in which the ATP-aptamer linked nanoparticle assemblies were exposed to the lysis buffer alone and the non-targeting assemblies were exposed to lysed cells. These control experiments show negligible changes in the scattering intensity of the assemblies (Fig. S5†), suggesting that neither the lysis buffer nor other cellular species lead to the cleavage of the linker. Additionally, since the sensing substrate was rinsed and imaged separately, there was negligible optical interference from the cell debris. As an additional control, we tested the response of the ATP-aptamer linked nanoparticle assemblies to SKOV3.ip1 cells treated with an ATP-depleting reagent. The alkylating agent, 3-bromopyruvate (3BP), is a potent inhibitor of GAPDH enzyme in the glycolysis process that can lead to cell death;36,52 its effect on the ATP production of the cells was confirmed using the luciferase assay (Fig. S6†). The scattering intensity of the nanoparticle assemblies before and after exposure to the ATP-depleted cells again remains similar (Fig. S5†). Hence all three control experiments yielded indistinguishable concentration maps. The findings support that the disassembly arises from the binding of ATP and there is no interference or false positives from other lysed cellular species.Sensing of heterogeneous 2D surfaces
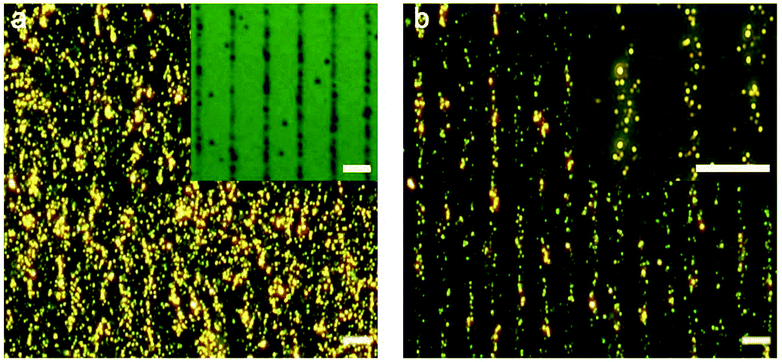
Lastly, we demonstrate the potential of the sensing platform for mapping out the target in a 2D microenvironment. We patterned a substrate with linear arrays of ATP via microcontact printing.53 The parallel stripes of ATP are ∼1 μm wide and ∼13 μm spaced apart as shown in Fig. 6a inset. Fig. 6a and b show the darkfield scattering images of the nanoparticle assemblies before and after being in contact with the ATP-patterned substrate in a minimal amount of glycerol-containing buffer. The scattering intensity decreases congruently at locations of ATP, although the dissolution and diffusion of the molecules yielded disassembly across a wider area (∼6 μm) than the ATP pattern.Conclusions
In summary, we developed both the experimental and data processing methods for quantifying local concentrations of analytes using discrete plasmonic AuNP assemblies. The label-free methodology is rapid and cost-effective without any separation or purification step. The stick-and-peel approach for analysing expunged metabolites with nanoparticle sensors fabricated on a separate substrate circumvents the need for transporting nanoparticles inside cells, where the rate and mechanisms of endocytosis can be variable or altered depending on cell biology. The ability to quantify the target concentration at a micron-scale further paves the way for mapping of the local environment and heterogeneity of complex biological samples such as tissue and tumor slices. When combined with a portable smartphone-based microscope and cloud-based data processing and analysis, the sensing platform may facilitate on-site molecular pathology without personnel of expertise. By modifying the DNA-linkers in the plasmonic nanoparticle assemblies for various biomarkers, our sensing platform may provide alternative opportunities in biodiagnostics and advances in personalized healthcare.Experimental
Reagents and materials
Colloidal gold nanoparticle solutions were purchased from BBI Solutions. Anhydrous ethanol and 2-propanol were purchased from Commercial Alcohol, and water used for all experiments was purified using a Millipore system. Methoxy poly(ethyleneglycol)succinimidyl valerate (mPEG-SVA, MW = 5000 g mol−1) was obtained from Layson Bio Inc. Triton X-100 was obtained from BioShop Canada Inc. Polydimethylsiloxane (PDMS – Sylgard 184) was purchased from Dow Corning Corporation. 3-Aminopropyl trimethoxysilane (APTMS) was purchased from Sigma-Aldrich. Oligonucleotides were obtained from Integrated DNA Technologies.DNA sequences:
ATP-targeting assemblies:
Seq. 1: 5′-T GAC ACC TTA AAA AAA AAA-S-3′
Seq. 2: 5′-ACC TGG GGG AGT ATT GCG GAG GAA GGT GTC ACA AAA AAA AAA A-S-3′
Control assemblies:
Seq. 3: 5′-S-TCT CAA CTC GTA CGC ATG ATT GTT TTC AAT CAT GCG CGA AAG ATC CTG AAT GCG-3′
Seq. 4: 5′-S-AAA AAA AAA ACG CAT TCA GGAT-3′
Fabrication of assemblies on a substrate
The methodology was adapted from our previous work.22 Briefly, an APTMS-functionalized PDMS substrate was used to anchor the core nanoparticles of 60 nm. Volumes of 10 μL of 0.01 M phosphate buffer (PB), 1 M NaCl and 0.1% sodium dodecyl sulfate (SDS) and 10 μL of 10 μM seq. 1 were added to the substrate containing core AuNPs. The solution was mixed gently using a pipette tip. The substrate was then placed in a water-saturated container for 2 hours to allow the thiolated DNA to attach to the core AuNPs. The sample was rinsed with Milli-Q water and dried with nitrogen. The excess amino groups on the substrate were passivated with 5 mM mPEG-SVA in 0.1 M bicarbonate buffer (pH = 8.2). After passivation for 4 hours, the sample was washed with Milli-Q water and dried with nitrogen. The substrate containing seq. 1-functionalized core AuNPs was incubated in PB containing 0.3 M NaCl until layer assembly.The colloidal AuNPs functionalized with seq. 1 and seq. 2 were prepared using the standard salt-aging procedure.54 To assemble the first layer of satellite AuNPs (30 nm) on the core, a volume of 20 μL of ATP-aptamer (seq. 2) functionalized AuNPs was incubated with core AuNPs on the substrate in 0.01 M PB, 0.3 M NaCl and 0.01% SDS for 1 hour. The solution was then removed and the sample was washed at least 3 times with a 0.01 M PB, 0.3 M NaCl solution. To assemble the second layer of satellite particles, seq. 1 DNA-functionalized AuNPs were added to the existing core-satellite (1 layer) sample on the substrate for 1 hour. The solution was removed and the substrate was washed with buffer. The procedure was repeated with alternating DNA-functionalized AuNPs to build the multilayer core-satellite structures. The clusters were incubated in the buffer of 0.01 M PB, 0.3 M NaCl till sensing experiments.
Cell culture and lysis experiments
SKOV3.ip1 and HEY cells were obtained and cultured as previously reported.55 Briefly, SKOV3.ip1 cells were maintained in McCoy's culture media (Sigma-Aldrich, Oakville, ON, Canada), supplemented with 10% fetal bovine serum (Gibco Thermofisher, Burlington, ON, Canada). HEY cells were cultured in DMEM (GE HyClone, Logan, UT, USA) containing 10% fetal bovine serum. Cells were regularly checked to make sure they were free of mycoplasma contamination. They were re-seeded on the cell culturing coverslips (Sarstedt, Newton, NC, USA) and grown for 16 h. For bulk measurement, similar numbers of the cells of SKOV3.ip1 and HEY were seeded; for single-cell experiment, the number of seeded HEY cells was reduced to obtain a similar confluency (∼50%) for both cell lines after 16 h of growth. For the control experiment with an ATP-depleting reagent, SKOV3.ip1 cells were incubated with 3-bromopyruvate at the specified concentrations.A volume of 5 μL lysing buffer containing 0.01 M PB, 0.15 M NaCl, 0.02% Triton X-100 and 20% (v/v) glycerol was placed on the PDMS substrate containing the nanoparticle assemblies. The coverslip with cells was rinsed with 0.01 M PBS, dried and immediately placed gently on the PDMS substrate. After 30 minutes of incubation to ensure completion of cell lysis, the coverslip was removed and the PDMS substrate was washed with buffer (0.01 M PB, 0.15 M NaCl) and placed on a clean coverslip for imaging. The darkfield images of nanoparticle assemblies were captured before and after the sandwich assay in buffer.
Patterning and mapping of ATP on a cover slip
An APTMS-functionalized cover slip was used as the substrate for microcontact printing of ATP patterns. A diffraction grating (GR1325-07106, 75 lines per mm, Thorlabs) hydrophobized with trichloro(1H,1H,2H,2H-perfluorooctyl)-silane was used as the master. The PDMS precursor mixture was cast on the master grating, followed by evacuation for 30 minutes. The PDMS replica was then cured in an oven at 60 °C for 8 hours.A concentration of 20 mg mL−1 ATP solution was prepared in ethanol. The ATP solution was then transferred on a PDMS stamp using a cotton swab and the stamp was placed on the silanized cover slip with a weight of 5 grams. After 5 minutes, the PDMS stamp was peeled off and the coverslip was used immediately for experiment.
The patterned ATP on the coverslip was placed in contact with the AuNP assemblies anchored on PDMS for less than one minute with 2 μL of buffer containing 0.01 M PB, 0.15 M NaCl, and 20% (v/v) glycerol. The darkfield images of nanoparticle assemblies were captured before and after the sandwich assay in buffer.
Darkfield imaging and analysis
Nanostructures in the sample area (100 × 100 μm2) were visualized using a Nikon TE-2000U inverted microscope fitted with a darkfield condenser and 60× objective. The microscope was connected to a CCD camera (Jenoptik) and darkfield images were captured at an integration time of 200 ms.The darkfield images were overlaid and converted to an 8-bit JPEG grayscale that expresses the intensity on a scale from 0 to 255. For the analysis of individual assembly, the coordinates of the center of the assemblies were identified by using the Localizer toolkit in Igor; this can also be achieved using common bio-imaging analysis software such as CellProfiler. The intensity of the surrounding 81 pixels for each assembly was averaged and corrected by the background intensity. Nanoparticle assemblies with an average initial intensity between 50 and 200 were used for sensing experiments. The intensity has an arbitrary unit.
The concentration maps were generated using the Voronoi image interpolation function in Igor. Briefly, a matrix containing the coordinates of the assemblies and the extrapolated ATP concentrations from the calibration curve was established. A 3D surface representation was then processed via the triangulation of the xyz data using Voronoi interpolation.
ATP luminescence assay
The luminescence ATP detection assay was purchased from Abcam. SKOV3.ip1 and HEY cells were grown in 96-well plates at 37 °C for 12–16 hours. A volume of 50 μL of detergent was added to the wells and the plate was shaken for 5 minutes to lyse the cells. A volume of 50 μL of substrate solution was added in the dark. The microplate was shaken for an additional 10 minutes. The luminescence was measured using a microplate reader.Scanning electron microscopy
A Quanta FEG 250 electron microscope operating at 10.0 kV in low vacuum mode was used. The approximate location of the AuNP assemblies near a lysed SKOV3.ip1 cell was identified by conductive ink markings at the edge of the PDMS. A collage of darkfield optical images was captured for correlating the structures found in the SEM.Conflicts of interest
There are no conflicts to declare.Acknowledgements
Funding is supported by the NSERC Discovery Grant and the Research Tool Infrastructure to J. I. L. Chen and the CIHR PJT-153146 to C. Peng. The authors thank I. Gourevich (University of Toronto) and M. Jaklewicz (York University) for technical support with SEM imaging.References
- S. J. Altschuler and L. F. Wu, Cell, 2010, 141, 559–563 CrossRef CAS PubMed.
- P. K. Chattopadhyay, T. M. Gierahn, M. Roederer and J. C. Love, Nat. Immunol., 2014, 15, 128–135 CrossRef CAS PubMed.
- B. L. Khoo, P. K. Chaudhuri, N. Ramalingam, D. S. W. Tan, C. T. Lim and M. E. Warkiani, Int. J. Cancer, 2016, 139, 243–255 CrossRef CAS PubMed.
- G. Kelsey, O. Stegle and W. Reik, Science, 2017, 358, 69–75 CrossRef CAS PubMed.
- D. A. Lawson, K. Kessenbrock, R. T. Davis, N. Pervolarakis and Z. Werb, Nat. Cell Biol., 2018, 20, 1349–1360 CrossRef CAS PubMed.
- J. Zhao, J. Gao, W. Xue, Z. Di, H. Xing, Y. Lu and L. Li, J. Am. Chem. Soc., 2018, 140, 578–581 CrossRef CAS PubMed.
- L. Zhang, C. J. Sevinsky, B. M. Davis and A. Vertes, Anal. Chem., 2018, 90, 4626–4634 CrossRef CAS PubMed.
- R. Liu, G. Zhang and Z. Yang, Chem. Commun., 2019, 55, 616–619 RSC.
- B. Ajami, N. Samusik, P. Wieghofer, P. P. Ho, A. Crotti, Z. Bjornson, M. Prinz, W. J. Fantl, G. P. Nolan and L. Steinman, Nat. Neurosci., 2018, 21, 541–551 CrossRef CAS PubMed.
- L. W. Zhang and A. Vertes, Angew. Chem., Int. Ed., 2018, 57, 4466–4477 CrossRef CAS PubMed.
- Y. Taniguchi, P. J. Choi, G.-W. Li, H. Chen, M. Babu, J. Hearn, A. Emili and X. S. Xie, Science, 2010, 329, 533–538 CrossRef CAS PubMed.
- P. K. Chattopadhyay, D. A. Price, T. F. Harper, M. R. Betts, J. Yu, E. Gostick, S. P. Perfetto, P. Goepfert, R. A. Koup, S. C. De Rosa, M. P. Bruchez and M. Roederer, Nat. Med., 2006, 12, 972–977 CrossRef CAS PubMed.
- B. Barlogie, M. N. Raber, J. Schumann, T. S. Johnson, B. Drewinko, D. E. Swartzendruber, W. Gohde, M. Andreeff and E. J. Freireich, Cancer Res., 1983, 43, 3982–3997 CAS.
- J. R. S. Newman, S. Ghaemmaghami, J. Ihmels, D. K. Breslow, M. Noble, J. L. DeRisi and J. S. Weissman, Nature, 2006, 441, 840–846 CrossRef CAS PubMed.
- S. D. Gilman and A. G. Ewing, Anal. Chem., 1995, 67, 58–64 CrossRef CAS PubMed.
- P. Nemes, A. M. Knolhoff, S. S. Rubakhin and J. V. Sweedler, Anal. Chem., 2011, 83, 6810–6817 CrossRef CAS PubMed.
- R. M. Onjiko, E. P. Portero, S. A. Moody and P. Nemes, Anal. Chem., 2017, 89, 7069–7076 CrossRef CAS PubMed.
- S. Tay, J. J. Hughey, T. K. Lee, T. Lipniacki, S. R. Quake and M. W. Covert, Nature, 2010, 466, 267–271 CrossRef CAS PubMed.
- J.-B. Zhao, F. Zhang and Y.-L. Guo, Anal. Chem., 2019, 91, 2752–2758 CrossRef CAS PubMed.
- S. J. Standke, D. H. Colby, R. C. Bensen, A. W. G. Burgett and Z. Yang, Anal. Chem., 2019, 91, 1738–1742 CrossRef CAS PubMed.
- Y. Wang, E. MacLachlan, B. K. Nguyen, G. Fu, C. Peng and J. I. L. Chen, Analyst, 2015, 140, 1140–1148 RSC.
- N. H. Le, B. K. Nguyen, G. Ye, C. Peng and J. I. L. Chen, ACS Sens., 2017, 2, 1578–1583 CrossRef CAS PubMed.
- J. I. L. Chen, H. Durkee, B. Traxler and D. S. Ginger, Small, 2011, 7, 1993–1997 CrossRef CAS PubMed.
- J. I. L. Chen, Y. Chen and D. S. Ginger, J. Am. Chem. Soc., 2010, 132, 9600–9601 CrossRef CAS PubMed.
- L. Guo, Y. Xu, A. R. Ferhan, G. Chen and D.-H. Kim, J. Am. Chem. Soc., 2013, 135, 12338–12345 CrossRef CAS PubMed.
- K. Li, W. Qin, F. Li, X. Zhao, B. Jiang, K. Wang, S. Deng, C. Fan and D. Li, Angew. Chem., Int. Ed., 2013, 52, 11542–11545 CrossRef CAS PubMed.
- S. S. Acimovic, M. P. Kreuzer, M. U. Gonzalez and R. Quidant, ACS Nano, 2009, 3, 1231–1237 CrossRef CAS PubMed.
- C. Sönnichsen, B. M. Reinhard, J. Liphardt and A. P. Alivisatos, Nat. Biotechnol., 2005, 23, 741–745 CrossRef PubMed.
- R. P. Xiao, D. F. Wang, Z. Y. Lin, B. Qiu, M. H. Liu, L. H. Guo and G. N. Chen, Anal. Methods, 2015, 7, 842–845 RSC.
- C. A. Mirkin, R. L. Letsinger, R. C. Mucic and J. J. Storhoff, Nature, 1996, 382, 607–609 CrossRef CAS PubMed.
- J. J. Storhoff, R. Elghanian, R. C. Mucic, C. A. Mirkin and R. L. Letsinger, J. Am. Chem. Soc., 1998, 120, 1959–1964 CrossRef CAS.
- Y. W. Jun, S. Sheikholeslami, D. R. Hostetter, C. Tajon, C. S. Craik and A. P. Alivisatos, Proc. Natl. Acad. Sci. U. S. A., 2009, 106, 17735–17740 CrossRef CAS PubMed.
- J. R. Waldeisen, T. Wang, B. M. Ross and L. P. Lee, ACS Nano, 2011, 5, 5383–5389 CrossRef CAS PubMed.
- T. Zhang, H. Li, S. Hou, Y. Dong, G. Pang and Y. Zhang, ACS Appl. Mater. Interfaces, 2015, 7, 27131–27139 CrossRef CAS PubMed.
- X. Zhao, L. Xu, M. Sun, W. Ma, X. Wu, H. Kuang, L. Wang and C. Xu, Small, 2016, 12, 4662–4668 CrossRef CAS PubMed.
- Y. Zhou, F. Tozzi, J. Chen, F. Fan, L. Xia, J. Wang, G. Gao, A. Zhang, X. Xia, H. Brasher, W. Widger, L. M. Ellis and Z. Weihua, Cancer Res., 2012, 72, 304–314 CrossRef CAS PubMed.
- M. V. Liberti and J. W. Locasale, Trends Biochem. Sci., 2016, 41, 211–218 CrossRef CAS PubMed.
- W. H. Koppenol, P. L. Bounds and C. V. Dang, Nat. Rev. Cancer, 2011, 11, 325–337 CrossRef CAS PubMed.
- R. J. Gillies, I. Robey and R. A. Gatenby, J. Nucl. Med., 2008, 49, 24S–42S CrossRef CAS PubMed.
- K. Furuya, M. Sokabe and R. Grygorczyk, Methods, 2014, 66, 330–344 CrossRef CAS PubMed.
- J.-H. Kim, J.-H. Ahn, P. W. Barone, H. Jin, J. Zhang, D. A. Heller and M. S. Strano, Angew. Chem., Int. Ed., 2010, 49, 1456–1459 CrossRef CAS PubMed.
- H. Imamura, K. P. Huynh Nhat, H. Togawa, K. Saito, R. Iino, Y. Kato-Yamada, T. Nagai and H. Noji, Proc. Natl. Acad. Sci. U. S. A., 2009, 106, 15651–15656 CrossRef CAS PubMed.
- H. Yaginuma, S. Kawai, K. V. Tabata, K. Tomiyama, A. Kakizuka, T. Komatsuzaki, H. Noji and H. Imamura, Sci. Rep., 2014, 4, 1–7 Search PubMed.
- R. Nutiu and Y. F. Li, J. Am. Chem. Soc., 2003, 125, 4771–4778 CrossRef CAS PubMed.
- P. S. Lau and Y. Li, Adv. Biochem. Eng./Biotechnol., 2013, 140, 69–92 CrossRef PubMed.
- R. Nutiu and Y. Li, Chem. – Eur. J., 2004, 10, 1868–1876 CrossRef CAS PubMed.
- D. H. Yu, J. K. Wolf, M. Scanlon, J. E. Price and M. C. Hung, Cancer Res., 1993, 53, 891–898 CAS.
- R. N. Buick, R. Pullano and J. M. Trent, Cancer Res., 1985, 45, 3668–3676 CAS.
- T. W. Traut, Mol. Cell. Biochem., 1994, 140, 1–22 CrossRef CAS PubMed.
- D. Zheng, D. S. Seferos, D. A. Giljohann, P. C. Patel and C. A. Mirkin, Nano Lett., 2009, 9, 3258–3261 CrossRef CAS PubMed.
- V. C. Özalp, L. J. Nielsen and L. F. Olsen, ChemBioChem, 2010, 11, 2538–2541 CrossRef PubMed.
- S. Ganapathy-Kanniappan, M. Vali, R. Kunjithapatham, M. Buijs, L. H. Syed, P. P. Rao, S. Ota, B. K. Kwak, R. Loffroy and J. F. Geschwind, Curr. Pharm. Biotechnol., 2010, 11, 510–517 CAS.
- Y. N. Xia, J. Tien, D. Qin and G. M. Whitesides, Langmuir, 1996, 12, 4033–4038 CrossRef CAS.
- S. J. Hurst, A. K. R. Lytton-Jean and C. A. Mirkin, Anal. Chem., 2006, 78, 8313–8318 CrossRef CAS PubMed.
- S. Bernaudo, M. Salem, X. Qi, W. Zhou, C. Zhang, W. Yang, D. Rosman, Z. Deng, G. Ye, B. Yang, B. Vanderhyden, Z. Wu and C. Peng, Oncogene, 2016, 35, 4816–4827 CrossRef CAS PubMed.
Footnote |
| † Electronic supplementary information (ESI) available. See DOI: 10.1039/c9an02262g |
| This journal is © The Royal Society of Chemistry 2020 |


