 Open Access Article
MnS nanocomposites based on doped graphene: simple synthesis by a wet chemical route and improved electrochemical properties as an electrode material for supercapacitors†
Rajendran
Ramachandran
ab,
Murugan
Saranya
bc,
Andrews Nirmala
Grace
b and
Fei
Wang
*a
aDepartment of Electronic and Electrical Engineering, Southern University of Science and Technology, Shenzhen 518055, China. E-mail: wangf@sustc.edu.cn
bCentre for Nanotechnology Research, VIT University, Vellore-632 014, Tamil Nadu, India
cPlatinum Retail Ltd, Chorleywood Road, Rickmansworth, UK
First published on 12th January 2017
Abstract
Nanocomposites of MnS anchored on graphene, nitrogen-doped graphene and boron-doped graphene have been prepared by a simple wet chemical process. The effect of graphene concentration in MnS and the effect of doping type in the composites are studied through the use of various characterization techniques. An electrochemical performance better than that of pure MnS has been observed in the graphene based composites. The doping of N and B atoms in graphene can further enhance the electrochemical activities of the nanocomposites. The present study demonstrates that MnS with doped graphene has large electrode/electrolyte interfaces, which offers more active sites and ensures a high charge storage capacity of the composite. A maximum specific capacitance of 696.6 and 353.8 F g−1 are measured for MnS/BG-9 and MnS/NG-9 composite, respectively, at a 5 mV s−1 scan rate, whereas the pure graphene composite (MnS/G-9) exhibits only a maximum specific capacitance of 156 F g−1.
Introduction
Clean and renewable energy resources are critically needed to deal with environmental pollution and the exhaustion of fossil fuels.1,2 Electrochemical energy storage and energy conversion such as supercapacitors, lithium ion batteries, fuel cells and solar cells are considered as potential alternatives for future renewable energy sources thanks to their negligible impacts on the environment.3,4 The development of these energy systems with high energy and power outputs, and long lifetimes is desirable and important for applications in many important areas such as electric vehicles and industrial equipment, etc.5 Among the various energy storage systems, supercapacitors have attracted a lot of attention due to their high power density, large capacitance, low cost and long cycle life compared to traditional batteries and conventional capacitors.6,7 Supercapacitors exhibit their superior advantages by releasing and storing energy through nanoscopic separation of charges at the electrode/electrolyte interfaces.8 Based on the fundamental mechanism of capacitance, the supercapacitors can be categorized as two major classes, electric double layer capacitor (EDLC) and pseudocapacitor.9 The capacitance of EDLC comes from non-faradic charge accumulation at the electrode/electrolyte interface, whereas the pseudocapacitance comes from faradic redox reactions.10 Carbon based materials such as carbon nanotube, carbon nanospheres and recently graphene have been used as electrodes for EDLCs due to their good electrical conductivity, and long cyclic life. But, there is one drawback for EDLCs that they typically deliver specific capacitance lower than 200 F g−1.11 Pseudocapacitors rely on faradic redox reactions, which can deliver much higher specific capacitance than EDLCs. To further enhance the specific capacitance of the electrochemical capacitors, pseudocapacitors can be coupled with EDLCs depending on the nature of the electrodes.12 There are various kinds of materials used for supercapacitor electrodes like metal oxides, polymers and carbon based materials.13 Recently, graphene has also been used widely in composites with metal oxide and polymers to improve the electrochemical activities of these materials, because the ultrathin graphene sheets can not only serve as high conductive matrix but also avoid the aggregation of nanoparticles during electrochemical process.14 Hetero atom doping is an effective way to enhance the intrinsic properties of graphene. Especially, graphene material with nitrogen or boron doping (NG and BG) has become a research spotlight because its atomic size and strong valence bonds, which are similar to those characteristic of carbon atoms.15 The doping of N and B atoms can effectively change the electronic characterization, electron mobility and an increase in the number of active sites for catalytic reactions than the pristine form. Thus, the doping of hetero atoms in graphene improves the electrical conductivity and electrochemical performance.16Similar to metal oxides/graphene and polymers/graphene composites, recently metal sulphide based graphene nanostructures have also attracted much attention as supercapacitor electrodes materials and have revealed wonderful pseudocapacitive performance. Researchers have reported the supercapacitor electrodes with G/CoS,17 G/Co9S8,18 G/NiS,19 G/SnS20 and G/ZnS.21 In spite of the good electrochemical performance, the low potential window of these sulfides makes them less feasible for practical applications. Likewise, the other metal sulfides such as MoS2,22,23 Ni3S2,24,25 TiS2,26 CuS27 and VS2 (ref. 28) electrode materials have been reported for supercapacitors. However, these electrodes could be operated at high potential windows; the poor cyclic performance and the lesser specific capacitance are the main drawback for practical applications. Manganese sulfide (MnS) is another potential sulfide candidate for energy storage application such as Li ion batteries and supercapacitors.29 Only a few work has been reported yet on the MnS nanoparticles for supercapacitor applications. MnS can deliver poor electrochemical activities due to the aggregation of MnS nanoparticles during redox reactions which makes a big challenge for it to be applicable for supercapacitor electrodes. Fortunately, the matrix like graphene can be added in MnS to avoid the aggregation of MnS nanoparticles. Very recently, Tang et al., have reported the synthesis of graphene oxide anchored MnS nanocrystals and the composite exhibited specific capacitance of 390.8 F g−1 at current density 0.25 A g−1.30
In this work, we have adopted a simple wet chemical process for preparation of γ-MnS/G nanocomposites with different weight percent of graphene contents. As prepared samples were well characterized through XRD, XPS and HRTEM analysis. Systematic investigation has been done with electrochemical performance. Based on the electrochemical measurements, graphene concentration in MnS (MnS/G-9) was optimized to 9 wt% for supercapacitor electrode applications. A maximum specific capacitance of 156 F g−1 was achieved at 5 mV scan rate. The effect of doping in composites was studied with the same amount of NG and BG in MnS (MnS/NG-9 and MnS/BG-9). Maximum specific capacitances of 353.8 F g−1 and 696.6 F g−1 were obtained with MnS/NG-9 and MnS/BG-9 nanocomposites, respectively. It has also been noticed that the electrochemical activities of MnS is better improved with doped graphene than that with undoped graphene, which is mainly due to the higher electrical conductivity of nitrogen and boron doped graphene material.
Experiment method
Materials
Analytical Reagent (AR) grade of graphite powder, sodium nitrate (NaNO3), potassium permanganate (KMnO4), sulfuric acid (H2SO4, 99%), sodium borohydride (NaBH4), hydrogen peroxide (H2O2, 30%), sodium hydroxide (NaOH), ammonia solution (NH3·H2O, 25%), borane–THF adduct, potassium hydroxide (KOH), manganese acetate tetrahydrate (C4H6MnO4·4H2O), thioacetamide (C2H5NS), triethenolamine (TEA, C6H15NO3), ammonium chloride (NH4Cl), were purchased from Sigma-Aldrich. All the solutions were prepared using Milli-Q water (pH 7.2). Carbon paper TGP-H from TORAY was used as a base matrix of the electrode. The typical size of the electrode was 3 cm2.Preparation of nitrogen doped graphene (NG)
Graphene oxide and graphene were prepared according to our previous reports, which are given in the ESI.†31,32 Nitrogen-doped graphene was prepared via the hydrothermal route.33 100 mg of graphene oxide was dispersed in 200 ml of water and sonicated for 2 hours. Then, 4 ml of ammonia solution was added to the GO suspension to achieve a pH of 11. The mixed solution was then transferred into a Teflon-lined stainless steel autoclave and heated at 150 °C for 24 hours. After cooling the bath solution to room temperature, it was centrifuged at 7000 rpm, washed with distilled water several times and dried at 60 °C for 12 hours to obtain the N-doped graphene.Preparation of boron doped graphene (BG)
Boron doped graphene was prepared according to the literature.34 500 mg of graphene oxide was dispersed in 250 ml of water in a round bottom flask and sonicated for one hour. Then, a solution of borane–THF adduct (1.5 ml) was added to the above solution under stirring. The flask was then immersed in an oil bath and the brown solution of GO was stirred under reflux. The stirring was continued for 4 days. Then, the resulting black solid product (BG) was filtered and dried at room temperature.Preparation of manganese sulfide/graphene (γ-MnS/G) nanocomposites
Initially, 10 ml manganese acetate (1 M) solution was mixed with 1 ml of TEA solution (7.4 M) in a beaker and stirred for 5 minutes. After, 10 ml of ammonium chloride (1.4 M) was added under magnetically stirring. The stirring was continued for 10 minutes. Then 0.2 ml of hydrazine hydrate and 3 wt% of graphene were added into the above solution and stirring was continued for 10 minutes. Finally, 10 ml of thioacetamide (1 M) was added and stirred for 5 minutes, immediately the solution turned into pink colour. After 1 hour, the pink particles settled at the bottom of the beaker, which was filtered and washed with ethanol. The washed particles were dried at 60 °C for 3 hours. The obtained product was named as MnS/G-3 (weight ratio of MnS and graphene is 300 mg![[thin space (1/6-em)]](https://www.rsc.org/images/entities/char_2009.gif) :
:![[thin space (1/6-em)]](https://www.rsc.org/images/entities/char_2009.gif) 9 mg). Similar way, the other nanocomposites, MnS/G-6, MnS/G-9 and MnS/G-12 were prepared at a concentration of graphene with 6, 9 and 12 wt%, respectively. Pure MnS nanoparticles were also prepared without graphene for comparison.
9 mg). Similar way, the other nanocomposites, MnS/G-6, MnS/G-9 and MnS/G-12 were prepared at a concentration of graphene with 6, 9 and 12 wt%, respectively. Pure MnS nanoparticles were also prepared without graphene for comparison.
Preparation of γ-MnS/NG and MnS/BG nanocomposites
Manganese sulfide/nitrogen doped graphene and manganese sulfide/boron doped graphene nanocomposites were prepared with 9 wt% of N-doped graphene and B-doped graphene concentration with the method above. Then, the powders were named as MnS/NG-9 and MnS/BG-9.Materials characterization
X-ray diffraction system (BRUKER, D8 Advance, Germany) was used with Cu-Kα radiation (λ = 1.540 Å). Step scanning was done with 2θ intervals from 6° to 80°. X-ray photoelectron spectroscopy (XPS) measurements were carried out by using a Thermo Scientific Multilab 2000 spectrometer with Mg source. The surface morphologies of the samples were characterized by using high resolution transmittance electron microscope (JEOL 2011) and EDX mappings of the samples were obtained with FESEM by using a Hitachi S-4800.Electrochemical measurements
All the electrochemical measurements were carried out in an electrochemical analyzer (CHI 600C work station, version 5.01) using a three electrode system in 6 M KOH electrolyte solution under ambient conditions. The potentials were measured with respect to Ag/AgCl (sat. KCl) as the reference. Carbon paper (purchased from Cabot, USA) and Pt wire were used as the working and counter electrode, respectively. The cyclic voltammetry was performed at various scan rates in the potential range from −0.2 to 0.3 V. The working electrode was prepared as follows: a known amount of active material was dispersed in 5 wt% of Nafion and the mixture was coated with a carbon paper (3 cm × 1 cm × 0.1 cm). The total surface area coated with active material was 0.5 cm2. The mass of the active material of electrode was 2 mg cm−2. Then, the electrode was dried for 3 hours at room temperature.Results and discussion
Formation mechanism
The Scheme 1 represents a schematic diagram of MnS/G-9 nanocomposite. The formation mechanism of γ-MnS is described as follows. After addition of TEA into Mn2+ solution, Mn2+ was firstly combined with TEA to form [Mn(TEA)]2+ ions. [Mn(TEA)]2+ would react with S2− ions released from thioacetamide to form MnS nuclei. The obtained MnS nanoparticles were attached on the surface of graphene sheets through oxygen-containing functional groups, such as hydroxyl, epoxide and carbonyl.35 A probable reaction mechanism can be explained as follows:| Mn2+ + TEA → [Mn(TEA)]2+ |
| CH3CSNH2 + 2OH− → S2− + CH3CN + 2H2O |
| [Mn(TEA)]2+ + S2− → (MnS↓) + TEA |
Microstructural characterization
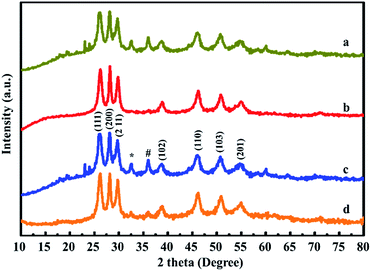
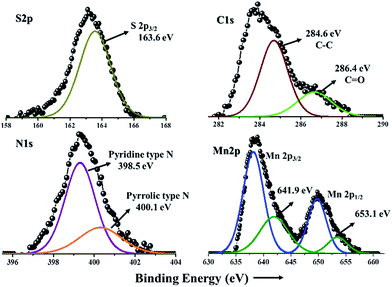
XRD pattern of pure MnS, MnS/G-9, MnS/NG-9 and MnS/BG-9 nanocomposites are shown in Fig. 1. From all the nanocomposites, the characteristic diffraction peaks of MnS was observed in 26.2, 28.1, 29.8, 38.8, 46.2, 50.8, 54.9 and 58.4°, corresponding to (111), (200), (211), (102), (110), (103), (112) and (201) of γ-MnS with good agreement with JCPDS card no. 89-4089. Apart from γ-MnS diffraction peaks, two other minor diffraction peaks at 32.4° and 36.1° were also observed in Fig. 1(a) and (c), which corresponds to Mn3O4 phase formation (indicated as * and #) due to the complex stoichiometric nature of chalcogenide materials. Though, these Mn3O4 phases are mixed in γ-MnS, it is not affecting the crystallinity of γ-MnS. Interestingly, there are no diffraction peaks of carbon atoms observed in these composites. This phenomenon could be mainly due to the good crystallinity of MnS nanoparticles on graphene and doped graphene sheets, which has weakened the diffraction of carbon atoms.21 Therefore, when the MnS nanoparticles cover the graphene sheets, they give strong diffraction peaks.XPS spectrum of MnS/NG-9 nanocomposite is shown in Fig. 2. The bonding configuration of nitrogen atoms in MnS/NG-9 is characterized by the deconvoluted N1s spectrum. The N1s spectrum of MnS/NG-9 nanocomposite could be fitted with two peaks at a binding energy of 398.5 and 400.1 eV corresponding to pyridinic nitrogen and pyrrolic nitrogen atoms in graphene.36 The strong intensity peaks suggests a good level of nitrogen doping in graphene. The presence of pyrrolic and pyridinic nitrogen in graphene can increase the electrochemical activity of graphene in electrochemical process. Our analysis shows that the atomic percentage of doped nitrogen is about 4.3% in MnS/NG-9 composite. From deconvoluted spectra of C1s, a main peak is observed at 284.6 eV due to graphitic sp2 carbon atoms and minor peak at 286.4 eV due to the bond of C![[double bond, length as m-dash]](https://www.rsc.org/images/entities/char_e001.gif) O.37 The peak at 163.6 eV in S2p spectrum, corresponds to the S2p3/2 characteristic peak of sulfur in MnS.38 Mn2p3/2 and Mn2p1/2 characteristic peaks are shown at binding energy of 641.9 and 653.1 eV in the deconvoluted spectrum of Mn2p.39
O.37 The peak at 163.6 eV in S2p spectrum, corresponds to the S2p3/2 characteristic peak of sulfur in MnS.38 Mn2p3/2 and Mn2p1/2 characteristic peaks are shown at binding energy of 641.9 and 653.1 eV in the deconvoluted spectrum of Mn2p.39
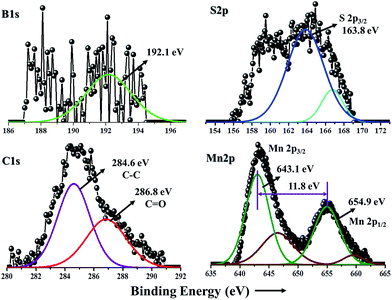
In Fig. 3, the deconvoluted B1s spectrum shows a peak at a binding energy of 192.1 eV, which is the characteristic peak of boron in MnS/BG-9 composite.40 Result reveals that a high content of boron (atomic percentage of 3.8%) has been incorporated into graphene networks. Two strong peaks at 643.1 and 654.9 eV can be clearly seen in the deconvoluted spectrum of Mn2p which corresponds to the binding energy of Mn2p3/2 and Mn2p1/2.41 In Mn2p region, the splitting width between 2p3/2 and 2p1/2 was observed to be 11.8 eV, which is in good agreement with the literature value.39 The chemical states of the MnS/G-9 nanocomposites were also identified by XPS and its core level spectrum of S2p, C1s and Mn2p are given in Fig. S1.†
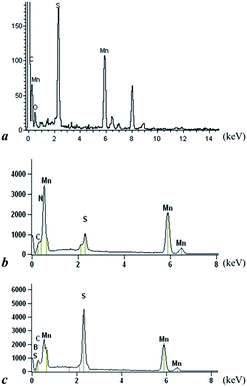
The morphology of MnS, MnS/G-9, MnS/NG-9 and MnS/BG-9 nanocomposites were characterized by HRTEM analysis. From Fig. 4(a1–a3), it can be seen that the MnS nanoparticles were aggregated and self-assembled in sphere like structure. The selected area electron diffraction (SAED) pattern of MnS nanoparticles clearly shows rings structure, substantiating the polycrystallinity of MnS. The HRTEM images of MnS/G-9, MnS/NG-9 and MnS/BG-9 nanocomposites in Fig. 4(b1–b3, c1–c3 and d1–d3) identify that γ-MnS nanoparticles are uniformly distributed and deposited on the surface of wrinkle graphene sheets. The MnS nano particles can also act as a spacer and avoid the restacking of graphene sheets in the composites. Furthermore, the graphene sheets can prevent MnS nanoparticles from agglomeration and enable good dispersion of these nanoparticles over the surface. It is observed that the MnS nanoparticles are still strongly anchored on the surface of graphene and nitrogen, boron doped graphene sheets even after a long period of sonication, suggesting the strong interaction between MnS nanoparticles and graphene sheets. The depositing and strong anchoring of MnS nanoparticles on the surface of graphene sheets enable fast electron transport through the graphene sheets to MnS nanoparticles, which improves the electrochemical performance of nanocomposites comparing to the pure MnS.42 It is also seen that more number of MnS nanoparticles have been attached to MnS/NG-9 and MnS/BG-9 nanocomposites comparing to the MnS/G-9 sample. This might be due to the doping of nitrogen and boron introduces more defects in graphene sheet. Therefore, more MnS nanoparticles are strongly attached in covalent bond with carbon structure. From the inset pictures of b2, c2 and d2, the SAED pattern of nanocomposites clearly shows rings, suggesting the polycrystal nature of MnS in the composites. EDS spectrum shows, the presence of C, N, B, Mn and S components in nanocomposites (Fig. 5).
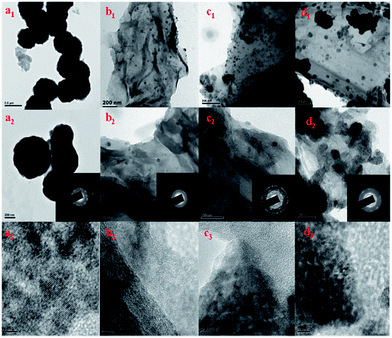 | ||
| Fig. 4 HRTEM images of (a1–a3) MnS nanoparticles (b1–b3) MnS/G-9 (c1–c3) MnS/NG-9 and (d1–d3) MnS/BG-9 nanocomposites. Inset pictures shows SAED pattern of samples (a2–d2). | ||
Electrochemical behavior and specific capacitance measurements
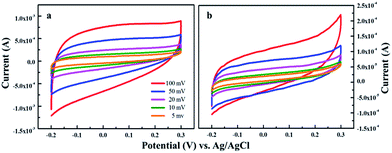
The prepared composite materials for supercapacitor are characterized by cyclic voltammetry (CV), galvanostatic charge–discharge and electrochemical impedance measurements in 6 M KOH aqueous solution. The CV curves of pure MnS and MnS/G-9 nanocomposite are shown in Fig. 6 and near rectangular shape and symmetric current–potential characteristic behavior are observed, suggesting an ideal capacitive behavior with a low contact resistance.43 This indicates that the prepared electrodes exhibit high reversibility between −0.2 V to 0.3 V. It has shown that the cyclic voltammetry curve of pure MnS has slightly different shape than that of MnS/G-9, due to the specific capacitance contribution only from pseudocapacitance. Whereas, the overall specific capacitance of MnS/G nanocomposites is due to the combined contributions from EDLC and pseudocapacitance. The possible faradic process can be explained as follows,35| MnS + OH− ↔ MnSOH + e− |
| MnSOH + OH− ↔ MnSO + H2O + e− |
The electrochemical capacitive behavior depends on the rate of charge transfer. Pure MnS cannot allow a high rate of charge transfer between the electrode and electrolyte interfaces. This is mainly because that the aggregated particles which may not be accessible by solvated ions, could reduce the effective surface area of the interfaces. The electrical double layer capacitance of the composites is influenced by the oxygen groups, which is present in the edges of graphene. These oxygen groups enhance the accessibility to hydrophilic surface in aqueous electrolytes. The pseudocapacitance is due to the interactions between oxygen functional groups in graphene sheets and metal ions in the electrolyte.44 It could be seen that both the cathodic and anodic current response of pure MnS is almost above the zero current level, suggesting poor electrochemical performance of the synthesized MnS nanoparticles.18 Graphene addition into MnS can improve the dispersion of MnS on the surface of graphene therefore providing more paths for ion diffusion. Fig. S2† shows the CV graph comparison of bare carbon paper, pure MnS and MnS/G-9 nanocomposite. The area of CV curve is larger for the MnS/G-9 nanocomposite than pure MnS and bare carbon, indicating better capacitive behaviour of MnS/G-9.
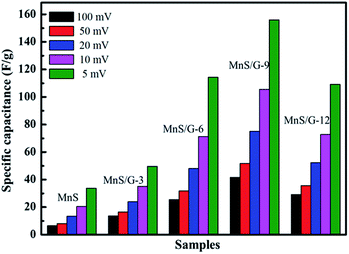
CV measurements were conducted at various scan rates for MnS samples with different weight percent of graphene to optimize the suitable graphene concentration in MnS. The specific capacitance and energy density of electrode materials were calculated from the CV curves according to the following formula,21,45
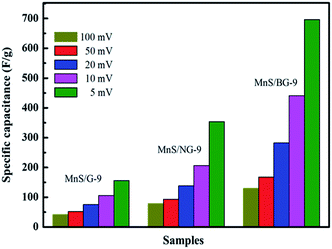
Among the various composites, 9 wt% of graphene loaded MnS (MnS/G-9) has shown the highest capacitance. Thus, MnS/G-9 composite can provide better electrochemical activities towards the energy storage devices. The effect of nitrogen and boron doping in graphene was observed through electrochemical measurements. As can be seen from Fig. 8, the MnS/NG-9 and MnS/BG-9 nanocomposites have shown better electrochemical performance and provided higher specific capacitance than MnS/G-9 nanocomposite.
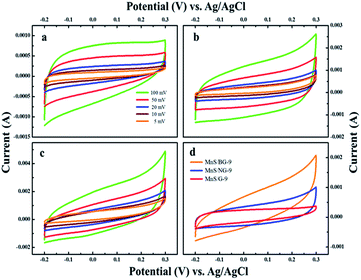 | ||
| Fig. 8 Cyclic voltammetry response of (a) MnS/G-9 (b) MnS/NG-9 and (c) MnS/BG-9 nanocomposites. (d) Comparison of the CV curve of MnS/G-9, MnS/NG-9 and MnS/BG-9 nanocomposites. | ||
The area and current level of CV curve for MnS/BG-9 and MnS/NG-9 nanocomposites are larger than those of MnS/G-9 composite, which suggests that the presence of N and B enhances the electrochemical activity and hence, more capacitive nature could be achieved.47
CV measurements were done with different scan rates and the corresponding specific capacitances of electrodes are shown in Fig. 9. From Fig. 9, maximum specific capacitances of 696.6 and 353.8 F g−1 were observed for MnS/BG-9 and MnS/NG-9 composite, respectively, at 5 mV s−1 scan rate, whereas pure graphene composite (MnS/G-9) exhibited a maximum specific capacitance of 156 F g−1. The presence of N and B in graphene allows a higher rate of charge transfer between the electrode and electrolyte interfaces and hence the effective surface area will be increased.48
The insertion of N and B atoms into graphene layers can change the values of HOMO (Highest Occupied Molecular Orbital) and LUMO (Lowest Unoccupied Molecular Orbital) in order to reduce the band gap, thus increasing electron mobility at the carbon atom/electrolyte interface in comparison to pure carbon atom.42 The potential in the double layer is shared between the solvent layer and the space charge layer, so the capacitance of the sample is provided by these two aspects. Based on this view, increased mobility of electrons in the sample would result in a larger space charge capacitance. Graphitic and pyridinic N can enhance the wettability of graphene in MnS/NG-9, because of their extensive dipole moments. Further, graphitic N can facilitate electron transfer, thereby improving the capacitive behaviour of lowering the charge-transfer resistance of the electrode.49 Due to the electrochemically active nature of pyridinic and pyrrolic N in an alkaline solution, offer high specific capacitance in MnS/NG-9 composite.50 Given the idea that boron atom has three valence electrons, the deficiency of electrons would be more favourable to attract anions in electrolyte and to enhance the pseudocapacitive nature.51 Also, the incorporated boron and oxygen atoms might improve the affinity of graphene with regard to an alkaline medium, resulting in an increase in the magnitude of the accessible electrode surface area. Thus, boron doped graphene gave maximum specific capacitance than nitrogen doped graphene. A comparison is made with the current material and those reported in literatures, as shown in Table 1. It can be seen that the MnS/BG-9 nanocomposites reported in this paper has good activity and thus could be used for supercapacitor applications.
| Material | Ea | SRb | SCc | Rd |
|---|---|---|---|---|
| a Electrolyte. b Scan rate (mV s−1). c Specific capacitance (F g−1). d Reference. | ||||
| CoS2 | 1 M LiPF6 | 52 | 52 | |
| Ni3S2/MWCNT | 2 M KOH | 5 | 55.8 | 53 |
| CNT/CuS | 2 M KOH | 2 | 112 | 54 |
| CuS | 1 M LiClO4 | 5 | 72.85 | 55 |
| CuS | 3 M KOH | 5 | 276 | 56 |
| SnS/carbon | 0.1 M KOH | 5 | 36.16 | 57 |
| SnS | 0.1 M KOH | — | 21.17 | 58 |
| MoS2/graphene | 1 M Na2SO4 | — | 268 | 59 |
| MoS2/carbon | 3 M KOH | 5 | 210 | 60 |
| Ni3S2 nanorod | 3 M KOH | 10 | 34.9 | 61 |
| VS2 nanosheets | 6 M KOH | — | 155 | 28 |
| MnS/GO | 1 M KOH | 5 | 390.8 | 30 |
| MnS | 6 M KOH | 5 | 33.7 | This work |
| MnS/NG-9 | 6 M KOH | 5 | 156 | This work |
| MnS/NG-9 | 6 M KOH | 5 | 358.8 | This work |
| MnS/BG-9 | 6 M KOH | 5 | 696.6 | This work |
The capacitance retention property of MnS, MnS/G-9, MnS/NG-9 and MnS/BG-9 electrodes were investigated by repeating the CV measurements at 100 mV s−1 scan rate for 1000 cycles. As shown in Fig. 10, the capacitance retention of MnS/BG-9 and MnS/NG-9 composite electrodes exhibited higher retention rate than that of MnS/G-9 electrode (92.7%) and pure MnS electrode (89.3%) even after 1000 cycles, indicating better electrochemical cyclic stability of N and B doped graphene in composite.
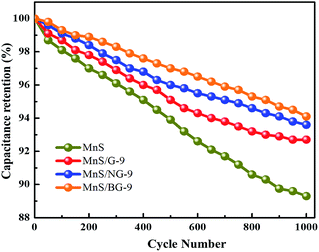 | ||
| Fig. 10 Capacitance retention properties of pure MnS, MnS/G-9, MnS/NG-9 and MnS/BG-9 nanocomposites. | ||
Fig. 11 shows the charge–discharge characteristic behavior of the fabricated electrodes. The charging–discharging time of pure MnS electrode is almost identical and symmetric, implying a high reversibility of electrode (Fig. S3†). A small deviation in symmetric charge–discharge behavior was observed in MnS/G-9, MnS/NG-9 and MnS/BG-9 nanocomposite electrodes, which suggests the dual behavior via electrical double layer and the pseudocapacitance nature of the electrodes.62 The IR drop is attributed to the internal resistance of the electrodes associated with the resistance of ion migration and electrical connection resistance of electrodes. As seen from the figure, the IR drop of MnS/BG-9 electrode is lesser than that of the other composite electrodes and pure MnS electrode. A lower internal resistance of the MnS/BG-9 composite electrode indicates higher pseudocapacitance behavior along with the double layer capacitance and thus, less energy will be wasted during the charge–discharge process.18 The charge/discharge time of MnS/BG-9 nanocomposite electrode was significantly increased compared to other electrodes, suggesting that the presence boron in graphene has enhanced the charge capacity of MnS nanoparticles.
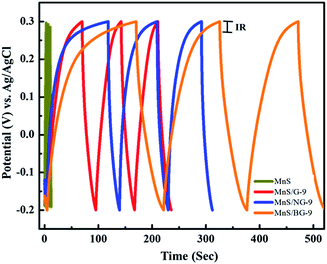 | ||
| Fig. 11 Galvanostatic charge/discharge behavior of MnS, MnS/G-9, MnS/NG-9 and MnS/BG-9 nanocomposite at a current density 0.5 A g−1. | ||
Electrochemical Impedance Spectroscopy (EIS) analysis was used to investigate the fundamental behaviour of the electrode materials for supercapacitors, such as the charge transport phenomenon at the electrode–electrolyte interface. EIS was measured with an AC perturbation of 0.01 V in the frequency range from 0.01 Hz to 105 Hz at an open circuit potential. Nyquist plots of pure MnS, MnS/G-9, MnS/NG-9 and MnS/BG-9 electrodes are shown in Fig. 12. A semicircle region could not be observed at high frequency for the electrodes, probably due to the low faradic charge-transfer resistances.63 The straight vertical 45° line shows the pure capacitive nature of MnS and composite electrodes. This straight line in the low frequency range is related to the diffusion resistance of the electrolyte into the interior of the electrode and ion diffusion into the electrode. The ionic conductivity of the electrolyte system is reflected from the solution resistance (Rs), which is calculated from the intersection of curve at real axis for high frequency region. The inset in each figure shows the fitting circuit of high frequency region. In the fitting circuits, Rs and Rct are the solution and charge transfer resistance, respectively. Cdl is the double layer capacitance, Cp is the pseudocapacitance and W is the Warburg diffusion element. The smaller solution resistance of MnS/BG-9 electrode (1.73 Ω) than other electrodes suggests a faster electron transfer process through the MnS/BG-9 electrode. This is because that B atom in graphene introduces more active sites to access the electrolyte ions in electrode/electrolyte interfaces. Obviously, the MnS/BG-9 electrode is more suitable for being used as an electrode material for supercapacitors which is due to the high electrical conductivity of electrode. The improved electrochemical performance of MnS/BG-9 nanocomposite can be attributed to the functionalization effect of B doping, which donates the electron density to aromatic rings of graphene sheets and increased their conductivity. These results are in good agreement with the capacitance values calculated from the CV curves and the charge/discharge curves.
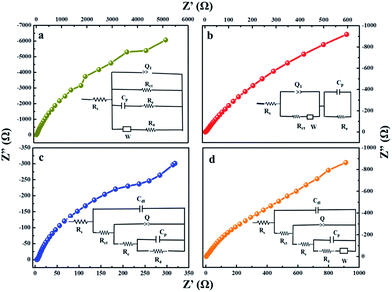 | ||
| Fig. 12 Nyquist plots of (a) pure MnS (b) MnS/G-9 (c) MnS/NG-9 and (d) MnS/BG-9 nanocomposite from the frequency range from 0.01 Hz to 105 Hz (inset shows the fitted equivalent circuits). | ||
Bode phase angle plots are shown in Fig. 13. The phase angle of all the electrodes is observed to be close to −45° at low frequency, which indicates the pure capacitor behavior of electrodes. The amplitude of the total impedance versus frequency plots shows three slopes at different frequency regions. At lower frequency region (1–0.01 Hz), the slope value of the electrodes is high, which is probably due to the resistive component of the interfaces and at mid-frequency range (100–1 Hz), the slope values of electrodes shows both capacitive and resistive component of the interface. At high frequency region (105–100 Hz), the electrodes highlight pure capacitive components of the electrode interfaces. It could be seen that the slope of MnS/BG-9 nanocomposite electrode at higher frequency is smaller (∼0.021) than other electrodes, indicating the more capacitive nature.
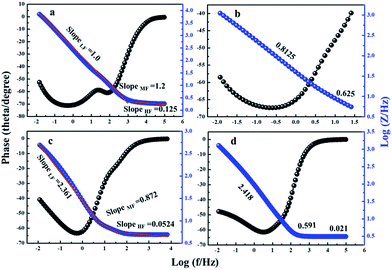 | ||
| Fig. 13 Bode plots of phase angle and Bode plots of total impedance verses frequency of (a) pure MnS (b) MnS/G-9 (c) MnS/NG-9 and (d) MnS/BG-9 nanocomposites. | ||
Conclusions
A simple wet chemical process was adopted for synthesis of MnS/G, MnS/NG and MnS/BG nanocomposites. As prepared samples were analyzed through XRD and XPS studies. XRD analyze showed the cubic nature of γ-MnS nanoparticles in MnS/G composites. XPS characterization revealed that the nitrogen and boron atoms were well anchored in graphene and enhanced the electrochemical properties. Aggregation of MnS nanoparticles was observed in pure MnS, whereas the isolated MnS particles were anchored on graphene and doped graphene sheets, which confirmed from HRTEM analyze. Based on the specific capacitance, 9 wt% of graphene concentration was optimized in MnS for electrode materials. The presence of nitrogen and boron doping in graphene enhanced the electrochemical activities of MnS than the undoped graphene. Maximum specific capacitances of 696.6 and 353.8 F g−1 were observed for MnS/BG-9 and MnS/NG-9 composite at 5 mV s−1 scan rate, respectively, whereas pure graphene composite (MnS/G-9) exhibited a maximum specific capacitance of 156 F g−1. The present study demonstrates that the doping of graphene in MnS generates large electrode/electrolyte interfaces, which provides more active sites for excellent electrochemical performance with high charge storage of composite. These results suggest that MnS/BG-9 nanocomposite is a prominent candidate for high performance supercapacitor devices.Acknowledgements
This work is supported by National Natural Science Foundation of China (Project No. 51505209) and Science, Technology and Innovation Commission of Shenzhen Municipality (Projects No. JCYJ20150930160634263, JCYJ20150827165024088, and KQTD2015071710313656). Fei Wang is also supported by Guangdong Natural Science Funds for Distinguished Young Scholar (Project No. 2016A030306042).Notes and references
- L. Dong, Z. Chen, D. Yang and H. Lu, RSC Adv., 2013, 3, 21183–21191 RSC.
- J. Miller and P. Simon, Science, 2008, 321, 651–652 CrossRef CAS.
- L. L. Zhang and X. S. Zhao, Chem. Soc. Rev., 2009, 38, 2520–2531 RSC.
- X. Li and B. Wei, Nano Energy, 2013, 2, 159–173 CrossRef CAS.
- P. Simon and Y. Gogotsi, Nat. Mater., 2008, 7, 845–854 CrossRef CAS.
- J. Zhang, J. Jiang, H. Li and X. S. Zhao, Energy Environ. Sci., 2011, 4, 4009–4015 RSC.
- Z. Zhou and X. F. Wu, J. Power Sources, 2013, 222, 410–416 CrossRef CAS.
- J. Chen, C. Li and G. Shi, J. Phys. Chem. Lett., 2013, 4(8), 1244–1253 CrossRef CAS.
- L. L. Zhang, R. Zhou and X. S. Zhao, J. Mater. Chem., 2010, 20, 5983–5992 RSC.
- J. Li, H. Xie, Y. Li, J. Liu and Z. Li, J. Power Sources, 2011, 196, 10775–10781 CrossRef CAS.
- Q. Ke and J. Wang, Journal of Materiomics, 2016, 2, 37–54 CrossRef.
- A. González, E. Goikole, J. A. Barrena and R. Mysyk, Renewable Sustainable Energy Rev., 2016, 58, 1189–1206 CrossRef.
- Z. Wang, X. Zhang, Y. Li, Z. Liu and Z. Hao, J. Mater. Chem. A, 2013, 1, 6393–6399 RSC.
- X. Dong, X. Wang, J. Wang, H. Song, X. Li, L. Wang, M. B. C. Park, C. M. Li and P. Chen, Carbon, 2012, 50, 4865–4870 CrossRef CAS.
- J. W. Lee, J. M. Ko and J. D. Kim, Electrochim. Acta, 2012, 85, 459–466 CrossRef CAS.
- L. Niua, Z. P. Li, W. Honga, J. Suna, Z. Wang, L. Ma, J. Wang and S. Yang, Electrochim. Acta, 2013, 108, 666–673 CrossRef.
- B. Wang, J. Park, D. Su, C. Wang, H. Ahn and G. Wang, J. Mater. Chem., 2012, 22, 15750–15756 RSC.
- R. Ramachandran, M. Saranya, C. Santhosh, V. Velmurugan, B. P. C. Raghupathy, S. K. Jeong and A. N. Grace, RSC Adv., 2014, 4, 21151–21162 RSC.
- Z. Xing, Q. Chu, X. Ren, J. Tian, A. M. Asiri, K. A. Alamry, A. O. Youbi and X. Sun, Electrochem. Commun., 2013, 23, 9–13 CrossRef.
- H. Chauhan, M. K. Singh, S. A. Hashmi and S. Dek, RSC Adv., 2015, 5, 17228–17235 RSC.
- R. Ramachandran, M. Saranya, P. Kollu, B. P. C. Raghupathy, S. K. Jeong and A. N. Grace, Electrochim. Acta, 2015, 178, 647–657 CrossRef CAS.
- X. Yang, H. Niu, Q. Wang and F. Qu, J. Mater. Chem. A, 2016, 4, 11264–11275 RSC.
- K. Krishnamoorthy, P. Pazhamalai, G. K. Veerasubramani and S. J. Kim, J. Power Sources, 2016, 321, 112–119 CrossRef CAS.
- Z. Zhang, Z. Huang, L. Ren, Y. Shen, X. Qi and J. Zhong, Electrochim. Acta, 2014, 149, 316–323 CrossRef CAS.
- K. Krishanamoorthy, G. K. Veerasubramani, S. Radhakrishnan and S. J. Kim, Chem. Eng. J., 2014, 215, 116–122 CrossRef.
- C. Lin, X. Zhu, J. Feng, C. Wu, S. Hu, J. Peng, Y. Guo, L. Peng, J. Zhao, J. Huang, J. Yang and Y. Xie, J. Am. Chem. Soc., 2013, 135(13), 5144–5151 CrossRef CAS.
- H. Peng, G. Ma, J. Mu, K. Sun and Z. Lei, Mater. Lett., 2014, 122, 25–28 CrossRef CAS.
- T. M. Masikhwa, F. Barzegar, J. K. Dangbegnon, A. Bello, M. J. Madito, D. Momodu and N. Manyala, RSC Adv., 2016, 6, 38990–39000 RSC.
- H. Quan, B. Cheng, D. Chen, X. Su, Y. Xiao and S. Lei, Electrochim. Acta, 2016, 210, 557–566 CrossRef CAS.
- Y. Tang, T. Chen, S. Yu, Y. Qiao, S. Mu, J. Hu and F. Gao, J. Mater. Chem. A, 2015, 3, 12913–12919 RSC.
- R. Ramachandran, S. Felix, G. M. Joshi, B. P. C. Raghupathy, S. K. Jeong and A. N. Grace, Mater. Res. Bull., 2013, 48, 3834–3842 CrossRef CAS.
- R. Ramachandran, M. Saranya, V. Velmurugan, B. P. C. Raghupathy, S. K. Jeong and A. N. Grace, Appl. Energy, 2015, 153, 22–31 CrossRef CAS.
- G. Wang, Y. Fang, Y. Lin, W. Xing and S. Zhuo, Mater. Res. Bull., 2012, 47, 4252–4256 CrossRef CAS.
- J. Han, L. L. Zhang, S. Lee, J. Oh, K. S. Lee, J. R. Potts, J. Ji, X. Zhao, R. S. Ruoff and S. Park, ACS Nano, 2013, 7(1), 19–26 CrossRef CAS.
- X. Li, J. Shen, N. Li and M. Ye, J. Power Sources, 2015, 282, 194–201 CrossRef CAS.
- H. L. Guo, P. Su, X. Kang and S. K. Ning, J. Mater. Chem. A, 2013, 1, 2248–2255 RSC.
- J. Zhang, J. Jiang, H. Li and X. S. Zhao, Energy Environ. Sci., 2011, 4, 4009–4015 RSC.
- J. Pu, F. Cui, S. Chu, T. Wang, E. Sheng and Z. Wang, ACS Sustainable Chem. Eng., 2014, 2(4), 809–815 CrossRef CAS.
- J. W. Lee, A. S. Hall, J. D. Kim and T. E. Mallouk, Chem. Mater., 2012, 24(6), 1158–1164 CrossRef CAS.
- X. Bo, M. Li, C. Han and L. Guo, Electrochim. Acta, 2013, 114, 582–589 CrossRef CAS.
- Y. Wu, S. Liu, H. Wang, X. Wang, X. Zhang and G. Jin, Electrochim. Acta, 2013, 90, 210–218 CrossRef CAS.
- W. Shi, J. Zhu, D. H. Sim, Y. Y. Tay, Z. Lu, X. Zhang, Y. Sharma, M. Srinivasan, H. Zhang, H. H. Hng and Q. Yan, J. Mater. Chem., 2011, 21, 3422–3427 RSC.
- Q. Cheng, J. Tang, J. Ma, H. Zhang, N. Shinya and L. C. Qin, Carbon, 2011, 49, 2917–2925 CrossRef CAS.
- C. T. Hsieh, W. Y. Chen and Y. S. Cheng, Electrochim. Acta, 2010, 55, 5294–5300 CrossRef CAS.
- C. Bora and S. K. Dolu, Polymer, 2012, 53, 923–932 CrossRef CAS.
- J. Zhu and J. He, ACS Appl. Mater. Interfaces, 2012, 4(3), 1770–1776 CrossRef CAS PubMed.
- X. Du, C. Zhou, H. Y. Liu, Y. W. Mai and G. Wang, J. Power Sources, 2013, 241, 460–466 CrossRef CAS.
- K. Fujisawa, R. C. Silva, K. S. Yang, Y. A. Kim, T. Hayashi, M. Endo, M. Terrones and M. S. Dresselhaus, J. Mater. Chem. A, 2014, 2, 9532–9540 RSC.
- V. H. Pham, S. H. Hur, E. J. Kim, B. S. Kim and J. S. Chung, Chem. Commun., 2013, 49, 6665–6667 RSC.
- H. M. Jeong, J. W. Lee, W. H. Shin, Y. J. Choi, H. J. Shin, J. K. Kang and J. W. Choi, Nano Lett., 2011, 11, 2472–2477 CrossRef CAS.
- W. Fan, Y. E. Miao, Y. Huang, W. W. Tjiu and T. Liu, RSC Adv., 2015, 5, 9228–9236 RSC.
- L. Zhang, H. B. Wu and X. W. David Lou, Chem. Commun., 2012, 48, 6912–6914 RSC.
- C. S. Dai, P. Y. Chien, J. Y. Lin, S. W. Chou, W. Kai Wu, P. H. Li, K. Y. Wu and T. W. Lin, ACS Appl. Mater. Interfaces, 2013, 5(22), 12168–12174 CrossRef CAS.
- T. Zhu, B. Xia, L. Zhou and W. W. David Lou, J. Mater. Chem., 2012, 22, 7851–7855 RSC.
- C. J. Raj, B. C. Kim, W. J. Cho, W. G. Lee, Y. Seo and K. H. Yu, J. Alloys Compd., 2014, 586, 191–196 CrossRef.
- W. Xu, Y. Liang, Y. Su, S. Zhu, Z. Cui, X. Yang, A. Inoue, Q. Wei and C. Liang, Electrochim. Acta, 2016, 211, 891–899 CrossRef CAS.
- Y. Li, H. Xie and J. Tu, Mater. Lett., 2009, 63, 1785–1787 CrossRef CAS.
- M. Jayalakshmi, M. M. Rao and B. M. Choudary, Electrochem. Commun., 2004, 6, 1119–1122 CrossRef CAS.
- M. Yang, J. M. Jeong, Y. S. Huh and B. G. Choi, Compos. Sci. Technol., 2015, 121, 123–128 CrossRef CAS.
- B. Hu, X. Qin, A. M. Asiri, K. A. Alamry, A. O. A. Youbi and X. Sun, Electrochim. Acta, 2013, 100, 24–28 CrossRef CAS.
- J. Wen, S. Li, K. Zhou, Z. Song, B. Li, Z. Chen, T. Chen, Y. Guo and G. Fang, J. Power Sources, 2016, 324, 325–333 CrossRef CAS.
- G. S. Gund, D. P. Dubal, B. H. Patil, S. S. Shinde and C. D. Lokhande, Electrochim. Acta, 2013, 92, 205–215 CrossRef CAS.
- J. Li and H. Xie, Mater. Lett., 2012, 78, 106–109 CrossRef CAS.
Footnote |
| † Electronic supplementary information (ESI) available: Further details of synthesis of graphene oxide and graphene, XPS spectrum of MnS/G-9 nanocomposite and CV comparison of MnS with MnS/G-9 composite. See DOI: 10.1039/c6ra25457h |
| This journal is © The Royal Society of Chemistry 2017 |


