 Open Access Article
Creative Commons Attribution 3.0 Unported Licence
Structure–property–activity relationships in a pyridine containing azine-linked covalent organic framework for photocatalytic hydrogen evolution†
Frederik
Haase
ab,
Tanmay
Banerjee
a,
Gökcen
Savasci
 b,
Christian
Ochsenfeld
bd and
Bettina V.
Lotsch
*abcd
aMax Planck Institute for Solid State Research, Heisenbergstraße 1, 70569 Stuttgart, Germany. E-mail: b.lotsch@fkf.mpg.de
bDepartment of Chemistry, University of Munich (LMU), Butenandtstraße 5-13, 81377 München, Germany
cNanosystems Initiative Munich (NIM), Schellingstraße 4, 80799 München, Germany
dCenter for Nanoscience, Schellingstraβe 4, 80799 München, Germany
First published on 23rd February 2017
Abstract
Organic solids such as covalent organic frameworks (COFs), porous polymers and carbon nitrides have garnered attention as a new generation of photocatalysts that offer tunability of their optoelectronic properties both at the molecular level and at the nanoscale. Owing to their inherent porosity and well-ordered nanoscale architectures, COFs are an especially attractive platform for the rational design of new photocatalysts for light-induced hydrogen evolution. In this report, our previous design strategy of altering the nitrogen content in an azine-linked COF platform to tune photocatalytic hydrogen evolution is extended to a pyridine-based photocatalytically active framework, where nitrogen substitution in the peripheral aryl rings reverses the polarity compared to the previously studied materials. We demonstrate how simple changes at the molecular level translate into significant differences in atomic-scale structure, nanoscale morphology and optoelectronic properties, which greatly affect the photocatalytic hydrogen evolution efficiency. In an effort to understand the complex interplay of such factors, we carve out the conformational flexibility of the PTP-COF precursor and the vertical radical anion stabilization energy as important descriptors to understand the performance of the COF photocatalysts.
1. Introduction
Covalent organic frameworks are two- or three-dimensional, covalently linked and crystalline, porous polymers1 which are typically synthesized in two distinct synthetic steps.2 The building blocks, after synthesis, are reacted with each other in a reversible covalent bond forming reaction under solvothermal conditions to form a crystalline material. The first step of the synthesis rarely uses reactions in equilibrium, leading to a plethora of organic compounds that can be tailored at will and used as building blocks. In the second step, however, the reversibility of the covalent bond forming reaction is key to producing the desired crystallinity. Long and short-range order in turn determine features such as porosity and pore sizes, as well as optoelectronic properties based on charge transport and defect states. This dependence on the thermodynamic equilibrium makes the synthesis of COFs quite similar to classical solid-state chemistry under thermodynamic control. COFs are considered to be highly attractive candidates for solid-state materials with a range of applications, due to the level of control that can be levied via the building blocks. The applications then make use of the solid-state properties such as creating a crystalline array of covalently connected molecules that are accessible through the pores,3–6 or utilizing collective solid-state properties such as in 2D π-stacked COFs where molecules in close contact enable energy and charges to travel through the material.3–5 In contrast with disordered, non-porous materials, both of these cases rely on the regular and porous nature of COFs.In our previous studies6 we could show that in aryl triphenyl azine COFs (Nx-COFs) a stepwise increase in the nitrogen content of the central aromatic ring can lead to a progressive increase in photocatalytic hydrogen evolution, thus showing the extent to which tunability is possible and effective in adjusting the structure–property–activity relationships in such materials. The changes in the photocatalytic hydrogen evolution activity in a series of Nx-COFs featuring gradually increasing nitrogen content in the central aryl ring (no nitrogen for phenyl to three nitrogens for triazine, Fig. 1) were traced back to intrinsic electronic factors of the building blocks as well as structural, geometric and morphology-related features. The electronic factors that can possibly influence the hydrogen evolution rate are the band gap of the materials, the absolute HOMO and LUMO levels with respect to the hydrogen evolution potential, and the (de)localization of the frontier orbitals as a qualitative indicator for charge carrier delocalization in the excited state. The radical anion stabilization energy (RASE) was found to be a possible descriptor of the hydrogen evolution (HE) activity of the Nx-COFs. In addition, morphological features such as crystallinity and surface area also correlate with the HE activity, which are higher in the N2/N3-COFs and lower in the N0/N1-COFs. While in the Nx-COF series, the rather gradual evolution of structural, morphology-related and electronic features with increasing nitrogen content provides an excellent model system for studying the structure–property–activity relations in such systems, the interplay and relative weight of such features can still be highly complex.
We thus intended to explore a related COF with a different distribution of nitrogen across the building blocks. To this end, we substituted the peripheral rather than the central aryl ring with nitrogen atoms, starting with the same number of nitrogens as in the N3-COF to gauge the differences resulting from the placement of the nitrogen atoms within the precursor aldehyde (Fig. 1). The resulting PTP-COF (Fig. 2) indeed shows photocatalytic hydrogen evolution in the presence of triethanolamine as the sacrificial electron donor and a platinum co-catalyst. To put the findings of this study in context, comparison of the photocatalytic activity is made relative to the Nx-COF series and specifically to the isoelectronic N3-COF.
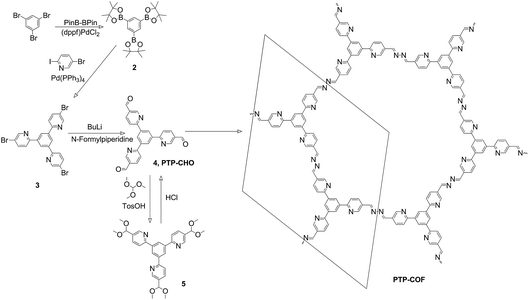 | ||
| Fig. 2 Synthesis of precursor PTP-CHO and PTP-COF. The in-plane unit cell is indicated on the right. | ||
2. Results
The PTP-CHO building block was synthesized from tribromobenzene (Fig. 2) through a two-step cross-coupling reaction and subsequent formylation. For the purification of PTP-CHO, derivatization into a dimethyl acetal was necessary to remove impurities. This linker was consequently used for the synthesis of PTP-COF under solvothermal conditions. Solvent screening was done and a 1![[thin space (1/6-em)]](https://www.rsc.org/images/entities/char_2009.gif) :
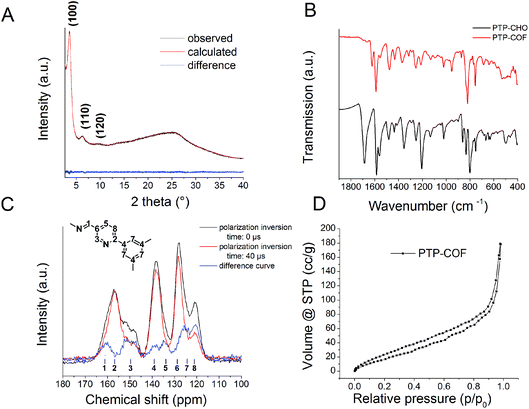
:![[thin space (1/6-em)]](https://www.rsc.org/images/entities/char_2009.gif) 1 mixture of butanol and dimethylacetamide (Fig. S1†) led to the highest crystallinity with the most resolved peaks in the X-ray powder diffraction pattern (XRPD, Fig. 3A).
1 mixture of butanol and dimethylacetamide (Fig. S1†) led to the highest crystallinity with the most resolved peaks in the X-ray powder diffraction pattern (XRPD, Fig. 3A).
First, the IR spectrum of PTP-COF was compared to that of PTP-CHO (Fig. 3B and S2†). Loss of the characteristic aldehyde (–CH![[double bond, length as m-dash]](https://www.rsc.org/images/entities/char_e001.gif) O) vibration at 1685 cm−1 and the appearance of the azine vibration (–CH
O) vibration at 1685 cm−1 and the appearance of the azine vibration (–CH![[double bond, length as m-dash]](https://www.rsc.org/images/entities/char_e001.gif) N–) at 1622 cm−1 is diagnostic of the conversion of the precursor aldehyde into the COF. The presence of a small residual aldehyde vibration either indicates small amounts of residual starting materials, oligomeric fragments or aldehyde-terminated surface groups of the PTP-COF particles.
N–) at 1622 cm−1 is diagnostic of the conversion of the precursor aldehyde into the COF. The presence of a small residual aldehyde vibration either indicates small amounts of residual starting materials, oligomeric fragments or aldehyde-terminated surface groups of the PTP-COF particles.
To further corroborate the structure, we measured solid-state cross-polarization and polarization-inversion (CPPI) 13C NMR of PTP-COF to help identify the signals in the NMR spectrum (Fig. 3C).7 With increasing inversion time, the intensity of carbons attached directly to hydrogens is reduced relative to those carrying no protons. Based on the CPPI sequence and comparison with known compounds from the literature, we assigned the peaks to the respective carbons. The retention of the molecular structure of the building blocks is evident from the 13C NMR spectrum. The formation of the azine linkage is visible from the peak at 161 ppm, while only a small residual peak is seen at 191 ppm from unreacted aldehyde (Fig. S3†). The presence of the pyridine ring can be seen by the characteristic pyridine signal at 120 ppm, assigned to the carbon in a meta position to the pyridine nitrogen (peak no. 8).
The XRPD pattern of PTP-COF shows three peaks (Fig. 3A) that can be attributed to the (100), (110) and (120) planes at 3.68, 6.36 and 9.72° 2θ, respectively. Additionally, a broad feature in the region of 20–30° is evident that may be attributed to a broad distribution of stacking distances in the PTP-COF or PTP-oligomers, or more generally to amorphous material. A unit cell was constructed based on the geometrical considerations of the precursor molecules and their expected connectivity (Fig. 4). This led to a P![[3 with combining macron]](https://www.rsc.org/images/entities/char_0033_0304.gif) unit cell whose initial unit cell parameters were obtained from a force field optimization and then refined against the experimentally observed powder pattern by means of a Pawley fit (Rwp: 1.191). The thus obtained unit cell parameters are a = b = 27.75 Å, α = β = 90° and γ = 120°. The unit cell parameter c and therefore the stacking distance could not be refined, as there is only a very broad feature visible in the expected region. This feature was not included in the structural model and only phenomenologically modelled with a background function (see the methods section in the ESI†). Hence, c was kept at 3.55 Å as obtained from the force field geometry optimized unit cell in Materials Studio. Rietveld analysis showed that the model fits to the structure (Fig. S4, Table S1†).
unit cell whose initial unit cell parameters were obtained from a force field optimization and then refined against the experimentally observed powder pattern by means of a Pawley fit (Rwp: 1.191). The thus obtained unit cell parameters are a = b = 27.75 Å, α = β = 90° and γ = 120°. The unit cell parameter c and therefore the stacking distance could not be refined, as there is only a very broad feature visible in the expected region. This feature was not included in the structural model and only phenomenologically modelled with a background function (see the methods section in the ESI†). Hence, c was kept at 3.55 Å as obtained from the force field geometry optimized unit cell in Materials Studio. Rietveld analysis showed that the model fits to the structure (Fig. S4, Table S1†).
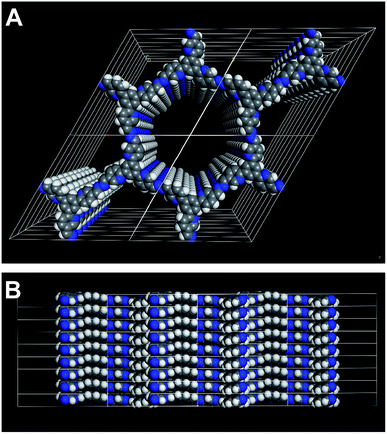 | ||
| Fig. 4 Illustration of the 3D structure that was used to model the PTP-COF. Perpendicular to (A) and along (B) the a–b plane. | ||
To rationalize the observed low crystallinity, we analyze the geometry of the C3 symmetric phenyl tripyridine (PTP) core (Fig. 2). Our previous studies showed that lower dihedral angles (i.e. increased planarity) between the peripheral and the central aryl rings entail improved stacking in the COF system, ultimately leading to higher crystallinity.6 The PTP linker was chosen with the pyridine nitrogen in a position towards, rather than away from, the central phenyl ring, in order to decrease the number of close hydrogen contacts between adjacent rings and to lower the dihedral angle. To corroborate the dihedral angles we calculated optimized geometries for the PTP-CHO building block and the Nx-CHO building units (Table S2, Fig. S9 and S10†) at the PBE0-D3/def2-TZVP level of theory. The PTP-CHO building block shows lower average dihedral angles (17.0°) than the N1-CHO and N2-CHO building blocks (18.8° and 29.8°, respectively). The pyridine core in the N1-CHO building block reduces the dihedral angle (29.8°) of two adjacent phenyl ligands in comparison to the N0-CHO building block (39.1°). Three pyridine ligands attached to the phenyl core in the PTP-CHO building block result in even higher overall planarity due to the threefold presence of this interaction. 1,4-Repulsions of hydrogen atoms between the core and the ligands are decreased in all of the three attached ligands, causing the average dihedral angle to be in the range of that of the N2-CHO building block; only N3-CHO has a lower dihedral angle of 0.0°. We tried to quantify this influence on the crystallinity by calculating the number of theoretically possible conformers of the precursors N3-CHO and PTP-CHO. Analysis of the torsion angles in PTP-CHO and N3-CHO shows a different number of distinct, but energetically degenerate conformers for both molecules. The torsion angle between the aldehyde and the adjacent aryl ring (angles B and D) gives two main conformers at 0° and 180° in PTP-CHO and N3-CHO (Fig. 5, blue curves). However, analysis of the torsion angle of the central aryl ring to the peripheral aryl ring (angles A and C) reveals a different trend (Fig. 5, red curves). The torsion angle distribution shows four conformations in PTP-CHO, while N3-CHO has only two, which are symmetry equivalent, thus leading to only one preferred torsion angle at 0° (Fig. 5A). We thus estimated the number of distinct conformers to be 23 × 43 = 512 and 23 = 8 for PTP-CHO and N3-CHO, respectively. If these conformers were to be observed as an individual entity, most of them would be symmetrically equivalent or degenerate. However, when considered as a defect in an extended COF crystal, the degeneracy is lifted. Furthermore, such a defect will not only change the (average) occupancy of nitrogen at a certain position in space, but it also induces changes in the stacking, with regard to the stacking offset and the layer to layer distance, and can thus lead to an increased amount of disorder.
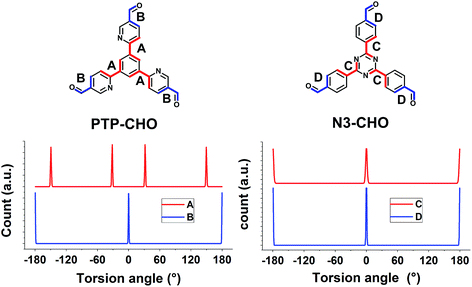 | ||
| Fig. 5 Conformer search in Materials Studio for PTP-CHO and N3-CHO for the torsion angles displayed. The minimization was based on a coarse force field optimization to find the local minima. | ||
The BET surface area of the material is 84.21 m2 g−1 and therefore extremely low for a COF, as seen from argon sorption analysis (Fig. 3D and S5†). The low sorption capacity and thus possibly obstructed pores of the COF may either be attributed to its low crystallinity and the ill-defined stacking in the material, or due to residuals present in the pores, or both. As discussed above, such residuals could be the precursor molecule, PTP-CHO, which might explain the small residual aldehyde signal in the ssNMR (191 ppm, Fig. S3†) and IR (1683 cm−1, Fig. 3B) spectra. However, the small amount of molecular PTP-CHO should be washed away during the work-up stage of the synthesis of the COF. A more likely possibility thus is the presence of a broad distribution of chemically related oligomeric species with similar, yet not identical, chemical shifts, since the ssNMR signals of PTP-COF are rather broad in comparison with other COFs (Fig. 3C).6,8
A comparison of the morphologies of PTP-COF vs. N3-COF shows differences between the two.6 While N3-COF is composed of aggregated particulates in the range of several hundred nanometers, PTP-COF is composed of two parts – large, nearly perfectly spherical particles of relatively uniform size distribution of around 1 μm, and additional substantial areas of agglomerates (Fig. 6 and S6†).
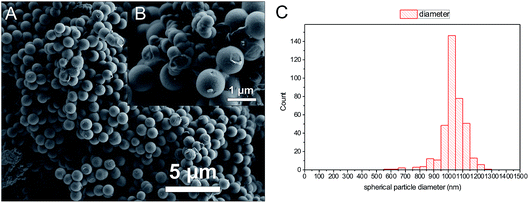 | ||
| Fig. 6 SEM images of PTP-COF (A and B), showing the two distinct phases (B) a compact intergrowth of small particles and the other nearly spherical particles with a narrow size distribution (C). | ||
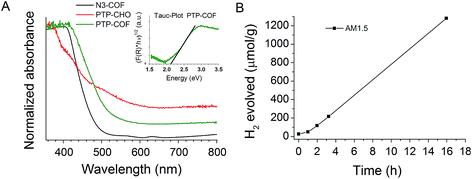
Photocatalytic hydrogen evolution was tested with PTP-COF under AM1.5 conditions with triethanolamine as a sacrificial electron donor (SED) and platinum nanoparticles as the electrocatalyst. The platinum nanoparticles were generated and deposited in situ onto the photocatalyst by photo-reduction of added aqueous solution of hydrochloroplatinic acid into the reaction vessel. Triethanolamine was chosen as the sacrificial electron donor due to its ability to participate in hydrogen bonds with the PTP-COF. Such hydrogen bonding interactions may be more pronounced in PTP-COF than in N3-COF due to the more basic character of the pyridine rings as compared to the triazine ring and it should facilitate close contact between the SED and the COF. We expect this close contact to enable efficient hole quenching upon excitation of the photocatalyst. The thus tested PTP-COF produced hydrogen steadily over the course of over 15 h with no reduction in the observed rate (Fig. 7A). An initial activation period can be observed in the hydrogen evolution, which could be attributed to the formation of platinum nanoparticles. The HE rate was 83.83 μmol h−1 g−1, comparable to that of N1-COF (90 μmol h−1 g−1), but an order of magnitude lower than that of N3-COF (1703 μmol h−1 g−1).6
The observed lower HE rate of PTP-COF compared to that of N3-COF is apparently unexpected if one considers the light harvesting properties of COFs as a decisive factor in determining the photocatalytic activity. This is because compared to the Nx-COFs, all of which show an absorption edge at 2.7 eV, PTP-COF has an extended absorption in the visible region with a measured absorption edge corresponding to a band gap of 2.1 eV (Fig. 7A, Tauc-plot). Note, however, that stark differences in the HE activity are observed also within the Nx-COF series in spite of their similar band gaps, which puts the influence of the band gap on the catalytic activity into perspective.
To characterize the excited state properties of PTP-COF, we carried out time-resolved photoluminescence (PL) measurements. When excited at 380 nm, PTP-COF reveals a broad unresolved emission band over the whole visible spectral range from 425 nm to 800 nm (Fig. 8A). Distinct peaks can be identified around 470–530 nm, at 630 nm and a shoulder at approximately 740 nm. The quantum yield of emission of the PTP-COF solid was found to be quite high at 4.15%, comparable, for example, to that of the anthracene based emissive 2D COFs (5.4%) reported by Jiang and coworkers.9
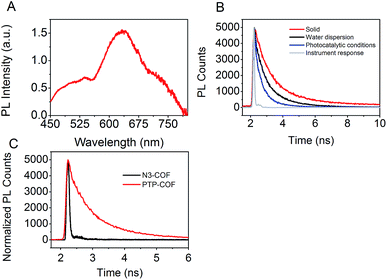 | ||
| Fig. 8 Emission properties of PTP-COF. (A) Emission spectrum of PTP-COF powder (λexc = 380 nm); (B) TCSPC decay trace of PTP-COF under different conditions (λexc = 375 nm, λem = 650 nm), and (C); TCSPC decay trace of PTP-COF and N3-COF in water (λexc = 375 nm). The instrument response function is deliberately omitted for clarity. Three-exponential fits and the average lifetimes are shown in Table S3.† | ||
In order to understand the processes underlying hydrogen evolution better, we measured the absolute emission quantum efficiency of PTP-COF under different experimental conditions using an integrating sphere. As compared to 4.15% when measured as a solid, the quantum yield decreases steadily to 2.09% when measured as a water dispersion and finally to 0.87% when measured under photocatalytic conditions, i.e., after illumination (AM1.5) in the presence of the sacrificial electron donor triethanolamine and the platinum precursor. Photoluminescence lifetimes recorded under the same conditions using the time-correlated single-photon counting method (TCSPC) show a concomitant decrease in the fluorescence lifetime as well – from solid to water dispersion to photocatalytic conditions, as shown in Fig. 8B. The TCSPC decay traces were subsequently fit to a three-exponential decay function (Table S3†) and the radiative and non-radiative decay rates were calculated from the quantum yield and the amplitude-weighted average lifetimes. Comparing the measurements of the water dispersion of the COF to those under photocatalytic conditions, the radiative decay rates of PTP-COF remain almost the same while the non-radiative decay rates, possibly corresponding to charge transfer steps of the hydrogen evolution process, increase considerably under photocatalytic conditions in the presence of the SED and Pt-cocatalyst. It must, however, be noted that this tri-exponential fit of the TCSPC decay may not reflect the underlying physics appropriately and has only been used to gain qualitative information on the radiative and non-radiative rates.
Fluorescence decay of N3-COF as a water dispersion was recorded as well. In this case an external frequency doubled 400 nm laser beam from a Ti:Sa oscillator with a pulse width of ∼100 fs was used as the excitation source. In comparison with the fluorescence decay of PTP-COF in water, N3-COF in water (Fig. 8C) can be seen to have a much shorter lifetime. Also, the emission quantum yield of N3-COF (<0.5%, measured as a water dispersion) is much less than that of PTP-COF (2.09%, measured as a water dispersion). Relative to the radiative rates, the non-radiative rates thus seem to be more pronounced in N3-COF, in line with its higher observed photocatalytic activity compared to PTP-COF.
3. Discussion
PTP-COF was designed as an extension of the Nx-COF series. However, it turned out to differ considerably in its geometric, electronic and morphological properties, thus making the comparison to the Nx-COF series challenging. While PTP-COF is isoelectronic to N3-COF and adopts a similar crystal structure as far as can be inferred from the XRPD pattern, many structural and electronic features differ significantly. Most obvious differences can be found in the lower crystallinity, the significantly lower porosity and the different morphology. These features – particularly the low surface area of PTP-COF – might directly affect the ability of PTP-COF to produce hydrogen effectively under photocatalytic conditions in comparison to the Nx-COFs. The lower crystallinity can be seen as extensive peak broadening in the XRPD pattern and a low number of observable reflections, in addition to the absence of a pronounced “stacking peak” (00l). This observation can be rationalized by considering the lower symmetry of PTP-COF compared to N3-COF, which can already be seen in the precursor aldehyde PTP-CHO as compared to N3-CHO. This reduction in symmetry leads to a higher number of molecular arrangements that can in turn lead to disorder in PTP-COF. Most prominently, the in-plane conformers, while conserving the connectivity of the PTP-COF, can influence the out-of-plane stacking interactions, which then could cause stacking disorder.Another factor that might be influencing stacking in the COFs can easily be observed in single crystals of the PTP-H and N3-H molecules (Fig. 5). While N3-H stacks in a face-to-face fashion with a slight offset, the stacking of PTP-H is governed by donor–acceptor interactions between the pyridine and the phenyl rings. Such an interaction could lead to additional stacking minima that lead to disorder and a reduction in crystallinity and porosity.
A PTP-H single crystal shows another hint for the low porosity – an aryl hydrogen is in close proximity (2.58 Å) to the pyridine nitrogen (Fig. 9C), indicating a tendency of this molecule to participate in hydrogen bonding. The pyridine moiety of the peripheral rings in PTP-CHO is more electron rich and hence more basic compared to triazine, the central aryl ring in the N3 system, which could lead to bound molecules and oligomers being left in the pores after the synthesis of the COF, thus leading to a lowered surface area.
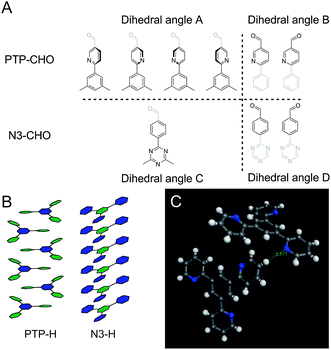 | ||
| Fig. 9 (A) Schematic representation of the different conformers at the torsion angles A, B, C and D in PTP-CHO and N3-CHO as indicated in Fig. 5. (B) Schematic representation of the stacking in single crystal structure solutions of PTP-H10 and the N3-H11 cores, showing the different stacking modes. Green hexagons represent the nitrogen containing aryl rings and the blue hexagons represent the phenyl rings. (C) Depiction of a hydrogen close contact in the PTP-H single crystal.10 | ||
In line with low porosity and crystallinity, the morphological changes are from small aggregates that disperse reasonably well in water for the N3-COF, to the large (1037 ± 85 nm) smooth spheres of PTP-COF and macroscopic intergrown monoliths that do not disperse well in water for the PTP-COF, as was observed during the photocatalysis reaction. The morphology and the resulting dispersibility influences how efficiently light is absorbed and scattered in the suspension during photocatalysis and thereby how much catalyst is needed to absorb all light. These issues might, however, be addressed by mechanical methods of dispersion and reduction of particle size, such as ball milling and sonication.
The above solid-state properties will influence the ability of PTP-COF to produce hydrogen efficiently, independent of its optoelectronic properties. In fact, one may argue that the key feature determining the photocatalytic activity of a material is its specific surface area, which is extremely low in PTP-COF. Interestingly, when normalizing the observed HE activity against this surface area to extract an “effective HE activity”, PTP-COF is indeed competitive with N3-COF (0.995 μmol h−1 m−2vs. 1.108 μmol h−1 m−2).
Nevertheless, as in the Nx-COF series, there is evidence that a range of intrinsic factors influencing the HE activity of PTP-COF are also at play. For example, the longer PL lifetime and the higher quantum yield of PTP-COF compared to N3-COF seem to imply smaller or less efficient non-radiative deactivation via charge transfer pathways during hydrogen evolution, vs. radiative recombination, in PTP-COF. This behavior has been reported before in carbon nitride-based photocatalysts and is in line with the observed higher photocatalytic activity of N3-COF compared to PTP-COF.12,13
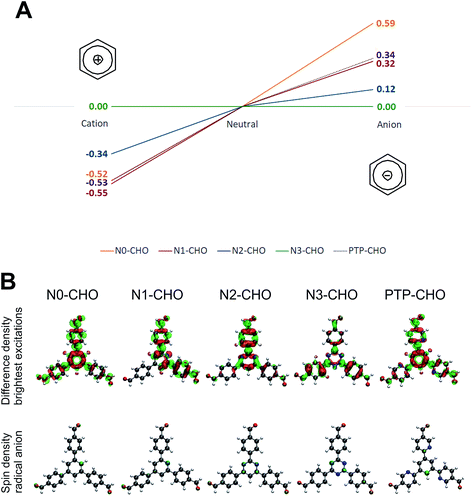
To further gauge the influence of intrinsic, i.e. optoelectronic factors, on the observed HE rates, we calculated molecular orbitals for all Nx-CHO building blocks and PTP-CHO at the PBE0-D3/def2-TZVP level of theory (Fig. S11 and S12†). The spatial extent and distribution of the frontier orbitals are often used to rationalize exciton delocalization, charge separation and the location of potential charge-transfer sites.14–16 Using the delocalization of the HOMO/LUMO as a possible indicator for charge carrier separation in our investigated systems, the HOMO of the PTP-CHO building block shows a comparable localization as the HOMO of the N1-CHO building block (Fig. S11 and S12†). Associating the HOMO with charge-transfer sites for holes, we may infer that the hole delocalization is comparable between the two building blocks. Associating the LUMO with the charge-transfer site for electrons, we may deduce that due to differences in the LUMO spread across the building blocks, delocalization of the charge carrying species is less pronounced in PTP-CHO than in N1-CHO. In addition, the LUMO of the PTP-CHO building block has the same spatial extent as the corresponding HOMO, which may point to more facile charge recombination in PTP-COF.
It has to be stressed, however, that orbitals are not observables and hence, such model considerations need to be taken with care. Therefore, an alternative approach was pursued in considering possible reaction intermediates during the photocatalytic process. Quenching the hole on the COF by a sacrificial electron donor would lead to a radical anionic state on the COF (Fig. 10, reductive quenching; radical anionic pathway), which has been observed in a recent experimental study on Nx-model systems (unpublished results). The extraction of the electron from the photoexcited COF towards Pt (oxidative quenching) would lead to a radical cationic state on the COF, following a radical cationic pathway, accordingly.6
In order to investigate the relative stabilities of reaction intermediates within these two radical pathways, vertical radical stabilization energies (RASE) of the PTP-CHO building block and the Nx building block units were calculated at the PBE0-D3/def2-TZVP level of theory (Table S5†). These RASE values, calculated on large subsections of the Nx-COFs, have been used in our previous work on the Nx-COFs.6 These calculations showed the RASE to be a powerful descriptor of the HE efficiency in triphenyl aryl azine COFs. To extend these calculations to more generalized triaryl-aryl-azine COFs, we included the precursor aldehydes, PTP-CHO and Nx-CHO as model systems for PTP-COF and Nx-COFs, respectively. Comparison of radical stabilization energies with the series of Nx-CHO building blocks reveals that the radical anion of PTP-CHO has a similar stabilization to that of the N1-CHO unit. The formation of a radical anion is most favored for the N3-CHO system and least favored for the N0-CHO system. If the formation of this radical anion is thus taken as the rate-determining step, the same trend in the computed energetics of the radical anion of the PTP-CHO, and the experimentally observed photocatalytic activity is seen – the observed HE activity of PTP-COF is similar to that of the N1-COF. On the one hand, the importance of the radical anion intermediate emphasizes the role of the sacrificial electron donor in being able to swiftly remove the hole from the COF, and on the other hand it underlines the importance of the electron-poor character of the building block in stabilizing the radical anion as best observed for the triazine building block. The introduced pyridine ligands in the PTP-CHO building block units are thus not as effective in stabilizing a negative charge (in order to transfer it to the nearest platinum site subsequently) as compared to the N3-CHO unit.
Radical cation stabilizations show a scenario for the PTP-CHO building block which is very similar to that of the N0- and N1-CHO building blocks (Fig. 10), where all three investigated systems give very similar stabilization energies, yielding beneficial radical cations for all three systems. As the trend within the radical cation stabilization energies is contrary to the observed photocatalytic activities, we assume an anionic pathway during the photocatalytic process.
4. Conclusion
In summary, as for the Nx-COFs, we find a complex interplay between extrinsic, i.e. steric and morphology-related factors, and intrinsic, optoelectronic features – specifically the vertical radical anion stabilization energy – determining the photocatalytic activities of PTP-COF. Thus, the correlation with, or even prediction of the catalytic activity of a COF based only on its photophysical properties is challenging, given the plethora of “real structure” effects that may disguise the intrinsic catalytic activity. The above findings thus show the importance of precisely controlling the structure, long-range order and morphology of a COF through dynamic covalent chemistry, such that the various factors determining the photocatalytic activity of a COF can ultimately be disentangled.5. Experimental section
5.1. Synthesis
1H NMR (CDCl3, 300 MHz): δ (ppm) 8.38 (s, 3H), 1.34 (s, 36H). 13C NMR (CDCl3, 75 MHz): δ (ppm) 144.33, 106.72, 83.93, 25.11.
![[thin space (1/6-em)]](https://www.rsc.org/images/entities/char_2009.gif) :
:![[thin space (1/6-em)]](https://www.rsc.org/images/entities/char_2009.gif) 1 ethanol was added and the solvent was removed under reduced pressure until precipitation started. The solid was filtered off to obtain the product as an off-white dense powder (2.26 g, 62.9%). The product could be further purified by recrystallization from chloroform.
1 ethanol was added and the solvent was removed under reduced pressure until precipitation started. The solid was filtered off to obtain the product as an off-white dense powder (2.26 g, 62.9%). The product could be further purified by recrystallization from chloroform.
1H NMR (CDCl3, 300 MHz): δ (ppm) 8.79 (d, J = 2.28 Hz, 3H), 8.68 (s, 3H), 7.94 (dd, J = 8.39, 2.38 Hz, 3H), 7.84 (d, J = 8.57 Hz, 3H). 13C NMR (CDCl3, 75 MHz): δ (ppm) 155.2, 150.99, 139.65, 139.62, 126.07, 122.09, 120.10.
1H NMR (CDCl3, 300 MHz): δ (ppm) 8.81 (d, J = 2.0 Hz, 3H), 8.78 (s, 3H), 8.01 (d, J = 8.08 Hz, 3H), 7.91 (dd, J = 8.15, 2.07 Hz, 3H), 5.55 (s, 3H), 3.39 (s, 18H). 13C NMR (CDCl3, 75 MHz): δ (ppm) 157.14, 148.66, 140.32, 135.72, 132.57, 126.53, 120.65, 101.51, 52.87.
1H NMR (CDCl3, 300 MHz): δ (ppm) 10.22 (s, 3H), 9.23 (d, J = 1.38 Hz, 3H), 9.02 (s, 3H), 8.34 (dd, J = 8.12, 2.18 Hz, 3H), 8.19 (d, J = 8.08 Hz, 3H).
5.2. Materials and methods
The powder patterns were analyzed by Rietveld17 and Pawley18 refinement using a range from 2–30° 2θ with TOPAS V5. The peak profile was described by applying the fundamental parameter19 approach as implemented in TOPAS. The background was modeled with Chebychev polynomials and a 1/X background correction function was additionally used to describe the incoherent scattering at low 2θ. Likely lattice parameters were refined, constrained only by the symmetry. The anisotropic peak shape, caused by stacking faults and mismatches in the microstructure, was modelled by a phenomenological model for microstrain.20
The dynamics of emission decay were monitored by using the FLS980’s time-correlated single-photon counting capability (1024 channels; 10 or 20 ns window) with data collection for 5000 counts. For the longer lived PTP-COF, excitation was provided by an Edinburgh EPL-375 picosecond pulsed laser diode (375 ± 6 nm, pulse width – 68 ps). For the short lived N3-COF, a frequency doubled 400 nm (404 nm, ∼100 fs, 85 MHz) laser beam from a Ti:Sa oscillator was used as the excitation source. A cooled microchannel plate photomultiplier tube (MCP-PMT) was used as the detector. Kinetics were fit with a three-exponential function by using the Edinburgh software package.
Acknowledgements
The authors would like to thank Viola Duppel for recording the SEM images, Olaf Alberto von Mankowski for the argon sorption measurements and Igor Moudrakovski for the solid state NMR measurements. Open Access funding was provided by the Max Planck Society.References
- A. P. Cote, A. I. Benin, N. W. Ockwig, M. O’Keeffe, A. J. Matzger and O. M. Yaghi, Science, 2005, 310, 1166–1170 CrossRef CAS PubMed.
- P. J. Waller, F. Gándara and O. M. Yaghi, Acc. Chem. Res., 2015, 48, 3053–3063 CrossRef CAS PubMed.
- E. L. Spitler, B. T. Koo, J. L. Novotney, J. W. Colson, F. J. Uribe-Romo, G. D. Gutierrez, P. Clancy and W. R. Dichtel, J. Am. Chem. Soc., 2011, 133, 19416–19421 CrossRef CAS PubMed.
- S. Wan, F. Gándara, A. Asano, H. Furukawa, A. Saeki, S. K. Dey, L. Liao, M. W. Ambrogio, Y. Y. Botros, X. Duan, S. Seki, J. F. Stoddart and O. M. Yaghi, Chem. Mater., 2011, 23, 4094–4097 CrossRef CAS.
- S.-L. Cai, Y.-B. Zhang, A. B. Pun, B. He, J. Yang, F. M. Toma, I. D. Sharp, O. M. Yaghi, J. Fan, S.-R. Zheng, W.-G. Zhang and Y. Liu, Chem. Sci., 2014, 5, 4693–4700 RSC.
- V. S. Vyas, F. Haase, L. Stegbauer, G. Savasci, F. Podjaski, C. Ochsenfeld and B. V. Lotsch, Nat. Commun., 2015, 6, 8508 CrossRef CAS PubMed.
- R. Sangill, N. Rastrupandersen, H. Bildsoe, H. J. Jakobsen and N. C. Nielsen, J. Magn. Reson., Ser. A, 1994, 107, 67–78 CrossRef CAS.
- V. S. Vyas, M. Vishwakarma, I. Moudrakovski, F. Haase, G. Savasci, C. Ochsenfeld, J. P. Spatz and B. V. Lotsch, Adv. Mater., 2016, 28, 8749–8754 CrossRef CAS PubMed.
- N. Huang, X. Ding, J. Kim, H. Ihee and D. Jiang, Angew. Chem., Int. Ed., 2015, 54, 8704–8707 CrossRef CAS PubMed.
- S. J. Farley, D. L. Rochester, A. L. Thompson, J. A. K. Howard and J. A. G. Williams, Inorg. Chem., 2005, 44, 9690–9703 CrossRef CAS PubMed.
- A. Damiani, E. Giglio and A. Ripamonti, Acta Crystallogr., 1965, 19, 161–168 CrossRef CAS.
- M. Shalom, S. Inal, C. Fettkenhauer, D. Neher and M. Antonietti, J. Am. Chem. Soc., 2013, 135, 7118–7121 CrossRef CAS PubMed.
- V. W.-h. Lau, V. W.-z. Yu, F. Ehrat, T. Botari, I. Moudrakovski, T. Simon, V. Duppel, E. Medina, J. Stolarczyk, J. Feldmann, V. Blum and B. V. Lotsch, Adv. Energy Mater., 2017, 1602251 CrossRef.
- S. Jin, T. Sakurai, T. Kowalczyk, S. Dalapati, F. Xu, H. Wei, X. Chen, J. Gao, S. Seki, S. Irle and D. Jiang, Chem.–Eur. J., 2014, 20, 14608–14613 CrossRef CAS PubMed.
- R. N. Gunasinghe, D. G. Reuven, K. Suggs and X.-Q. Wang, J. Phys. Chem. Lett., 2012, 3, 3048–3052 CrossRef CAS PubMed.
- S. Jin, X. Ding, X. Feng, M. Supur, K. Furukawa, S. Takahashi, M. Addicoat, M. E. El-Khouly, T. Nakamura, S. Irle, S. Fukuzumi, A. Nagai and D. Jiang, Angew. Chem., Int. Ed., 2013, 52, 2017–2021 CrossRef CAS PubMed.
- H. Rietveld, J. Appl. Crystallogr., 1969, 2, 65–71 CrossRef CAS.
- G. Pawley, J. Appl. Crystallogr., 1981, 14, 357–361 CrossRef CAS.
- A. Coelho, J. Appl. Crystallogr., 2000, 33, 899–908 CrossRef CAS.
- P. Stephens, J. Appl. Crystallogr., 1999, 32, 281–289 CrossRef CAS.
- O. B. Peersen, X. L. Wu, I. Kustanovich and S. O. Smith, J. Magn. Reson., Ser. A, 1993, 104, 334–339 CrossRef CAS.
- B. M. Fung, A. K. Khitrin and K. Ermolaev, J. Magn. Reson., 2000, 142, 97–101 CrossRef CAS PubMed.
- X. L. Wu, S. T. Burns and K. W. Zilm, J. Magn. Reson., Ser. A, 1994, 111, 29–36 CrossRef CAS.
- J. C. de Mello, H. F. Wittmann and R. H. Friend, Adv. Mater., 1997, 9, 230–232 CrossRef CAS.
- R. Ahlrichs, M. Bär, M. Häser, H. Horn and C. Kölmel, Chem. Phys. Lett., 1989, 162, 165–169 CrossRef CAS.
Footnote |
| † Electronic supplementary information (ESI) available: Additional crystallographic and theoretical information, analytical data on the synthesis and additional ssNMR, IR information and SEM images. See DOI: 10.1039/c7fd00051k |
| This journal is © The Royal Society of Chemistry 2017 |


