 Open Access Article
Creative Commons Attribution 3.0 Unported Licence
Quantitative urinalysis using aggregation-induced emission bioprobes for monitoring chronic kidney disease†
Tong
Chen‡
ab,
Ni
Xie‡
c,
Lucia
Viglianti
c,
Yabin
Zhou
ad,
Hui
Tan
e,
Ben Zhong
Tang
*c and
Youhong
Tang
 *a
*a
aCentre for NanoScale Science and Technology, School of Computer Science, Engineering and Mathematics, Flinders University, South Australia 5042, Australia. E-mail: youhong.tang@flinders.edu.au; Tel: +61-8-82012138
bDepartment of Medical Biochemistry, School of Medicine, Flinders University, South Australia 5042, Australia
cDepartment of Chemistry, The Hong Kong University of Science and Technology, Hong Kong, China. E-mail: tangbenz@ust.hk; Tel: +852-23587373
dDepartment of Gastroenterology and Hepatology, Flinders Centre for Innovation in Cancer, Flinders University, South Australia 5042, Australia
eThe First Affiliated Hospital of Shenzhen University, Shenzhen Key Laboratory of Neurosurgery, Shenzhen 518035, China
First published on 5th September 2016
Abstract
Early detection and appropriate management of chronic kidney disease can reduce the progression of kidney failure and cardiovascular disease. The urine albumin to creatinine ratio (UACR) test is a standard urine test for identifying individuals at high risk of developing progressive kidney disease. In this study, IDATPE, a novel fluorescent probe with aggregation-induced emission (AIE) features, is successfully developed for creatinine detection and quantitation. An excellent correlation between fluorescent light intensity and creatinine concentration is achieved. In addition, BSPOTPE, a reported excellent AIE bioprobe for human serum albumin (HSA) quantitation, is used together with IDATPE in artificial urine for UACR testing. The mutual interference of HSA and creatinine when the bioprobes are used for quantitation is characterised, with promising results. Further improvements and potential applications in CKD quantitation are highlighted.
1. Introduction
Chronic kidney disease (CKD), a condition characterised by a progressive loss of kidney function over time, is a significant and growing public health problem throughout the world, responsible for a substantial burden of illness and premature mortality. According to US National Kidney Foundation research, more than 20 million Americans, 1 of 9 adults, have CKD and another 20 million more Americans are at increased risk.1 Each year in the US, more than 100![[thin space (1/6-em)]](https://www.rsc.org/images/entities/char_2009.gif) 000 people are diagnosed with kidney failure.2 In Australia, one-third of Australians are at risk of developing CKD. In addition, more than 40% of people over the age of 75 have an indicator of this disease. As a result, approximately 2300 newly diagnosed individuals are required to commence either dialysis or kidney transplantation each year in Australia.3 Furthermore, CKD patients have a 2- to 3-fold greater risk of cardiac death than age- and sex-matched controls without CKD.4 Therefore, CKD directly or indirectly contributes to about 10% of Australians deaths and is one of the few diseases in which mortality rates are worsening over time.4 More worrying is that many people are unaware of these risks in many cases. A person can lose up to 90 percent of their kidney function before experiencing any symptoms. Diabetes and high blood pressure are two of the most common causes of CKD, accounting for up to two-thirds of the cases. Individuals who suffer from obesity, have a history of heart attack or stroke or a family history of CKD or smoking also have an increased risk of developing CKD.1,4
000 people are diagnosed with kidney failure.2 In Australia, one-third of Australians are at risk of developing CKD. In addition, more than 40% of people over the age of 75 have an indicator of this disease. As a result, approximately 2300 newly diagnosed individuals are required to commence either dialysis or kidney transplantation each year in Australia.3 Furthermore, CKD patients have a 2- to 3-fold greater risk of cardiac death than age- and sex-matched controls without CKD.4 Therefore, CKD directly or indirectly contributes to about 10% of Australians deaths and is one of the few diseases in which mortality rates are worsening over time.4 More worrying is that many people are unaware of these risks in many cases. A person can lose up to 90 percent of their kidney function before experiencing any symptoms. Diabetes and high blood pressure are two of the most common causes of CKD, accounting for up to two-thirds of the cases. Individuals who suffer from obesity, have a history of heart attack or stroke or a family history of CKD or smoking also have an increased risk of developing CKD.1,4
Early detection and appropriate management of CKD can reduce the progression of kidney failure and cardiovascular disease by up to 50 percent. Clinical practice guidelines in Europe, the USA and Australia have recommended that the test for urine albumin to creatinine ratio (UACR) should be used, in addition to the test for estimated glomerular filtration rate (eGFR), to screen for CKD and its prognostic grading.5–7 HSA is the most abundant serum protein with a concentration of approximately 35–50 g L−1.8 However, in the case of kidney damage, small amounts of albumin leak into the urine, leading to a condition defined as microalbuminuria that can cause elevated albumin levels of up to 300 mg mL−1 in urine. Thus, microalbuminuria testing is typically employed as an initial screening tool for kidney disease.9 In the past, the urine albumin excretion was determined by albumin excretion rate in a 24 hour collection.10 Due to the difficulty of collecting 24 hour urine samples, it has now been recommended to determine urine albumin by measuring UACR on a spot sample, especially the first morning void.10,11 The current clinical routine measurement procedures for urine albumin are dominated by immunoassays, among which most are immunoturbidimetric.10 Although having a detection limit at 2–10 mg L−1,12 immunoassays tend to underestimate the amount of albumin in urine. This is due to the fact that albumin has at least five antigenic sites and the existence of various forms of albumin (truncated and modified forms) in urine have increased the difficulty for the antibodies to detect all the forms of albumin. Dipstick, high performance liquid chromatography (HPLC), liquid chromatography-mass spectrometry (LC-MS) and liquid chromatography-tandem mass spectrometry (LC-MS/MS) are also used as alternative methods.13 Although HPLC gives higher albumin detection values than immunoassays, it is believed that this is due to the detection of other (proteins) molecules with similar sizes to albumin.12 Although LC-MS can precisely detect intact albumin and albumin fragments with an intact N-terminus, it is not able to detect albumin fragments lacking the N-terminus. LC-MS/MS has high detection sensitivity (<25 mg L−1) and is able to detect intact albumin as well as albumin fragments, however post-translational modifications on albumin may affect the detection.13 Dipstick is widely used as an initial screening for CKD due to its low cost. However, it is a semiquantitative colorimetric test with a detection limit of 150 mg L−1.12
Creatinine is one of the most common biomarkers and the end metabolic product of creatine in mammals. The determination of creatinine concentration in biological fluids is important in the evaluation of renal function and muscle damage.14,15 Normal physiological creatinine concentrations in serum are in the range of 35 to 140 μM. Increased creatinine concentration leads to diabetic nephropathy, preeclampsia, glomerulonephritis, urinary tract obstruction and renal failure, while decreased creatinine concentration leads to muscular dystrophy and myasthenia.14 Therefore, the determination of creatinine in human plasma or urine is of great importance from a biological and clinical viewpoint. Furthermore, creatinine is normally released into the urine at a constant rate, and thus its level in urine is an indication of the urine concentration, allowing its measurement to be used to correct for urine concentration in a random urine sample in clinical urine tests such as UACR. Urine creatinine measurement is routinely done using clinical analyzers based on the colorimetric Jaffe rate reaction.16,17 The lower detection limit is at approximately 10 μg mL−1. In this reaction, the active methylene group of creatinine reacts with alkaline solutions of sodium picrate to yield an orange-yellow complex with a maximum absorbance at 510 nm. Despite its simplicity, this method is time-consuming and not very selective, because several substances can form coloured species with the alkaline picrate.18 These compounds include glucose, albumin, cycloketones and carbonyl compounds.20 Other not commonly used creatinine detection methods include capillary electrophoresis, liquid chromatography (LC), gas chromatography (GC), GC-MS, and GC-MS/MS. Although some of these methods have attained limits of detection down to 1–100 ng mL−1, they are not practical for routine urinary creatinine determination due to sample throughput, technical complexity and affordability.19,20
Biosensors based on fluorescent materials have attracted much attention due to their sensitivity, selectivity and rapidity. Organic molecules and organometallic complexes have been developed for protein assays. Upon complexation or conjugation with proteins, the luminophores show emission changes and/or spectral shifts, enabling biopolymers to be detected and quantified.21,22 Some fluorescence probes are insoluble in aqueous media, while others are unstable under ambient conditions. Some luminophores show spectacular performance in protein assays but are extremely expensive because of their painstaking syntheses. These drawbacks greatly limit the scope of their real-life high-tech applications.23,24 This situation calls for the development of synthetic, readily accessible and environmentally stable bioprobes with high sensitivity and selectivity. A thorny problem associated with the emission quenching of conventional luminophores in aqueous medium or physiological buffer is aggregation-caused quenching (ACQ).25 ACQ luminophores mostly have planar structures and are in close vicinity in aggregates suspended in the aqueous buffer, phenomena that can easily generate π–π stacking and cause non-radiative relaxation of the excited states. We have recently discovered that the propeller-like tetraphenylethene (TPE) structure behaves in a manner exactly opposite to the ACQ dyes: it is non-emissive in the solution state but becomes highly luminescent in the aggregate state. We coined the term “aggregation-induced emission” (AIE) for the phenomenon because the non-emissive TPE is induced to emit by aggregate formation.26–28 Decorating TPE with ionic or polar functional groups yields water soluble derivatives which can be utilized as fluorescence probes for bioanalyses. Our research group and others have successfully used TPE-based AIE luminogens for human serum albumin (HSA) detection and quantification.29,30 BSPOTPE (sodium 1,2-bis[4-(3-sulfonatopropoxyl)phenyl]-1,2-diphenylethene) has demonstrated superior sensitivity, as low as 1 nM, against albumin detection.29 It also showed an excellent specificity to HSA and bovine serum albumin (BSA) when several other human proteins, such as pepsin, human immunoglobulin G (IgG), etc., were present.29 These successes prompted and motivated us to further explore the potential of TPE-based AIE luminogens in bioanalyses for creatinine quantification31 and UACR determination.
In this study, we examined the utility of the TPE salts IDATPE (iminodiacetic acid functionalised TPE) and BSPOTPE as bioprobes for creatinine and HSA detection and quantitation. The potential mutual interference of creatinine and HSA in artificial urine during detection and quantitation was also evaluated for UACR applications.
2. Materials and methods
2.1 Chemicals
All of the reagents used in this study were purchased from Sigma-Aldrich unless otherwise specified. BSPOTPE was prepared according to previously published procedures29,32 and IDATPE was synthesized and characterised before use in this study (Chart 1).2.2 Sample preparation
IDATPE was dissolved in 100% acetonitrile (ACN) to make a 25 mM stock solution. BSPOTPE was prepared according to published procedures.32 A stock solution of BSPOTPE with a concentration of 5.0 mM was prepared by dissolving an appropriate amount of dye in Milli-Q lab water (Millipore, Billerica, MA). Both of the stock solutions were stored in the dark at 4 °C before use. Working solutions of both dyes were prepared daily by suitable dilution of the stock solution with either deionized water or artificial urine. The artificial urine solution was prepared by following the procedure previously published.33Stock solutions of creatinine and HSA were prepared using either deionized water or artificial urine to a concentration of 1 M and 30 mM, respectively. Working solutions were prepared freshly by appropriate dilution of the stock solution.
2.3 Characterisation
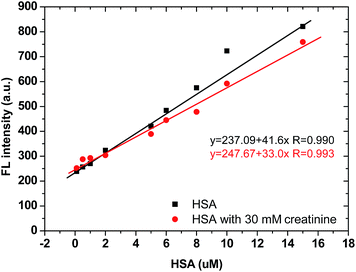
Steady-state fluorescence spectra were recorded using a Varian Cary Eclipse Fluorimeter (Varian Australia Pty Ltd). All pH adjustments were carried out using a digital pH meter (Hanna pH meter, mode: HI 208-02).To evaluate the effect of existing creatinine in artificial urine on the BSPOTPE detection of HSA, BSPOTPE was mixed with different concentrations of HSA solution made in artificial urine with or without 30 mM creatinine, to a final concentration of 40 μM. After incubation of the mixture at room temperature for 5 min, the FL intensity was measured at 475 nm with 350 nm as the excitation wavelength.
3. Results and discussion
3.1 Dye synthesis and characterisation
IDATPE was prepared by the synthetic route shown in Scheme S1 in the ESI.† The reaction intermediates and final product were fully characterised by spectroscopic methods from which satisfactory analysis data were obtained (see the characterisation data in the ESI†).3.2 Aggregation-induced emission feature of IDATPE
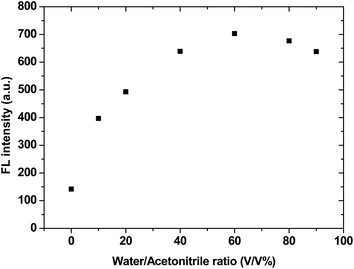
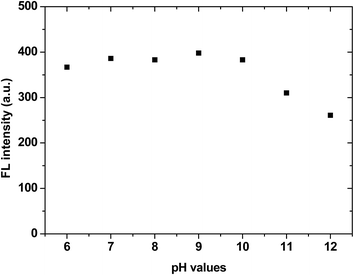
IDATPE is AIE-active, as shown in Fig. 1 and S2.† The ACN solution of IDATPE emits a faint UV light at a concentration of 40 μM. When water was added as a poor solvent while keeping the concentration of IDATPE constant, the resultant mixture showed an increasing fluorescence peak at 375 nm. The greatest enhancement of this peak was recorded when the water fraction reached 60%. Due to the hydrophilic environment of the ACN/water, organic soluble IDATPE molecules aggregated and restricted the rotation of the phenyl rings. Hence, non-radiative decay was blocked and the radiative relaxation was open, granting its highly emissive property. However, a small decrease in the FL intensity after ACN/water reached 60% was observed, probably caused by crystallization or precipitation of this bioprobe.The effect of pH on the FL spectra of IDATPE was investigated and is shown in Fig. 2 and S3.† Because hydrogen bonding may be the major interaction (see Chart 2) between IDATPE and creatinine, the effect of the pH of the solution was investigated in a pH range of 6 to 12. As can be seen from Fig. 2, no obvious FL intensity change was found at pH 6 to 10. It is reasonable to believe that after pH 10, the iminodiacetic acid (IDA) group chelated the sodium ion and formed clusters which started to decrease the FL intensity. The sensitivity of IDATPE decreased in the presence of sodium and other metal ions, such as potassium, calcium, and magnesium, at alkaline pH because these ions can shield or protonate the negative charges of the carboxyl groups of IDA due to the chelating effect at alkaline pH.34 The pH value of 6.2 was selected for subsequent studies. This is because the human urine pH range is between 5.5 and 7, with average of 6.2.35 Under this pH, the metal ions present won't interfere with IDATPE to reduce its sensitivity.
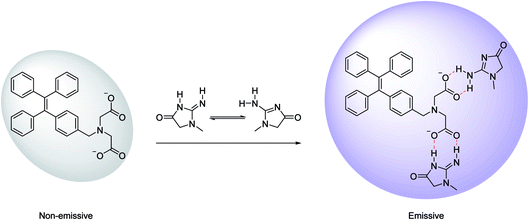 | ||
| Chart 2 Schematic illustration of the possible mechanism of aggregation of IDATPE in the presence of creatinine. | ||
3.3 Creatinine quantitation in solution
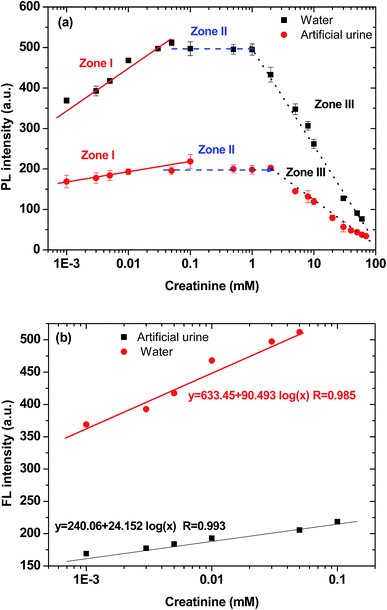
Creatinine has two different tautomeric forms with similar energy that can bind to other molecules through hydrogen bond donor–acceptor arrays.30 The IDATPE easily coordinated with creatinine via hydrogen bond formation between the NH group of creatinine and the –COO− group of IDA, as shown in Chart 2, with the result that a large group was attached to the TPE core and restricted the rotation of the phenyl rings. Therefore, the change of fluorescence intensity can be utilized as a simple and selective method for the determination and possible quantitation of creatinine.To examine the feasibility of the creatinine assay, creatinine quantitations in water and in artificial urine were performed. The IDATPE solutions in water and artificial urine were both luminescent at 375 nm in the absence of creatinine. In both fluids, the trends of IDATPE for creatinine quantitation are similar, as shown in Fig. 3(a), but a significant decrease in FL intensity is clearly observed in the artificial urine, which may attributable to the presence of other chemicals (ESI Table S1 and Fig. S4†) such as CH4N2O and C5H4N4O3 interacting with the IDATPE and significantly decreasing the FL intensity. An IDATPE concentration of 40 μM was chosen in this study. The effect of the incubation time of IDATPE with creatinine was studied. The FL intensity increased in the first 5 minutes and remained constant for 10 minutes (ESI Fig. S5†), so a duration of 5 minutes was chosen for the measurement. When the incubation time increased, the FL intensity again decreased, but the FL intensity measured at different times followed the same trend as the increase in creatinine concentration (ESI Fig. S6†).
As shown in Fig. 3(a), when a small amount of creatinine is added, the FL intensity of the IDATPE solution increases. Its FL intensity at 375 nm continued to rise with an increase in creatinine concentration up to ∼100 μM and ∼50 μM with an IDATPE concentration of 40 μM in artificial urine and water, respectively. The rates of the FL enhancement in those regions are almost constant. In the creatinine concentration range of 0–100 μM for artificial urine and 0–50 μM for water (zone I), the plot of FL intensity as a function of the logarithm of creatinine concentration is a linear line with a high correlation coefficient (Fig. 3(b)). With a further increase in creatinine concentration (zone II, 100 μM to 2 mM for artificial urine and 50 μM to 1 mM for water) while keeping the IDATPE concentration at 40 μM, the FL intensity is constant, indicating that IDATPE molecules have been consumed/bound with creatinine completely and there is a small amount of extra creatinine within the solution. If the creatinine concentration is further increased to 70 mM (zone III, 2–70 mM for artificial urine and 1–70 mM for water), the FL intensity continues to decrease. The IDATPE and creatinine formed large nanoparticles and precipitated in the solution, which caused the FL intensity to decrease continuously.
Sensitivity analysis of IDATPE for creatinine detection in water and artificial urine is shown in Fig. 3(b). It can be seen that IDATPE is more sensitive (slope = 90.493) to the change of creatinine concentration in water than (slope = 24.152) in artificial urine. In the real-life application, however, urine is the solution for UACR calculation, so artificial urine was selected for the next study.
3.4 Mutual interference between creatinine and HSA in artificial urine
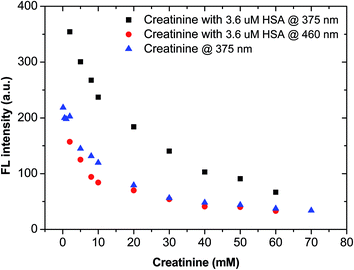
Clinically, HSA and creatinine both exist in urine, and albumin is known to interfere with colorimetric Jaffe rate reaction based routine creatinine assays,20 thus the mutual interference of the two species when detected by TPE bioprobes needs to be evaluated. A value of UACR > 30 mg g−1 may be a sign of CKD. Microalbuminuria is a term used to describe urine albumin levels not detected by a dipstick test, i.e., UACR is within 30–300 mg g−1. Under normal conditions, the molecular weight ratio of HSA/creatinine should be in the 10−4 order of magnitude (see ESI†), as shown in eqn (1). Higher molecular weight ratios may indicate a potential CKD risk. Therefore, the effects of a fixed concentration of HSA on creatinine detection by IDATPE and a fixed concentration of creatinine on HSA detection by BSPOTEP were evaluated in this study, with the molecular weight ratio of HSA/creatinine in the range of 101 to 104 to reflect clinical requirements. | (1) |
4. Conclusions
Chronic kidney disease (CKD) is a significant and growing public health problem throughout the world. Urine albumin-creatinine ratio (UACR) is a urine test that measures the ratio of urine albumin and urine creatinine and is used to standardise urine albumin measurements to indicate the presence CKD. In this study, a novel bioprobe with aggregation-induced emission (AIE) features, IDATPE, was used to detect and quantitate creatinine in water and artificial urine. An excellent correlation between FL light intensity and creatinine concentration was achieved within a certain range. IDATPE was also used with BSPOTPE, another bioprobe with AIE features, for human serum albumin (HSA) detection and quantitation to evaluate the mutual interference when these bioprobes were used together in artificial urine for creatinine and HSA analysis. Promising results were achieved and further evaluation is needed to gain more understanding of the IDATPE bioprobe for creatinine detection and of mutual interference in urine when AIE bioprobes are used for UACR calculation.Acknowledgements
This research was kindly supported by the Faculty of Science and Engineering, Flinders University, through the Establishment Grant and by the Shenzhen Municipality through the Science Technology and Innovation Commission (Grant No. GJHZ20160301163644983).References
- W. Couser, G. Remuzzi, S. Mendis and M. Tonelli, Kidney Int., 2011, 80, 1258 CrossRef PubMed.
- S. J. Chadban, E. M. Briganti, P. G. Kerr, D. W. Dunstan, T. A. Welborn, P. Z. Zimmet and R. C. Atkins, J. Am. Soc. Nephrol., 2003, 14, S131 CrossRef PubMed.
- S. L. White, K. R. Polkinghorne, R. C. Atkins and S. J. Chadhan, Am. J. Kidney Dis., 2010, 55, 660 CrossRef PubMed.
- Australian Institute of Health and Welfare, Chronic kidney disease hospitalisations in Australia 2000-01 to 2007-08, 2010.
- National Institutes of Health, U.S. Department of Health and Human Services, UACR and eGFR-in evaluating patients with diabetes for kidney disease, National Kidney Disease Education Program (NKDEP).
- S. Methven, J. P. Traynor, M. D. Hair, D. S. J. O'Reilly, C. J. Deighan and M. S. MacGregor, QJM, 2011, 104, 663 CrossRef CAS PubMed.
- D. W. Johnson, G. R. Jones, T. H. Mathew, M. J. Ludlow, S. J. Chadban, T. Usherwood, K. Polkinghorne, S. Colagiuri, G. Jerums, R. Macisaac and H. Martin, Med. J. Aust., 2012, 197, 224 Search PubMed.
- Pathology Harmony, UK, Harmonisation of Reference Intervals, Pathology Harmony Group, Clinical Biochemisty Outcomes, January 2011.
- B. D. Rose, Pathophysiology of renal disease, McGraw Hill, New York, 1987 Search PubMed.
- H. Martin, Clin. Biochem. Rev., 2011, 32, 97 Search PubMed.
- W. G. Miller and D. E. Bruns, Nephrol., Dial., Transplant., 2009, 24, 717 CrossRef PubMed.
- W. G. Miller, D. E. Bruns, G. L. Hortin, S. Sandberg, K. M. Aakre, M. J. McQueen, Y. Itoh, J. C. Lieske, D. W. Seccombe, G. Jones, D. M. Bunk, G. C. Curhan and A. S. Narva, Clin. Chem., 2009, 55, 24 CAS.
- M. M. Speeckaert, R. Speeckaert, L. van de Voorde and J. R. Delanghe, Crit. Rev. Clin. Lab. Sci., 2011, 48(2), 87 CrossRef CAS PubMed.
- K. K. Reddy and K. V. Gobi, Sens. Actuators, B, 2013, 183, 356 CrossRef CAS.
- R. Huskova, P. Chrastina, T. Adam and P. Schneiderka, Clin. Chim. Acta, 2004, 350, 99 CrossRef CAS PubMed.
- R. W. Bonsnes and H. H. Taussky, J. Biol. Chem., 1945, 158, 581 CAS.
- D. Heinegard and G. Tiderstrom, Clin. Chim. Acta, 1973, 43, 305 CrossRef CAS.
- X. Xing, X. Shi, M. Zhang, W. Jin and J. Ye, Chromatographia, 2008, 67, 985 CAS.
- J. C. Chen, A. S. Kumar, H. H. Chung, S. H. Chien, M. C. Kuo and J. M. Zen, Sens. Actuators, B, 2006, 115, 473 CrossRef CAS.
- S. Ohira, A. B. Kirk and P. K. Dasgupta, Anal. Biochem., 2009, 384(2), 238 CrossRef CAS PubMed.
- B. N. G. Giepmans, S. R. Adams, M. H. Ellisman and R. Y. Tsien, Science, 2006, 312, 217 CrossRef CAS PubMed.
- C. A. Royer, Chem. Rev., 2006, 106, 1769 CrossRef CAS PubMed.
- Y. Suzuki and K. Yokoyama, J. Am. Chem. Soc., 2005, 127, 17799 CrossRef CAS PubMed.
- D. Matulis, C. G. Baumann, V. A. Bloomfield and R. E. Lovrien, Biopolymers, 1999, 49, 451 CrossRef CAS PubMed.
- J. B. Birks, Photophysics of Aromatic Molecules, Wiley, London, 1970 Search PubMed.
- J. Mei, Y. Hong, J. W. Y. Lam, A. Qin, Y. Tang and B. Z. Tang, Adv. Mater., 2014, 26, 5429 CrossRef CAS PubMed.
- Y. Hong, J. W. Y. Lam and B. Z. Tang, Chem. Soc. Rev., 2011, 40, 5361 RSC.
- J. Mei, N. L. C. Leung, R. T. K. Kwok, J. W. Y. Lam and B. Z. Tang, Chem. Rev., 2015, 115, 11718 CrossRef CAS PubMed.
- Y. Hong, C. Feng, Y. Yu, J. Liu, J. W. Y. Lam, K. Q. Luo and B. Z. Tang, Anal. Chem., 2010, 82, 7035 CrossRef CAS PubMed.
- Y. Wang and Y. Ni, Talanta, 2014, 119, 320 CrossRef CAS PubMed.
- S. Mohammadi and G. Khayatian, Microchim. Acta, 2015, 182, 1379 CrossRef CAS.
- H. Tong, Y. Hong, Y. Dong, M. Haussler, Z. Li, J. W. Y. Lam, Y. Dong, H. H. Y. Sung, I. D. Williams and B. Z. Tang, J. Phys. Chem. B, 2007, 111, 11817 CrossRef CAS PubMed.
- S. Chutipongtanate and V. Thongboonkerd, Anal. Biochem., 2010, 402, 110 CrossRef CAS PubMed.
- R. S. Lanigan and T. A. Yamarik, Int. J. Toxicol., 2002, 21, 95 CrossRef CAS PubMed.
- C. Rose, A. Parker, B. Jefferson and E. Cartmell, Crit. Rev. Environ. Sci. Technol., 2015, 45(17), 1827 CrossRef CAS PubMed.
Footnotes |
| † Electronic supplementary information (ESI) available. See DOI: 10.1039/c6fd00153j |
| ‡ Equal contribution. |
| This journal is © The Royal Society of Chemistry 2017 |


