DOI:
10.1039/C5SM02679B
(Paper)
Soft Matter, 2016,
12, 3507-3513
Revealing the signature of dipolar interactions in dynamic spectra of polydisperse magnetic nanoparticles†
Received
29th October 2015
, Accepted 3rd February 2016
First published on 4th February 2016
Abstract
We investigate, via a modified mean field approach, the dynamic magnetic response of a polydisperse dipolar suspension to a weak, linearly polarised, AC field. We introduce an additional term into the Fokker–Planck equation, which takes into account dipole–dipole interaction in the form of the first order perturbation, and allows for particle polydispersity. The analytical expressions, obtained for the real and imaginary dynamic susceptibilities, predict three measurable effects: the increase of the real part low-frequency plateaux; the enhanced growth of the imaginary part in the low-frequency range; and the shift of the imaginary part maximum. Our theoretical predictions find an experimental confirmation and explain the changes in the spectrum.
1 Introduction
AC susceptometry is a widely used technique to analyse and characterise the dynamic dielectric and magnetic response in molecular and supramolecular liquids, solutions and suspensions.1–4 At the molecular level, this method can provide important information about the structure and distributions of both dipoles and charges depending on the details of the system.1,5–8 In the case of supramolecular liquids or solutions, depending on the frequency range, dielectric spectroscopy is an efficient tool to investigate polarisation effects, charge transport and collective dipolar fluctuations.1,4 Upon increasing the size of building blocks, AC susceptometry turns out to be very useful in elucidating the properties of nanoparticle suspensions, such as correlations in polyelectrolytes4,9 or magnetic relaxation in the case of magnetic soft materials.10–13 In magnetic soft matter, dynamic response is used to characterise the systems.14–16 The broad range of applications and the fundamental importance of molecular liquids can hardly be overestimated,3,4,17 but the impact of magnetic nanoparticles has also grown significantly in the last decade. The latter is related to the increasing interest in biological and medical applications of magnetic soft materials for diagnostics, therapy and in vitro analysis.18–21 One of the examples, based on the dynamic magnetic relaxation of magnetic particles, is so-called hyperthermia.22–25 In this method it is absolutely essential to predict the frequencies and the characteristic relaxation scales of the systems depending on the particle anisotropy, granulometric composition and magnetic phase concentration.26–28 Traditional methods to do this are based on the Debye-like approach, in which magnetic nanoparticles are considered to form an ideal superparamagnetic “gas”.2,27 Despite being very simple and clear, this method ignores the inherent and sometimes crucial interparticle correlations, providing as such the incorrect low-frequency behaviour. The latter is known to differ significantly from the so-called Langevin law, even for the systems where the dipolar interactions have the same order as thermal fluctuations.29 Stronger interparticle or intermolecular interactions can lead to a broad range of structuring30,31 and self-assembly11,32–35 in soft matter, which cannot but affect the dynamics of these systems. Several attempts to incorporate the dipole–dipole interaction into the theoretical description of dynamic spectra are known.36–39 The main conclusion of these studies is that the dipolar correlations slow down the dynamics and result in larger relaxation time-scales.36–38 The role of magnetic dipolar interactions in the specific absorption rate was actively studied both theoretically and experimentally.40–42 In these studies it was shown that the interparticle correlations might lead to the decrease and as well as the increase in the hypothermia efficiency depending on the magnetic particle size, thus underlining the crucial part of polydispersity and interactions on the dynamic magnetic response. Unfortunately, these approaches cannot be directly applied to predict or analyse the dynamic spectra of magnetic dipolar nanoparticle systems, as they lack an intrinsic feature of the latter, namely, particle polydispersity.
In this manuscript, we present a new theoretical approach based on the solution of the Fokker–Planck equation with an additional term in the form of the modified mean field. This term is the first order perturbation that allows for the magnetic dipole–dipole interaction in the system. In this framework, the particle polydispersity enters the equation in a very natural and straight-forward way. The resulting expressions for the initial dynamic susceptibility, i.e. dynamic response of the system to a weak, linearly polarised, harmonic, external field, have a closed analytical form and represent the first-order density corrections to the Debye spectrum. We apply our formalism to describe three measurable effects stemming from the interparticle correlations: the low-frequency regime of the real part of the dynamic susceptibility; its imaginary part maximum shift; and the low-frequency growth of the imaginary part. Analysing the effect of the dilution on the experimentally obtained spectra, we not only find a very good agreement of our theoretical results and the experimental data, but also conclude that the measured spectra do not reflect the superposition of the individual particle relaxations, but are the consequences of the complex interplay between these individual particles' dynamics, their polydispersity, and the interparticle interactions, both sterically and magnetically.
Although, here, we will focus on the simplest case of magnetic dipoles and magnetic fields, the approach put forward in this manuscript is rather generic and can be applied to the dipoles of different nature. Here, it is worth saying that for electric dipoles the approach has to be extended as both higher order corrections to the dipolar interactions and the currents might become relevant, see for example ref. 7 and references therein.
2 Theoretical approach
Let us consider a system of single-domain magnetic nanoparticles with number density n, suspended in a liquid magnetopassive carrier, in a long cylindrical tube, whose long axis coincides with Oz of the coordinate system. A weak linearly polarised ac magnetic field H = (0,0,h exp(iωt)) is applied along the Oz-axis (h is the amplitude; ω stands for the angular frequency; t denotes the time). At a given temperature T, each magnetic particle (magnetic core diameter x) has a magnetic dipole (μ, |μ| ≡ μ(x) = πM0x3/6). Here, M0 is the saturation magnetisation of the magnetic material. The orientation of each dipole is characterised by the angle θ = ∠(μ,H), and can be described by the probability density W(t,θ). This probability in reality is determined by three factors: thermal fluctuations, dipole-field coupling and interparticle interactions. In the classical approach, for a randomly chosen dipolar particle (1) this density (W(t,θ1) ≡ W(1)) is the solution of the Fokker–Planck equation:| |  | (1) |
Here, τ1 is the characteristic relaxation time of the particle (1). The function UH(1) describes the interaction of the first particle with an applied external field and has the form of Zeeman energy related to kT; α1 = μ1h/kT is the first particle Langevin parameter. Eqn (1) is usually used to describe the fluctuations of the single-domain magnetic particle magnetisation, assuming that the problem is polar-rotation independent.43,44 Besides that, eqn (1) holds true only for a system of noninteracting dipoles. The solution of eqn (1) should satisfy the probability normalisation condition, and also defines the magnetisation as a function of time:| |  | (2) |
One can notice that eqn (1) is a one-particle equation, and as such it depends on the properties of the given particle. In this way, it turns out to be very easy to allow for the inherent polydispersity of particles in dipolar soft matter. Thus, the expression for M(t) contains the averaging, not only over all orientations, but also over the granulometric composition p(x) (each particle has a dipole moment μ(x)). Assuming that the field amplitude h is small, the solution of eqn (1) can be easily found within the linear response approach:| |  | (3) |
In other words, for a system of polydisperse dipolar particles, we obtain familiar Debye linear response expressions for the dynamic initial (zero field) susceptibility χD(ω) = χD′(ω) − iχD′′(ω):| |  | (4) |
For many decades these classical formulas have been widely used for processing the dynamic spectra of both magnetic and electric responses. However, in reality they are valid for very diluted systems only, since in the zero-frequency limit the real part (4) predicts the Langevin value χL = n〈μ2〉/3kT for the static susceptibility, which is linearly dependent on the particle number density and contains average over all particle size dipole moments 〈μ2〉. It holds true only for vanishing n; even for low and moderate concentrations, a large number of experimental measurements and computer simulations29,45,46 prove the susceptibility to obey the parabolic n-dependence (19). Density dependence is also inherent to the position of the imaginary part maximum and is not reflected by the Debye model (see below Fig. 1). All this clearly underlines the necessity to include interdipolar correlations in the description of the dynamic spectra. At the same time, in the static case, the modified mean-field approach47 is proved to be a very accurate model to describe the equilibrium magnetic properties of moderately interacting dipolar systems. Thus, modifying eqn (1), we know the static limit of the perturbed solution. Under equilibrium conditions (static uniform magnetic field H, ω = 0) ∂W(1)/∂t = 0, i.e. the expression in square brackets in eqn (1) becomes zero| |  | (5) |
Here, we indicate the equilibrium orientation probability density with tilde. The solution of eqn (5) has the Boltzmann form
![[W with combining tilde]](https://www.rsc.org/images/entities/i_char_0057_0303.gif) 0(1) = (α1/sinh 0(1) = (α1/sinh![[thin space (1/6-em)]](https://www.rsc.org/images/entities/char_2009.gif) α1)exp(α1cos α1)exp(α1cos![[thin space (1/6-em)]](https://www.rsc.org/images/entities/char_2009.gif) θ1), θ1), |
and leads to the Langevin law for magnetisation:| |  | (6) |
valid only for an ideal paramagnetic gas. On the other hand, the equilibrium probability density should satisfy the equation, connecting the one-particle probability density with the pair distribution function g2(1,2):47| | 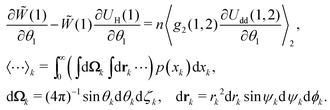 | (7) |
Here, the azimuthal and the polar angles (θk and ζk) define the orientation of the k-th magnetic moment in the spherical coordinate system, and the vector rk denotes the radius-vector of the k-th particle. The integration in angular brackets means the averaging over all degrees of freedom and over all possible sizes of the k-th particle. Upon expanding the pair distribution function g2(1,2) in series over the particle concentration n, and considering the presence of n in eqn (7), the pair distribution function might be expressed in the following form that corresponds to the lowest order of the thermodynamic perturbation method:| | g2(1,2) = ![[W with combining tilde]](https://www.rsc.org/images/entities/i_char_0057_0303.gif) (1) (1)![[W with combining tilde]](https://www.rsc.org/images/entities/i_char_0057_0303.gif) 0(2)Θ(1,2), 0(2)Θ(1,2), | (8) |
where Θ(1,2) is the Heaviside step-function, describing the impenetrability of two dipolar particles, and the function ![[W with combining tilde]](https://www.rsc.org/images/entities/i_char_0057_0303.gif) 0(2) is the probability density of the ideal paramagnetic gas. Substituting it in the right-hand part of eqn (7) and using the fact that
0(2) is the probability density of the ideal paramagnetic gas. Substituting it in the right-hand part of eqn (7) and using the fact that ![[W with combining tilde]](https://www.rsc.org/images/entities/i_char_0057_0303.gif) (1),
(1), ![[W with combining tilde]](https://www.rsc.org/images/entities/i_char_0057_0303.gif) 0(2) and Θ(1,2) do not depend on θ1 and that
0(2) and Θ(1,2) do not depend on θ1 and that ![[W with combining tilde]](https://www.rsc.org/images/entities/i_char_0057_0303.gif) (1) does not need to be averaged over the second dipole orientations, we obtain:
(1) does not need to be averaged over the second dipole orientations, we obtain:| |  | (9) |
So, the equilibrium Fokker–Planck equation (5) can be written as| |  | (10) |
where| |  | (11) |
The second term in Ũe(1) is the dipole–dipole interaction (Udd(1,2)) between particles (1) and (2), separated by the centre-to-centre distance |r| = r, and it is weight-averaged over all possible orientations, positions and sizes of the randomly chosen particle (2).
Returning to a non-equilibrium case, eqn (1)2 transforms into eqn (12)
| |  | (12) |
where instead of an equilibrium function
![[W with combining tilde]](https://www.rsc.org/images/entities/i_char_0057_0303.gif)
, its non-equilibrium analogue
W is used. In this case,
Ũe(1) should be also replaced by
Ue(1). In general, function
Ue, described by
eqn (13), denotes the dimensionless effective field (normalised by thermal energy
kT), with which a randomly chosen dipole moment interacts in the system. It consists of the external field and the effective field created by all other dipoles. This term provides a key difference between our approach and standard Weiss-like mean-field models.
| | | Ue(1) = UH(1) + n〈W0(2)Udd(1,2)Θ(1,2)〉2. | (13) |
Let us find the solution of
eqn (12). The ideal gas probability density
W0 is its solution if the
n-dependent term, allowing for interparticle interactions, is neglected. Using the expression in
eqn (3) for particle 2, we may calculate the effective field produced by all dipoles:
| | 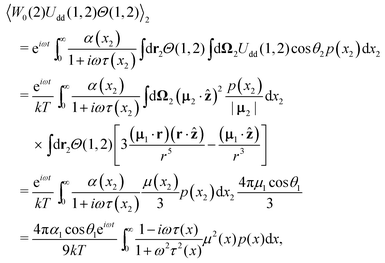 | (14) |
where we introduce the unit vector
ẑ of the
Oz-axis. Note that the integral d
r over translational degrees of freedom is dependent on the shape of the container; here, the usage of the long cylindric tube allows us to avoid the demagnetisation effects. The technical details of the integration can be found in
ref. 47. Hence, the effective field term is
| |  | (15) |
The integration here does not depend on the index of a chosen particle. As a result, the effective field
Ue(1) turns out to be expressed in terms of Debye susceptibilities. We can present the solution of
eqn (12) in the form of the sum of the zeroth and the first harmonic
| | W(1) = 1 + α1A1(ω)cos![[thin space (1/6-em)]](https://www.rsc.org/images/entities/char_2009.gif) θ1eiωt, θ1eiωt, | (16) |
where the zeroth harmonics is simply equal to unity. The first harmonic amplitude
A1(
ω) =
A1′(
ω) −
iA1′′(
ω) is complex, and its real and imaginary parts satisfy the linear set of equations:
| |  | (17) |
The dynamic susceptibility
χ(
ω) is also defined by
A1, and we obtain the expressions for the real and imaginary parts of the spectrum in the interacting dipolar system:
| | 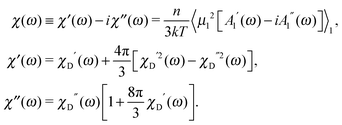 | (18) |
The novelty of the described above approach is to introduce the second term for the effective field produced by all dipole moments (n〈W0(2)Udd(1,2)Θ(1,2)〉2) into the expression for Ue(1) to construct eqn (12).
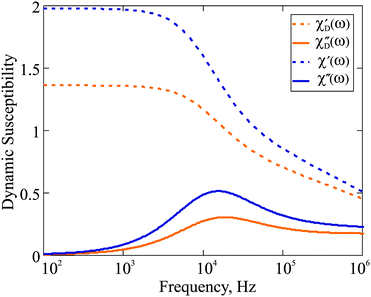 |
| | Fig. 1 Dynamic susceptibility 4πχ(ω) of F1: comparison of the Debye ideal gas model to the expressions in eqn (18). The frequency range is given on the log-scale. Here, φm = 0.06; T = 293 K; K = 20 kJ m−3; effective viscosity η = 2 × 10⁻³ Pa s; M0 = 480 kA m−1. | |
This term has a meaning of the effective field acting on each particle due to the presence of all others. In the case of the static applied field (ω → 0), the perturbation theory of the first order in n correctly leads to a well-tested modified mean field approach47 expression for the initial susceptibility:
| | | χ(0) = χL(1 + 4πχL/3). | (19) |
In the latter, the effective field is expressed in terms of Langevin susceptibility
χL. Importantly, the expressions in
eqn (18) are the exact results of the first order perturbation theory and, being expressed in terms of Debye dynamic susceptibilities, have the quadratic precision in
n. Besides that, in the zero-frequency limit, the real part
χ′(
ω → 0) =
χ(0) (see,
eqn (19)). In contrast to the aforementioned attempts to allow for interparticle interactions,
36–39 this approach extends the concept of the modified mean field, does not contain any Weiss-type singularities, and takes accurately into account the part of polydispersity. The latter is of crucial importance when applying the model to describe real experimental systems.
Below, as one of the measurable characteristics of the spectrum, we analyse the dependence of the frequency ω*, at which the maximum of the imaginary part is reached, which, as mentioned above, does not depend on n in the framework of standard eqn (1). We can define the value of ω* in our formalism by solving
| |  | (20) |
For the polydisperse case, the solution can be only found implicitly:
| | 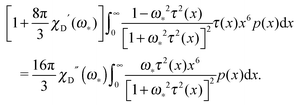 | (21) |
In the monodisperse case, one can replace
p(
x) by the
δ-function corresponding to a chosen particle size. This substitution, after some algebra, leads to the equation for
ω*:
| |  | (22) |
The ratio in the brackets (
ω*(0)/
ω*(
φm))
−1 shows the shift of the maximum position with respect to its zero-concentration value (
ω*(0)). The solution of the latter bi-quadratic equation always exists, however, our approach is the low-order perturbation in particle concentration
n,
i.e. in the magnetic phase fraction
φm. So, it is only meaningful to find the solution in the linear order in
χL ∝
φm:
| |  | (23) |
In the following we will test expressions from eqn (18) by comparing the latter to the experimental results for moderately interacting magnetic fluids.
3 Results and discussion
One of the known mechanisms for a dipole moment to relax in a carrier liquid is the so-called Brownian rotation. Its characteristic time τB = 3ηv/kT is determined by the particle hydrodynamic volume v = πxh3/6 (xh being a hydrodynamic particle diameter), and the carrier viscosity η. In the case of magnetic nanoparticles, their dipole can also relax via the Neél mechanism, which does not involve the rotation of the particle as a whole. Rather, it is due to the fluctuation of the dipole moment within the crystalline lattice of the nanoparticle.48 The latter mechanism has a characteristic time τN = τ0exp(Kvm/kT), which depends on the particle characteristic relaxation time scale τ0 ∼ 10−9 s, anisotropy constant K, and its magnetic core volume vm = πx3/6. For each dipole in the system, its most probable relaxation is the shortest of τN and τB, which is why it is common to use the following expression for the relaxation time as a function of the particle size: τ(x) = τNτB/(τN + τB).
In order to illustrate the model proposed above for the dynamic response, we use two ferrofluids with well-defined particle-size distributions that can be accurately described using gamma-distribution:
| |  | (24) |
The first ferrofluid, F1 (magnetite nanoparticles in kerosene, stabilised with oleic acid,
x0 = 1.23 nm;
a = 4.95,
xh =
x + 6 nm), was extensively studied by a combination of experiment, theory and computer simulations in
ref. 29, where the static magnetic properties were analysed. In this work, the basic sample was diluted to obtain another 6 samples with the same granulometric composition, but different magnetic material contents. In the static case, we showed that the modified mean field approach is a suitable model to describe the initial susceptibility and the magnetisation curves for each sample. Here, we use this system to analyse the dynamic response, because we know that the static limit
eqn (19) of the proposed model
eqn (18) is correct. The commonly used Debye ideal gas model (4) does not provide this kind of
ω → 0 asymptote, and as such is expected to provide a quantitatively different susceptibility spectrum. This is fully confirmed by
Fig. 1, where we plot the dynamic susceptibility for the F1 with magnetic phase concentration (
φm = 0.06) calculated using both aforementioned formalisms. In addition to the difference in the values of
χ′, one also sees that for
χ′′, both the height of the maximum and its position are not the same if the interparticle correlations are properly taken into account. Note that the maximum of
χ′′ is of particular importance, as it determines the characteristic frequency of the corresponding dipolar fluid. In order to analyse the influence of particle concentration on the dynamic spectrum, in
Fig. 2, we plot
χ(
ω)/
χ(0) for three different values of
φm. The spectrum visibly changes on dilution: the maximum of
χ′ shifts to higher
ω when
φm decreases. In the inset, the frequency (
ω*(
φm)), at which the maximum of the imaginary part of the spectrum is reached, is plotted normalised by
ω*(0). In the same inset of
Fig. 2, we plot the theoretical prediction for reduced
ω* for a monodisperse system with the same value of
χL,
i.e. with the same value of the mean-squared magnetic moment
eqn (23). It can be seen that the relative shift of
ω* is stronger in the monodisperse system. As a consequence of the following: in a polydisperse system, the value of
ω* is determined by a relatively small number of Brownian particles that slowly grow with
φm, whereas in a corresponding monodisperse system all particles contribute to the same relaxation. However, even for a polydisperse ferrofluid, this effect is large enough to be measured; the experiment, however, should be performed accurately without changing the granulometric composition on dilution. To the best of our knowledge, only one experimental work is available
11 that satisfies the aforementioned conditions. In the plot below (
Fig. 3), we compare our theoretical prediction to the results measured for system C,
11 which we address as F2 (ferrum-cobalt particles in decalin, stabilised by polyisobuten). Following the experimental strategy, we analyse the spectra of F2 and F2 diluted by 10 times. After fitting gamma-distribution
eqn (24) to that of
ref. 11 we obtained
x0 = 0.38 nm,
a = 17, and
xh =
x + 17 nm. Even for a low concentrated reference sample, the value of
ω* shifts by 10 percent on 10 time dilution. As it is stated in
ref. 11, in sample F2 no aggregates were observed; this is why the changes in the dynamic spectrum are to be attributed to the dipolar interparticle correlations only, and the prediction of
eqn (18) is fully capable of describing them.
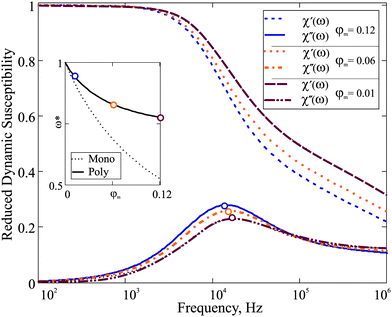 |
| | Fig. 2 Reduced dynamic susceptibility χ(ω)/χ(0) of F1: the effect of dilution. Three spectra are plotted for φm = 0.12, 0.06, 0.01 in blue, orange and bordeaux, respectively. The frequency range is given on the log-scale. Inset: The dependence ω*(φm)/ω*(0). The solid line is the solution of eqn (21); the dotted line is a corresponding monodisperse sample eqn (23). | |
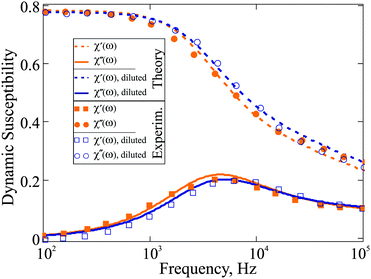 |
| | Fig. 3 Dynamic susceptibility 4πχ(ω) of F2: comparison of the experimental data to the expressions in eqn (18). The frequency range is given on the log-scale. Here, the mass fraction of iron for the basic sample is 0.061; T = 293 K; K = 100 kJ m−3; effective viscosity η = 5 × 10⁻³ Pa s; M0 = 1490 kA m−1. Reference sample: orange, filled symbols; 10 time diluted sample: blue, empty symbols (rescaled to be visible). | |
The other measurable effect can be observed when analysing the initial slope κ of χ′′:
| |  | (25) |
which depends parabolically on the particle concentration through
χL and contains a very important characteristic of the system, namely
τchar. The latter has the meaning of the relaxation time averaged over the system granulometric composition with the weight of mean-squared particle dipole moment. From
eqn (4), the analogous slope
κD is linear in concentration, but contains the same characteristic time scale as a prefactor.
In Fig. 4 we plot κ(φm) for F1 and F2 as predicted by Debye ideal gas model eqn (4) and by the modified mean field approach eqn (18). The results of the two models differ substantially. The absolute value of these deviations is different for F1 and F2. In the case of F1, the quadratic correction from χL is not very large, because the particles in F1 are rather magnetically weak. On the other hand, particles in F2 are predominantly magnetically hard (very high crystallographic magnetic anisotropy), and in this case, the quadratic term in χL is much larger. The actual values of the slope are determined by the value of τchar. Even though p(x) is broader in the case of F1, the value of τchar for F2 is approximately an order of magnitude larger, due to the dominance of the Brownian slower relaxations in it. Notice that, had we used the Debye model to extract τchar from the experimental measurements, at a finite magnetic phase concentration of approximately 5 percent, the error due to the neglected interparticle correlations would have been as high as the factor of two.
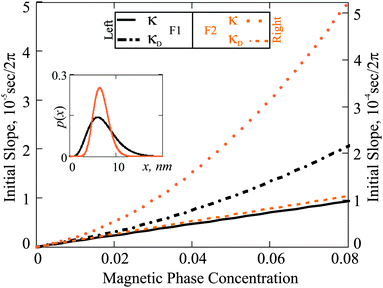 |
| | Fig. 4 Initial slope (κ) as a function of φm: comparison of the Debye ideal gas model to the expressions in eqn (25). The results for F1 (black) are associated with the left ordinate axis; the results for F2 (orange) with the right one. Inset: Particle size distributions versus magnetic core diameter (x). | |
4 Conclusions
Our study demonstrates the impact of the dipolar interparticle correlations on the dynamic susceptibility. By introducing the interparticle interactions and the inherent polydispersity into the theoretical model, we show that the dynamic spectra are not a simple reflection of the individual dipole relaxations in the system, but are rather defined by a complex weave of granulometric composition, individual particle properties, their interaction strengths, and particle concentration. There are three spectral characteristics that are especially sensitive to the nonideality of the system: the low-frequency behaviour of the real part; the low-frequency growth of the imaginary part; and the maximum of the imaginary part. Interactions lead to an overall decrease of the characteristic time-scales for a given polydisperse dipolar system on dilution. This result is especially important for medical applications of dipolar systems, where the correct prediction of the working frequency range defines the efficiency of the treatment.19,40–42 As we show in the present manuscript, the analysis of the spectra based on the Debye ideal gas approximation can lead to highly pronounced inconsistency in the determination of characteristic relaxations. We are confident that the presented theoretical predictions will serve as a motivation for further and more detailed AC susceptometry experiments.
Acknowledgements
This research was supported by Russian Science Foundation Grant No. 15-12-10003. S. S. K. is grateful to the FWF START-Projekt Y 627-N27 and EU-Project 642774 ETN-Colldense. We also thank Michaela McCaffrey for language suggestions.
References
-
F. Kremer and A. Schönhals, Broadband Dielectric Spectroscopy, 2003 Search PubMed.
-
Y. L. Raikher and V. I. Stepanov, Nonlinear Dynamic Susceptibilities and Field-Induced Birefringence in Magnetic Particle Assemblies, John Wiley and Sons Inc., 2004, pp. 419–588 Search PubMed.
- M. Michl, T. Bauer, P. Lunkenheimer and A. Loidl, Phys. Rev. Lett., 2015, 114, 067601 CrossRef CAS PubMed.
-
V. Raicu and Y. Feldman, Dielectric Relaxation in Biological Systems: Physical Principles, Methods, and Applications, 2015 Search PubMed.
- L. P. Singh and R. Richert, Phys. Rev. Lett., 2012, 109, 167802 CrossRef PubMed.
- Z. Wojnarowska, Y. Wang, J. Pionteck, K. Grzybowska, A. P. Sokolov and M. Paluch, Phys. Rev. Lett., 2013, 111, 225703 CrossRef CAS PubMed.
-
M. Sega, S. S. Kantorovich, A. Arnold and C. Holm, Recent Advances in Broadband Dielectric Spectroscopy, Springer, Netherlands, 2013, pp. 103–122 Search PubMed.
- M. Sega, S. S. Kantorovich, C. Holm and A. Arnold, J. Chem. Phys., 2014, 140, 211101 CrossRef CAS PubMed.
- A. Kahouli, J. Valle-Orero, J.-L. Garden and M. Peyrard, Eur. Phys. J. E: Soft Matter Biol. Phys., 2014, 37, 82 CrossRef PubMed.
- A. Pshenichnikov and A. Lebedev, J. Exp. Theor. Phys., 1989, 68, 498–502 Search PubMed.
- B. H. Erné, K. Butter, B. W. M. Kuipers and G. J. Vroege, Langmuir, 2003, 19, 8218–8225 CrossRef.
- S. H. Chung, A. Hoffmann, S. D. Bader, C. Liu, B. Kay, L. Makowski and L. Chen, Appl. Phys. Lett., 2004, 85, 2971–2973 CrossRef CAS.
- R. Ferguson, A. Khandhar, C. Jonasson, J. Blomgren, C. Johansson and K. Krishnan, IEEE Trans. Magn., 2013, 49, 3441–3444 CrossRef PubMed.
- C. Barrera, V. Florian-Algarin, A. Acevedo and C. Rinaldi, Soft Matter, 2010, 6, 3662–3668 RSC.
- V. L. Calero-DdelC, D. I. Santiago-Quinonez and C. Rinaldi, Soft Matter, 2011, 7, 4497–4503 RSC.
- R. S. M. Rikken, R. J. M. Nolte, J. C. Maan, J. C. M. van Hest, D. A. Wilson and P. C. M. Christianen, Soft Matter, 2014, 10, 1295–1308 RSC.
- S. Pawlus, S. Klotz and M. Paluch, Phys. Rev. Lett., 2013, 110, 173004 CrossRef CAS PubMed.
- J. Durán, J. Arias, V. Gallardo and A. Delgado, J. Pharm. Sci., 2008, 97, 2948–2983 CrossRef PubMed.
- Q. A. Pankhurst, N. T. K. Thanh, S. K. Jones and J. Dobson, J. Phys. D: Appl. Phys., 2009, 42, 224001 CrossRef.
- K. M. Krishnan, IEEE Trans. Magn., 2010, 46, 2523–2558 CrossRef CAS PubMed.
- M. M. van Oene, L. E. Dickinson, F. Pedaci, M. Köber, D. Dulin, J. Lipfert and N. H. Dekker, Phys. Rev. Lett., 2015, 114, 218301 CrossRef PubMed.
- R. Hergt, R. Hiergeist, I. Hilger, W. Kaiser, Y. Lapatnikov, S. Margel and U. Richter, J. Magn. Magn. Mater., 2004, 270, 345–357 CrossRef CAS.
- F. Sonvico, S. Mornet, S. Vasseur, C. Dubernet, D. Jaillard, J. Degrouard, J. Hoebeke, E. Duguet, P. Colombo and P. Couvreur, Bioconjugate Chem., 2005, 16, 1181–1188 CrossRef CAS PubMed.
- J.-P. Fortin, C. Wilhelm, J. Servais, C. Ménager, J.-C. Bacri and F. Gazeau, J. Am. Chem. Soc., 2007, 129, 2628–2635 CrossRef CAS PubMed.
- Y. L. Raikher, V. V. Rusakov and R. Perzynski, Soft Matter, 2013, 9, 10857–10865 RSC.
- R. Müller, R. Hergt, M. Zeisberger and W. Gawalek, J. Magn. Magn. Mater., 2005, 289, 13–16 CrossRef.
- Y. L. Raikher and V. Stepanov, J. Magn. Magn. Mater., 2014, 368, 421–427 CrossRef.
- M. Boskovic, G. F. Goya, S. Vranjes-Djuric, N. Jovic, B. Jancar and B. Antic, J. Appl. Phys., 2015, 117, 103903 CrossRef.
- A. Ivanov, S. Kantorovich, E. Reznikov, C. Holm, A. Pshenichnikov, A. Lebedev, A. Chremos and P. Camp, Phys. Rev. E: Stat., Nonlinear, Soft Matter Phys., 2007, 75, 061405 CrossRef PubMed.
- J. Köfinger and C. Dellago, Phys. Rev. Lett., 2009, 103, 080601 CrossRef PubMed.
- D. Heinrich, A. R. Goñi, A. Smessaert, S. H. L. Klapp, L. M. C. Cerioni, T. M. Osán, D. J. Pusiol and C. Thomsen, Phys. Rev. Lett., 2011, 106, 208301 CrossRef CAS PubMed.
- M. Klokkenburg, R. Dullens, W. Kegel, B. Erné and A. Philipse, Phys. Rev. Lett., 2006, 96, 037203 CrossRef PubMed.
- V. Domenici, C. A. Veracini and B. Zalar, Soft Matter, 2005, 1, 408–411 RSC.
- S. Kantorovich, A. O. Ivanov, L. Rovigatti, J. M. Tavares and F. Sciortino, Phys. Rev. Lett., 2013, 110, 148306 CrossRef PubMed.
- C. E. Alvarez and S. H. L. Klapp, Soft Matter, 2013, 9, 8761–8770 RSC.
- A. Y. Zubarev and A. V. Yushkov, J. Exp. Theor. Phys., 1998, 87, 484 CrossRef.
- B. U. Felderhof and R. B. Jones, J. Phys.: Condens. Matter, 2003, 15, 4011 CrossRef CAS.
- P. Ilg and S. Hess, Z. Naturforsch., A: Phys. Sci., 2003, 58, 589–600 CrossRef CAS.
- P. M. Déjardin and F. Ladieu, J. Chem. Phys., 2014, 140, 034506 CrossRef PubMed.
- E. L. Verde, G. T. Landi, J. A. Gomes, M. H. Sousa and A. F. Bakuzis, J. Appl. Phys., 2012, 111, 123902 CrossRef.
- M. A. Martens, R. J. Deissler, Y. Wu, L. Bauer, Z. Yao, R. Brown and M. Griswold, Med. Phys., 2013, 40, 022303 CrossRef PubMed.
- G. T. Landi, Phys. Rev. B: Condens. Matter Mater. Phys., 2014, 89, 014403 CrossRef.
- W. F. Brown, J. Appl. Phys., 1963, 34, 1319–1320 CrossRef.
- W. Brown, IEEE Trans. Magn., 1979, 15, 1196–1208 CrossRef.
- A. F. Pshenichnikov and A. V. Lebedev, J. Chem. Phys., 2004, 121, 5455–5467 CrossRef CAS PubMed.
- D. S. Wood and P. J. Camp, Phys. Rev. E: Stat., Nonlinear, Soft Matter Phys., 2011, 83, 011402 CrossRef PubMed.
- A. O. Ivanov and O. B. Kuznetsova, Phys. Rev. E: Stat., Nonlinear, Soft Matter Phys., 2001, 64, 041405 CrossRef CAS PubMed.
- A. Balan, P. M. Derlet, A. F. Rodríguez, J. Bansmann, R. Yanes, U. Nowak, A. Kleibert and F. Nolting, Phys. Rev. Lett., 2014, 112, 107201 CrossRef PubMed.
Footnote |
| † Electronic supplementary information (ESI) available. See DOI: 10.1039/c5sm02679b |
|
| This journal is © The Royal Society of Chemistry 2016 |
Click here to see how this site uses Cookies. View our privacy policy here.  Open Access Article


![[W with combining tilde]](https://www.rsc.org/images/entities/i_char_0057_0303.gif) 0(1) = (α1/sinh
0(1) = (α1/sinh![[thin space (1/6-em)]](https://www.rsc.org/images/entities/char_2009.gif) α1)exp(α1cos
α1)exp(α1cos![[thin space (1/6-em)]](https://www.rsc.org/images/entities/char_2009.gif) θ1),
θ1),

![[W with combining tilde]](https://www.rsc.org/images/entities/i_char_0057_0303.gif) (1)
(1)![[W with combining tilde]](https://www.rsc.org/images/entities/i_char_0057_0303.gif) 0(2)Θ(1,2),
0(2)Θ(1,2),![[W with combining tilde]](https://www.rsc.org/images/entities/i_char_0057_0303.gif) 0(2) is the probability density of the ideal paramagnetic gas. Substituting it in the right-hand part of eqn (7) and using the fact that
0(2) is the probability density of the ideal paramagnetic gas. Substituting it in the right-hand part of eqn (7) and using the fact that ![[W with combining tilde]](https://www.rsc.org/images/entities/i_char_0057_0303.gif) (1),
(1), ![[W with combining tilde]](https://www.rsc.org/images/entities/i_char_0057_0303.gif) 0(2) and Θ(1,2) do not depend on θ1 and that
0(2) and Θ(1,2) do not depend on θ1 and that ![[W with combining tilde]](https://www.rsc.org/images/entities/i_char_0057_0303.gif) (1) does not need to be averaged over the second dipole orientations, we obtain:
(1) does not need to be averaged over the second dipole orientations, we obtain:


![[W with combining tilde]](https://www.rsc.org/images/entities/i_char_0057_0303.gif) , its non-equilibrium analogue W is used. In this case, Ũe(1) should be also replaced by Ue(1). In general, function Ue, described by eqn (13), denotes the dimensionless effective field (normalised by thermal energy kT), with which a randomly chosen dipole moment interacts in the system. It consists of the external field and the effective field created by all other dipoles. This term provides a key difference between our approach and standard Weiss-like mean-field models.
, its non-equilibrium analogue W is used. In this case, Ũe(1) should be also replaced by Ue(1). In general, function Ue, described by eqn (13), denotes the dimensionless effective field (normalised by thermal energy kT), with which a randomly chosen dipole moment interacts in the system. It consists of the external field and the effective field created by all other dipoles. This term provides a key difference between our approach and standard Weiss-like mean-field models.

![[thin space (1/6-em)]](https://www.rsc.org/images/entities/char_2009.gif) θ1eiωt,
θ1eiωt,


