 Open Access Article
Creative Commons Attribution 3.0 Unported Licence
Twenty years of ambient observations of nitrogen oxides and specified hydrocarbons in air masses dominated by traffic emissions in Germany
Christian
Ehlers
,
Dieter
Klemp
,
Franz
Rohrer
*,
Djuro
Mihelcic
,
Robert
Wegener
,
Astrid
Kiendler-Scharr
and
Andreas
Wahner
Research Centre Jülich, Institute IEK-8:Troposphere, 52428 Jülich, Germany. E-mail: f.rohrer@fz-juelich.de
First published on 9th December 2015
Abstract
The analysis of the individual composition of hydrocarbon (VOC) mixtures enables us to transform observed VOC-concentrations into their respective total VOC-reactivity versus OH radicals (RVOC = Σ(kOH+VOCi × [VOCi])). This is particularly useful because local ozone production essentially depends on this single parameter rather than on the details of the underlying hydrocarbon mixture (Klemp et al., Schriften des Forschungszentrums Jülich, Energy & Environment, 2012, 21). The VOC composition also enables us to pin down the major emission source of hydrocarbons in urban areas to be petrol cars with temporarily reduced catalyst efficiency (the so-called cold-start situation) whereas the source of nitrogen oxides (NOx = NO + NO2) is expected to be nowadays dominated by diesel cars. The observations in the vicinity of main roads in German cities show a decrease in the ratio of OH reactivities of VOC and NO2 (RVOC/RNO2) by a factor of 7.5 over the time period 1994–2014. This is larger than the expected decrease of a factor of 2.9 taking estimated trends of VOC and NOx traffic emissions in Germany (Umweltbundesamt Deutschland, National Trend Tables for the German Atmospheric Emission Reporting, 2015), during this time period. The observed reduction in the RVOC/RNO2 ratio leads to a drastic decrease in local ozone production driven by the reduction in hydrocarbons. The analysis reveals that the overall reduction of ozone production benefits from the low decrease of NOx emissions from road traffic which is a consequence of the eventual absence of catalytic converters for nitrogen oxide removal in diesel cars up to now.
1 Introduction
Over the last 20 years (1994–2014), the compliance with ozone regulations of the European Union (EU) for the protection of human health has slowly improved in Germany. On the other hand, the average surface ozone concentration measured at the German Global Atmosphere Watch (GAW) station in Hohenpeissenberg has remained almost constant over the last 25 years (Fig. 1). To put this into a proper perspective, these observations in Germany can be compared to ozone data from the GAW station at the western coast of Europe in Mace Head, Ireland. Ozone is photochemically produced in the troposphere by the degradation of VOC in the presence of nitrogen oxides,1 primarily over continents. In the troposphere, ozone is relatively long lived and has a life-time of about one month. As a consequence, its near-surface concentration shows only little variability over large areas. The predominantly westerly winds transport so-called background ozone from America to Europe's West Coast (see ref. 2). Observations at Mace Head give a very good picture of these ozone background concentrations which are then altered by photochemical production and surface deposition during the further transport of air parcels over France and Germany towards the East. At Hohenpeissenberg, the observed annually averaged surface ozone concentrations are larger then those at Mace Head during the 1990s, similar from 1999 to 2006, and smaller after 2007. The magnitude of this decrease at Hohenpeissenberg relative to Mace Head is on the order of 10–15% over 25 years. In fact, this decrease has not only been caused by changes in Germany since air parcels on their way from the Atlantic also pass France and other European countries. But nevertheless these observations show a general trend towards smaller ozone production in Western Europe.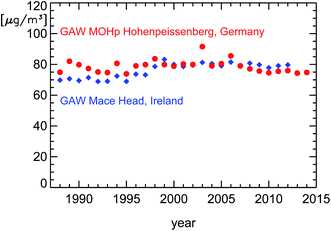 | ||
| Fig. 1 Averaged annual surface ozone concentrations observed at the GAW stations Mace Head,2 Ireland (blue diamonds), and Hohenpeissenberg, Germany (red circles). The data from Hohenpeissenberg for the time period until 2010 are taken from the literature.3 The later data were kindly supplied by the German Meteorological Service (DWD) and are preliminary. | ||
The annually averaged concentrations themselves at Hohenpeissenberg are far lower than the target value for the protection of human health defined in the EU ozone regulations of 120 μg m−3 (for averaged episodes of 8 hours). A better insight into ozone reduction achievements in Germany is possible by looking at episodes of large ozone concentrations, popularly called ozone-alerts (see also Section 4.3). And here the improvements are obvious. Especially, the violations of the EU ozone alarm threshold (240 μg m−3) vanished completely4 (Fig. 2). These effects are likely to be caused largely by trends of pollutants emitted by road traffic in city districts. Here we show ambient observations of nitrogen oxides (NOx) and hydrocarbons (VOC) in urban environments spanning this time period. To understand the observed trends of the ratio of VOC/NOx in inner city districts, we will first discuss the basic features of diesel and petrol motors, the effect of catalytic converters, and the trend of cars and fuel use in Germany.
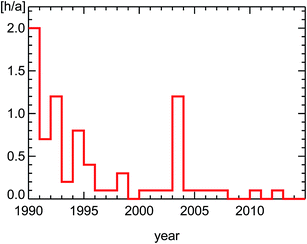 | ||
| Fig. 2 Average number of hours per year for all survey stations in Germany exceeding the European ozone alarm value (240 μg m−3, see ref. 4). | ||
1.1 Basic features of diesel and petrol engines
The major difference between diesel and petrol engines is the concentration of oxygen inside the cylinders when the fuel vapor is ignited. That depends on the fuel-to-air ratio λ which is determined by the engine management, nowadays handled by an on-board computer. If the amount of oxygen matches the requirement of stoichiometrical combustion, all of the fuel is burned and no oxygen is left over. This is the case in the engine of a petrol car. That specific fuel-to-oxygen ratio is called λ = 1. Its compliance is monitored at all times by a λ-sonde and adjusted by the on-board computer within very small limits. Diesel engines use a very large excess of oxygen at approximately λ = 3 which does not permit verification by a λ-sensor. Such an oxygen excess has important consequences for the emissions of pollutants by the car. Due to the larger amount of air mixed with the fuel, the temperature inside the cylinder of a diesel car is lower than that of a petrol car. That is responsible for the smaller NOx emissions of a diesel compared to a petrol engine5 because higher temperatures favor the production of nitrogen oxides.5 In both types of engines NOx is almost exclusively emitted in the form of NO. A higher amount of oxygen favors the oxidation of VOC so that their emission is also much smaller in diesel than in petrol cars. Fig. 3 illustrates these basic features of the two engine concepts. As a consequence, in the absence of catalytic converters, diesel cars emit much less VOC and NOx than petrol cars. That was the case until 1985 (introduction of the G-Kat in Germany) when subsequently for both kinds of car catalytic converters were introduced to meet the requirements of a more stringent environmental policy.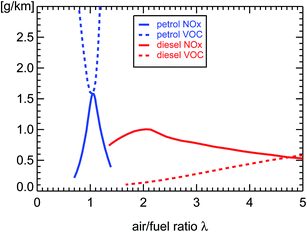 | ||
| Fig. 3 NOx and VOC emissions of diesel and petrol passenger cars without catalytic converters; replotted using published mixing ratio measurements (see ref. 6) multiplied with λ to be proportional to g km−1 and then scaled to the values of Table 1 at λ = 1 for petrol and λ = 3 for diesel passenger cars. | ||
1.2 Catalytic converters for diesel and petrol engines
For petrol cars, the so called 3-way-catalyst or G-Kat oxidizes CO and VOC with oxygen to CO2 and reduces NO with CO to N2 and CO2. Since oxidation and reduction processes are taking place at the same time, this kind of catalytic converter relies on the exact compliance of a stoichiometrical combustion at λ = 1 and therefore on the use of a λ-sonde. A little bit on either side of λ = 1 and either NO or CO-VOC are less efficiently converted by the catalyst. When this kind of converter is warm enough, it can reduce VOC and NOx emissions by a factor of 100 (VOC) and 10 (NOx) (see Table 1 and Fig. 4).| Type of car | Petrol cars | Diesel cars | ||
|---|---|---|---|---|
| NOx (as NO2) | VOC (as HC) | NOx (as NO2) | VOC (as HC) | |
| a Date of official implementation of the respective EURO norm.9 b VOC + NOx. c Observed values, see Fig. 4 and 5. d See ref. 10. | ||||
| Without catalytic converter8 | 1.39–1.76 | 1.09–2.08 | 0.63–0.95 | 0.14–0.39 |
| EURO-1 (1.1.1993a) | 0.97b | 1.13b | ||
| EURO-2 (1.1.1997a) | 0.5b | 0.90b | ||
| EURO-3 (1.1.2001a) | 0.15 | 0.20 | 0.50 | 0.56b |
| D4d | 0.08 | 0.07 | ||
| (This paperc, 2001–2002) | 0.21 | 0.09 | 0.32 | 0.008 |
| EURO-4 (1.1.2006a) | 0.08 | 0.10 | 0.25 | 0.30b |
| EURO-5 (1.1.2011a) | 0.06 | 0.10 | 0.18 | 0.23b |
| EURO-6 (1.9.2015a) | 0.06 | 0.10 | 0.08 | 0.17b |
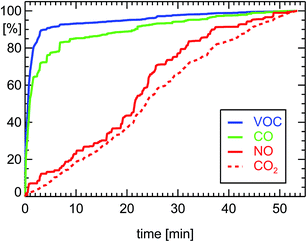 | ||
| Fig. 4 Normalized cumulative emissions of CO (100% = 23.8 g corresponding to 0.80 g km−1), CO2 (262 g km−1), NO (0.205 g km−1 as NO2), and VOC (0.088 g km−1 as HC) derived during on-board measurements of a petrol car (see ref. 7) during a drive of 29.7 km length 11.07.2001 in Munich (passenger petrol car, year of manufacture: 2000, 85 kW, G-Kat, exhaust norm D4). | ||
Since diesel engines operate at an oxygen excess (λ = 3), the so called diesel-oxidation-catalyst or DOC can only oxidize CO and VOC to CO2, but cannot reduce NOx at the same time. The reduction of CO and VOC by a warm DOC is also a factor of 100 (see Table 1 and Fig. 5). The higher oxygen amount in the exhaust of diesel cars is responsible for a shift of the NO2/NOx ratio by the DOC (depending on the catalytic material) towards larger NO2 and smaller NO concentrations (Fig. 5). In comparison, petrol cars almost exclusively emit NO and only small amounts of NO2.
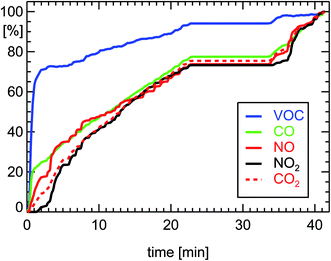 | ||
| Fig. 5 Normalized cumulative emissions of CO (100% = 2.09 g corresponding to 0.116 g km−1), CO2 (180 g km−1), NO (0.149 g km−1 as NO2), NO2 (0.173 g km−1), and VOC (0.008 g km−1 as HC) derived during measurements of a diesel car (see ref. 7) during a drive of 18.0 km length 27.11.2002 executing a FTP-75-cycle (passenger diesel car, year of manufacture: 2002, 105 kW, DOC, exhaust norm EURO3). | ||
The efficiency of both kinds of converters, G-Kat and DOC, for the reduction of VOC depends on the temperature of their catalytic material. During the first part of a drive, when engine and converter are at ambient temperature, the converters have to be heated up by the exhaust gas to enable a significant catalytic effect. This warm-up period can last around 1–3 minutes (see Fig. 4 and 5). It is also termed “cold-start condition”. At the beginning of this period, the car emits unconverted exhaust. After the warm-up, the full efficiency of the converters is reached, which offers a reduction of emitted VOC by a factor of 100. For a diesel car, the warming-up period is a little bit shorter than for a petrol car, since the excess of oxygen favors the oxidation of VOC by a DOC. Taken together, the effective reduction of VOC for the full stretch of a 50 min drive which begins with a cold converter is approximately a factor of 10 for petrol and 30 for diesel passenger cars equipped with G-Kat or DOC, respectively. The situation is different when the converters are already warm at start-up. In this case, the converters are acting with full efficiency for the whole drive.
The efficiency of a G-Kat for NOx reduction does not depend too much on the temperature of the converter (see Fig. 4). That seems to be against expectations. But one has to take into account the fact that during the warm-up period CO and VOC are not removed by the catalytic material so the reaction of NO with CO is favored by the large concentration of CO during that period of low temperature (see for example ref. 14). Later, when the catalytic material heats up, CO is removed but, on the other hand, the efficiency of the catalyst for the reduction of NO is growing. As a consequence, the removal of NOx from the exhaust gas of a petrol car by a G-Kat seems not to have a significant warm-up period. But this overall reduction for NOx is smaller than the potential reduction for VOC at optimal conditions. As a consequence, taking into account the warming-up period, the overall reduction efficiency of a G-Kat is a factor of 10 both for NOx and for VOC for a petrol car. For a diesel car, the overall VOC reduction is a factor of 30. Since the initial VOC emission of the diesel engine before entering the DOC is ten times smaller than that of a petrol engine, a diesel passenger car emits approximately a factor of 30 less VOC than a petrol car during a drive inside a city district.
The NOx emissions of petrol cars seem to be in accordance with EU regulations11,12 (see Table 2). This is different for diesel cars. They show a significant inconsistency between allowed emission factors and real-world observations.11,12 The real-world NOx emissions of a diesel car today seem to be the same as 30 years ago (see Table 2). Together with the growing number of diesel cars with respect to the total number of passenger cars in Germany, the fraction of NOx emissions of diesel cars relative to all passenger cars in Germany is estimated to be around 85% in the year 2015 (estimated from Table 3). Therefore, taking into account some heavy duty diesel vehicles, we can safely expect that the NOx concentrations in German inner city districts in the last ten years were dominated by the emissions of diesel cars. In the year 1994, the situation was different. At that time, the majority of passenger petrol cars were not yet equipped with a G-Kat (see Fig. 8). Hence, the small number of diesel cars together with the basically lower NOx emissions of diesel engines caused a low contribution of diesel cars to the NOx concentrations in inner city districts in Germany.
| Exhaust norm of car | Petrol cars (g km−1)a | Diesel cars (g km−1)a | ||||||
|---|---|---|---|---|---|---|---|---|
| CO2b | RDEc | EUd | HBEFAe | CO2b | RDEc | EUd | HBEFAe | |
| a NOx taken as NO2. b UK emission factor estimates.11 c Observed values in London by the RSD technique.11 d EU NOx emission factors for passenger cars. e HBEFA 3.2 (ref. 12) observed NOx-emissions for CADC urban drive cycle. f EURO exhaust norm.9 g EURO-6c expected value in HBEFA 3.2.12 | ||||||||
| None | 228 | 2.38 | 1.22 | 186 | 1.04 | 0.97 | ||
| EURO-1f | 212 | 1.15 | 0.47 | 181 | 0.98 | 0.97 | ||
| EURO-2f | 204 | 0.74 | 0.33 | 171 | 0.94 | 1.02 | ||
| EURO-3f | 193 | 0.22 | 0.15 | 0.10 | 158 | 1.12 | 0.50 | 0.98 |
| EURO-4f | 178 | 0.08 | 0.08 | 0.10 | 152 | 0.96 | 0.25 | 0.85 |
| EURO-5f | 159 | 0.06 | 0.06 | 0.05 | 136 | 1.12 | 0.18 | 0.84 |
| EURO-6f | 143 | 0.06 | 0.05 | 122 | 0.08 | 0.84 | ||
| EURO-6cg | 0.05 | 0.08 | 0.14 | |||||
| Exhaust norm of car | Year | DPC/(DPC + PPC)a | DPC/(DPC + PPC)a |
|---|---|---|---|
| For numberb [%] | For NOx emissionsc [%] | ||
| a DPC – diesel passenger cars, PPC – petrol passenger cars. b Inventory of passenger cars in Germany;13 see Fig. 6. c Calculated from Table 2 (ref. 11) and from column 3, this table. d EURO exhaust norm.9 | |||
| None | 1980 | 5 | 2.2 |
| EURO-1d | 1993 | 13.5 | 10.3 |
| EURO-2d | 1997 | 13.8 | 14.9 |
| EURO-3d | 2001 | 13.9 | 41.5 |
| EURO-4d | 2006 | 21.9 | 72.4 |
| EURO-5d | 2011 | 26.6 | 83.2 |
| EURO-6d | 2015 | 31.2 | |
1.3 Composition and emissions of the car fleet in Germany
The number of passenger cars in Germany rose from 32 million to 43 million cars in the time interval 1994–2014, if one accounts for some temporarily suspended/decommissioned cars in the numbers before 2008 (see Fig. 6). During the same time, the fraction of diesel cars increased13 from 13.7% to 30.1%.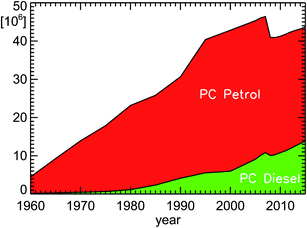 | ||
| Fig. 6 Inventory of passenger cars (PC diesel and PC petrol) in Germany for the years 1960–2015 (see ref. 13); since January 1, 2008, only active vehicles are taken into account without counting temporary suspended or decommissioned cars. | ||
If one wants to approach an estimate for NOx and VOC emissions, one also has to take into account the average number of kilometers for each type of car (petrol or diesel car, passenger or heavy-duty car). This is not explicitly shown here, but reflected in the amount of fuel used by each class of cars (see Fig. 7). Another important boundary condition is the pollution classification of individual cars15 (see Fig. 8) which also depicts the average lifespan of a technology change within the car fleet in Germany. Approximately 8 years after the implementation of a new pollution classification, half of the passenger car fleet still has the old classification.
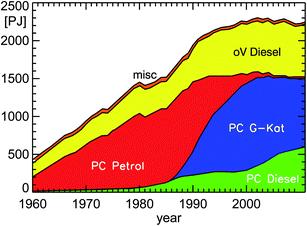 | ||
| Fig. 7 Annual fuel consumption of road traffic in Germany for the years 1960–2011 (PC: passenger cars; oV: other vehicles including HGV, LCV, and bus (Heavy Goods Vehicles, Light Commercial Vehicles, buses); misc: miscellaneous petrol cars; natural and liquefied gas included in PC petrol; PJ: Peta Joule (=1015 Joule); replotted from TREMOD version 5.3 (see ref. 15)). | ||
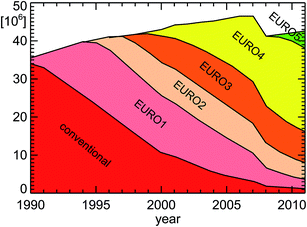 | ||
| Fig. 8 Vehicle emission regulation categories for passenger cars in Germany for the years 1990–2011; replotted from TREMOD version 5.3 (see ref. 15 and Table 1). | ||
If one takes suitable emission factors for NOx and VOC for each pollution classification (see Table 1), one can estimate the amount of NOx and VOC emitted by road traffic in Germany for each year (see Fig. 9, 10a and b). The shown inventories use emission factors called “HBEFA 3.1”.16 Astonishingly enough, these emission factors used to calculate the emission inventories are taken from observations at least since the year 2009 and are called “Real Drive Emissions” (RDE). It appears that the current public discussion of the discrepancy between real world emissions and EU norm emissions (see for example Table 2) is already implemented into those emission estimates by using NOx emission factors around 0.8 g km−1 for all diesel passenger cars.17 The intrinsic assumption in the following considerations is the expectation that the trend of concentrations in inner city districts will follow the trend of suitable emissions categories for the whole of Germany.
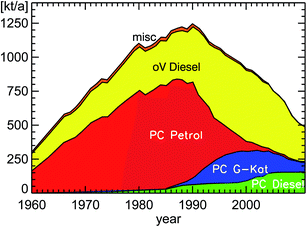 | ||
| Fig. 9 NOx emissions (as NO2) of road traffic in Germany for the years 1960–2011 (PC: passenger cars; oV: other vehicles including HGV, LCV, and bus (Heavy Goods Vehicles, Light Commercial Vehicles, buses); misc: miscellaneous petrol cars and remaining types of road traffic); replotted from TREMOD version 5.3 (see ref. 15). | ||
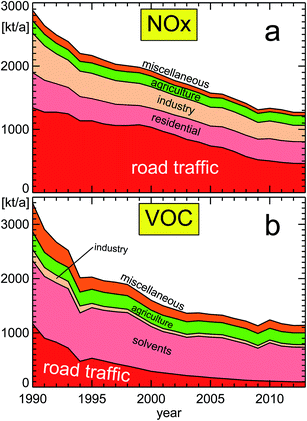 | ||
| Fig. 10 NOx (panel a) and VOC (panel b) emissions for different source categories (VOC without methane; replotted from a publication of the German Federal Environmental Agency UBA18); featured categories from bottom to top: (a) road traffic, residential, industry, agriculture, miscellaneous, and (b) road traffic, solvents, industry, agriculture, miscellaneous. The composition of the different categories is shown in Section 6. | ||
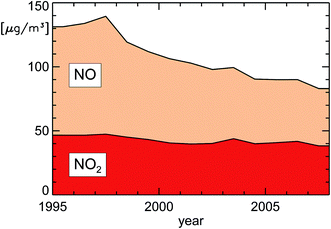 | ||
| Fig. 11 Annually averaged NOx concentrations (NO displayed as μg m−3 NO2) close to traffic in inner city districts in Germany (replotted from UBA19). | ||
If we take the published annual traveling distance of passenger cars (PC) in inner city districts in Germany of around 160 × 109 km a−1 (Fig. 12), the ratio of diesel to petrol passenger cars (Fig. 6), the emission regulation categories for passenger cars (Fig. 8), and the observed emission factors in London from Table 2, we can estimate the annual NOx emissions of passenger cars in inner city districts of Germany (Fig. 13).
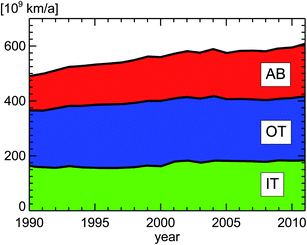 | ||
| Fig. 12 Vehicle kilometers traveled by passenger cars in Germany; replotted from TREMOD version 5.3.15 AB: Autobahn, OT: out-of-town, IT: in-town. | ||
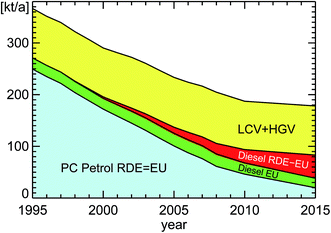
We then have to add the amount of NOx emitted by heavy-goods-vehicles (HGV) and light-commercial-vehicles (LCV) by using the same kind of parameters for the traveling distance in inner city districts15 (around 8 × 10⁹ km a−1 for HGV and 17 × 109 km a−1 for LCV in 2010). All HGV and 93% of the LCV vehicles have a diesel engine.15 The emission factor for these vehicles is estimated for a speed of 25 km h−1 to be 10 g km−1 for HGV and 1 g km−1 for diesel-LCV.16 For simplicity we take 100% of LCV as diesel vehicles. The large emission factors for HGV at low speeds are explained in HBEFA 3.2:12 “EURO V with SCR: the NOx output in medium and high average engine loads (e.g. motorway and rural driving situations) is low. In contrast, NOx emission factors are close to EURO III in urban driving and in stop-and-go conditions due to low DeNOx-performance of EURO V SCR after treatment in the low exhaust gas temperature range”. Other categories for road traffic in urban areas (apart from “PC”, “LCV”, and “HGV”) are not included because ref. 15 does not contain information about them. As a hint one can take ref. 20 which provides projected information for 2015. The vehicles within the categories “Bus”, “Motorcycles”, and “Vans” there have traveling distances in urban areas of 1.64, 5.31, and 2.85 × 10⁹ km a−1, respectively. The associated NO2 emissions are 6.66, 0.77, and 2.34 kt a−1 which yield average emission factors of 4.1, 0.15, and 0.82 g km−1 NO2. Taking these numbers, approximately 10 kt a−1 or 6% NO2 would be missing in Fig. 13 around the year 2015.
The final result in Fig. 13 shows the significant contribution of HGV and LCV diesel vehicles to the total amount of traffic NOx emissions in urban areas in Germany, a point which already emerged from the published emission inventory for the whole of Germany in Fig. 9. The difference between real-world-emissions (RDE) and EU-norm-emissions (EU) for petrol passenger cars is very small and therefore cannot be seen in Fig. 13. That is entirely different for diesel passenger cars. As expected, there is a large discrepancy between real-world-emissions (RDE) and EU-norm-emissions (EU) for diesel passenger cars. Overall, the relative amount of NOx emissions diesel passenger cars add up due to their non-compliance with EU regulations is estimated to be on the order of 25% for the year 2015 for Germany.
To test our simple approach we expanded the estimate for NOx traffic emissions to the whole of Germany by adding portions for “out-of-town” and “Autobahn” of the different kinds of vehicles. For these situations we had to take a lower emission factor of 2.5 g km−1 for HGV allowing for the faster speed (see above). The total estimated NOx traffic emission for the year 2012 is 467 kt a−1 from our simple approach. The published result from Fig. 10a is 463 kt a−1 in 2012, very close to our estimate. However, this good agreement should not obscure the simplicity of our approach. Another test of our estimate can be obtained from ref. 11, Table 5. This publication reports ratios of 26%, 25%, 26%, and 23% of NOx RDE-emissions for the fleet of diesel PC, petrol PC, LCV, and HGV (including buses), respectively, encountered during campaigns in 2007–2010 in London, UK, quite comparable to Fig. 13. And the authors of this publication11 explicitly state that their estimates “better reflect urban areas” than a national total.
The total decrease of NOx emissions between the years 1995–2008 in Fig. 13 is a factor of 1.9 in 13 years = 2.9 in 20 years, or, directly using the years 1995–2015, it is a factor of 2.1 in 20 years. That is quite comparable to the observed trend of NOx-concentrations in inner city districts in Germany (see Fig. 11). This analysis also confirms that the amount of diesel engine exhaust (HGV + LCVdiesel + PCdiesel) is expected to have a fraction of 90% with respect to NOx traffic emissions in urban areas in Germany in the year 2015.
2 Experimental
Measurements of VOCs and NOx were conducted over a period of the last 20 years. Only the technical fundamentals will be described in the following. Individual conditions and optimization steps can be found in the listed references.2.1 VOC detection
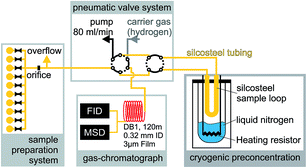
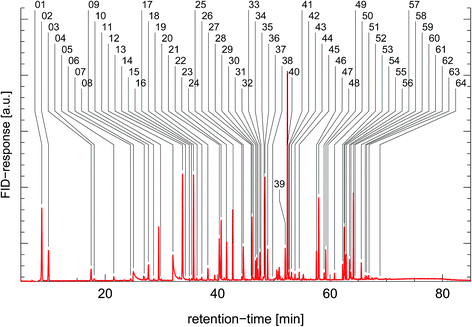
The gas chromatographic system for analyzing ambient air samples was developed in the late nineties22 and has been continuously optimized and upgraded. In this context the current state of the system will be described.The gas chromatographic system is based on a conventional gas chromatograph (Agilent 6890) which is equipped with a flame-ionization detector (FID) for the quantification, and with a mass-spectrometer (Agilent 5975C MSD) for the identification of the VOCs. To analyze concentrations at trace-gas level, a cryogenic pre-concentration system was developed, consisting of a sample loop (Silcosteel, 20 cm length, inner diameter 2 mm, packed with 0.25 mm glass beads) which was cooled down in the cold gas above liquid nitrogen (see Fig. 14). In the standard operation procedure, a volume of 800 mL was pre-concentrated in the sample loop at a flow of 80 mL min−1. After thermal desorption at 120 °C, the sample was injected on a capillary column (type “DB-1”, 120 m length, 0.32 mm inner diameter, 3 μm film thickness) at a temperature of −60 °C. The GC-oven was kept at −60 °C for 8 min, heated to 180 °C at a rate of 4 °C min−1, then heated to 220 °C at a rate of 20 °C min−1, and kept isothermal at 220 °C for 10 min. At the end of the capillary column, the carrier stream was split and fed towards the FID and MSD detectors. A typical FID chromatogram is shown in Fig. 15. The identification and quantification of the VOCs as well as routine checks for sensitivity by comparison to calibration reference standards (Apel-Riemer Environmental Inc., Denver, CO, USA) were performed in regular intervals. Overall, the precision of quantification was 5–6% and the limit of detection was 5–15 ppt (varying for the different VOC species23).
Using the previously described setup, online in situ measurements of VOCs were also performed aboard the mobile Laboratory-truck of the FZJ.22,24–26 In other cases, when in situ measurements were not possible (e.g. measurements in a forest27 to inspect biogenic emissions or measurements while driving on-road to inspect traffic emissions23,28), air samples were collected in evacuated Silcosteel canisters (SilcoCan, Restek).
If necessary, ozone was removed by a heated Silcosteel capillary prior to sampling into the cylinders. The canisters were then pressurized with synthetic air to reduce the relative humidity of the sample and hence possible water-interferences in the FID detector. The pressurized canisters were then connected to the canister manifold at the GC-system which allows the unattended analysis of up to 10 canisters at a time (see Fig. 14). Quantification was then performed using the same routines as for the in situ measurements.
The suitability of the Silcosteel canisters for VOC sampling and storage of humid samples for up to two days was extensively scrutinized and the stability of their content confirmed.29 To analyze the VOC-composition in the exhaust of petrol- and diesel-vehicles, the gas was diluted with synthetic air prior to sampling in the canisters and then analyzed using the same gas-chromatographic system as for the ambient measurements.7,28,30,31 If very high concentrations had to be expected, the sampling volume in the pre-concentration unit was limited to 80 mL to prevent overloading of the system.
The total hydrocarbon concentration in the exhaust of the different vehicles was analyzed with a commercially available total organic carbon detector (TOC; MICRO-FID 100, ABB Corp.) which is basically a flame-ionization-detector without a gas-chromatographic system in front of it.7,28,30
2.2 NOx detection
NOx-measurements in ambient air samples were based on the principle of chemiluminescence: NO reacts with ozone to an excited NO2 molecule. Photons emitted during radiative disexcitation can then be detected by a photomultiplier and used for the quantification of the concentration of NO.32,33 NO2 was detected after conversion to NO using either a molybdenum converter22,24 or a photolytic converter.23,25,28To analyze the NOx-concentrations in the exhaust of petrol- and diesel-vehicles, commercially available analyzers (LIMAS11, ABB corp.) based on UV-absorption were used.7,28,31
3 Results
3.1 Ambient observations
For the following considerations we will use NOx and VOC observations not in the usual manner as concentrations or mixing ratios, but as reactivities. Reactivity denotes the reaction speed of a substance or of a group of substances with the OH radical, the principal agent in the photochemical production of ozone. The eminent significance of OH radicals within tropospheric chemistry is justified since during daytime more than 90% (ref. 1 and 34) of all VOC react with OH radicals.Reactivity is expressed as reciprocal lifetime of OH in a certain reaction and has the unit s−1. For example, VOCs are oxidized by OH to form more oxidized species. The final product of such an OH-oxidation pathway starting with VOC is, after several steps, CO2. The important point here is that in each VOC-oxidation step ozone is produced as a by-product in the presence of nitrogen oxides, specifically in the presence of NO. The other nitrogen oxide species, NO2, is also oxidized by reaction with OH to HNO3 without producing ozone like VOCs. The reactivity of a certain NO2 concentration, RNO2, can be calculated by multiplying the concentration value with the rate constant of the reaction of NO2 with OH, kOH+NO2: RNO2 = kOH+NO2 × [NO2]. The same can be done for a specific VOCi substance: RVOCi = kOH+VOCi × [VOCi]. The sum of all individual VOCi then gives the total VOC reactivity RVOC. The individual rate constant parameterizations are taken from the literature35,36 or from the chemical reaction mechanism MCM-3.1,37 which is later-on also used to derive ozone production estimates for different air masses. For all reactivities shown in this paper we used a reference temperature of 298 K for input to the rate constant parameterizations. This has been done to ensure consistency with the ozone production approach discussed in Section 4.2. We note here, that the averaged ratio of the individual rate constants kOH+VOCi/kOH+NO2 for a typical traffic VOC mix is temperature dependent with a slope of 10% per 10 K.
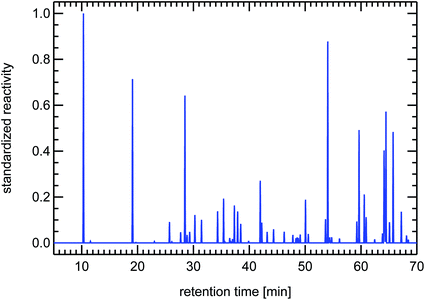
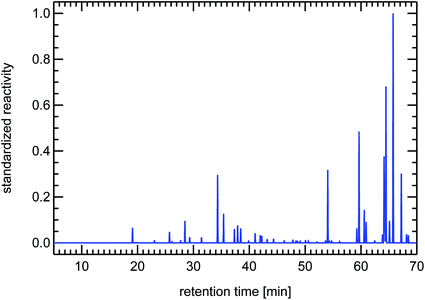
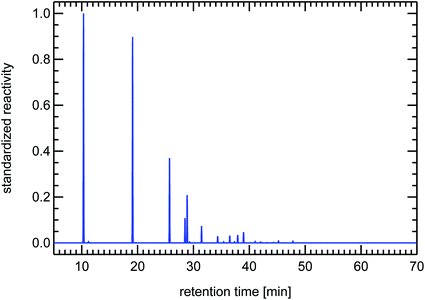
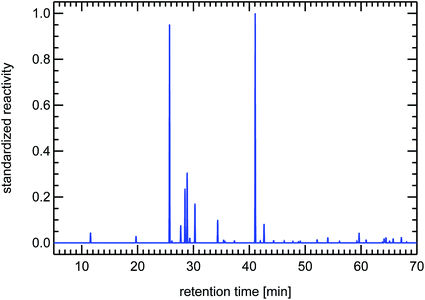
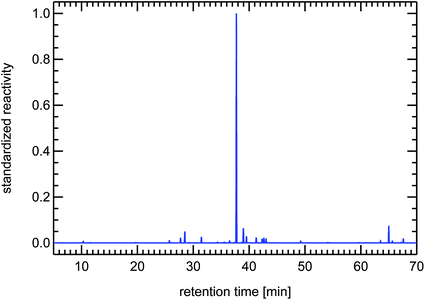
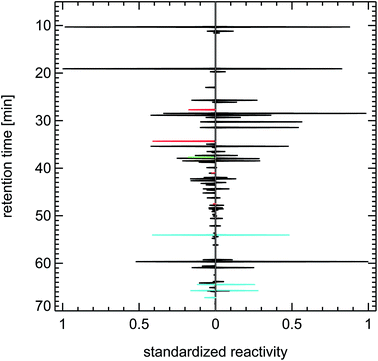
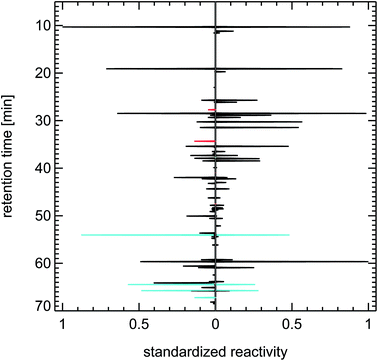
VOCs are typically measured using a gas-chromatographic system (GC). The single VOCi are separated by such a GC-system and reach the detector at a specific time after injection of the gas sample, the so-called retention time. The retention time is only dependent on the physical properties of the individual VOCi and on the GC system used. For a specific GC system, the retention times for the different substances are known by using reference air samples. The operator then transposes the raw signals of the different species, which establish the so-called chromatogram, into concentrations of the individual species and records their name and concentration in the form of a table. From this table one can then calculate the individual reactivity contributions of the individual VOCi-species and add them up to obtain the total VOC reactivity, RVOC. One can also transpose the original chromatogram showing raw signals into a chromatogram which shows peaks scaled to the reactivity of the different species. This is done by taking a Gaussian standard peak (which has an appropriate peak-width typical for the utilized GC-system), scale its maximum with the reactivity of a certain VOCi and then add this synthetic Gaussian peak to a baseline data vector at the position of the retention time of that specific VOCi. The appearance of such a reactivity-chromatogram is very different to the original chromatogram, because this technique emphasizes those VOC-species which are responsible for ozone production instead of showing a composition related to mass (FID raw signals are primarily related to the carbon atom content of the molecules). For that reason we will use these synthesized reactivity chromatograms (SRC) throughout this paper which still hold the look-and-feel of the original chromatograms and allow for a fast visual impression of the VOC-composition of an air sample. These SRCs will be used in a standardized form, that means they are divided by the largest occurring value in each particular chromatogram. The use of SRCs and the standardization procedure have the additional benefit of allowing comparison to different published VOC-patterns, if the species names and their concentrations are known from the publication (see Fig. 24).
It is important to note here that other sources for VOCs in ambient air masses have quite different but at the same time very specific fingerprints, for example the fingerprints of diesel fuel or of petrol fuel (both not shown here). The fingerprint from a forest site in Fig. 20 contains a single dominant peak caused by the large concentration and reactivity of isoprene. Isoprene is the most prominent VOCi species from biogenic sources and is related to the emissions of broad-leafed trees like oaks and beeches. Other trees like conifers emit specific VOCs called mono-terpenes which are not shown here, but whose fingerprints are also clearly distinguishable from car emissions. The next large reactivity peak at a retention time of 65 min in Fig. 20 is such a monoterpene called sabinene which, as an exception, is also emitted by broad-leafed trees. Other fingerprints, for example from petrol cars or from solvents, are almost not visible, because airmasses originating in cities and traveling to remote locations are either considerably diluted or their VOC content is degraded by reaction with OH radicals, a line-of-thought we will resume in Section 4.3.
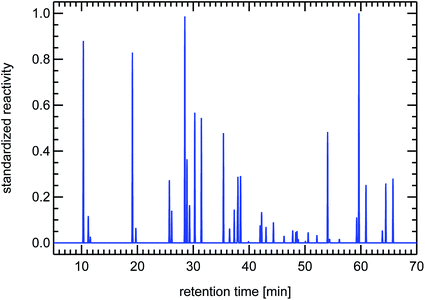 | ||
| Fig. 21 Synthesized reactivity chromatogram of an air sample taken in 1997 in Munich, “Garmischer Straße”. | ||
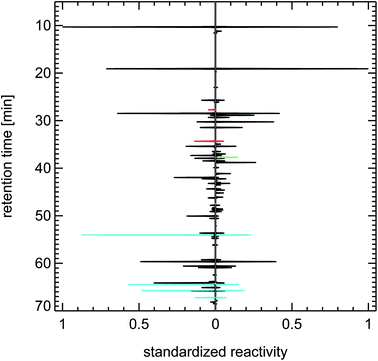 | ||
| Fig. 24 Contrasting juxtaposition of synthesized reactivity chromatograms from a single air sample taken from the exhaust of a petrol passenger car under cold-start conditions (left panel), and from a literature study (evaluating 200 citations) for a typical petrol passenger car with GKat38 (right panel); red: methanol, ethanol, propanol; green: isoprene; blue: toluene, trimethylbenzenes. | ||
A close examination of the juxtapositions in Fig. 22–24 reveals one difference between the fingerprints of the 1990s and of today. That is the occurrence of methanol and ethanol in recent air samples of inner city districts and in petrol car exhaust. That feature is most likely caused by the addition of 5% or 10% alcohol to petrol fuel in Germany (fuel types called E5 and E10). But the overall effect of that change on the composition of the VOC reactivity in air masses dominated by traffic emissions seems to be negligible.
A recent publication39 brought forward the argument that large hydrocarbons from diesel exhaust are underestimated by orders of magnitude because VOCs larger than C12 are not easily observed by current GC systems and therefore have been neglected. Including the reactivity contributed by these large VOCs, the authors of this publication39 predict that diesel-related hydrocarbons contribute up to 50% of the ozone production potential in London during winter-time. We specifically designed a GC system to be able to observe VOCs in the region C8–C16 and found no evidence for such a statement ourselves. We took samples in a street tunnel in Bonn (Germany) and found only 0.3% of the total VOC mass above C11, the largest VOC included in our standard gas chromatographic analysis. Even if those hydrocarbons would have a larger OH rate constant than the typical VOC of car exhaust (about 1 × 10⁻¹¹ cm3 s−1), their total contribution to the VOC reactivity in ambient samples dominated by traffic emissions is expected to be below 3%.
3.2 The ratio of VOC/NOx in inner city districts of Germany
Here we show the result of ambient observations of the ratio of the reactivities of VOC/NO2 from inner city districts of Wuppertal, Munich, Augsburg, Düsseldorf, Bad Homburg, and Essen over the years 1994 to 2015 (see Fig. 25). As mentioned before, the reactivities of VOC were determined by adding up the individual reactivities of all VOCi compounds analyzed from air samples gathered by filling up appropriate Silcosteel canisters within the traffic of major roads of these cities. The reactivities of NO2, RNO2, were derived for the same time periods from in situ observations of nitrogen oxide mixing ratios measured co-located to the canisters. To account for different ratios of NO and NO2 in different traffic-, light-, and ozone-conditions, RNO2 was calculated for an average NO2 contribution of 75% of the sum of observed NO and NO2. In that respect, the observed reactivity of NO2 was calculated according to the function RNO2 = kOH+NO2 × (NO + NO2) × 0.75. Following this approach, the ratio of RVOC/RNO2 in inner city districts of Germany was around 1.43 in the year 1994 and 0.19 in 2014.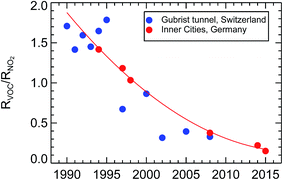 | ||
| Fig. 25 Observed reactivity ratios of VOC and NO2, RVOC/RNO2, over the years 1990–2015 from inner city districts in Germany (this paper) and (scaled, see text) inside the Gubrist road tunnel40 in Switzerland. | ||
This result can be compared to another long-term study40 of traffic emissions from a spacious road tunnel, the Gubrist tunnel in Switzerland, but that comparison cannot be done straight forward. Since the traffic inside the Gubrist tunnel flows at an average speed of around 90 km h−1, the ratio of RVOC/RNO2 is different compared to a city where the traffic flow is sometimes congested, the average speed is below 50 km h−1, and the amount of cold-start petrol cars is larger. The fleet of passenger cars, diesel and petrol, and the contribution of heavy duty cars might not be the same as in Germany. A further difficulty is the type of data reported in the Gubrist tunnel study. That study reports emission factors for total VOC (TVOC) and NOx and not reactivities. Due to all of these differences it is very difficult to derive and to compare absolute values of the RVOC and RNO2 reactivities from the Gubrist tunnel. For our purpose it is enough to see the trend from this profound investigation offers an independent confirmation of our statement of a large decrease of the RVOC/RNO2 ratio in traffic emissions over the last two decades in Germany. To compare the trend of the Gubrist tunnel results to the trend in our own data set, one has to assume that the VOC composition of traffic emissions did not change over time, something we called a “persistent VOC fingerprint” before. With this assumption, one can simply scale the scattered mass ratios TVOC/NOx from the Gubrist tunnel study of the time period 1990–1995 to match the best-fit line (the thin red line in Fig. 25) and compare the two trends. Basically, the trends for the Gubrist road tunnel in Switzerland and for inner city districts in Germany show the same behaviour, a decrease of a factor of 7.5 of the reactivity ratio RVOC/RNO2 within 20 years (derived for the thin red line in Fig. 25). That trend is much larger than what we expected from the VOC and NOx emission inventories for Germany in Section 1.3.2, that is a factor of 2.9 in 20 years. For this comparison we again use the assumption that mass ratio and reactivity ratio for VOC/NOx for traffic emissions have a simple and constant scaling factor. Since we have shown in Section 1.3.1, that the observed concentration trend in traffic dominated inner city districts of Germany follows the estimated trend for NOx traffic emissions, this discrepancy has to come from the trend of traffic VOC emissions. There is no published observed average trend of VOC concentrations for inner city districts in Germany to compare to. Our observations of the RVOC/RNO2 ratios suggest a larger decrease of VOC traffic emissions than the published emission inventories. One reason might be the difficulty arising in the determination of the VOC emission trend from the “cold-start” burst of VOCs in the first minutes after starting a petrol car. This short transitory period during the drive emits on the order of 90% of all VOC emissions of a petrol car (see Section 1.2). It is very difficult to incorporate this kind of process into an inventory calculation. For NOx, such a difficulty does not appear. Furthermore, it has to be expected that the car manufacturers have shortened that time period by optimizing the catalytic converter efficiency of the G-Kats over the years. Anyhow, such a large decrease of VOC relative to NOx offsets the photochemical ozone production rate, as will be studied in Section 4.3.
For other countries, the VOC/NO2 ratio and its trend might be different. It depends on the specific vehicle fleets for each country, e.g. if they are dominated more by petrol-engined vehicles rather than diesel or vice versa. For example, American vehicles have mostly used petrol engines for decades (3% (ref. 41) diesel contribution in 2012), whereas in France 78% (ref. 41) of vehicles use diesel fuel. And Switzerland and Germany are in-between with 22% (ref. 41) and 26% (ref. 13) of the passenger fleet using diesel fuel in 2010, respectively.
4 Discussion
The following section conceptually depicts the chemical changes an air parcel experiences when it is released inside a city, is loaded with traffic emissions inside a street tunnel or a main road, travels forward driven by the wind, passes minor streets and the city limit, going further into more rural environments, finally reaching a large forest or agriculturally dominated region. Here, we are not interested in details, just focusing on the concept. In reality, emissions might be different for different roads or cities, the wind might blow faster or slower, the light might change due to clouds and so on, there are a magnitude of possibilities which influence a specific location or point in time. We have to bear in mind that our concept wants to show only the generic features and does not have to be applicable for all possible conditions.4.1 The photochemical production of ozone
In this paper, we want to explore, how the change of the VOC and the NOx emissions from traffic over the last 20 years will affect the production of ozone, a secondary pollutant and a risk for human health. We have seen that for this time period the observed hazardous ozone concentrations decreased considerably in Germany and almost reached a state where they are no longer a risk for human health (Section 1). To substantiate the background for this observation, we have to understand how ozone is produced by photochemical processes, especially in smog episodes. Ozone is produced in the degradation of VOCs by OH radicals in the presence of nitrogen oxides. In this degradation process, peroxy radicals ROx are generated which react with nitrogen monoxide NO to form nitrogen dioxide NO2. NO2 is subsequently photolysed to give back NO and generate ozone. Besides this pathway, NO2 can react with OH to form nitric acid. This latter process reduces the potential degradation of VOCs since the concentration of OH radicals is lessened. Nitrogen oxides have therefore a dual impact on ozone production. In the form of NO, they amplify the production rate, in the form of NO2 they withdraw the major agent from the ozone production process, the OH radical. The production rate of ozone depends in a nonlinear way on the concentrations of nitrogen oxides, VOCs, ozone itself, light intensity, humidity, temperature, and other parameters. To understand these complex relationships we used the master chemical mechanism MCM 3.1.374.2 The box model approach
The master chemical mechanism MCM 3.1,37 slightly extended with new information,7 consists of 14![[thin space (1/6-em)]](https://www.rsc.org/images/entities/char_2009.gif) 025 reactions and 4575 species. It is used here to calculate the concentration of OH radicals in the presence of certain amounts of VOC and NOx for typical summertime conditions in Germany. The major ingredients of this set up were a temperature of 25 °C, a relative humidity of 75%, an ozone concentration of 60 ppb, and photolysis frequencies JO1D and JNO2 of 2.9 × 10⁻⁵ s−1 and 8.4 × 10⁻³ s−1, respectively. The ratio of NO2/NOx is on the order of 0.75 under these conditions. We started with NO2 and VOC concentrations equivalent to RNO2 and RVOC reactivities each of 100 s−1. The relative mix of the different VOCs was borrowed from the results of ambient observations in Munich 1997. The VOC fingerprint of these air masses, very similar to cold-start petrol car conditions, was already shown in Fig. 21. The fate of this NO2 & VOC mixture was then calculated by the model for a time interval of 10 minutes to allow NO and NO2 and the OH radicals to reach a quasi steady-state. After that time, the local ozone production rate PO3 was calculated according to PO3 = Σ(kROxi+NO × [ROxi] × [NO]), where the ROxi denote the different peroxy radicals including HO2. This ozone production rate and the related NO2 and VOC reactivities were stored. The whole process started again with a slightly different NO2 & VOC mixture until the desired surface area of NO2 and VOC each spanning 0.1 to 100 s−1 was filled with enough supporting points to allow for a thorough representation of the internal structure within the ozone production process (see next the section).
025 reactions and 4575 species. It is used here to calculate the concentration of OH radicals in the presence of certain amounts of VOC and NOx for typical summertime conditions in Germany. The major ingredients of this set up were a temperature of 25 °C, a relative humidity of 75%, an ozone concentration of 60 ppb, and photolysis frequencies JO1D and JNO2 of 2.9 × 10⁻⁵ s−1 and 8.4 × 10⁻³ s−1, respectively. The ratio of NO2/NOx is on the order of 0.75 under these conditions. We started with NO2 and VOC concentrations equivalent to RNO2 and RVOC reactivities each of 100 s−1. The relative mix of the different VOCs was borrowed from the results of ambient observations in Munich 1997. The VOC fingerprint of these air masses, very similar to cold-start petrol car conditions, was already shown in Fig. 21. The fate of this NO2 & VOC mixture was then calculated by the model for a time interval of 10 minutes to allow NO and NO2 and the OH radicals to reach a quasi steady-state. After that time, the local ozone production rate PO3 was calculated according to PO3 = Σ(kROxi+NO × [ROxi] × [NO]), where the ROxi denote the different peroxy radicals including HO2. This ozone production rate and the related NO2 and VOC reactivities were stored. The whole process started again with a slightly different NO2 & VOC mixture until the desired surface area of NO2 and VOC each spanning 0.1 to 100 s−1 was filled with enough supporting points to allow for a thorough representation of the internal structure within the ozone production process (see next the section).
4.3 The result of box model calculations
Fig. 26 shows the result of our approach to understand the relation between the reactivities RVOC and RNO2 with respect to photochemical ozone production. The important point here is that the use of the parameter “OH-reactivity” instead of concentrations simplifies the understanding of ozone production, since this integrative single parameter almost entirely determines the magnitude of the ozone production rate,7 and not the complex peculiarities of the different degradation processes of the set of VOCs. This feature enables us to follow an air parcel within the same framework even if the VOC mixture is changing with time, for example by the addition of biogenic emissions. In Fig. 26, we start at reactivities for RNO2 and RVOC of 70 s−1 and 100 s−1, respectively, to represent typical ambient concentrations in a street tunnel or main road in a German city and the observed reactivity ratio RVOC/RNO2 of 1.4 for the year 1994. On its way to leave the city, that air parcel picks up some more emissions when passing minor streets, but those are small contributions compared to the starting concentrations. The dominant process while travelling here is dilution, that means mixing-in air containing very much lower concentrations from the background. This will influence both the VOC and the NO2 concentrations in an equal manner. So for the first part of the air trajectory shown for the year 1994 in Fig. 26, it is following a dilution path. As the reactivities approach background conditions (we have chosen RVOC = 3 s−1 and RNO2 = 0.2 s−1), the trajectory seems to turn around. The reason is that when the trajectory moves towards the forest in our example, we mix-in more and more biogenic VOC emissions. The end-point of the trajectory reaches background conditions for RNO2 but approaches 10 s−1 for RVOC, a value we would expect for a forest in Germany. Then we repeat that course of action to represent the year 2014, this time starting at 35 s−1 for RNO2 and 6.5 s−1 for RVOC to follow the observed trends from Section 3.2 (a factor of 2 for RNO2 and a factor of 15 for RVOC). The end-point of the 2014-trajectory is the same as that of the 1994-trajectory, since we assume that the background concentrations at the final point inside the forest did not change over time. But the trajectory itself to reach that end-point is very different. Due to the large decrease of the starting RVOC reactivity, the trajectory seems to avoid the regions of large ozone production. The reason is that due to the small RVOC/RNO2 reactivity ratio, OH radicals primarily react with NO2 (thereby producing HNO3) instead of reacting with VOC (producing ozone in the latter case).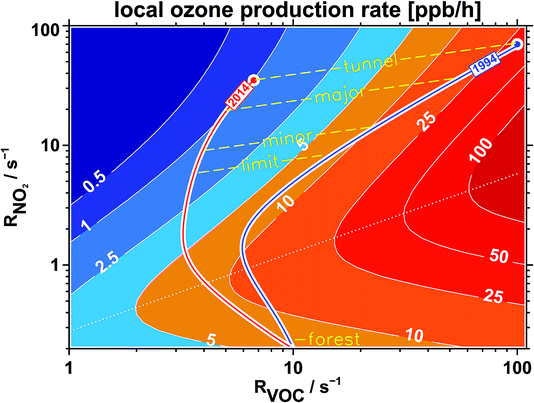 | ||
| Fig. 26 Local ozone production rate (ppb h−1) for typical summer time conditions in Germany (result of MCM-3.1-model calculations7) as a function of VOC and NO2 expressed by their reactivity versus OH radicals (RVOC and RNO2). The two trajectories denote typical air masses for 1994 (blue) and 2014 (red) traveling from inner city locations (street tunnel, major and minor streets, city limit) into regions dominated by biogenic emissions (forest). The dotted line separates the VOC (above the line) and NOx (below the line) limited regimes of ozone production. | ||
For sure, Fig. 26 only illustrates the concept of an air parcel starting in a city and moving to rural areas with conditions suitable to represent Germany. But the figure discloses the internal structure of photochemical ozone production. And that is the important point. No matter how a real-world trajectory would travel, as long as it starts at a location within the VOC limited regime (above the dotted line in Fig. 26) and has to reach a biogenic environment, the situation will be as discussed in the text above. If the wind has a fast speed or the forest is close to the city, the trajectory will be more straight than the one shown in Fig. 26. But the ozone production rate encountered and therefore the additional ozone the air parcel accumulates during its travel will be very much less nowadays than in the 1990s due to the large decrease of VOC traffic emissions, which is in the end an achievement of a political process. This VOC decrease would be especially beneficial if the air parcels would move around for a long time within the same area, like, for example, if they were trapped within a stagnant summertime high pressure system. In that case, the high pressure system can work like a reactor, accumulating and processing traffic emissions for an enlarged period of time. The normal background dilution process would be omitted because the air parcels would not be able to escape the “reactor” for some time. In other words, the “fuel” needed to feed a significant photochemical ozone production in the vicinity of cities, the VOCs released by traffic emissions, is nowadays almost gone.
There is one basic point concerning the validity of this simple box model approach which is not addressed until now. For the representation within a simple framework we have assumed a typical summertime NO2/NOx ratio of 75% everywhere. It is known that petrol car exhaust mainly12 consists of NO (NO2/NOx ≈ 0.05). The same is true for diesel cars from the 1990s. Nowadays, the ratio of NO2/NOx for diesel cars (above EURO-3) has been shifted12 towards NO2 (NO2/NOx ≈ 0.40), for example to facilitate the oxidation of soot deposited by a diesel particulate filter (DPF). With the consequence that in the 1990s, NO from car exhaust in city districts did rapidly react with ambient ozone, diminishing ozone almost to zero. Since the NO emissions were very large in street tunnels or main roads, ozone was gone there and NO was left over. As a consequence, the NO2/NOx ratio in regions dominated by traffic emissions was low in the year 1994 (≈30%) and larger in the year 2014 (≈50%, see Fig. 11). The trajectory for the year 1994 in Fig. 26 would have started at a lower NO2 reactivity and at a larger NO concentration as anticipated. This would have driven an even larger ozone production rate than illustrated in the figure. After a relatively short period, this virtual trajectory considering a large NO contribution would converge against the depicted trajectory and would follow it for the rest of the time. For the year 2014, the deviation between the virtual (representing more NO) and the depicted trajectory would have been very much less because the NO2/NOx ratio from diesel car exhaust would be near to the typical condition of 75% from the start. Overall, we would expect a small change if we use a more complex framework able to handle different NO2/NOx ratios for the calculation of ozone production rates. The result would even strengthen our conclusion of a strong reduction of photochemical ozone production over the last 20 years in Germany.
5 Conclusions
Traffic emissions of VOC have been significantly decreased in Germany over the last 20 years. Ambient observations suggest a reduction on the order of a factor of 15 in 20 years, which would mean 14.5% per year. That is a remarkable achievement. This decrease is most probably responsible for the overall improvement of the compliance with EU ozone regulations for human health in Germany.Traffic emissions of NOx did not show the same decline as the VOC emissions. In fact, they stayed almost the same over time. If the decrease of NOx traffic emissions was parallel to the VOC decrease, the trajectory for the year 2014 in Fig. 26 would have been on top of the trajectory for 1994, just starting at a later stage down the 1994 trajectory. This would suggest a less favorable decrease of ozone production along the trajectory for that case. On the other hand, a faster reduction of NOx traffic emissions would have avoided the frequently observed exceedance of the NO2 limit for the improvement of human heath,4 which is basically a problem of traffic emissions in inner city districts. If the decrease in NOx traffic emissions would start now, both benefits can be achieved: the avoidance of large ozone production and that of large NO2 concentrations. Fig. 13 suggests how this can be achieved. The emissions of heavy-duty-vehicles and buses (called HGV and LCV in that figure) are estimated to dominate NOx traffic emissions in German cities nowadays. Their NOx emissions are still large, although most of them are equipped with catalytic converters. The reason seems to be, that due to the relatively slow speed in city districts, the engine exhaust does not heat-up the converters enough to be efficient. If this heating-up could be managed by an additional power source at all vehicle speeds, NOx traffic emissions in inner city districts would be considerably reduced. Of course one would have to ensure that the NOx reduction techniques for heavy-duty-vehicles and buses do not introduce other pollutants with a similar potential for health-risks as NO2. This has to be investigated yet. Maybe, in the end, other concepts like electric buses and fuel-cell-vehicles are a better choice.
6 Appendix
The emission categories for Fig. 10a and b contain the following subcategories:6.1 Emission category “road traffic”
Passenger cars, light duty vehicles, heavy duty vehicles and buses, mopeds & motorcycles, gasoline evaporation, automobile tyre and brake wear, automobile road abrasion.6.2 Emission category “residential”
Stationary, household and gardening (mobile), public electricity and heat production.6.3 Emission category “industry”
Petroleum refining, manufacture of solid fuels and other energy industries, stationary combustion in manufacturing industries and construction – iron and steel & non-ferrous metals & chemicals, pulp, paper and print & food processing, beverages and tobacco & non-metallic minerals, mobile combustion in manufacturing industries and construction, stationary combustion in manufacturing industries and construction, international aviation LTO (civil), domestic aviation LTO (civil), cement production, lime production, glass production, quarrying and mining of minerals other than coal, construction and demolition, storage, handling and transport of mineral products, other mineral products, ammonia production, nitric acid production, adipic acid production, carbide production, titanium dioxide production, soda ash production, chemical industry, storage, handling and transport of chemical products, iron and steel production, ferroalloys production, aluminium production, magnesium production, lead production, zinc production, copper production, nickel production, other metal production, storage, handling and transport of metal products, pulp and paper industry, food and beverages industry, other industrial processes, wood processing, production of POPs, consumption of POPs and heavy metals, other production, consumption, storage, transportation or handling of bulk products, commercial/institutional: stationary, commercial/institutional: mobile.6.4 Emission category “agriculture”
Manure management – dairy cattle & non-dairy cattle & sheep & swine & buffalo & goats & horses & mules and asses & laying hens & broilers & turkeys & other poultry & other animals, inorganic N-fertilizers (includes also urea application), animal manure applied to soils, sewage sludge applied to soils, other organic fertilizers applied to soils, urine and dung deposited by grazing animals, crop residues applied to soils, indirect emissions from managed soils, farm-level agricultural operations including storage, handling and transport of agricultural products, off-farm storage, handling and transport of bulk agricultural products, cultivated crops, use of pesticides, field burning of agricultural residues, agriculture other, agriculture/forestry/fishing: stationary, agriculture/forestry/fishing: off-road vehicles and other machinery, agriculture/forestry/fishing: national fishing.6.5 Emission category “solvents”
Domestic solvent use including fungicides, road paving with asphalt, asphalt roofing, coating applications, degreasing, dry cleaning, chemical products, printing, other solvent use, other product use.6.6 Emission category “miscellaneous”
This category is calculated from the category called “NATIONAL TOTAL′′ minus the sum of the categories already used in the figures. It contains categories like “military”, “fugitive”, “waste” and “solvents” in case of NOx and “residential” in case of VOC.Acknowledgements
This work was supported by the “Federal Ministry of Education and Research” (BMBF) under grant numbers 07TFS45/3 and FKZ19B98118/0, by the “Federal Ministry for Economic Affairs and Energy” (BMWI) under grant number 03ET6036D, and by the town council of Bad Homburg via the project “Analyse der lokalen Luftqualität der Stadt Bad Homburg, 2014”. The authors wish to thank Hermann-Josef Buers for his assistance in the set-up of the GC system and the analysis of its results. We also acknowledge the kind forwarding of the preliminary surface ozone data from the Global Atmosphere Watch station “Meteorological Observatory Hohenpeissenberg”, German Meteorological Service, by Stefan Gilge.References
- P. J. Crutzen, Annu. Rev. Earth Planet. Sci., 1979, 7, 443–472 CrossRef CAS.
- R. G. Derwent, A. J. Manning, P. G. Simmonds, T. G. Spain and S. O'Doherty, Atmos. Environ., 2013, 80, 361–368 CrossRef CAS.
- O. R. Cooper, D. D. Parrish, J. Ziemke, N. V. Balashov, M. Cupeiro, I. E. Galbally, S. Gilge, L. Horowitz, N. R. Jensen, J.-F. Lamarque, V. Naik, S. J. Oltmans, J. Schwab, D. T. Shindell, A. M. Thompson, V. Thouret, Y. Wang and R. M. Zbinden, Elementa, 2014, 2, 000029 Search PubMed.
- U. Dauert, S. Feigenspan, A. Minkos and M. Langner, Luftqualität 2014, Vorläufige Auswertung, Umweltbundesamt, Deutschland, Dessau-Roßlau, January 2015, pp. 11–12 Search PubMed.
- Information über Abgase des Kraftfahrzeugverkehrs, ed. P. Rabl, Bayrisches Landesamt für Umweltschutz, Augsburg, Germany, 2003 Search PubMed.
- R. Pischinger, M. Kell and T. Sams, Thermodynamik der Verbrennungskraftmaschine: Der Fahrzeugantrieb, Springer, Wien, Austia, New York, USA, 3rd edn, 2009 Search PubMed.
- D. Klemp, D. Mihelcic and B. Mittermaier, Messung und Bewertung von Verkehrsemissionen, Schriften des Forschungszentrums Jülich, Energy & Environment, Jülich, Germany, 1st edn, 2012, vol. 21 Search PubMed.
- D. Hassel, P. Jost, F.-J. Weber, F. Dursbeck, K.-S. Sonnborn and D. Plettau, Abgas-Emissionsfaktoren von PKW in der Bundesrepublik Deutschland - Abgasemissionen von Fahrzeugen der Baujahre 1986 bis 1990 (Forschungsbericht 10405152 und 10405509 im Auftrag des Umweltbundesamtes), Erich Schmid Verlag, Berlin, Germany, 1994 Search PubMed.
- EC Commission Regulations No 91/441/EWG, 91/441/EWG, 94/12/EG, 98/69/EG, 98/69/EG, EG 715/2007 with EG 692/2008 and EG 459/2012 implementing and amending Regulations of the European Parliament and of the Council on type-approval of motor vehicles with respect to emissions from light passenger and commercial vehicles, European Commission, Brussels, Belgium, 1991–2012.
- Gesetz zur stärkeren Berücksichtigung der Schadstoffemissionen bei der Besteuerung von Personenkraftwagen (Kraftfahrzeugänderungsgesetz 1997-KraftStÄndG 1997), Deutscher Bundestag, Bonn, Germany, 18 April 1997.
- D. C. Carslaw, S. D. Beevers, J. E. Tate, E. J. Westmoreland and M. L. Williams, Atmos. Environ., 2011, 45, 7053–7063 CrossRef CAS.
- M. Rexeis, S. Hausberger, J. Kühlwein and R. Luz, Update of emission factors for Euro 5 and Euro 6 vehicles for the HBEFA version 3.2. TUG report I-31/2013/Rex EM-I 2011/20/679, TU Graz, Graz University of Technology, Graz, Austria, 2013.
- Fahrzeugzulassungen: Bestand an Kraftfahrzeugen nach Umwelt-Merkmalen; Statistische Mitteilungen des Kraftfahrt-Bundesamtes FZ 13, Kraftfahrt-Bundesamt, Flensburg, Germany, 2015.
- M. W. Lesley and L. D. Schmidt, Surf. Sci., 1985, 155, 215–240 CrossRef CAS.
- Aktualisierung “Daten- und Rechenmodell: Energieverbrauch und Schadstoff-emissionen des motorisierten Verkehrs in Deutschland 1960-2030” (TREMOD, Version 5.3) für die Emissionsberichtserstattung 2013, ed. W. Knörr, ifeu - Institut für Energie- und Umweltforschung Heidelberg GmbH, Heidelberg, Germany, 2012.
- S. Hausberger, M. Rexeis, M. Zallinger and R. Luz, Emission Factors from the Model PHEM for the HBEFA Version 3, Report Nr. I-20/2009 Haus-Em 33/08/679 from 07.12.2009, TU Graz, Graz University of Technology, Graz, Austria, 2009 Search PubMed.
- ERMES: European Research Group on Mobile Emission Sources, Information Paper“Diesel light duty vehicle NOxemission factors”, ERMES 2015-10-09, INFRAS, Bern, Switzerland, 2015.
- National Trend Tables for the German Atmospheric Emission Reporting, ANNEX 1: National sector emissions: Main pollutants, particulate matter, heavy metals and persistent organic pollutants, Excel spreadsheets DE_2015_Table_I_1990.xls - DE_2015_Table_I_2013.xls, ed. P. Gniffke, Umweltbundesamt, Deutschland, Dessau, 27 April 2015 Search PubMed.
- Umweltbundesamt, Entwicklung der Luftqualität in Deutschland, Umweltbundesamt Deutschland, Fachgebiet II 4.2, “Beurteilung der Luftqualität”, Dessau-Roßlau, October 2009, pp. 5–7.
- U. Kugler, J. Theloke and W. Jörß, Verkehrsemissionsmodellierung - Modellvergleich und alternative Szenarien, Umweltbundesamt, Dessau-Roßlau, Germany, 2013 Search PubMed.
- A. Niedojadlo, K. H. Becker, R. Kurtenbach and P. Wiesen, Atmos. Environ., 2007, 41, 7108–7126 CrossRef CAS.
- T. Schmitz, D. Klemp and D. Kley, Messungen der Immissionskonzentrationen verschiedener Ozonvorläufersubstanzen in Ballungsgebieten und an Autobahnen - Charakterisierung der Emissionsverhältnisse des Straßenverkehrs unter verschiedenen Verkehrssituationen durch Messungen in Quellnähe, Berichte des Forschungszentrums Jülich, Jül-3457, Jülich, Germany, 1997 Search PubMed.
- S. Urban, Charakterisierung der Quellverteilung von Feinstaub und Stickoxiden in ländlichem und städtischem Gebiet, Schriften des Forschungszentrums Jülich, Energy & Environment, Jülich, Germany, 2010, vol. 84 Search PubMed.
- T. Kern, N. Metz and D. Kley, Untersuchungen von Verkehrsabgasemissionen insbesondere im Hinblick auf die Ozonbildung, Abschlussbericht, Forschungszentrum Jülich, Jülich, Germany, 1997 Search PubMed.
- K. Mannschreck, Experimentelle Bestimmung von städtischen Emissionen anhand von Konzentrationsmessungen im Lee einer Stadt, Berichte des Forschungszentrums Jülich, Jül-3846, Jülich, Germany, 2001 Search PubMed.
- D. Klemp, K. Mannschreck, H. Pätz, M. Habram, P. Matuska and F. Slemr, Atmos. Environ., 2002, 36(1), 61–80 CrossRef.
- B. Mittermaier and D. Klemp, EGU General Assembly 2004, Nice, France, 25 April 2004–30 April 2004.
- C. Ehlers, Mobile Messungen - Messung und Bewertung von Verkehrsemissionen, Schriften des Forschungszentrums Jülich, Energy & Environment, Jülich, Germany, 2014, vol. 229 Search PubMed.
- M. Barker, M. Hengst, J. Schmid, H.-J. Buers, B. Mittermaier, D. Klemp and R. Koppmann, Eur. Respir. J., 2006, 27, 929–936 CAS.
- T. Schmitz, D. Hassel and F.-J. Weber, Atmos. Environ., 2000, 34, 4639–4647 CrossRef CAS.
- B. Mittermaier and D. Klemp, Gefahrstoffe, Reinhaltung der Luft, 2004, vol. 64, pp. 487–494 Search PubMed.
- J. Drummond, A. Volz and D. Ehhalt, J. Atmos. Chem., 1985, 2, 287–306 CrossRef CAS.
- A. Volz and J. Drummond, Fresenius' Z. Anal. Chem., 1984, 317, 355–358 CrossRef CAS.
- D. H. Ehhalt, H.-P. Dorn and D. Poppe, Proc. R. Soc. Edinburgh, Sect. B: Biol. Sci., 1991, 97, 17–34 Search PubMed.
- R. Atkinson, S. M. Aschmann and J. Arey, Atmos. Environ., 1990, 24, 2647–2654 CrossRef.
- A. K. Mollner, S. Valluvadasan, L. Feng, M. K. Sprague, M. Okumura, D. B. Milligan, W. J. Bloss, S. P. Sander, P. T. Martien, R. A. Harley, A. B. McCoy and W. P. L. Carter, Science, 2010, 330, 646–649 CrossRef CAS PubMed.
- S. M. Saunders, M. E. Jenkin, R. G. Derwent and M. J. Pilling, Atmos. Chem. Phys., 2003, 3, 161–180 CrossRef CAS.
- T. Wiedmann, J. Kersten and K. Ballschmiter, Art und Menge von stofflichen Emissionen aus dem Verkehrsbereich, Akademie für Technikfolgenabschätzung in Baden-Württemberg, Stuttgart, Germany, 2000 Search PubMed.
- R. E. Dunmore, J. R. Hopkins, R. T. Lidster, J. D. Lee, M. J. Evans, A. R. Rickard, A. C. Lewis and J. F. Hamilton, Atmos. Chem. Phys., 2015, 15, 9983–9996 CAS.
- U. Steinemann and F. Zumsteg, Verkehrs- und Schadstoffmessungen 2008 im Gubristtunnel (Traffic and trace gas pollutant measurements 2008 in the Gubrist tunnel); report US 89-16-13, OSTLUFT durch Amt für Abfall, Wasser, Energie und Luft des Kantons Zürich (AWEL), Zürich, Switzerland, updated 25 May 2010.
- L. Ammoura, I. Xueref-Remy, V. Gros, A. Baudic, B. Bonsang, J.-E. Petit, O. Perrussel, N. Bonnaire, J. Sciare and F. Chevallier, Atmos. Chem. Phys., 2014, 14, 12871–12882 CAS.
| This journal is © The Royal Society of Chemistry 2016 |

