DOI:
10.1039/C3RA43339K
(Paper)
RSC Adv., 2014,
4, 6527-6534
Shape controlled synthesis of CeO2 nanostructures for high performance supercapacitor electrodes
Received
1st July 2013
, Accepted 30th October 2013
First published on 14th November 2013
Abstract
We report CeO2 nanostructures with the desired shape synthesized via a simple hydrothermal approach without any specific structure directing agent for supercapacitor applications. Well-distributed hexagonal nanoplates and nanorods were designed with large exposed surfaces under controlled hydrothermal conditions. As an advantage of this favorable shape and structural features, both of these nanostructures exhibit large specific capacitance values and excellent rate capabilities. Unique carbon supported CeO2 nanorod microstructures have shown a high capacitance of 644 F g−1 at 0.5 A g−1. Furthermore, they can deliver up to 400 F g−1 at a high current density of 20 A g−1. This is the first report of a CeO2 nanostructure for use as a supercapacitor electrode with a high rate capability. The notable electrochemical performance can be attributed to its large exposed surface, reasonable electronic conductivity, and the carbon support which increases the electrode/electrolyte contact significantly. The observed specific capacitance values are much higher and comparable with the other transition metal oxide electrodes. The present study suggests that the shape controlled CeO2 nanostructure will be an alternative high performance electrode for next generation supercapacitors.
Introduction
Over lithium ion batteries, supercapacitors offer high power density, higher energy density, a long cycle life and a short charging time.1–3 One of the unique properties of supercapacitors is their specific power density, which is a specific requirement for different kinds of electric machines and vehicles.2 The fabrication of smart electrochemical capacitors or supercapacitors with superior electrode materials is a leading and stimulating task among researchers. Consequently it is necessary to find a suitable electrode material with a supreme specific capacitance (Cs) and extensive cyclic stability.3 It is well accepted that the faradaic/redox type pseudocapacitors offer higher energy densities than electric double layer capacitors.4 The recognition of nanomaterials for supercapacitor applications has given a new extended platform to researchers in order to identify appropriate electrode materials that can deliver high power and energy densities. It is believed that nanostructured electrode materials can improve the power output and cycle life of a supercapacitor. A unique nanostructure with a high surface area, mesopores and a very short ion diffusion pathway may lead to a fast surface redox process. Furthermore, these features are directly related to surface morphology and microstructure.5 Therefore, various materials such as transition metal oxides, conducting polymers and high surface area carbonaceous materials have been investigated for supercapacitor applications. Due to their high theoretical capacitance and typical nanostructure, the single and bimetallic transition metal oxides such as RuO2, NiO, MnO2, Co3O4 and NiCo2O4 have shown very high specific power and ultra-high specific capacitance as well.6–16 However, their high cost and effects on the environment limit their large scale applications. Similarly, conducting polymers have attracted research interest but their instability over long cycles reduces their practical application.17 To continue, carbonaceous materials such as porous carbon, graphene and carbon nanotubes (CNT) have been studied in the last few decades. However, their specific capacitance values are still unsatisfactory for commercial appliances. The low conductivity of the carbon related materials and high contact resistance between the electrode and the current collector reduces their power output significantly.18
The alternative electrode materials for supercapacitors are the low cost rare earth metal oxides. In particular, CeO2 is expected to be a potential electrode material for supercapacitors, owing to its abundance across the Earth, dynamic redox couple and ecofriendly features. Recently, Li et al. have proved that three dimensional graphene with CeO2 nanoparticles is a high performance electrode for supercapacitors.2 Again, in the same way H. U. Ye-min et al. have reported that nickel foam supported CeO2 exhibits a higher specific capacitance than bare nickel foam due to the redox contribution of Ce3+/Ce4+.19 They have both enhanced the specific capacitance by mixing CeO2 with highly conducting substances. Similarly, the electrochemical activity of the CeO2 towards lithium ion batteries was reported by Fu Zhou et al.20 To the best of our knowledge there have been no reports published elsewhere about the use of CeO2 alone with a desired nanostructure and a large exposed surface for supercapacitor applications. Recently, the size and shape dependent behaviors of CeO2 have received great interest because of their technological applications. However, the controlled synthesis of the CeO2 nanostructure is still challenging. Regarding energy applications the major drawback of CeO2 is its low electronic conductivity. Thanks to the material, it is possible to tune the electronic conductivity by changing its shape and size using controlled synthetic conditions. In early research, Chiang et al. observed an electronic conductivity in CeO2 nanocrystals 4 orders of magnitude higher than the bulk grains.21 Therefore, it is important to control the shape, size and morphology of the CeO2 nanostructure in order to utilize the material to its full potential.
In the present work, we report a simple hydrothermal synthesis of CeO2 hexagonal nanoplates and carbon coated CeO2 nanorods with urea and D-glucose. The prepared CeO2 nanostructures were investigated for supercapacitor applications within an alkaline electrolyte. It is proven that the pristine CeO2 with the desired nanostructure delivers a high specific capacitance and excellent rate capability. As a result, the excellent electrochemical performance of the electrode reveals the potential of the CeO2 nanostructure for energy storage applications.
Synthesis of CeO2 hexagonal nanoplates
To synthesize CeO2 nanocrystals, analytical grade reagents were used as received without further purification. Briefly, 10 mM of Ce(NO3)3·6H2O and 1.5 g of urea were dissolved in 40 mL deionized (DI) water under stirring. After stirring for about 10 min, the clear solution was transferred to a Teflon-lined stainless steel autoclave and kept in an oven at 160 °C for 24 h. The solution was cooled down to room temperature naturally and the precipitate was separated and washed with deionized (DI) water, ethanol and acetone consecutively. Finally, the end product was dried at room temperature and then calcined at 300 °C under air for 3 h.
Synthesis of carbon coated CeO2 nanorods
A simple hydrothermal approach was followed to synthesize the carbon coated CeO2 nanorods as reported by Ting Zhu et al.22 Typically, 10 mM of cerium nitrate hexahydrate (Ce(NO3)3·6H2O; 99%, Alfa Aesar) and 1 g of D-glucose (Sigma Aldrich) were dissolved in 40 mL of deionized water under magnetic stirring. The obtained clear solution was transferred to a Teflon-lined stainless steel autoclave and kept at 180 °C for 12 h. Finally, the solution was cooled down to room temperature naturally and the precipitate was separated by centrifugation. After washing with DI water, ethanol and acetone several times, the end product was dried at room temperature. The carbonization process of the sample was completed after a heat treatment under Ar atmosphere for 2 h at 450 °C at a heating rate of 5° min−1.
Material characterization
The crystalline phases of the products were investigated by powder X-ray diffraction (Bruker, D2-PHASER) with Cu Kα radiation (λ = 1.5406 Å). FTIR spectra of the samples were obtained using a Perkin FTIR spectrophotometer in the wavenumber range of 400–4000 cm−1. Raman spectra of the samples were taken under the visible excitation of 514.3 nm using a Laser Raman Spectrophotometer. The morphologies of the samples were examined by high-resolution scanning electron microscopy (HRSEM; JEOL, JEM-2100F) and high resolution transmission electron microscopy (HRTEM; JEM-2010, 200 kV). The N2 adsorption and desorption measurements were performed with a Quantachrome QuadraWin (Version 5.02) analyzer.
Electrochemical measurements with a three electrode configuration were carried out in a CHI 7007C electrochemical workstation at room temperature. 3 M KOH solutions were used as the supporting electrolyte. The as-prepared CeO2 nanohexagons and carbon coated nanorods were used as the working electrode active materials. The working electrode was prepared by mixing the active material and the activated carbon in a weight ratio of 9![[thin space (1/6-em)]](https://www.rsc.org/images/entities/char_2009.gif) :1. 1 μL (5%) of Nafion binder was added to the above mixture and it made a homogenous slurry; this was coated onto nickel foil (∼1 cm2) to measure the electrochemical activity. Pt wire and a standard calomel electrode (SCE) were used as the counter and reference electrodes, respectively. The typical mass loading of CeO2 and CeO2/C on Ni foil was about 1 mg cm−2. Electrochemical impedance spectroscopy (EIS) measurements were carried out by applying an AC voltage with a 5 mV amplitude in a frequency range of 0.1 Hz to 100 kHz at open circuit potential.
:1. 1 μL (5%) of Nafion binder was added to the above mixture and it made a homogenous slurry; this was coated onto nickel foil (∼1 cm2) to measure the electrochemical activity. Pt wire and a standard calomel electrode (SCE) were used as the counter and reference electrodes, respectively. The typical mass loading of CeO2 and CeO2/C on Ni foil was about 1 mg cm−2. Electrochemical impedance spectroscopy (EIS) measurements were carried out by applying an AC voltage with a 5 mV amplitude in a frequency range of 0.1 Hz to 100 kHz at open circuit potential.
Results and discussion
Structure and morphological analysis
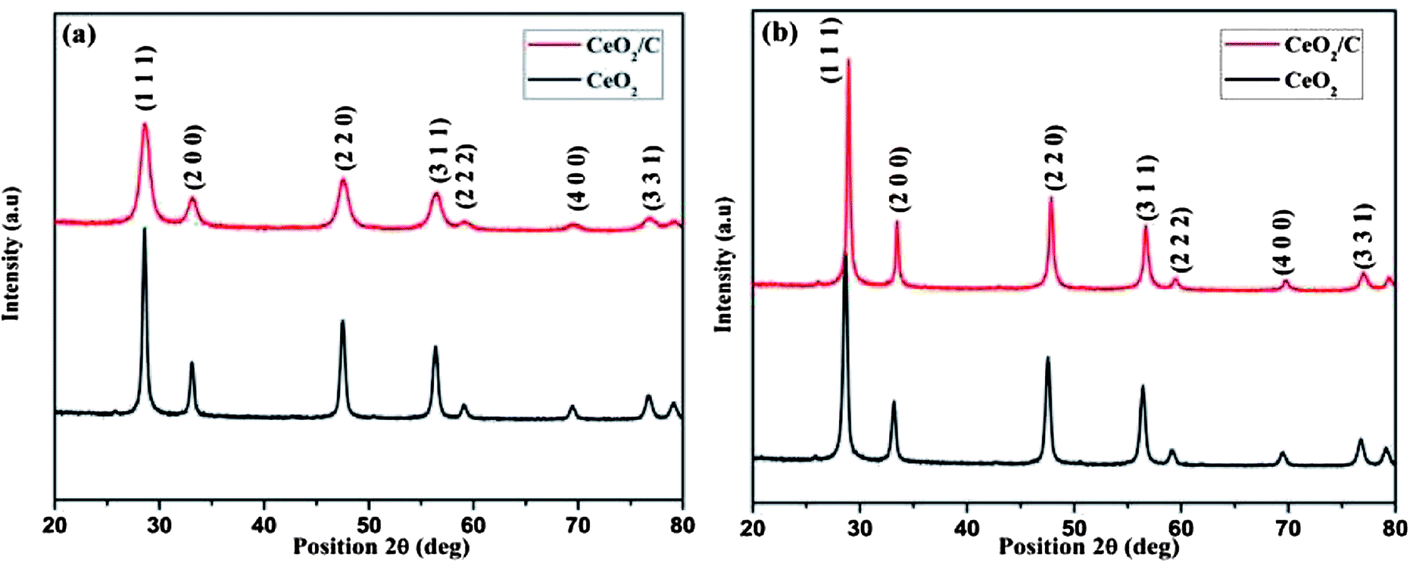
The XRD patterns of the hydrothermally synthesized CeO2 nanoparticles before and after heat treatment are shown in Fig. 1(a) and (b). Both the CeO2 hexagonal nanoplates and carbon coated CeO2 nanorods have similar XRD patterns with well-developed reflections. The diffraction peaks of all of the XRD patterns can be directly indexed to the cubic CeO2 phase and are in agreement with the corresponding JCPDS (PDF # 81-0792) card for as-prepared and calcined samples as well.20 There were no other phases of ceria (Ce2O3) found in the patterns which indicates that phase pure CeO2 with the Fm3m space group was formed under the proposed hydrothermal conditions.
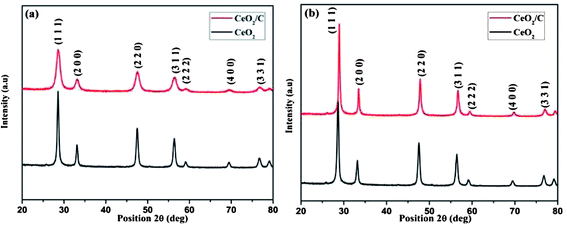 |
| | Fig. 1 XRD patterns of (a) as-prepared and (b) heat treated CeO2 hexagonal nanoplates and carbon coated nanorods. | |
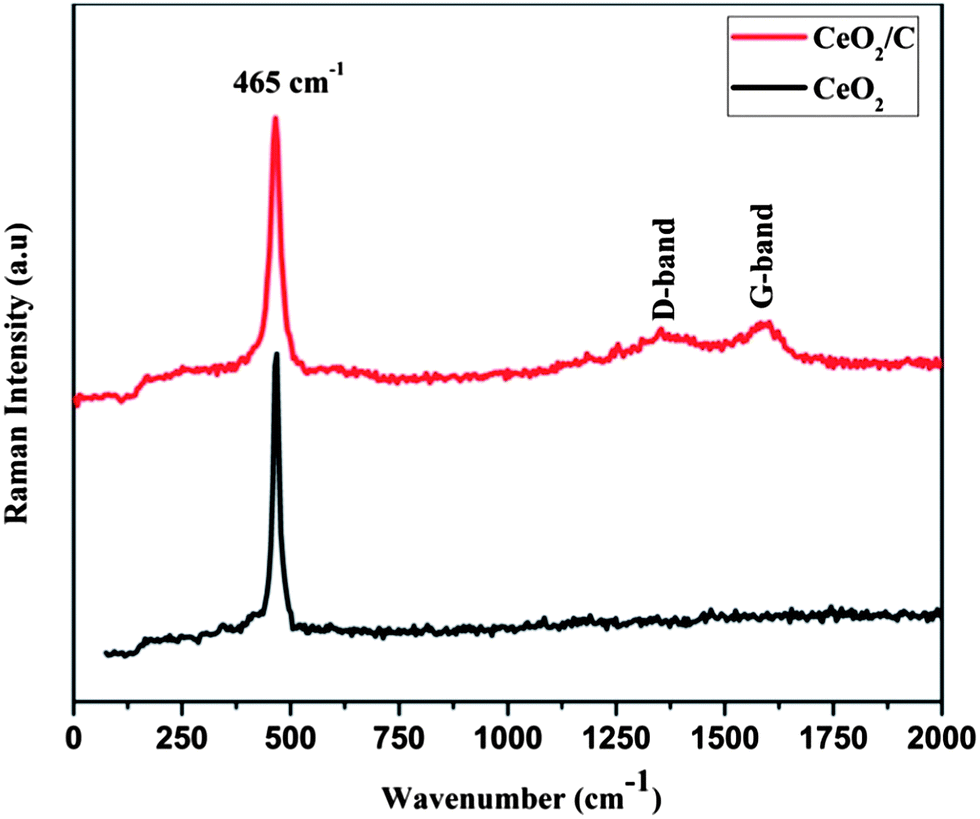
Fig. 2 shows the FTIR spectra of the CeO2 nanostructures after the specified heat treatments. The strong absorption band in the low wavenumber region around 600–500 cm−1 is due to characteristic Ce–O vibrations. The new absorption band at 1000–1300 cm−1 is assigned to the C–OH, O–C and C–C bond vibrations which evidently prove the presence of carbon on the CeO2 nanoparticles.23,24 The broad intense bands above 3000 cm−1 and at around 1628 cm−1 are associated with the –OH stretching and bending vibrations of physically adsorbed or internally bonded water molecules.25 When compared to bare CeO2, the carbon coated nanorods have a more intense –OH band which demonstrates an increased amount of moisture on the surface of the particles. For further confirmation micro-Raman spectra were carried out for both the CeO2 hexagonal nanoplates and the carbon supported nanorods as well and are shown in Fig. 3. It can be seen that the characteristic Raman mode of CeO2 at 465 cm−1 strongly evidences the formation of cubic ceria nanocrystals.26 This is directly assigned to the symmetric vibrations of the Ce–O (F2g) Raman active mode.26–28 The effect of the microstructure on the shape of the Raman spectra is also visible in the observed spectra. The carbon coated CeO2 nanorods show the broad characteristic Raman mode at 461 cm−1, which is in good agreement with the earlier reports.29,30 In addition to the characteristic Raman mode, the CeO2 nanorods exhibit broad bands around the 1200–1500 cm−1 region, which correspond to the carbon based vibrational Raman modes. The band at 1356 cm−1 is attributed to the disordered D-band carbon and the peak at 1581 cm−1 corresponds to the graphitic G-band carbon.31,32 This Raman analysis further confirms that the CeO2 nanorods have the glucose derived dense carbon layer on their surface.
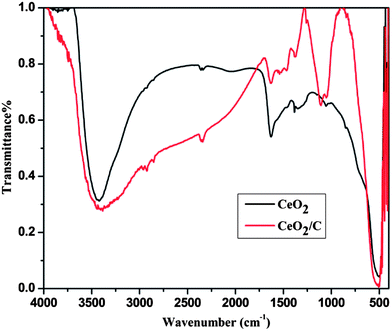 |
| | Fig. 2 FTIR spectra of the CeO2 hexagonal nanoplates (black) and the CeO2/C nanorods (red). | |
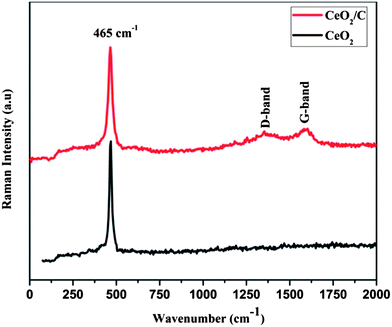 |
| | Fig. 3 Laser Raman spectra of the CeO2 hexagonal nanoplates (black) and the CeO2/C nanorods (red). | |
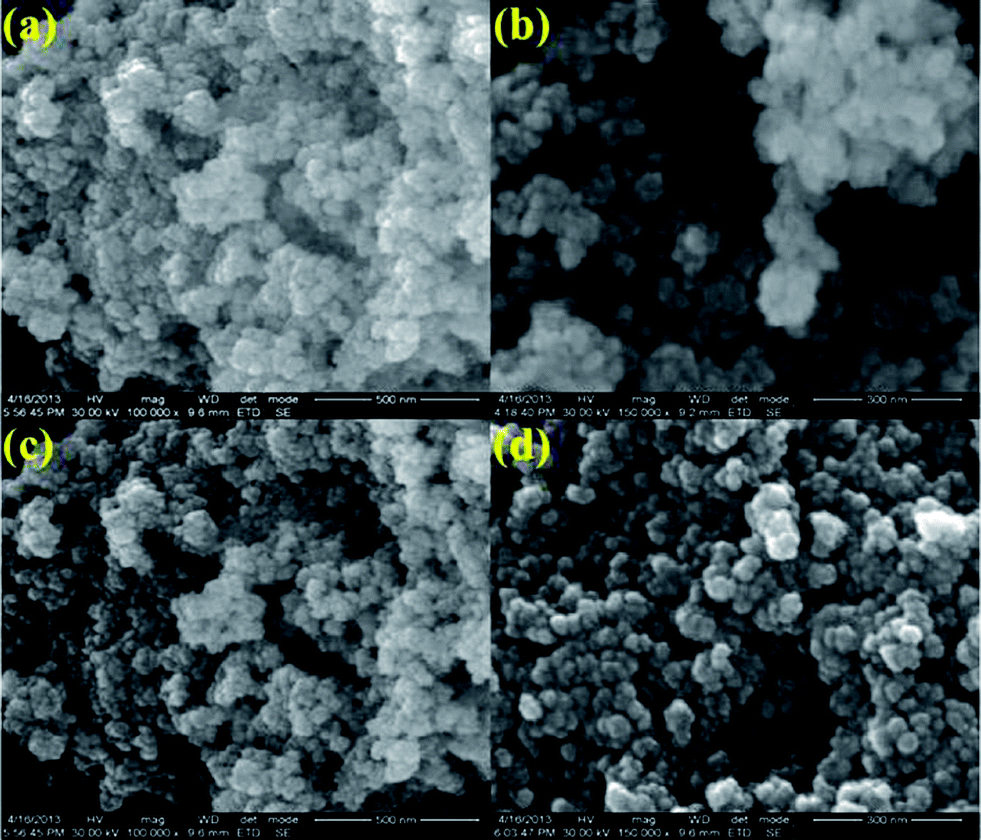
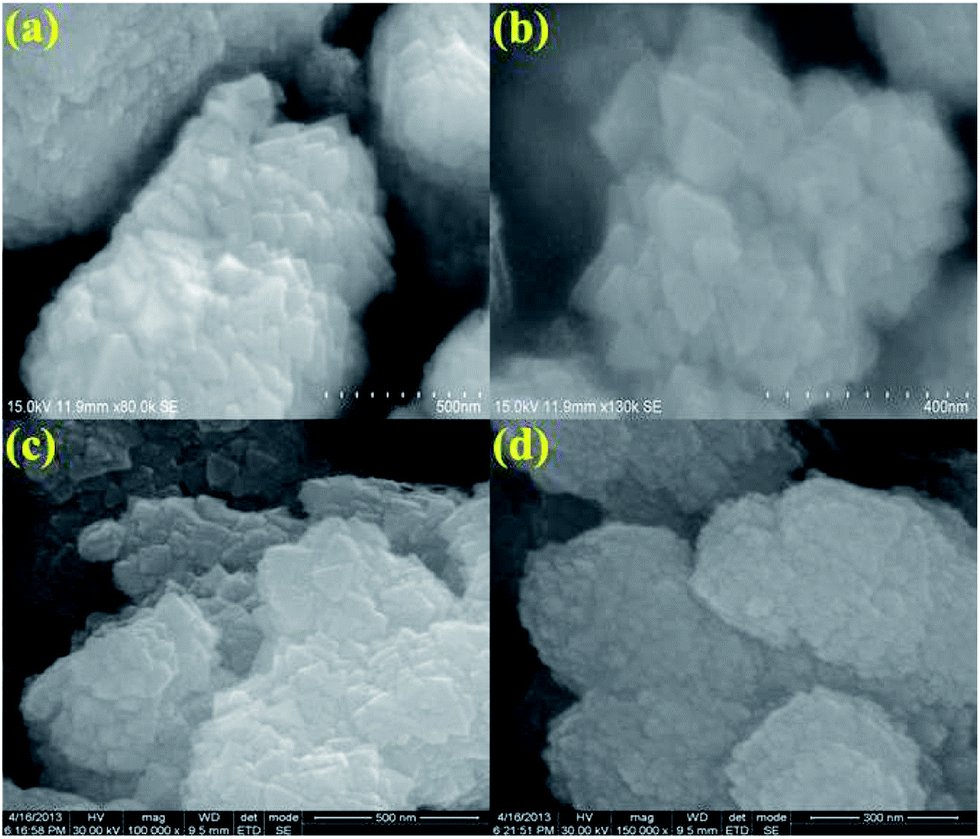
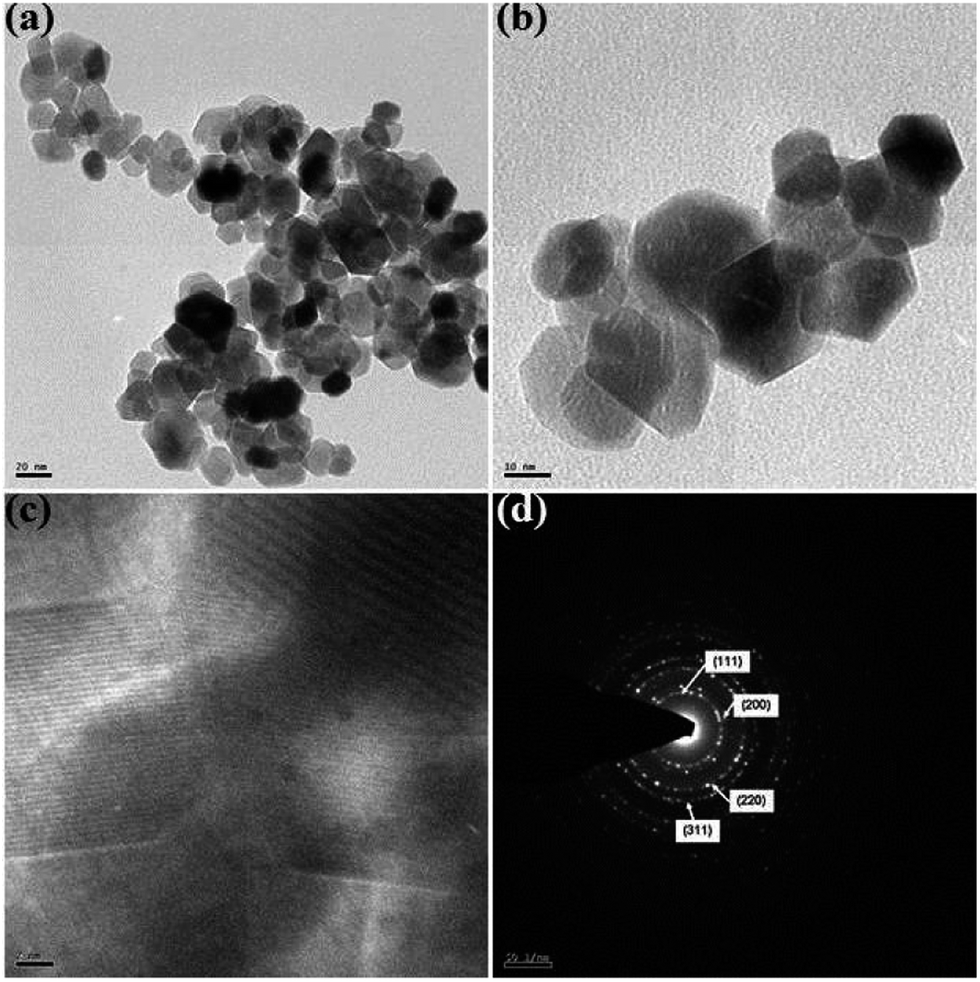
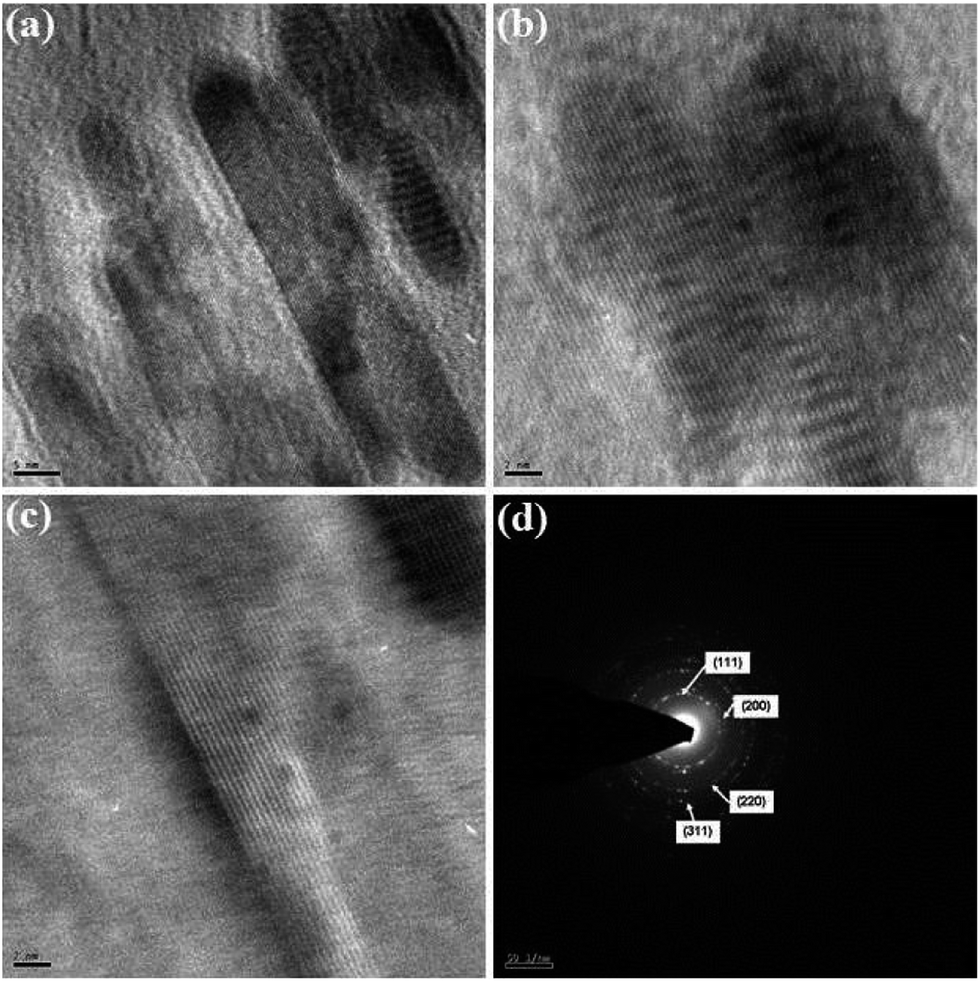
The morphology, dimension and size of the as-synthesized CeO2 and CeO2/C were investigated by HRSEM and HRTEM. Due to the synthesis procedures, the surface morphologies have visible discrepancies in the HRSEM analysis. Typical HRSEM images of CeO2 synthesized with urea before and after the heat treatment are illustrated in Fig 4(a–d). They show a clear surface overview of the samples and indicate the formation of aggregated nanohexagons. A group of ultrafine nanocrystals combined together to form larger particles during the nucleation process. It can be seen that the hexagonal nanoplates overlap with each other and have an aggregated morphology. Furthermore, no significant change in the morphology was observed between the as-prepared and heated samples, which confirms the formation of the CeO2 nanostructure under direct hydrothermal conditions without oxidizing processes. In the presence of D-glucose, CeO2 nanocrystals have an undefined morphology with sharp edges for both the as-prepared and the carbonized samples which are represented in Fig 5(a–d). This is due to the presence of an amorphous carbon layer on the metal oxide surface. Also it confirms the successful formation of the CeO2 nanostructure with a carbon support under simple hydrothermal conditions. However, the morphology of the CeO2/C nanostructure is not visible in the HRSEM images because of the insufficient magnification. Despite our best efforts, the morphology of the nanoparticles covered by amorphous carbon is not visible even with TEM.33 Here, D-glucose acts as a template as well as the source for carbon under hydrothermal conditions. The presence of carbon was confirmed in an EDAX spectrum (not shown here). It revealed that a trace amount of carbon (∼5%) was present in the CeO2/C sample while it was not detected in the bare CeO2 hexagonal nanoplates. For better scrutiny of the morphologies, TEM and HRTEM images were taken for both pristine and carbon coated CeO2 nanoparticles which are shown in Fig. 6(a–d) and Fig. 7(a–d). Viewing the particles in the high magnification TEM images, the pristine CeO2 exhibits a thin hexagonal plate-like shape with an almost uniform distribution and the carbon coated sample shows uniform nanorods compiled completely within the amorphous carbon. There were no additional carbon materials such as carbon spheres or particles found in the HRTEM images. This confirms the complete carbonization of CeO2 nanorods under the D-glucose assisted hydrothermal conditions. From the HRTEM images it can be seen that the lengths of the carbon coated CeO2 nanorods are ∼20 nm as shown in Fig 7. The presence of carbon on the CeO2 surface can be seen in the textured HRTEM images.34 It protects the material from phase transformation during redox reactions and gives it excellent electrochemical stability. This kind of desired nanostructure could provide large exposed surfaces and more active sites for redox processes. The selected area electron diffraction (SAED) pattern of bare CeO2 shows well resolved intense rings, without any dislocations, which correspond to the cubic ceria [hkl] planes as shown in Fig 6(d) and proves the polycrystalline nature of the material. Whereas in CeO2/C, the SAED pattern as in Fig 7(d) shows only diffused rings with lower intensities and confirms the presence of the amorphous carbon layer on the metal oxide surface. These unique structural features of the CeO2 nanostructures are favorable towards an excellent electrochemical response in supercapacitor applications.
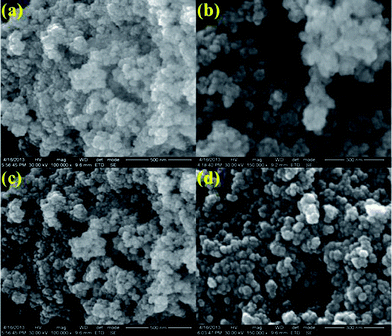 |
| | Fig. 4 HRSEM images of the as-prepared (a and b) and 300 °C heat treated (c and d) CeO2 hexagonal nanoplates. | |
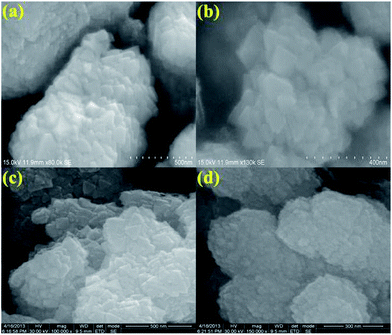 |
| | Fig. 5 HRSEM images of the as-prepared (a and b) and 450 °C heat treated (c and d) CeO2/C nanorods. | |
 |
| | Fig. 6 HRTEM images of the CeO2 hexagonal nanoplates (a–c) and (d) the corresponding SAED pattern. | |
 |
| | Fig. 7 HRTEM images of the carbon coated CeO2 nanorods (a–c) and (d) the corresponding SAED pattern. | |
Noteworthy to this investigation, different morphologies of the CeO2 hexagonal nanoplates and the carbon coated CeO2/C nanorods were obtained. The change in the morphology strongly depends on the typical hydrothermal conditions, hydrolyzing agent and reaction time. Urea assisted hydrothermal syntheses were reported by many researchers for metal oxide production. Owing to its controlled and homogenous supply of CO32− and OH− ions, urea has received more interest for metal hydroxide precipitation under hydrothermal conditions.35–39 The typical CeO2 hexagonal nanoplate formation mechanism has been proposed as follows:
| | |
CO(NH2)2 + 3H2O → 2NH3·H2O + CO2↑
| (1) |
| | |
Ce3+ + nNH3·H2O (excess) → [Ce4+(OH)4] + nNH4+
| (2) |
| | |
[Ce(OH)4] → CeO2 + 2H2O
| (3) |
Here during urea hydrolysis, NH3·H2O was produced and made the solution pH ∼8 which is more favorable for Ce(OH)3 precipitation. During the hydrothermal process, urea plays a crucial role in forming the hexagonal shape; the urea maintains the solution pH at above ∼8 by forming excess NH3·H2O or NH4OH. In this basic environment, the solubility product has reached a higher value than the solubility constant which means that there is a high supersaturation value.40 Under these conditions, there is a higher probability of homogenous Ce(OH)3 nucleation and oxidation processes occurring as well.39 Furthermore, the controlled production of OH− to form Ce(OH)4, and its conversion to CeO2 during the prolonged hydrothermal treatment at 160 °C may lead to the formation of the crystalline CeO2 hexagonal nanoplates. It was further confirmed with the XRD, HRSEM and HRTEM analyses as discussed earlier. Similarly, Liu et al. have reported the formation of hexangular CeO2 nanosheets under hydrothermal conditions in the presence of NH3·H2O at 230 °C for 6 h.40 However, the formation mechanism is not clear yet and it needs further comprehensive investigation.
Carbon coating is a process that can improve the electronic conductivity of electrodes which is necessary to achieve a better electrochemical performance in batteries and supercapacitors. It is quite a challenge to coat the carbon onto the metal oxide nanostructure under hydrothermal conditions. In this study, we have proposed a typical glucose assisted hydrothermal approach to synthesize stable CeO2/C nanorods for supercapacitors. Here, the glucose plays a critical role in designing the morphology during the carbonization process. The formation of the carbon coated CeO2 nanorods is based on the ‘coupled-synthesis’ as proposed by Xiaoming Sun et al.41 The processes which form the CeO2/C nanorods are dehydration, hydrolysis and carbonization in an inert atmosphere. Initially, the threshold hydrothermal conditions (180 °C at >2 h) initiate the dehydration of D-glucose and provide plenty of OH− ions for the Ce(NO3)3 hydrolysis. It is this that forms the Ce(OH)3 nanorods with a carbanion shell over the surface. Finally, the conversion of the carbon coated CeO2 nanorods during the prolonged hydrothermal conditions takes place. Under the prolonged threshold hydrothermal conditions the Ce(OH)3 oxidizes to CeO2 nanorods, followed by the carbonization of saccharides over the metal oxide surface. From this, it can be understood that the glucose carbonization determines the final morphology of the CeO2 nanostructure. It is further confirmed with the XRD, HRSEM and HRTEM analyses for the as-prepared and heat treated CeO2/C nanorods.
The specific surface areas and porous microstructures of the CeO2 nanostructures were analyzed by N2 adsorption–desorption measurements at 77 K. Typical isotherm curves are presented in Fig. 8(a and b). Both of the nanostructures show a distinct hysteresis loop and exhibit mesoporous characteristic features. This was further supported by the Barrett–Joyner–Halenda (BJH) pore size distribution curve as shown in Fig. 8 (inset). Here, the CeO2 hexagonal nanoplates have a Brunauer–Emmett–Tellar (BET) surface area of 29.3 m2 g−1 whereas the carbon supported CeO2 nanorods offer the high surface area of 36.2 m2 g−1 as well as narrow pore size distribution. Therefore, it can be understood that the carbon encapsulation of the CeO2 nanorods enhances their specific surface area and porosity which directly facilitate fast ion transfer at the electrode/electrolyte interface and leads to a superior electrochemical performance.
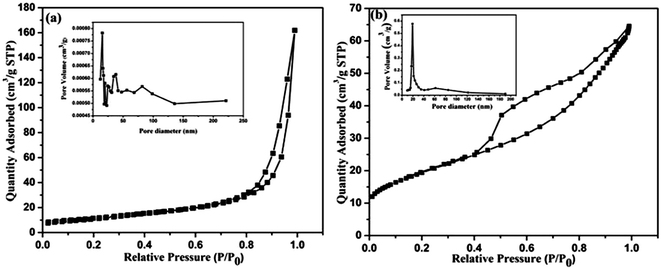 |
| | Fig. 8 N2 adsorption–desorption curves of the CeO2 hexagonal nanoplates (a) and carbon supported CeO2 nanorods (b) and the inset figures represent the corresponding pore-size distribution curves. | |
Electrochemical studies
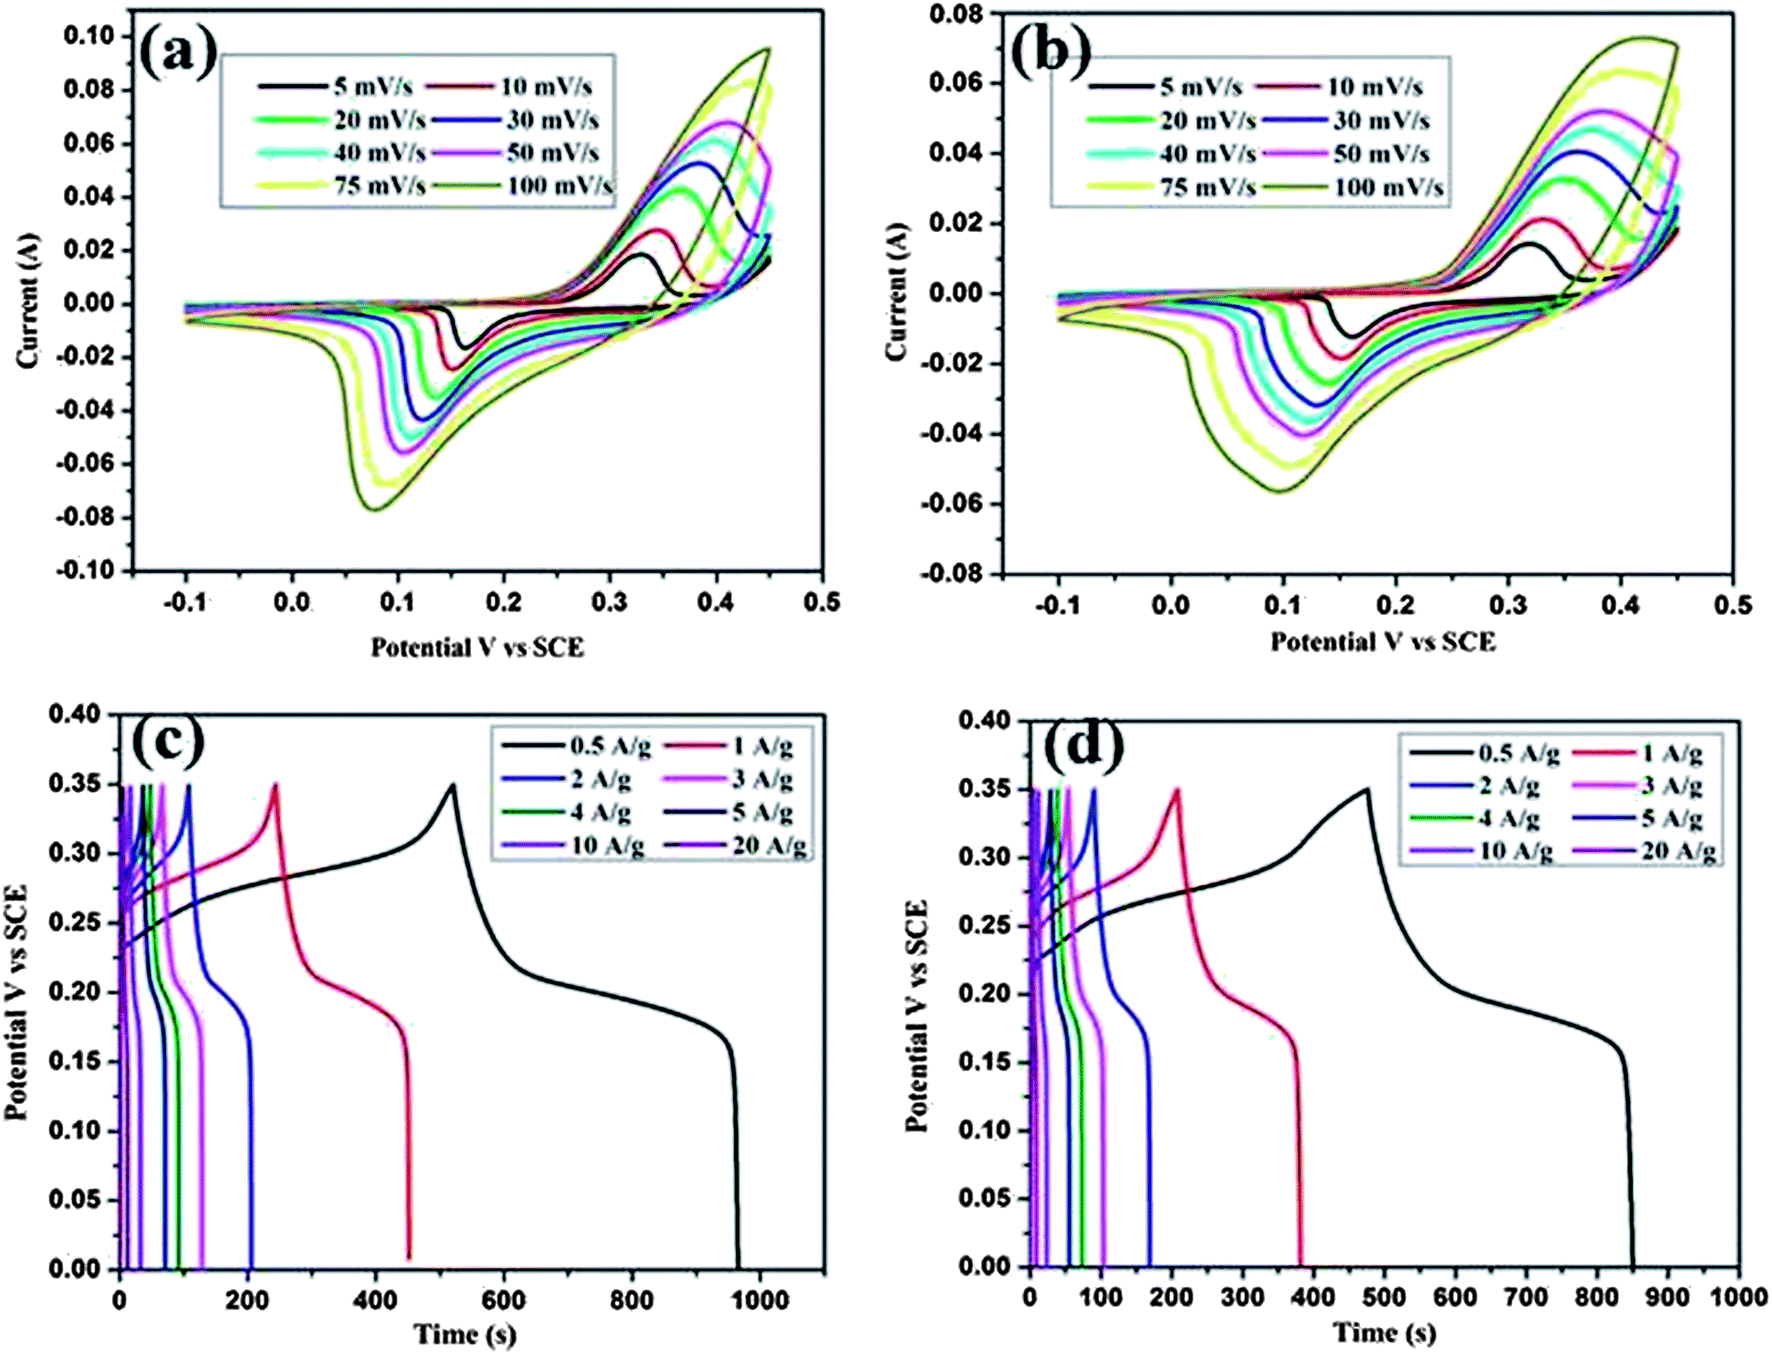
To explain the electrochemical capacitance of the CeO2 hexagonal nanoplates and the CeO2/C nanorods, cyclic voltammetry, galvanostatic charge/discharge and electrochemical impedance measurements were carried out in a 3 M KOH electrolyte solution. Cyclic voltammograms (CV) of both the CeO2 nanostructures were measured at different scan rates over the potential range of 0–0.45 V (vs. SCE) and are shown in Fig. 9(a and b). The shape of the CV curves clearly evidences the typical pseudocapacitive characteristics of the samples. The well resolved pair of redox peaks within the observed sweep potential for all of the sweep rates can be directly attributed to the faradaic redox reaction of Ce3+/Ce4+. In the CV curves there is the shift in both the anodic and cathodic peaks towards positive and negative potentials respectively with the scan rates.1 The linear increment of the peak current with the scan rate is attributed to the diffusion controlled redox process of the electrode. When compared to the hexagonal nanoplates, the internal area of the CV curve for the carbon coated nanorods is larger which is associated with the highly porous structure and high electrical conductivity due to the carbon layer. The reduction in the peak current should be due to the enhanced diffusion resistance at the electrode surface. However, the broadening in the redox peak is associated with the contribution of electric double layer capacitance at the CeO2/C interface. Both of these processes are lead by the amorphous carbon encapsulated by the CeO2 nanorods, thus enhancing the specific capacitance value significantly. The possible redox reactions are as follows:
| CeO2 + e− + H2O ↔ Ce3+OOH + OH− |
 |
| | Fig. 9 Cyclic voltammograms and charge–discharge curves of the CeO2 hexagonal nanoplates (a and c) and the carbon coated CeO2 nanorods (b and d). | |
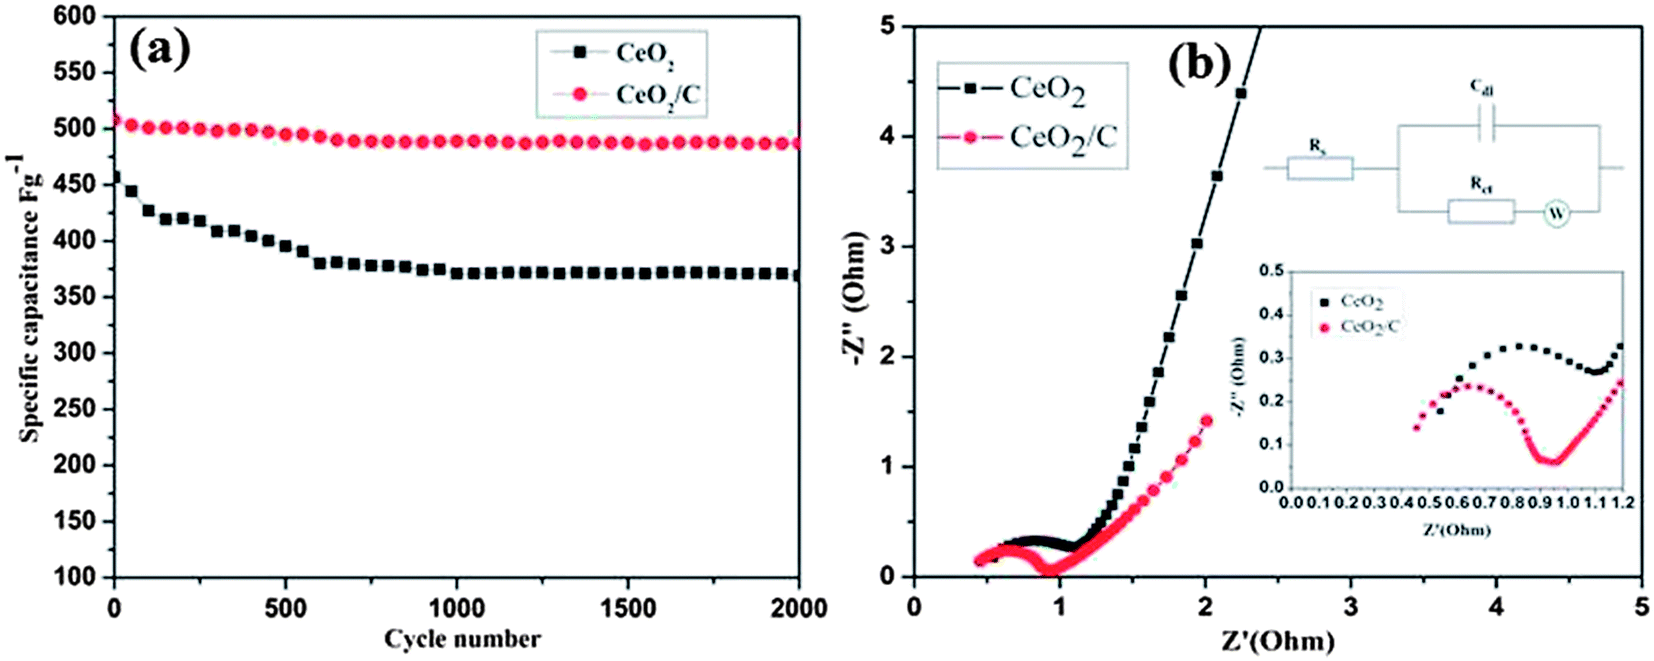
To understand the exact pseudocapacitive features of the CeO2 nanostructure, galvanostatic charge/discharge studies were conducted at different current densities and are illustrated in Fig. 9(c and d). All charge/discharge curves show the variation of the potential vs. time dependence over the measured potential region of 0–0.35 V (vs. SCE). Up to 0.2 V the charge/discharge curves are parallel to the potential axis, followed by a sloped variation up to 0.35 V which can be attributed to the surface redox reaction or electrochemical adsorption–desorption at the electrode/electrolyte interfaces.2 The specific capacitance (Cs) is estimated from the equation Cs = It/mV as reported earlier.1–4 Where I is the constant discharge current, m is the mass of the active material, V is the potential difference and t is the discharge time. The estimated Cs is 602 F g−1 for the hexagonal CeO2 nanoplates and 644 F g−1 for the carbon coated CeO2 nanorods at 0.5 A g−1. Upon further increasing the current density to 20 A g−1 the corresponding Cs value decreases to 381 F g−1 and 400 F g−1 for pristine and carbon coated CeO2 respectively. Observed Cs values are comparatively much higher than those in the reports of Li et al. and H. U. Ye-min et al.2,19 However, these values are very high compared to the other transition metal oxide nanostructures reported by various researchers.9–11 To evaluate the cyclic stability of the electrode material the continuous charge/discharge measurement was tested over 2000 cycles at a constant density of 10 A g−1. From Fig. 10(a) it can be seen that the specific capacitance decreased in the initial cycles up to 400 cycles for the bare hexagonal CeO2 nanoplates due to the increasing internal resistance of the materials, but following this was stable up to 2000 cycles. The carbon coated CeO2 nanorods (Fig 10(a) red line) show excellent stability over the measured 2000 cycles and only 9.6% capacitance loss was observed. This result further confirms that the presence of the carbon layer retains the electronic conductivity and keeps the electrode wet, which increases the stability of the electrode significantly. The excellent electrochemical performance could be mainly due to the desired nanostructural features of the material.42 Well-defined hexagonal nanoplates and carbon supported nanorods lead to a greater access of the electrolyte ions due to the smaller ion diffusion path and more active surface sites. In particular, carbon coating on CeO2 nanorods has enhanced their electrochemical kinetics and it provides high Cs and long cycling stability. Furthermore, at high current densities, the small thickness of the hexagonal nanoplates and considerable low diameter of the nanorods could facilitate the fast ion transport during the charge/discharge process.
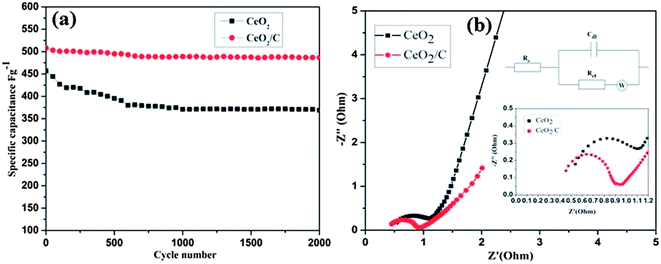 |
| | Fig. 10 (a) Cyclic stability and (b) electrochemical impedance spectra of the CeO2 hexagonal nanoplates (Black) and the carbon coated CeO2 nanorods (Red), (b) insets show the high frequency region of impedance curve and the corresponding equivalent circuit as well. | |
The observed electrochemical response from the CeO2 nanostructure electrodes was further explained by electrochemical impedance spectroscopy (EIS). Both of the spectra have a small semicircle in the high frequency region and a sloped straight line in the low frequency region as in Fig 10(b). A typical Nyquist plot fitted with the equivalent circuit as shown in Fig 10(b) (inset) which consists of solution resistance Rs, charge transfer resistance Rct and the contact resistance of the electrode/current collector interface.3 The charge transfer resistance (Rct) can be estimated directly from the diameter of the semicircle.43 At low frequencies the sloped vertical line corresponds to the electrolyte ion diffusion and proton diffusion in the host materials.2 The measured Rct values for the CeO2 hexagonal nanoplates and the carbon coated nanorods are found to be ∼0.7 ohm and ∼0.5 ohm respectively. The reduced charge transfer resistance of the carbon coated CeO2 nanorods undoubtedly certifies the high electronic conductivity of the sample. The extended tail immediately after the semicircle can be attributed to the contribution of Warburg diffusion resistance at the CeO2/C interface. The small Rs and Rct values are due to fast charge diffusion within the desired microstructures which leads to a large specific capacitance, and the linear slope in the low frequency region further evidences the good supercapacitive features of the CeO2 nanostructures.1,2
Conclusions
In summary, for the first time we have reported hydrothermally synthesized CeO2 of two different shapes with large exposed surfaces and porous microstructures. Based on its shape and porous nature the CeO2 can be used as an electrode for supercapacitors. As the supercapacitor electrode, the CeO2 nanohexagons and CeO2/C nanorods exhibited a maximum specific capacitance of 381 F g−1 and 400 F g−1 respectively at the constant current density of 20 A g−1. These CeO2 nanostructures have shown excellent rate capability and long term stability as well. The outstanding electrode performance of the CeO2 nanostructure was mainly attributed to the large exposed active surface area, porous microstructure and reasonable electrical conductivity of the electrode material. The enhanced electronic conductivity due to the carbon layer is an added advantage for enhancing the specific capacitance and electrode stability. From this study, we concluded that CeO2 with a unique shape can be used as an efficient electrode material for high performance supercapacitors.
References
- Q. Wang, B. Liu, X. Wang, S. Ran, L. Wang, D. Chen and G. Shen, J. Mater. Chem., 2012, 22, 21647–21653 RSC.
- Y. Wang, C. Xian Guo, J. Liu, T. Chen, H. Yanga and C. Ming Li, Dalton Trans., 2011, 40, 6388–6391 RSC.
- X. Lu, X. Huang, S. Xie, T. Zhai, C. Wang, P. Zhang, M. Yu, W. Li, C. Liang and Y. Tong, J. Mater. Chem., 2012, 22, 13357–13364 RSC.
- C.-Y. Cao, W. Guo, Z.-M. Cui, W.-G. Song and W. Cai, J. Mater. Chem., 2011, 21, 3204–3209 RSC.
- S. Chen, W. Xing, J. Duan, X. Huc and S. Z. Qiao, J. Mater. Chem. A, 2013, 1, 2941–2954 CAS.
- T.-S. Hyun, H. L. Tuller, D.-Y. Youn, H.-G. Kim and I.-D. Kim, J. Mater. Chem., 2010, 20, 9172–9179 RSC.
- I.-L. Chen, T.-Y. Chen, C.-C. Hu and C.-H. Lee, J. Mater. Chem. A, 2013, 1, 2039–2049 CAS.
- Y.-K. Hsu, Y.-C. Chen, Y.-G. Lin, L.-C. Chen and K.-H. Chen, Chem. Commun., 2011, 47, 1252–1254 RSC.
- M. N. Patel, X. Wang, D. A. Slanac, D. A. Ferrer, S. Dai, K. P. Johnston and K. J. Stevenson, J. Mater. Chem., 2012, 22, 3160–3169 RSC.
- X.-h. Xia, J.-p. Tu, X.-l. Wang, C.-d. Gu and X.-b. Zhao, J. Mater. Chem., 2011, 21, 671–679 RSC.
- S. Xiong, C. Yuan, X. Zhang and Y. Qian, CrystEngComm, 2011, 13, 626–632 RSC.
- J. Zhi, S. Deng, Y. Zhang, Y. Wang and A. Hu, J. Mater. Chem. A, 2013, 1, 3171–3176 CAS.
- X.-h. Xia, J.-p. Tu, Y.-j. Mai, X.-l. Wang, C.-d. Gu and X.-b. Zhao, J. Mater. Chem., 2011, 21, 9319–9325 RSC.
- C. Yuan, J. Li, L. Hou, L. Yang, L. Shen and X. Zhang, J. Mater. Chem., 2012, 22, 16084–16090 RSC.
- H.-W. Wang, Z.-A. Hu, Y.-Q. Chang, Y.-L. Chen, H.-Y. Wu, Z.-Y. Zhang and Y.-Y. Yang, J. Mater. Chem., 2011, 21, 10504–10511 RSC.
- Q. Lu, Y. Chen, W. Li, J. G. Chen, J. Q. Xiao and F. Jiao, J. Mater. Chem. A, 2013, 1, 2331–2336 CAS.
- Jaidev, R. I. Jafri, A. K. Mishra and S. Ramaprabhu, J. Mater. Chem., 2011, 21, 17601–17605 RSC.
- L. Sun, C. Tian, M. Li, X. Meng, L. Wang, R. Wang, J. Yin and H. Fu, J. Mater. Chem. A, 2013, 1, 6462–6470 CAS.
- H. U. Ye-min, S. H. I. Tao-tao, N. I. Jian-sen, J. I. N. Hong-ming, Z. H. U. Ming-yuan, L. I. Ying and B. A. I. Qin, J. Shanghai Jiaotong Univ. (Sci.), 2012, 17(5), 513–516 CrossRef PubMed.
- F. Zhou, X. Zhao, H. Xu and C. Yuan, J. Phys. Chem. C, 2007, 111, 1651–1657 CAS.
- Y.-M. Chiang, E. B. Lavik, I. Kosacki, H. L. Tuller and J. Y. Ying, Appl. Phys. Lett., 1996, 69(2), 185–187 CrossRef CAS PubMed.
- T. Zhu, J. S. Chen and X. W. (David) Lou, J. Phys. Chem. C, 2011, 115, 9814–9820 CAS.
- D. Yang, P. Liu, Y. Gao, H. Wu, Y. Cao, Q. Xiao and H. Li, J. Mater. Chem., 2012, 22, 7224–7231 RSC.
- A. S. Adekunle and K. I. Ozoemena, Electrochim. Acta, 2008, 53, 5774–5782 CrossRef CAS PubMed.
- M. L. D. Santos, R. C. Lima, C. S. Riccardi, R. L. Tranquilin, P. R. Bueno, J. A. Varela and E. Longo, Mater. Lett., 2008, 62, 4509–4511 CrossRef PubMed.
- M. J. Godinho, R. F. Gonçalves, L. P. S. Santos, J. A. Varela, E. Longo and E. R. Leite, Mater. Lett., 2007, 61, 1904–1907 CrossRef CAS PubMed.
- M. Radovic, Z. D. Dohcevic-Mitrovic, A. Golubovic, B. Matovic, M. Šcepanovic and Z. V. Popovic, Acta Phys. Pol., A, 2009, 116, 614–617 CAS.
- B. Tatar, E. D. Sam, K. Kutlu and M. Urgen, J. Mater. Sci., 2008, 43, 5102–5108 CrossRef CAS PubMed.
- Z. Wu, M. Li, J. Howe, H. M. Meyer III and S. H. Overbury, Langmuir, 2010, 26(21), 16595–16606 CrossRef CAS PubMed.
- D. S. Jacob, I. Genish, L. Klein and A. Gedanken, J. Phys. Chem. Lett., 2006, 110(36), 17711–17714 CAS.
- C. Mahendiran, T. Maiyalagan, K. Scott and A. Gedanken, Mater. Chem. Phys., 2011, 128, 341–347 CrossRef CAS PubMed.
- C. Hu, Z. Zhang, H. Liu, P. Gao and Z. L. Wang, Nanotechnology, 2006, 17, 5983–5987 CrossRef CAS.
- S.-J. Park, H. Kim, Y.-J. Kim and H. Lee, Electrochim. Acta, 2011, 56, 5355–5362 CrossRef CAS PubMed.
- Y. Guo, H. Wang, C. He, L. Qiu and X. Cao, Langmuir, 2009, 25(8), 4678–4684 CrossRef CAS PubMed.
- S. K. Meher and G. R. Rao, ACS Catal., 2012, 2, 2795–2809 CrossRef CAS.
- N. Zhang, S. Liu, X. Fu and Y.-J. Xu, J. Phys. Chem. C, 2011, 115, 22901–22909 CAS.
- Z. Guo, F. Du, G. Li and Z. Cui, Inorg. Chem., 2006, 45, 4167–4169 CrossRef CAS PubMed.
- W.-Q. Han, L. Wu and Y. Zhu, J. Am. Chem. Soc., 2005, 127, 12814–12815 CrossRef CAS PubMed.
- Q. Wu, F. Zhang, P. Xiao, H. Tao, X. Wang and Z. Hu, J. Phys. Chem. C, 2008, 112, 17076–17080 CAS.
- B. Liu, Q. Li, X. Du, B. Liu, M. Yao, Z. Li, R. Liu, D. Liu, X. Zou, H. Lv, D. Li, B. Zou, T. Cui and G. Zou, J. Alloys Compd., 2011, 509, 6720–6724 CrossRef CAS PubMed.
- X. Sun, J. Liu and Y. Li, Chem. Mater., 2006, 18, 3486–3494 CrossRef CAS.
- G. Zhang and X. W. (David) Lou, Sci. Rep., 2013, 3, 1470, DOI:10.1038/srep01470.
- J. Xiao and S. Yang, RSC Adv., 2011, 1, 588–595 RSC.
|
| This journal is © The Royal Society of Chemistry 2014 |