
The effect of methacrylic acid in smooth coatings on dTHP1 and HUVEC gene expression†‡
Laura A.
Wells
*a and
Michael V.
Sefton
ab
aInstitute of Biomaterials and Biomedical Engineering, University of Toronto, Canada. E-mail: laura.wells@utoronto.ca; Fax: +1 (416) 978-4317
bDepartment of Chemical Engineering and Applied Chemistry, University of Toronto, Canada
First published on 6th August 2014
Abstract
Without any external additives such as growth factors, polymer beads containing methacrylic acid (MAA) promoted functional vascularization in vivo leading to faster cutaneous wound healing in diabetic mice and improved skin graft integration in Wistar rats. The aim of this work is to understand this material-driven vascularization by investigating the effect of polymer MAA-content, in the absence of surface roughness, on the behaviour of macrophage-like and endothelial cells. Smooth polymer films containing 20, 30 or 40% MAA or methyl methacrylate as a control copolymerized with isodecyl acrylate, were synthesized to study the effect of MAA content in smooth films, without roughness. Macrophage-like cells (dTHP1) incubated on 40% MAA films for 96 hours increased the expression of the angiogenic genes HIF1α and SDF1α, and of the inflammatory genes IL1β, IL6 and TNFα, while decreasing the expression of osteopontin. Endothelial cells (HUVEC) on 40% MAA films for 96 hours increased the expression of the angiogenic genes MMP9 and CXCR4, and of osteopontin. In dTHP1 cells, principal component analysis established a positive correlation between MAA polymer content, HIF1α expression and the expression of IL6, IL1β and TNFα, suggesting that HIF1α and NF-κB pathway may be involved. It was found that MAA chemistry, without topographical differences, promoted changes in gene expression in macrophage-like and endothelial cells. This effect was more significant above a threshold between 30 to 40% MAA. The amount of MAA in the copolymer likely promoted the cell responses, future work will study the effects of varying MAA content. The 40% MAA coatable material developed in this work may also be of interest as a coating to improve the integration of medical devices.
1. Introduction
A challenge in tissue engineering and wound healing is to effectively promote functional vascularization. A vasculature is required 150–200 μm from all cells for the delivery of oxygen and nutrients and the removal of waste.1 Designing biomaterials that promote vascularization can use many different approaches – based on biomolecule delivery or the control of polymer properties such as porosity.2 Polymer beads containing 45% methacrylic acid-co-methyl methacrylate (MAA beads) promoted functional vascularization in wound beds and accelerated full thickness cutaneous healing of wounds in diabetic mice3 and skin grafts in rats,4 without the addition of growth factors. In vitro, macrophage-like cells (dTHP1) grown with MAA beads (versus controls) had decreased osteopontin gene expression and increased IL6, IL1β and TNFα gene expression with no significant changes in typical angiogenesis-associated genes (FGF2, SDF1α, HIF1α, PDGFβ, VEGF, etc.); on the other hand, HUVEC grown with MAA beads (versus controls) had increased osteopontin gene expression.5 These studies suggest that cells interact with the beads causing changes in gene expression which induce vessel formation and faster wound healing.6,7 The details of these interactions remain to be elucidated.To enable the further investigation of the biological response to this material, smooth, solvent-castable, water-insoluble films containing varying amounts of MAA were synthesized. Such materials are also expected to be beneficial as a pro-vascularization coating on sensors and other medical devices to enable their integration without the barrier of a typical fibrotic foreign body response. The MAA beads used in past work were not smooth; hence these new polymer films (being smooth) will also enable a focus on the effects of chemistry, without the confounding effects of topography. Copolymers were made from methacrylic acid (MAA) or methylmethacrylate (MM) with isodecyl acrylate (IDA) as hydrophobic co-monomers (to prevent water solubility). The MAA is the critical active group. MM has been used before as an appropriate control.5 Films containing 20 to 40 mol% of MAA were compared with similar copolymers containing the inactive MM. Macrophage-like cells (differentiated THP1 cells) and endothelial cells (human umbilical vein endothelial cells, HUVEC) were cultured on the films and inflammatory and angiogenic gene expression evaluated by qPCR. Principal component analysis was used to elucidate data trends and correlations.
2. Methods
2.1. Materials and cells
MM, MAA, IDA, benzoyl peroxide and phorbol myristate acetate were purchased from Sigma Aldrich (Oakville, ON). RPMI 1640, fetal bovine serum (FBS) and alamarBlue® were purchased from Gibco, Invitrogen Canada Inc. (Burlington, ON).THP1 (TIB-202, ATCC, Manassas, VA) cells were grown in suspension at concentrations of 2 × 10⁴ to 8 × 10⁵ cells mL−1 suspended in RPMI 1640 medium supplemented with 10% fetal bovine serum, 25 mM HEPES, 2 mM L-glutamine and 1% penicillin/streptomycin at 37 °C and 5% CO2. Cells were differentiated into adherent macrophage-like dTHP1 cells with 100 nM phorbol myristate acetate (PMA) for 24 hours at which point the non-adherent cells and PMA were rinsed away with PBS and then replaced with fresh medium containing no PMA. Pooled HUVEC (Lonza, Mississauga, Canada) were grown to 80% confluency in EBM2 media supplemented with an EGM2 singlequot kit (2% FBS, hydrocortisone, FGF2, VEGF, R3-IGF-1, ascorbic acid, GA-1000, and heparin) at 37 °C and 5% CO2. HUVEC were passaged with trypsin and used at passage 3–6.
2.2. Copolymer synthesis
IDA was copolymerized with MAA or MM, using benzoyl peroxide (1 wt%), suspended in water at 70 °C under reflux for 90 minutes (Fig. 1), to obtain 20, 30 or 40% copolymers (mol% of MAA or MM). For example, for a 40 mol% MAA-IDA copolymer, 0.025 mol of MAA and 0.037 mol of IDA containing 1 wt% (4 × 10⁻⁴ mol) of dissolved benzoyl peroxide were reacted in 12 mL of endotoxin free water. The mixture was cooled, decanted and quenched with water or methanol. The polymer was then purified by precipitation from tetrahydrofuran (THF) into water–methanol and dried over several days at room temperature. NMR verified the reaction and purification. 1H NMR ratios of peaks at 3.65 (3H, MM) and 4.07 (2H, IDA) were used to monitor the reaction of MM with IDA. Since MAA and IDA peaks were not distinguished easily, back titration of NaOH solutions that were soaked with the polymers determined the carboxyl group concentration. In general, the resulting polymers were ±3% of the targeted compositions. MAA copolymer 1H NMR shifts: δH(400 MHz; CDCl3) 0.6–1.14 (br m, α-CH3), 1.45–2.3 (m, CH2), 4.07 (m, IDA), 7.26 (br s, COOH). MM copolymer 1H NMR shifts: δH(400 MHz; CDCl3) 0.6–1.14 (br m, α-CH3), 1.45–2.3 (m, CH2), 3.65 (m, O–CH3), 4.07 (m, IDA), 7.26 (s, COOH). Monitor: 3.65 (O–CH3, MM), 4.07 (m, O–CH3, IDA). δC(400 MHz; CDCl3) 16–22 (α-CH3), 53–56 (CH2), 52–53 (O–CH3), 45–47 (C), 180.5–183 (C(OOH)), 178–185.5 (C(COOCH3)).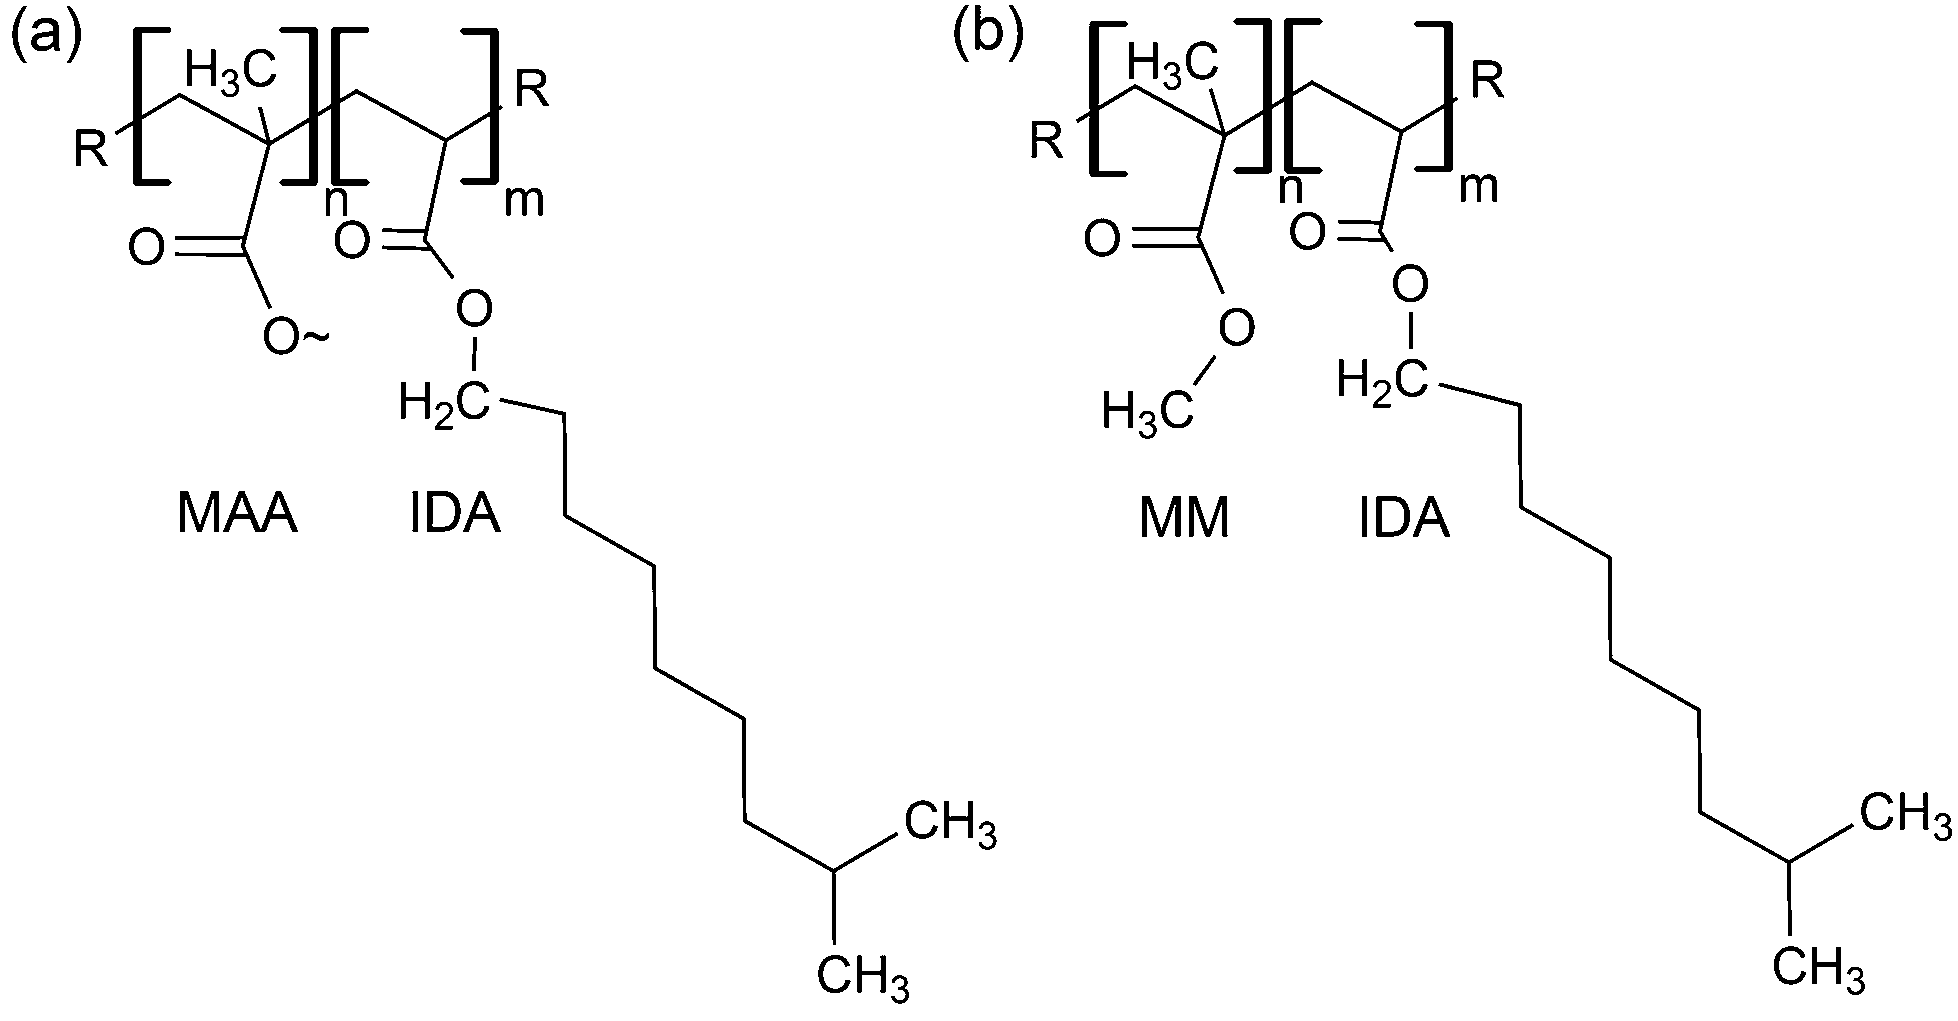 | ||
| Fig. 1 (a) Methacrylic acid (MAA) or (b) methyl methacrylate (MM) was copolymerized with isodecyl acrylate via free radical polymerization in varying formulations to create a library of materials. | ||
2.3. Film preparation and characterization
The purified copolymers were dissolved at 50 mg mL−1 in THF and coated (5.25 mg cm−2) by evaporation onto glass 55 mm diameter petri dishes (HUVEC gene studies), 22 mm diameter glass coverslips (dTHP1 gene studies, topography) or 18 mm diameter glass coverslips (cell viability, confocal and SEM studies).A Thermoscientific Theta Probe XPS assessed the elemental composition of the films to assess Si contamination. The thicknesses of the uncoated and coated coverslips were measured with a caliper. Roughness was monitored through profilometry and scanning electron microscopy. Mean surface roughness (Ra) of the different dry MAA films was determined using a KLA-Tencor P16+ stylus based profilometer with a tip diameter of 2μm, a scan length of 1000 μm, a scan speed of 20 μm s−1 and a sampling rate of 200 Hz. The surfaces of the films were imaged using a Hitachi S-3400N Variable Pressure Scanning electron microscope (SEM) run at 10.0 kV in environmental mode.
The microstructure of the MAA copolymer films was observed by staining MAA with 4′,6-diamidino-2-phenylindole (DAPI) using NucBlue fixed cell stain from Molecular Probes (Life Technologies). DAPI stains the MAA portions of the polymers, presumably by charge interactions. Films were hydrated in PBS and then stained with 2% NucBlue for 5 minutes, followed by rinses. A Zeiss LSM700 confocal microscope imaged the resulting stained sections and their morphology.
Polymer-coated glass coverslips were sterilized for in vitro studies with two 70% ethanol soaks (20 minutes) followed by overnight soaking in medium. Endotoxin was determined to be <0.25 EU/100 mg using a Limulus amebocyte lysate pyrochrome test kit (Cape Cod Inc., Falmouth, MA).
2.4. AlamarBlue® assay
The alamarBlue® assay was used to assess dTHP1 and HUVEC cell viability on the 6 different polymer coatings versus uncoated glass controls (n = 3). dTHP1 cells were added onto polymer-coated 18 mm diameter coverslips at a density of 5 × 10⁵ cells cm−2 while HUVEC were seeded at 4.2 × 10⁴ cells cm−2 for the 48 hour studies and at 2.1 × 10⁴ cells cm−2 for the 96 hour studies. The lower density for 96 hour studies was to prevent HUVEC from becoming confluent and changing their phenotype (dTHP1 cells do not divide). For the alamarBlue® assay, cells were incubated in 10% alamarBlue reagent in medium for 3 to 4 hours. The resulting solution absorbance changes were measured at 570 nm using a microplate reader and then normalized (as alamarBlue ratios) to cells seeded and grown on uncoated controls.2.5. RNA isolation, RNA purification and cDNA synthesis
RNA was isolated from cells cultured on copolymer films by lysing cells directly on the coated coverslips using Buffer RLT (Qiagen Inc., Mississauga, ON). The lysed cells were collected and homogenized using Qiagen Shredder columns followed by purification using RNeasy Mini Kits (Qiagen Inc., Mississauga, ON) according to kit directions. The process included a DNA digestion step with DNase (Qiagen Inc., Mississauga, ON) to improve the purity of the isolated RNA. The resulting RNA concentration and purity was assessed using a NanoDrop ND-1000 spectrophotometer (NanoDrop Technologies Inc., Wilmington, DE); all solutions had a 260 nm/280 nm ratio above 2 and a 260 nm/230 nm ratio over 1.9. Complementary DNA (cDNA) was synthesized from ∼1 μg of RNA using SuperScript™ III First-Strand Synthesis SuperMix (Invitrogen Canada Inc., Burlington, ON) according to the manufacturer's directions and was stored at −20 °C until use.2.6. Quantitative real-time PCR
The cDNA was analysed by quantitative real-time polymerize chain reactions (qPCR). Primers for angiogenic and inflammatory markers (Table 1) were chosen from Primerbank or designed using Primer-blast and then synthesized by Sigma-Aldrich (Oakville, ON). Each well contained 10 μL of solution consisting of 10 ng of cDNA, 10 μM forward and reverse primer, and 5 μL of Ssofast™ Evagreen® Supermix (Bio-Rad Laboratories, Mississauga, ON) diluted in RNase/DNase free water. Each sample-primer pair was run in triplicate in a 384 well plate and run on a CFX384 Touch™ Real-Time PCR Detection System (Bio-Rad Laboratories, Mississauga, ON). The thermal profile was 95 °C for 2 minutes (enzyme activation), 40 cycles of 95 °C for 5 seconds then 60 °C for 5 seconds followed by a plate read, and then a melt curve from 65 °C to 90 °C with 5 second steps in 0.5 °C increments. The preparation and verification of the experimental setup and execution of the qPCR was run according to publishing standards.8,9| Gene | GenBank | Forward | Reverse |
|---|---|---|---|
| IL6 | NM_000600 | AAATTCGGTACATCCTCGACGG | GGAAGGTTCAGGTTGTTTTCTGC |
| IL1β | NM_000576 | CTCGCCAGTGAAATGATGGCT | GTCGGAGATTCGTAGCTGGAT |
| TNFα | NM_000594 | ATGAGCACTGAAAGCATGATCC | GAGGGCTGATTAGAGAGAGGTC |
| Osteopontin | NM_000582 | ACTCGAACGACTCTGATGATGT | GTCAGGTCTGCGAAACTTCTTA |
| HIF1α | NM_001530 | GGCGCGAACGACAAGAAAAAG | CCTTATCAAGATGCGAACTCACA |
| SDF1α | NM_00609 | ATGCCCATGCCGATTCTTCG | GCCGGGCTACAATCTGAAGG |
| FGF2 | NM_002006 | ATCAAAGGAGTGTGTGCTAACC | ACTGCCCAGTTCGTTTCAGTG |
| VEGF | NM_113376 | CAACATCACCATGCAGATTATGC | GCTTTCGTTTTTGCCCCTTTC |
| PDGFβ | NM_002608 | TCTCTGCTGCTACCTGCGT | CAAAGGAGCGGATCGAGTGG |
| CXCR4 | NM_001008540 | CTTGTCCGTCATGCTTCTCA | GAACCCTGTTTCCGTGAAGA |
| PECAM1 | NM_000442 | AACAGTGTTGACATGAAGAGCC | TGTAAAACAGCACGTCATCCTT |
| CD34 | NM_001025109.1 | GCGCTTTGCTTGCTGAGTTT | GCCATGTTGAGACACAGGGT |
| MMP7 | NM_002423 | CATGAGTGAGCTACAGTGGGA | CTATGACGCGGGAGTTTAACAT |
| MMP9 | NM_004994 | AGACGGGTATCCCTTCGACG | AAACCGAGTTGGAACCACGAC |
| GAPDH | NM_002046 | ATGGGGAAGGTGAAGGTCG | GGGGTCATTGATGGCAACAATA |
| β-actin | NM_001101 | CATGTACGTTGCTATCCAGGC | CTCCTTAATGTCACGCACGAT |
Bio-Rad CFX Manager 3.0 determined the quantification cycle (Cq) of the PCR reactions. The relative quantity (RQ) of each gene amplification was calculated using the efficiency (E) of the reactions (eqn (1)). Primer efficiencies were verified using standard curves of incremental dilutions to ensure their efficiencies (E) at 60 °C were between 90 to 110% and then the analyses assumed 100% efficiency (E = 2).8 The RQ for each gene of interest (goi) was normalized to the RQ of reference genes (NRQ). Reference genes were selected based on low M-values by comparing the NRQ values using geNorm software. For HUVEC studies, GAPDH was used as a reference gene (eqn (2)). For dTHP1 studies, GAPDH and β-actin were both used as reference genes and their RQ was calculated to incorporate both Cq values (eqn (3)). The relative expression ratio (R) was calculated as the ratio of the NRQ of the treatment (polymer film) to the NRQ of the control (uncoated coverslips) (eqn (4)).10 Results are shown as the mean NRQ ratio ± standard error (n = 3) and ANOVA was performed on the LOG transformed NRQ values (to linearize the data) to determine the statistically different NRQs for each gene.10 The ratio of the relative expression of cells on MAA and MM copolymers was calculated with standard error (n = 3). Genes from different treatments were considered statistically different when 0.67 ≤ R ≥ 1.5 and LOG NRQ values had p < 0.05. To enable comparisons, heat maps were generated in Excel and hierarchical clusters were generated in IBM SPSS Statistics v.21 using Ward's method.
| RQ = 1/ECq | (1) |
| One reference gene: NRQ = RQ(goi)/RQ(ref) | (2) |
| Two reference genes: NRQ = RQ(goi)/(RQ(ref1) × RQ(ref2))1/2 | (3) |
| R = NRQ(treatment)/NRQ(control) | (4) |
2.7. Principal component analysis
Principal component analysis (PCA) was performed using IBM SPSS Statistics v.21 to find relationships among the large gene expression data set generated from cells grown on 20, 30 and 40% MAA films for 48 or 96 hours. The data were log transformed to ensure a normalized distribution and no rotation or other manipulation was added since the trends were strong and easily observed. PCA generates multiple principle components that describe the variability of the data and then projects the variables (gene expression) and treatment (% MAA for 48 or 96 hours) into that principal component space. Two principal components (PC1 and PC2) were used to describe the data since they represented over 70% of the variability in the data sets. The dTHP1 cell analysis included IL6, IL1β, TNFα, HIF1α, SDF1α, FGF2, VEGF, PDGFβ, and osteopontin gene expression data for cells grown on MAA films as a ratio to the corresponding MM film at 48 and 96 hours. The HUVEC analysis included osteopontin, MMP9, SDF1α, PECAM, CD34, PDGFβ, and MMP7 gene expression data for cells grown on MAA films as a ratio to the corresponding MM films at 48 and 96 hours.2.8. Statistical analysis
Data is presented as the mean ± standard error for n = 3. Analysis of variance (ANOVA) was performed between the different treatment groups with a posthoc analysis using Tukey's Honestly Statistically significant difference. Differences were considered significant if p < 0.05.3. Results
3.1. Films properties
Films of 20, 30 and 40% MAA copolymerized with IDA were compared to controls of 20, 30 and 40% MM copolymerized with IDA (cast from THF) as well as “no material” controls of uncoated coverslips. Surface composition is shown in Table 2; there was a small amount of silicon, especially on the 20% MAA polymer. There were no large differences in the carbon and oxygen amounts as expected. Copolymer compositions by NMR (MM) or titration (MAA) are also shown.The polymer coatings were on average 32 ± 7 μm in thickness and did not significantly vary among formulations. They were relatively smooth with MAA polymers having a dry mean surface roughness which varied from 59 ± 19 nm (20% MAA) to 74 ± 14 nm (30% MAA), then to 114 ± 16 nm (40% MAA), and they became smoother upon exposure to water. MM copolymers were difficult to measure because they were tacky when dry; however, measurements of 40% MM suggest they were ∼20 nm. SEM images in Fig. 2 show the slight differences in the surface morphology of MAA copolymer films. MM copolymer films were smoother (similar to 20% MAA) and harder to image. DAPI stains MAA rich regions of the material. DAPI-stained confocal images (Fig. 3) show that there was some phase separation between MAA and IDA, which presumably accounts for the small roughness that was observed. DAPI stained regions were organized in small clusters which increased in size, from approximately 6 ± 3 to 35 ± 10 μm, with increasing MAA content.
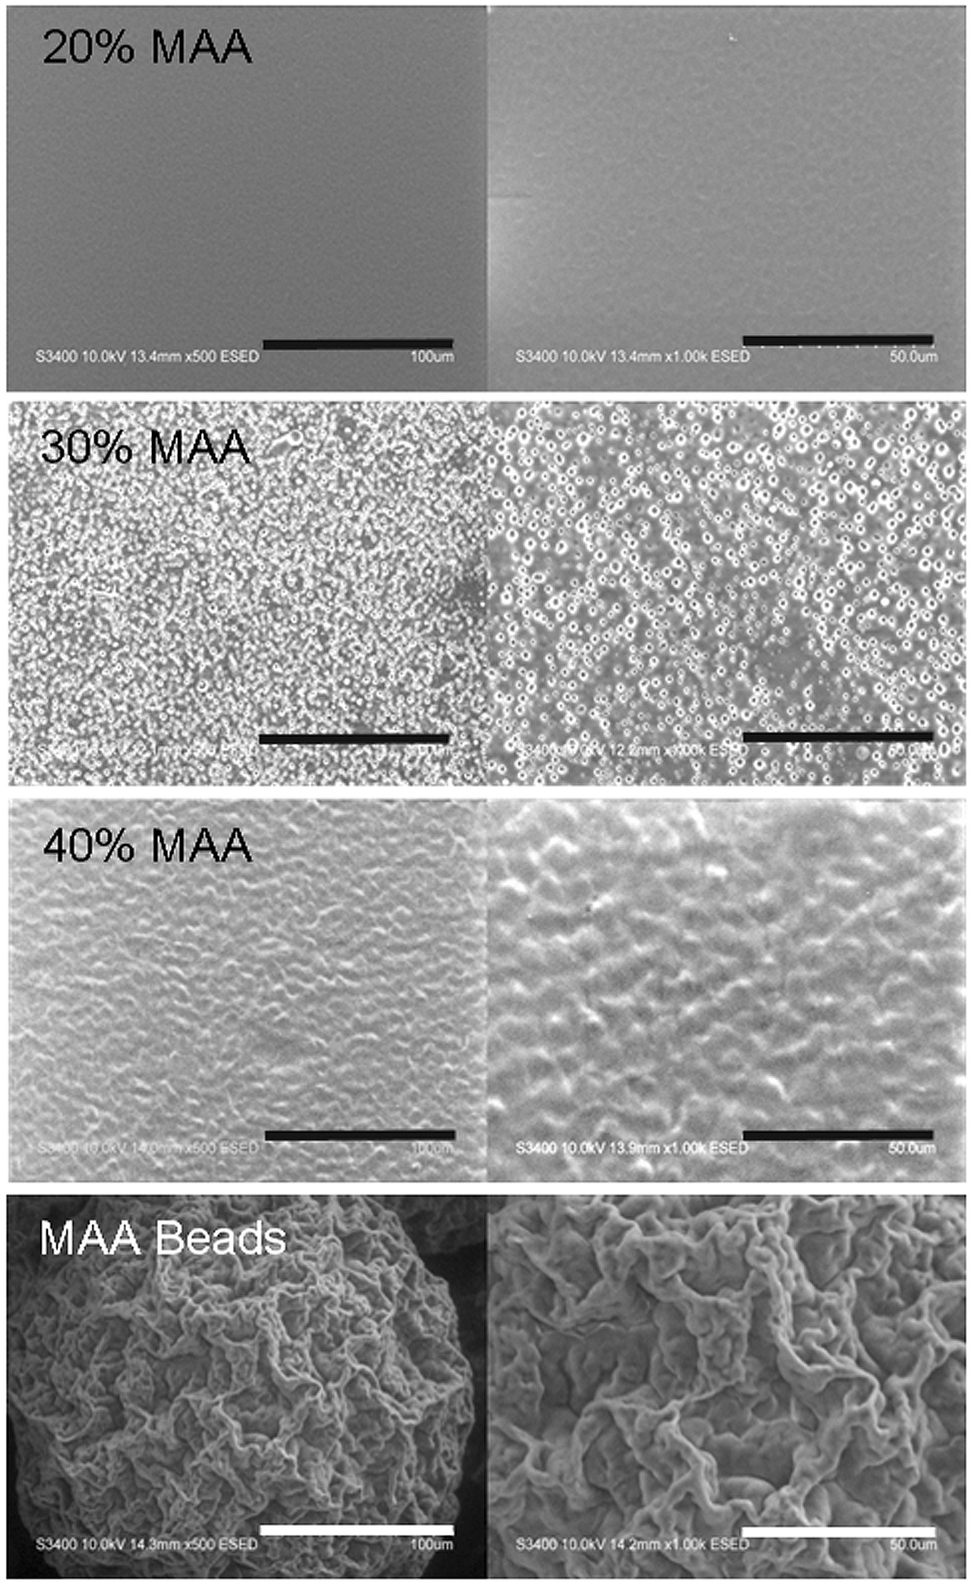 | ||
| Fig. 2 Environmental SEM images of the surface of dry 20%, 30% and 40% MAA copolymer films. The polymers have a smoother surface and lower degree of roughness compared to previously used MAA beads. Scale bars: 100 microns (left images) 50 microns (right images). | ||
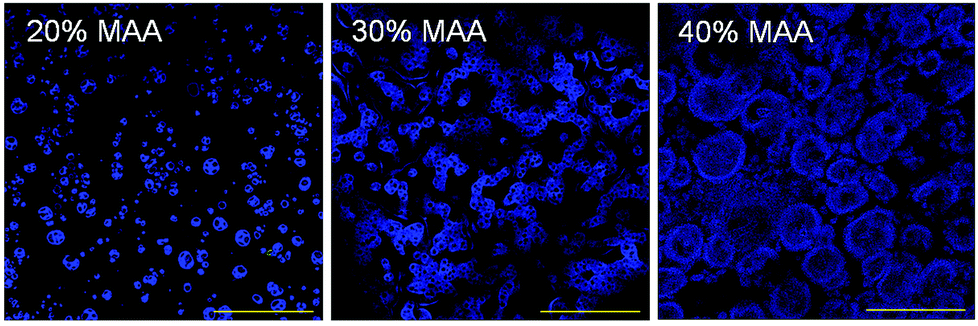 | ||
| Fig. 3 DAPI stains MAA rich regions of the polymer films. The MAA rich portions of the material appear to form aggregates that increase in size with increases in MAA content. These clusters presumably reflect regions of phase separation of MAA rich domains from IDA rich domains. Scale bar = 100 microns. | ||
3.2. Cell viability on films
Macrophage-like dTHP1 cells adhered to both the MAA and MM copolymer films after incubation for 24 hours in medium containing the phorbol ester, PMA. THP1 cells did not adhere to the films without PMA (data not shown). The medium was then changed to contain no PMA and cells were cultured adherent to the films for up to 96 hours (72 hours without PMA). HUVEC seeded onto the films adhered and spread and were incubated up to 96 hours. VE-cadherin was expressed on HUVEC incubated on the films for 96 hours albeit with lower amounts with MAA copolymers in comparison controls.2The alamarBlue® assay was used to assess viability of the cells on the films over time. The alamarBlue absorbance ratio for dTHP1 cells (Fig. 4) and HUVEC (Fig. 5) on 30% and 40% MAA films was higher than on 30% and 40% MM films (ratio to cells grown on glass coverslips, p ≤ 0.03) likely due to differences in adherence. In addition, some dTHP1 cells were seen to detach from the surface of MM copolymers films after the PMA was removed. Therefore the decreases in dTHP1 alamarBlue ratios were likely due to differences in number of attached cells which decreased with time (more so on MM films than MAA) rather than viability per se.
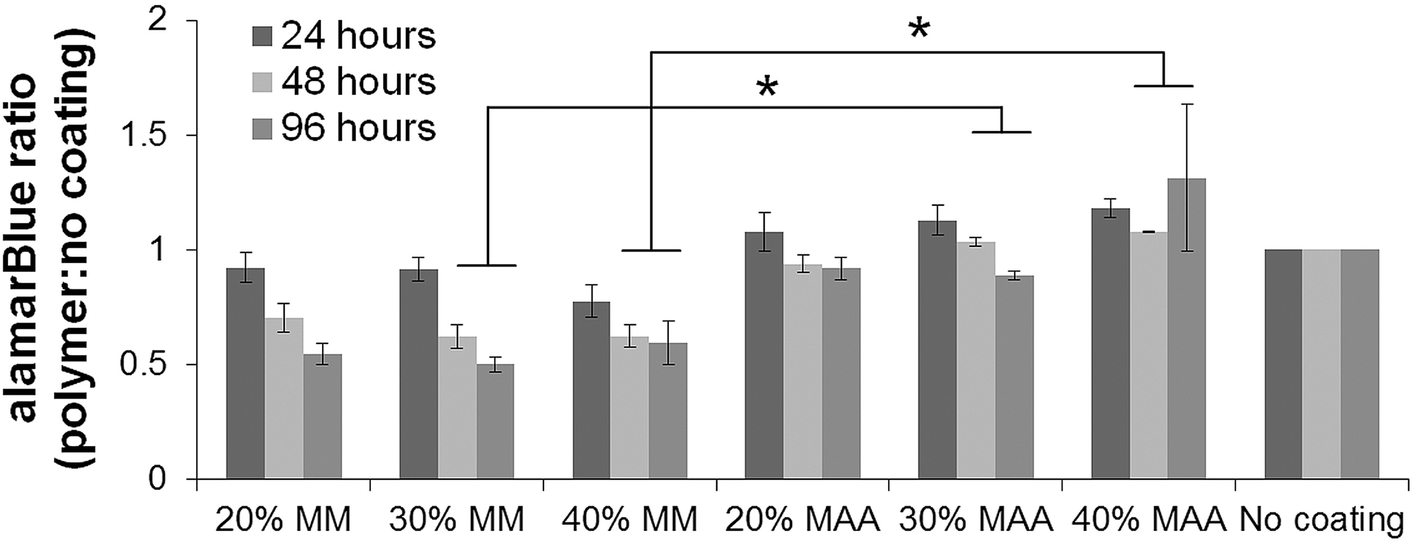 | ||
| Fig. 4 dTHP1 cells adhered to the different copolymer films but did detach over time. There were higher alamarBlue absorbance ratios (relative to cells on uncoated controls) on 30 and 40% MAA copolymers versus 30 and 40% MM copolymers at 48 and 96 hours (±SEM, n = 3, * = p < 0.05). | ||
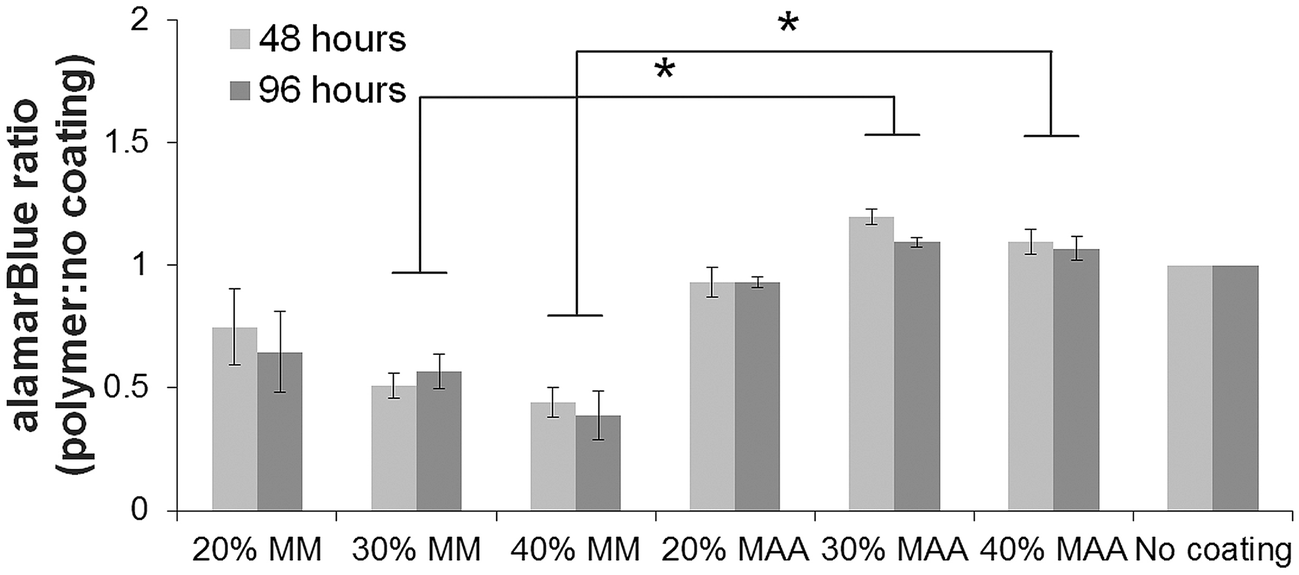 | ||
| Fig. 5 Fewer HUVEC adhered to the MM copolymer films in comparison to the MAA copolymers films. There were higher alamarBlue absorbance ratios (relative to cells on uncoated controls) on 30 and 40% MAA copolymers versus 30 and 40% MM copolymers measured using alamarBlue at 48 and 96 hours (±SEM, n = 3, * = p < 0.05). | ||
3.3. Gene expression of cells on 40% films over time
The effect of 40% MAA on dTHP1 cell (Fig. 6) and HUVEC (Fig. 7) gene expression was determined by qPCR. Because changes in IL6, IL1β, TNFα and osteopontin gene expression were previously observed when dTHP1 cells were incubated with MAA beads,5 these same genes were tested here. IL6, IL1β and TNFα gene expression in dTHP1 cells cultured for 96 hours was greater on 40% MAA compared to cells on 40% MM or uncoated controls. Osteopontin gene expression in dTHP1 cells incubated for 48 or 96 hours was less on 40% MAA compared to cells on 40% MM and uncoated controls. Since incubating cells on films may create a more robust response due to increased cell–polymer contact compared to previous bead studies, other genes involved in healing and angiogenesis were also measured. Of particular note are the significant increases in HIF1α and SDF1α gene expression in dTHP1 cells incubated on 40% MAA compared to controls. Additional differences relative to the controls are noted in Fig. 6.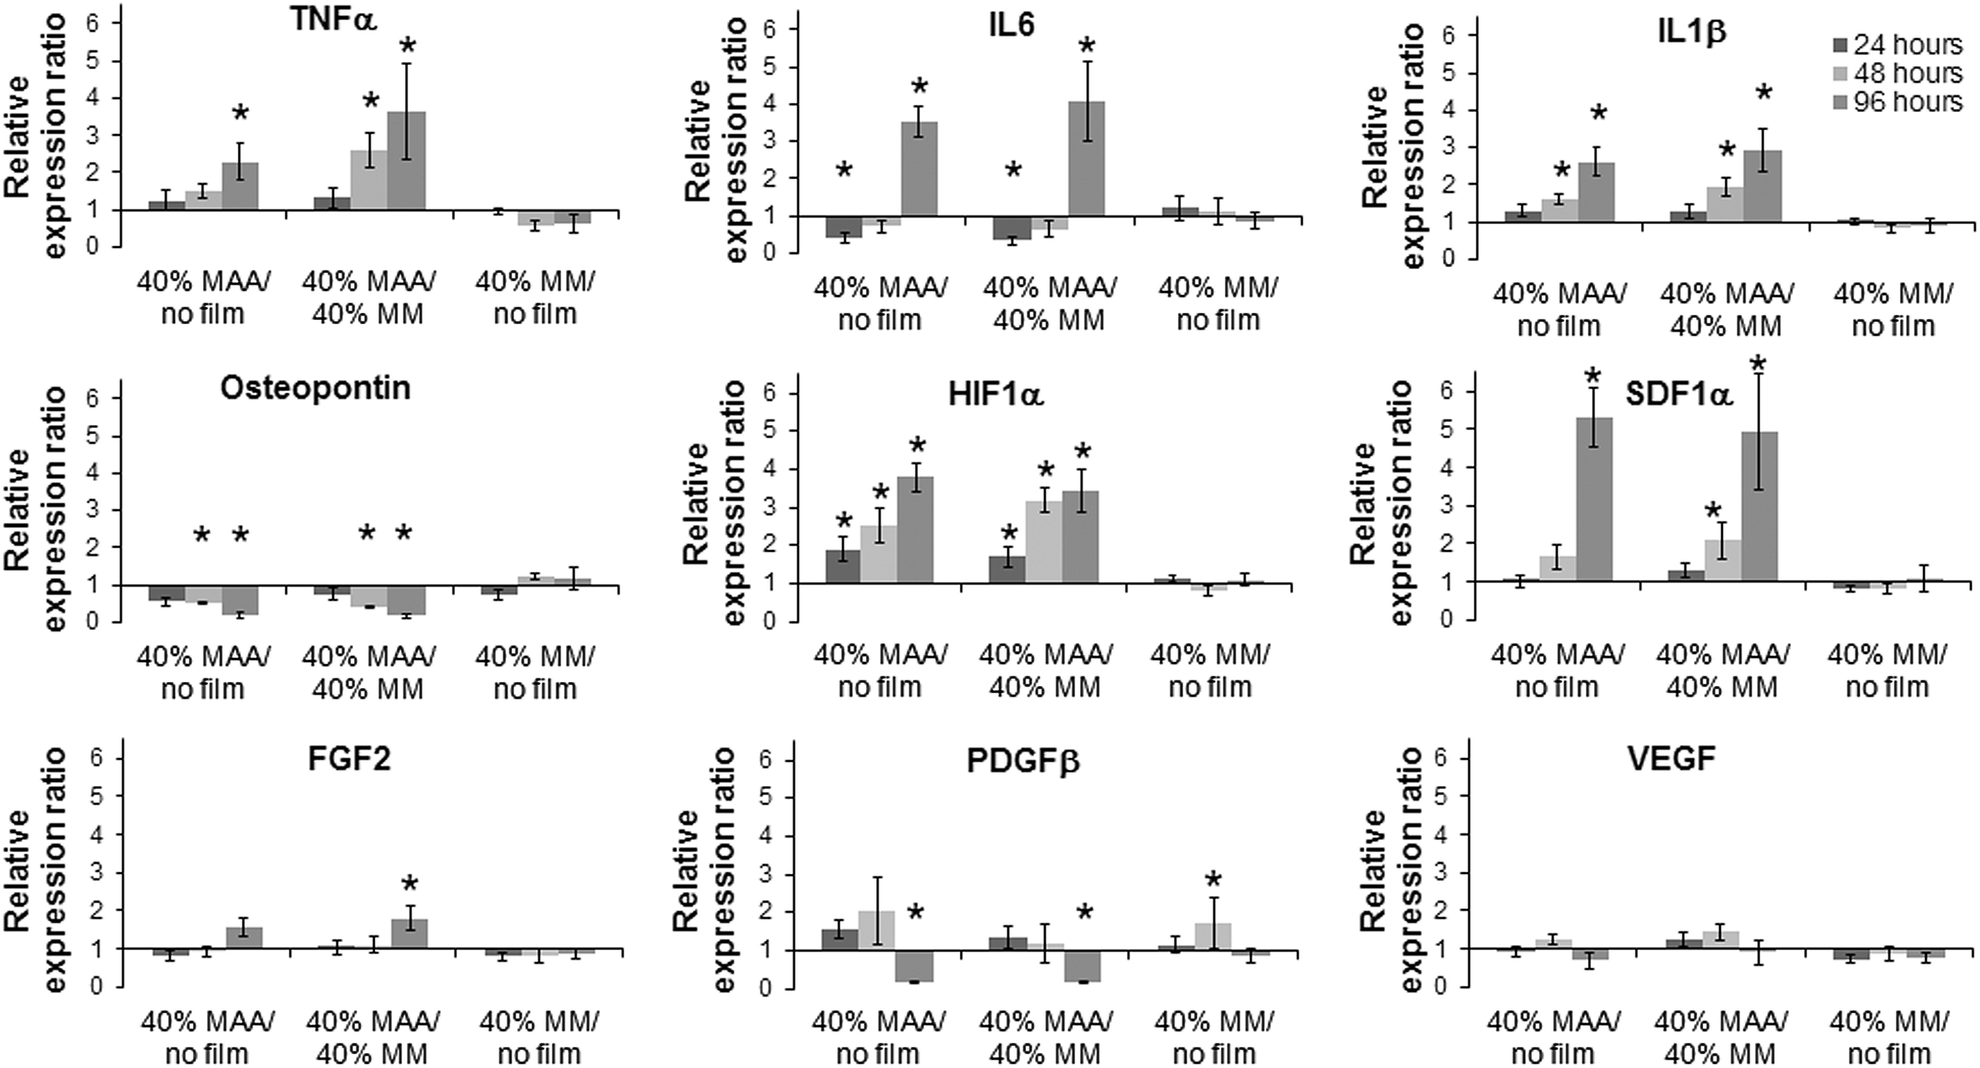 | ||
| Fig. 6 Relative gene expression ratios (e.g., ratio of expression on MAA films to MM films) of a panel of genes in dTHP1 cells grown on 40% MAA copolymer films, 40% MM copolymer films and uncoated coverslips (±SEM, n = 3, * = 0.67 > ratio > 1.5 and log NRQ p < 0.05). | ||
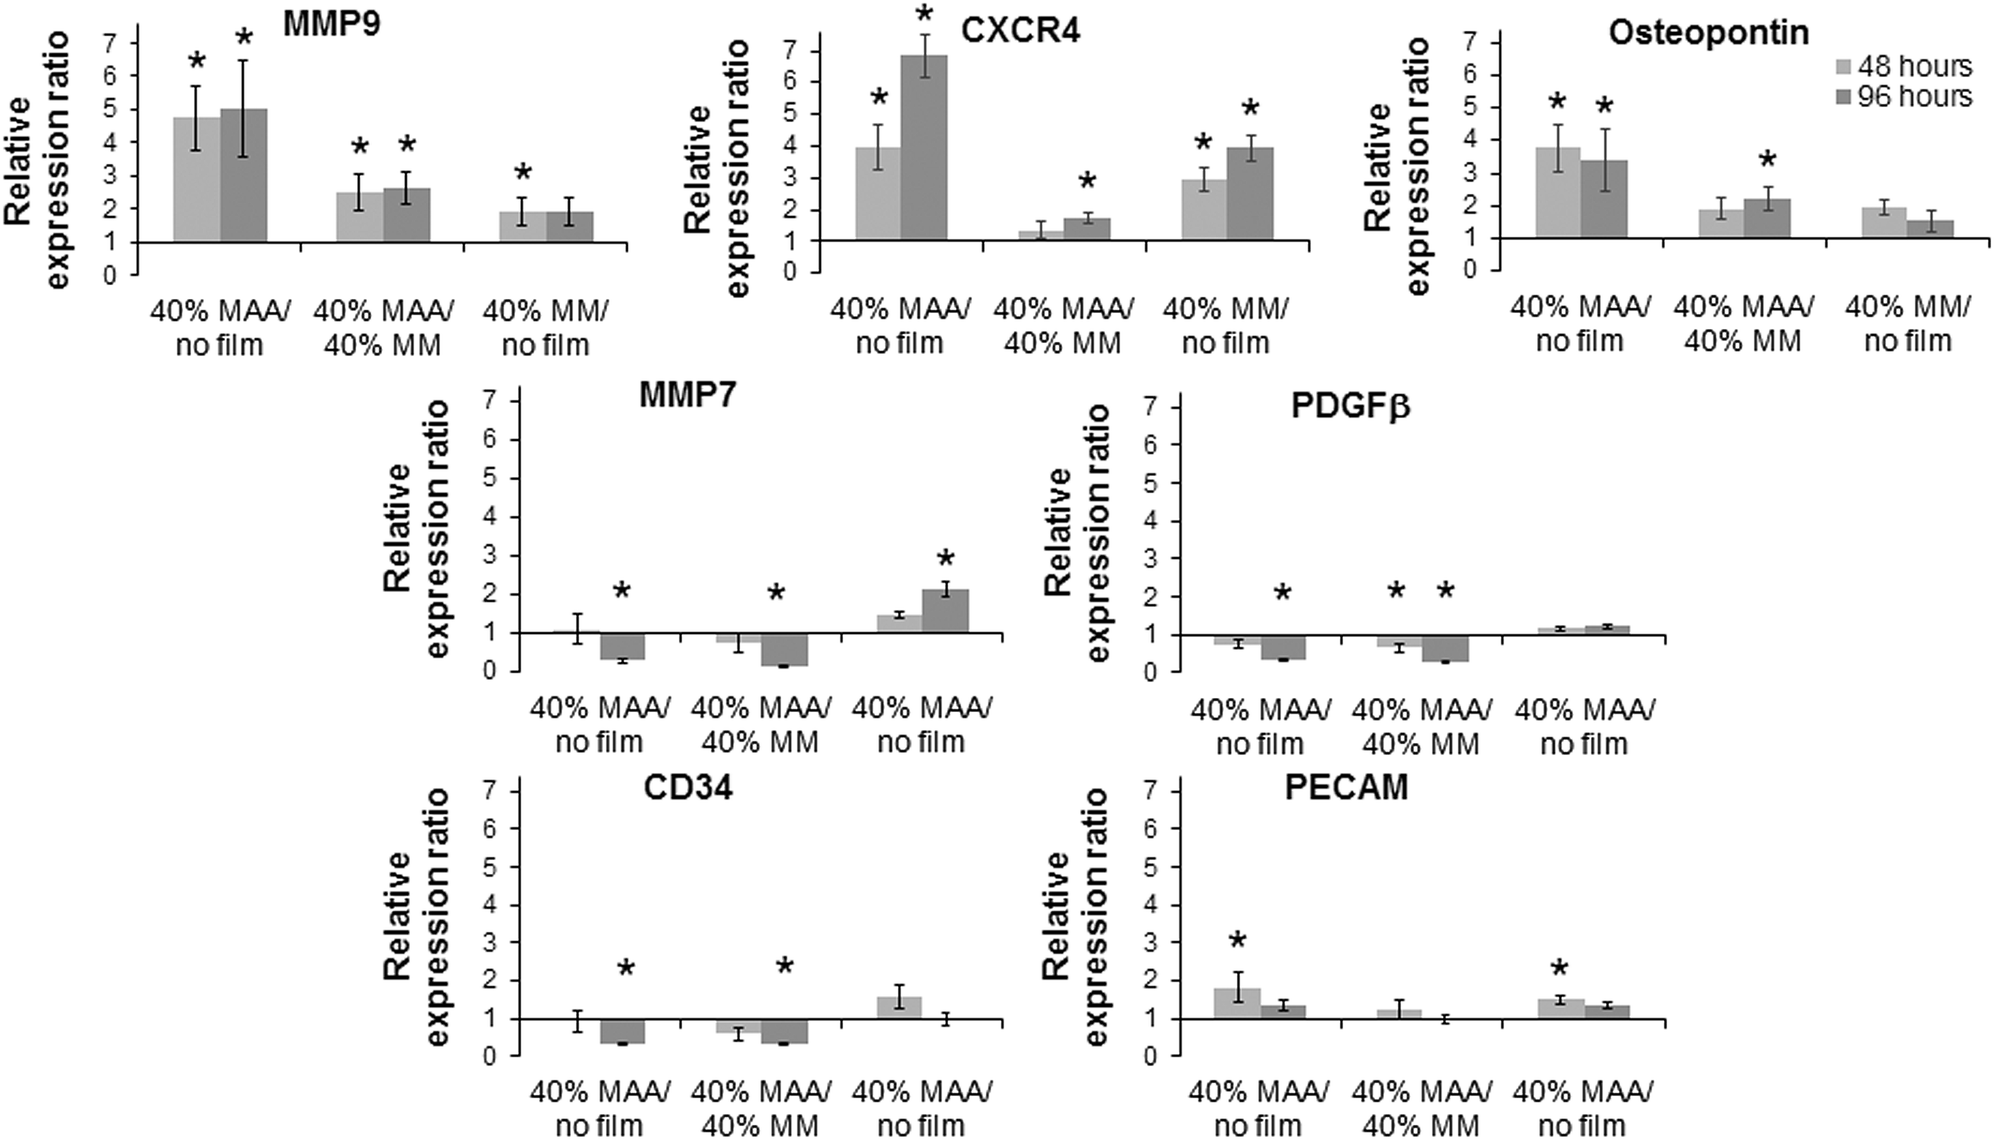 | ||
| Fig. 7 Relative gene expression ratios (e.g., ratio of expression on MAA films to MM films) of a panel of genes for HUVEC on 40% MAA copolymer films, 40% MM copolymer films and uncoated coverslips (±SEM, n = 3, * = 0.67 > ratio > 1.5 and log NRQ p < 0.05). | ||
Changes in osteopontin gene expression in HUVEC incubated with MAA materials was previously observed in a MAA bead study5 and additional changes in CXCR4, MMP9 and CD34 gene expression have been seen in unpublished work. Osteopontin gene expression in HUVEC on MAA films was significantly greater at 48 hours and 96 hours compared to controls. MMP9 and CXCR4 gene expression in HUVEC on 40% MAA films also increased at 48 and 96 hours compared to cells on controls. On the other hand, CD34 gene expression in HUVEC on 40% MAA decreased at 96 hours compared to cells on controls. The expression of additional genes involved in angiogenesis and healing, which had not been significantly modulated with MAA beads, were also measured. Here changes in MMP7, PDGFβ and PECAM were seen that were not seen with beads. For example, MMP7 in HUVEC decreased at 96 hours in cells incubated on 40% MAA compared to 40% MM and uncoated controls. Additional differences in gene expression relative to controls are noted in Fig. 7.
3.4. Gene expression of cells on 20, 30 and 40% films
The effect of MAA content on gene expression in dTHP1 cells is summarized in the heat map shown in Fig. 8; the results (including statistics) are shown in the ESI (Fig. S1‡). The largest differences in gene expression in dTHP1 cells were seen at 96 hours. IL6, IL1β, TNFα, FGF2, SDF1α and HIF1α expression increased with MAA content while osteopontin and PDGFβ expression decreased with MAA content.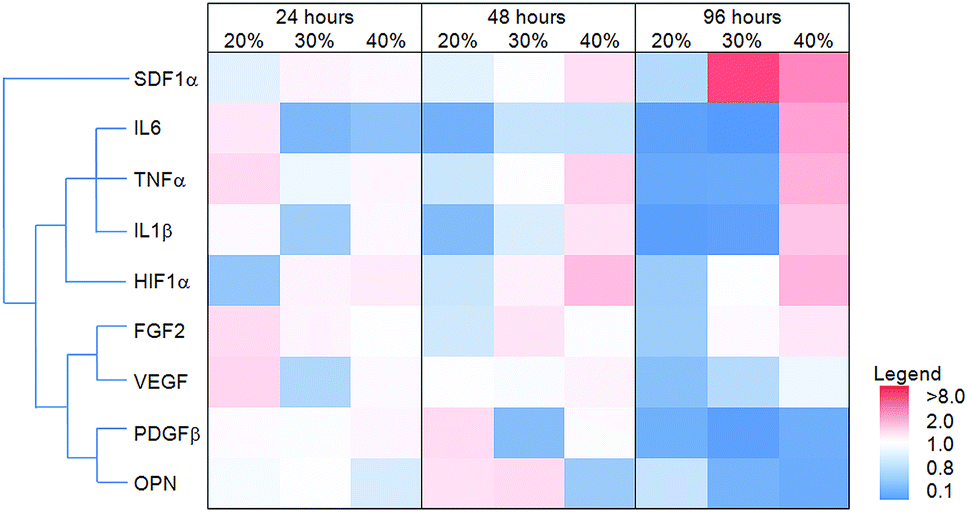 | ||
| Fig. 8 The effect of MAA content on dTHP1 gene expression. A heat map of the relative gene expression ratios for dTHP1 cells cultured on MAA films as a ratio to MM films for 24, 48 and 96 hours. The intensity of the colours in the heat map represent the degree of increase/decrease in gene expression (see legend). Hierarchical clustering (left of heat map) grouped genes with similar increases or decreases in expression profiles (OPN = osteopontin). | ||
The heat map in Fig. 9 illustrates the expression of select genes in HUVEC on films with different MAA or MM amounts; the results (including statistics) are shown in the ESI (Fig. S2‡). Osteopontin, CXCR4 and MMP9 expression increased with increasing MAA content while CD34, PDGFβ and MMP7 decreased with increasing MAA (at 96 hours). PECAM expression did not change. Similar changes were seen at 48 hours in some cases (e.g. MMP9) but not others (e.g. MMP7).
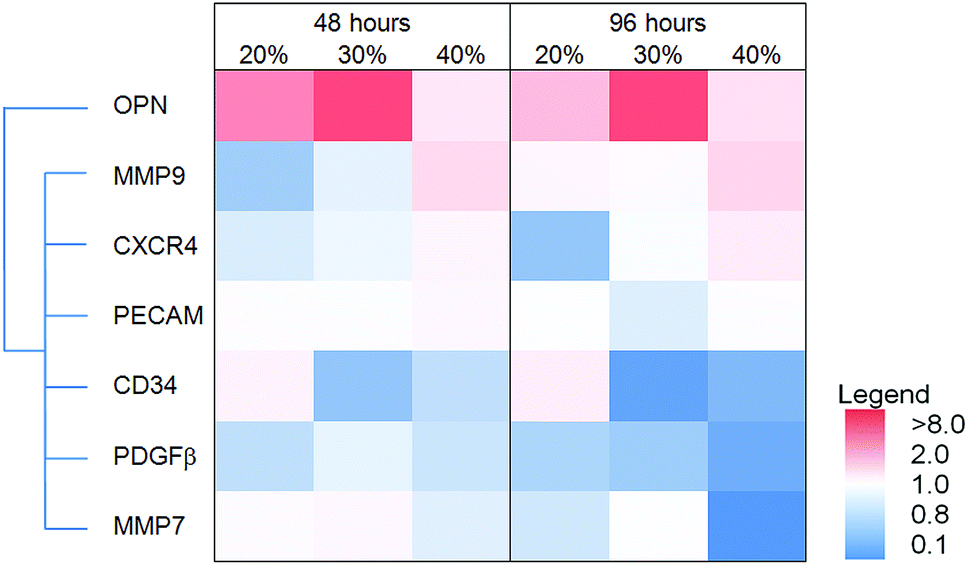 | ||
| Fig. 9 The effect of MAA content on HUVEC gene expression. A heat map of the relative gene expression ratios for HUVEC cultured on MAA films as a ratio to MM films for 48 and 96 hours. The intensity of the colours in the heat map represent the degree of increase/decrease in gene expression (see legend). Hierarchical clustering (left of heat map) grouped genes with similar increases or decreases in expression profiles (OPN = osteopontin). | ||
3.5. PCA
PCA was used to find relationships between the polymer compositions and gene expression in dTHP1 cells or HUVEC. PCA mathematically simplified the data into principal components that represented its variability and projected the variables (gene expression) and treatments (% MAA for 48 or 96 hours) into the component space (Fig. 10). Correlation matrices from the PCA are in the ESI (Tables S1 and S2‡). The 24 hours data from dTHP1 cells was excluded because gene expression was influenced by PMA present in the medium.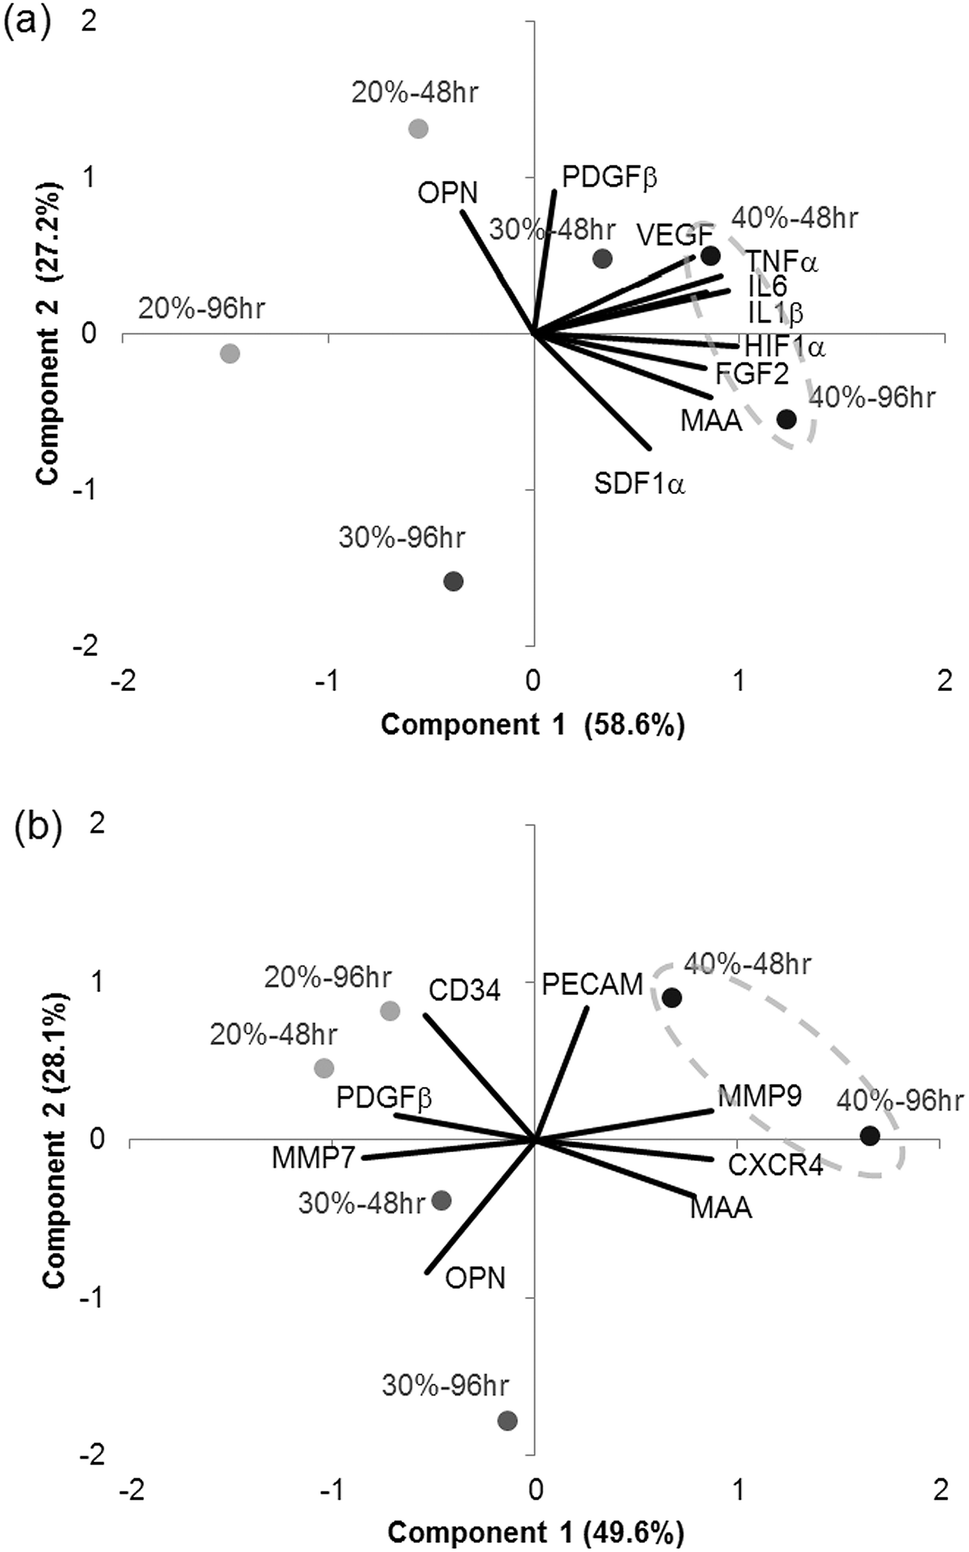 | ||
| Fig. 10 Combined score and loading plots from the PCA. The loadings (lines) show the projections of gene expression and the scores (filled circles) show the projections of the different MAA film treatments (20, 30 or 40% MAA for 48 or 96 hours). (a) PCA on the dTHP1 data – the first 2 principal components represent 85.8% of the data variability. (b) PCA on the HUVEC data – the first 2 principal components represent 77.7% of the data variability. | ||
The first 2 components from the dTHP1 cell PCA represented 85.8% of the data variability and were therefore considered reliable to describe the data (Fig. 10a). The projections of IL1β, IL6, TNFα, HIF1α and FGF2 gene expression were to the far right on PC1 suggesting that the first component was associated with inflammatory and hypoxic genes. No genes were strongly projected along the second component, but PDGFβ and SDF1α were somewhat projected along this axis suggesting that PC2 may be associated with cell recruitment genes. The 40% MAA films (circled) clustered to the right of the y-axis and were related to increased expression of IL1β, IL6 and TNFα and increased expression of HIF1α and FGF2; these genes were also positively correlated to each other and also to MAA content (see the correlation matrix in the ESI, Table S1‡).
The first 2 components from the HUVEC PCA represented 77.7% of the data variability (Fig. 10b). The projection of MMP9, CXCR4 and MMP7 gene expression were along the PC1 axis suggesting that PC1 was related to migratory genes (chemotaxis and matrix degradation). The second component did not have any strong projections along its axis; although PECAM and osteopontin did somewhat project along PC2. The 40% MAA films clustered to the far right of the graph and were related to the expression of MMP 9, CXCR4 and, to a degree, PECAM. The 30% MAA films and the 40% MAA films (to a smaller degree) were related to osteopontin gene expression. MMP9 was positively correlated to CXCR4, and MMP7 to PDGFβ (see the correlation matrix in the ESI, Table S2‡).
4. Discussion
4.1. Smooth, solvent-castable MAA copolymers
Copolymers of MAA were synthesized as coatable biomaterials and used to explore the effects of MAA on gene expression in dTHP1 and HUVEC. Previous efforts focused on understanding how MAA beads promote angiogenesis without exogenous growth factors3,4 and identified relevant mechanisms, but had some limitations. In vitro studies showed that the expression of inflammatory genes (IL6, IL1β and TNFα) was increased while osteopontin was decreased in macrophage-like cells (dTHP1 cells) in the presence of the MAA beads compared to MM bead or no bead controls.5 However, the 45% MAA beads are rough and can agglomerate together when added to culture medium. In vitro, the beads were added to a monolayer of cells at a density that was sufficient to see some differences by qPCR, but not all cells were likely exposed to the same amount of polymer. We expected that using polymer films would eliminate these potentially confounding factors to isolate the effects of MAA chemistry.IDA was copolymerised with MAA and MM to lower the glass transition temperature of the resulting copolymer to create smooth films. For example, the Tg of methyl methacrylate copolymerized with IDA decreased in a linear fashion with increasing amount of IDA.11 The hydrophobicity of IDA enabled the polymers to be cast onto glass (from THF) as a water-insoluble coating. The MAA coatings, however, still had microstructures that could be seen with DAPI stain (Fig. 3). The polymer coatings contained circular domains that increased in size with increasing amounts of MAA to eventually form large domains that were evenly distributed across the surface at 40% MAA. These microstructures were presumably due to the high reactivity ratios of MAA and MM (to IDA) and low reactivity ratio of IDA (to MAA or MM), due to IDA's alkyl groups; these reactivity ratios result in considerable “blockiness” in the copolymers. It may be of interest, in the future, to deliberately control or alter this microstructure to assess the influence of how the MAA is presented to the cells on cell behaviour. To control for any potential influence of IDA (rather than MAA) on cell behaviour, MAA copolymerized with IDA was compared to controls of MM copolymerized with the same ratio of IDA. Therefore, gene expression changes in cells due to IDA, particularly when it was present at higher amounts, were accounted for by normalizing MAA results to MM results of the same IDA content.
This study aimed at reducing the roughness of MAA materials so that chemistry effects could be isolated to understand why MAA copolymers promote angiogenesis. There has been a question regarding the influence of topography/porosity12,13 in addition to chemistry14,15 on cell behaviour and the outcome of foreign body responses to biomaterials. The polymer coatings (on glass and from THF as a solvent) have a relatively low roughness that is slightly composition dependent but at most ∼100 nm. Past studies on the relationship between polymer roughness and cell behaviour noted that cells grown on expanded polytetrafluoroethylene surfaces required large changes in roughness, such as a change in intranodal distance from 900 to 4400 nm12 or from ∼0 to 4400 nm,16 to result in altered cytokine production. Similarly, a large roughness change in titanium from 60 nm (polished) to 4330 nm (sandblasted and etched) was required to cause changes in RAW 264.7 macrophage cell gene expression and phenotype.17 These roughness thresholds are much larger than the roughness of the coated MAA polymers.
Material porosity has also been shown to influence macrophage behaviour and vascularization. Pores between 0.8 to 8 microns in diameter allowed cell and tissue penetration, which resulted in increased vascularization surrounding porous biomaterial implants in vivo.18 For example, implanted poly (2-hydroxyethylmethacrylate (pHEMA) sphere-templated pore materials have shown increased blood vessel formation and improved integration; this was attributed to macrophage–material interactions.13,19 Pore sizes of 34 μm or 160 μm altered the phenotype of macrophages that infiltrated and surrounded the implants resulting in improved host integration.20 The MAA copolymers in this work were cast as smooth films. Therefore, we presume that the findings in these studies were due to effects of surface chemistry and not roughness or porosity.
4.2. Cell studies
To study cell behaviour on films, the human dTHP1 cell line was used as a model macrophage to obtain a homogeneous, large cell population required for screening the variation of gene expression caused by a library of materials.21 HUVEC were used to assess the effect of MAA on endothelial cells. There were more dTHP1 cells and HUVEC (Fig. 4 and 5) on 30 and 40% MAA films compared to their 30 and 40% MM controls, perhaps because the ionic groups of MAA resulted in increased cell adhesion.15,22 Certainly fewer cells detached from the MAA films. Attached cells were viable by alamarBlue® assay and the differences in Fig. 4 and 5 were due to differences in cell numbers, rather than viability. PMA was used to differentiate the THP1 cells into macrophage-like cells (dTHP1 cells) that adhered to the polymer surfaces since the materials alone did not enable undifferentiated cell attachment.4.3. Gene expression with 40% MAA films compared to 45% MAA beads
Incubation of dTHP1 cells or HUVEC on 40% MAA films resulted in similar gene expression as previously noted when these cell types were incubated with 45% MAA beads.5 IL1β, IL6 and TNFα gene expression increased and osteopontin expression decreased in dTHP1 cells incubated both on 40% MAA films and with 45% MAA beads. Osteopontin gene expression increased in HUVEC incubated with 40% MAA films or 45% MAA beads. This similarity in gene expression suggests that the MAA content, rather than bead roughness or smoothness, was the most influential factor in gene expression and by extension the observed vascularization in vivo. The latter remains to be tested with in vivo studies.The PCA was also run with the film data presented here as well as the data from 45% beads incubated with dTHP1 cells or HUVEC5 (as well as some unpublished data), with roughness as another parameter. The bead roughness was taken to be 2–5 microns based on the SEM images. The first two PCA components represented >70% of the variability in the data sets and the same genes in both dTHP1 cells and HUVEC were identified. The different treatments clustered according to MAA content with the 40% MAA films and 45% MAA beads in near proximity. For dTHP1 cells, roughness (Ra) was projected close to the origin, suggesting that it was not strongly correlated with any of the measured genes, while for HUVEC roughness was correlated to PECAM and PDGFβ expression. Combining beads and films together, gene expression was more strongly associated with MAA content – as would be expected given the similarity of gene expression profile and orders of magnitude difference in roughness.
4.4. dTHP1 cell gene expression
Changes in gene expression in dTHP1 cells grown on MAA copolymer films (as a ratio to MM copolymer films) became more apparent and significant over time (Fig. 6, 8 and S1‡). With 40% MAA, there was an early increase of HIF1α at 24 hours followed by the subsequent expression of inflammatory and angiogenic genes.The PCA correlated HIF1α to IL6, IL1β and TNFα genes, consistent with the connection between HIF1α and the upregulation (by 96 hours) of these genes. HIF1α transcription is activated through the NF-κB pathway by surface receptors, such as Toll-like receptor 4.23 Once translated into a protein, HIF1α is degraded by the action of prolyl hydroxylase (PHD). PMA, which is added to cell culture media to differentiate the THP1 cells for 24 hours, promotes the production of reactive oxygen species (ROS) which inhibit PHD, allowing HIF1α protein to translocate to the nucleus and transcribe downstream genes, such as VEGF, TNFα, IL1α, IL1β, IL6 and others.23,24 Both the transcription and activation of HIF1α were likely occurring when dTHP1 cells were simultaneously exposed to PMA and 40% MAA, resulting in the increased expression of IL6, IL1β and TNFα – genes that are upregulated during inflammation and that are also important for wound healing and angiogenesis. Furthermore, HIF1α has been identified as a mediator of vascular remodelling and cutaneous wound healing.25,26 There were no great changes in angiogenic VEGF or FGF2 gene expression in dTHP1 cells from MAA exposure although there was an increase in FGF2 with 40% MAA at 96 hours. It is conceivable that longer incubations would result in detectable increases in the gene expression of both VEGF and FGF2.
The PCA and hierarchal maps in Fig. 8 and 10 suggest that the decrease in osteopontin and increase in SDF1α in cells exposed to polymers of increasing MAA-content are not directly related to HIF1α. SDF1α causes CD34+ cells to home to sites along gradients to the SDF1 source via CXCR4 receptor interactions.27 Therefore, the increase in SDF1α with dTHP1 cells on MAA suggests the possibility that MAA materials may enhance the recruitment of endothelial progenitor cells (EPC), or related cells, to improve healing. For example, SDF1α delivery to wounds has improved healing and increased early EPC infiltration and vascularization.28 In contrast to SDF1α, osteopontin was decreased in dTHP1 cells incubated with 40% MAA. Osteopontin has multiple functions in inflammation, tumour growth, bone formation and tissue remodelling;29 during wound healing, it attracts cells to sites of injury.30 PMA, TNFα, IL6, LDL and nitric oxide are all known to upregulate osteopontin expression from macrophages.31,32 Therefore, it is interesting that MAA decreases the gene expression of osteopontin in dTHP1 cells but increases the gene expression of IL6, IL1β and TNFα, since osteopontin should be highly expressed in activated macrophages. We suspect that this difference may change the macrophage response and may be a key finding in understanding why MAA beads or films lead to new vessel formation.
4.5. HUVEC gene expression
Similar to the observations with dTHP1 cells, changes in gene expression in HUVEC grown on MAA copolymer films (as a ratio to MM copolymer films) also became more apparent and significant over time (Fig. 7, 9 and S2‡). In contrast to the dTHP1 cells, there were no clear connections among the gene expression trends in HUVEC; the PCA had wide spread projections with fewer correlations.As a consequence of MAA exposure, HUVEC had increased CXCR4 and MMP9 gene expression (Fig. 9) which would promote cell migration. CXCR4 allows endothelial cells to migrate towards SDF1α to promote blood vessel formation,33,34 and MMPs promote EC migration by degrading basement membranes and surrounding extracellular matrix (ECM).35 CD34 expression in HUVEC cultured on MAA (see Fig. 9) decreased over time and with MAA content. In vitro, HUVEC lose CD34 as they lose their quiescence and begin to grow and divide; therefore, its downregulation could be an indication of high EC activity, which is consistent with a shift towards an angiogenic phenotype.36
In contrast to the effect of MAA on dTHP1 cells, MAA promoted an increase of osteopontin gene expression in HUVEC. Osteopontin promotes the migration and tube formation of HUVEC through cytoprotection and increased VEGF expression.37 Previous studies in vivo have shown that osteopontin is upregulated in wounds exposed to MAA beads;5 it is plausible that the local endothelial cells, not the local macrophages, may be the cells producing osteopontin in vivo during MAA-wound healing to promote cell infiltration and tissue remodelling.29,30
4.6 MAA, inflammation and angiogenesis
With smooth polymer films, we conclude that polymer chemistry (the carboxylic acid groups in MAA) and not topography was responsible for the observed changes in dTHP1 cell and HUVEC behaviour. The surface energy, charge and chemistry of biomaterial surfaces influence in vitro and in vivo cell–material interactions. For example, macrophages cultured on anionic polyethylene terephthalate (PET) polymers in vitro have increases in TNFα and MIP1β in comparison to macrophages on cationic PET,22 and in vivo, PET-associate macrophage gene expression is altered by surface chemistry.38 While part of this is an effect of charge, the specific chemical groups influence the outcomes. Previous studies have shown that hydroxyl and amine groups result in higher foreign body and inflammatory responses versus carboxyl groups in mouse models;39–41 that hydroxyl groups are associated with poor compatibility, complement activation and coagulation;39 and that carboxyl groups are tolerated by the immune system.39,40 Combinations of chemical groups have shown different biological effects. For example, alterations to complement activation and platelet adhesion have been observed with different mixes of carboxyl, hydroxyl and alkyl groups.41,42 Here, the combination of the carboxyl group in MAA with –CH3 and –CH2 chemical groups, such as the alkyl groups (IDA) in film studies or methyl ester groups (MM) in the bead studies, drive the observed cellular responses. Future studies will assess in vivo responses to 20, 30 and 40% MAA films and relate them to the cell behaviour observed in these studies.While a direct effect of the carboxylic acid groups on surface receptors cannot be ruled out, it is likely that there are serum proteins that preferentially adsorb to the MAA surface and mediate the biological effect. As yet, unpublished studies suggest that in vitro, complement proteins preferentially adsorb from FBS-supplemented RPMI medium to 40% MAA which could alter gene expression in the attached cells. As described above, the strong correlations in the dTHP1 cell studies suggest that the material (or adsorbed proteins) result in HIF1α related gene expression, perhaps involving the NF-κB pathway. Since CXCR4 in endothelial cells may also be affected by NF-κB,43 similar mechanisms may apply to both cells. This mechanism requires further investigation.
5. Conclusion
MAA content had a significant effect on the expression of several genes in dTHP1 cells and HUVEC (at 96 hours). Furthermore, cells on “smooth” MAA films had a similar gene expression profile compared to the previously studied “rough” beads, suggesting that surface roughness is not a key factor in the gene expression profile. PCA on the gene expression of cells incubated on 20, 30 and 40% MAA showed that a threshold above 30 to 40% MAA resulted in a shift in dTHP1 and HUVEC behaviour. In the macrophage cell line dTHP1, 40% MAA increased the gene expression of IL1β, IL6 and TNFα and of angiogenic HIF1α and SDF1α. PCA on dTHP1 data showed strong correlations between MAA, HIF1α expression and inflammatory gene expression, suggesting that the NF-κB pathway may be involved. In HUVEC, 40% MAA increased the expression of angiogenic MMP9 and CXCR4 as well as osteopontin. MAA in a coatable copolymer promotes inflammatory and angiogenic behaviour in macrophage-like and endothelial cells.Acknowledgements
The authors acknowledge financial support from the Ontario Research Foundation and the Natural Sciences and Engineering Research Council. The authors also acknowledge guidance from Alexandra (Sasha) Lisovsky and Lindsay Fitzpatrick, as well as the assistance of Michael S. Valic with some experiments. L. A. Wells acknowledges postdoctoral fellowship support from the Canadian Institutes for Health Research and the CIHR Training Program in Regenerative Medicine.References
- J. Folkman and M. Hochberg, J. Exp. Med., 1973, 138, 745–753 CrossRef CAS.
- L. A. Wells, M. S. Valic, A. Lisovsky and M. V. Sefton, Isr. J. Chem., 2013, 53, 637–645 CAS.
- D. C. Martin, J. L. Semple and M. V. Sefton, J. Biomed. Mater. Res., Part A, 2010, 93A, 484–492 CAS.
- A. A. Eckhaus, J. S. Fish, G. Skarj, J. L. Semple and M. V. Sefton, Plast. Reconstr. Surg., 2008, 122, 1361–1370 CrossRef CAS PubMed.
- L. E. Fitzpatrick, J. W. Y. Chan and M. V. Sefton, Biomaterials, 2011, 32, 8957–8967 CrossRef CAS PubMed.
- L. E. Fitzpatrick, A. Lisovsky and M. V. Sefton, Biomaterials, 2012, 33, 5297–5307 CrossRef CAS PubMed.
- R. J. Patel and M. V. Sefton, J. Biomed. Mater. Res., Part A, 2012, 100A, 2054–2062 CrossRef CAS PubMed.
- S. Taylor, M. Wakem, G. Dijkman, M. Alsarraj and M. Nguyen, Methods, 2010, 50, S1–S5 CrossRef CAS PubMed.
- S. A. Bustin, V. Benes, J. A. Garson, J. Hellemans, J. Huggett, M. Kubista, R. Mueller, T. Nolan, M. W. Pfaffl, G. L. Shipley, J. Vandesompele and C. T. Wittwer, Clin. Chem., 2009, 55, 611–622 CAS.
- I. Rieu and S. J. Powers, Plant Cell, 2009, 21, 1031–1033 CrossRef CAS PubMed.
- E. Malinowska, L. Gawart, P. Parzuchowski, G. Rokicki and Z. Brzozka, Anal. Chim. Acta, 2000, 421, 93–101 CrossRef CAS.
- P. C. Bota, A. M. Collie, P. Puolakkainen, R. B. Vernon, E. H. Sage, B. D. Ratner and P. S. Stayton, J. Biomed. Mater. Res., Part A, 2010, 95, 649–657 CrossRef PubMed.
- J. D. Bryers, C. M. Giachelli and B. D. Ratner, Biotechnol. Bioeng., 2012, 109, 1898–1911 CrossRef CAS PubMed.
- J. M. Anderson, in In Vitro and in Vivo Monocyte, Macrophage, Foreign Body Giant Cell, and Lymphocyte Interactions with Biomaterials, ed. D. Puleo and R. Bizios, Springer, USA, 2009, p. 225 Search PubMed.
- W. Brodbeck, Y. Nakayama, T. Matsuda, E. Colton, N. Ziats and J. Anderson, Cytokine, 2002, 18, 311–319 CrossRef CAS.
- A. M. B. Collie, P. C. S. Bota, R. E. Johns, R. V. Maier and P. S. Stayton, J. Biomed. Mater. Res., Part A, 2011, 96, 162–169 CrossRef PubMed.
- A. Refai, M. Textor, D. Brunette and J. Waterfield, J. Biomed. Mater. Res., Part A, 2004, 70A, 194–205 CAS.
- J. Brauker, V. Carrbrendel, L. Martinson, J. Crudele, W. Johnston and R. Johnson, J. Biomed. Mater. Res., 1995, 29, 1517–1524 CrossRef CAS PubMed.
- Y. Fukano, M. L. Usui, R. A. Underwood, S. Isenhath, A. J. Marshall, K. D. Hauch, B. D. Ratner, J. E. Olerud and P. Fleckman, J. Biomed. Mater. Res., Part A, 2010, 94A, 1172–1186 CAS.
- E. M. Sussman, M. C. Haplin, J. Muster, R. T. Moon and B. D. Ratner, Ann. Biomed. Eng., 2014, 42, 1508–1516 CrossRef PubMed.
- R. J. Schutte, A. Parisi-Amon and W. M. Reichert, J. Biomed. Mater. Res., Part A, 2009, 88A, 128–139 CrossRef CAS PubMed.
- D. T. Chang, J. A. Jones, H. Meyerson, E. Colton, I. K. Kwon, T. Matsuda and J. M. Anderson, J. Biomed. Mater. Res., Part A, 2008, 87A, 676–687 CrossRef CAS PubMed.
- N. Dehne and B. Bruene, Exp. Cell Res., 2009, 315, 1791–1797 CrossRef CAS PubMed.
- S. N. Greer, J. L. Metcalf, Y. Wang and M. Ohh, EMBO J., 2012, 31, 2448–2460 CrossRef CAS PubMed.
- T. Nakayama, H. Kurobe, N. Sugasawa, H. Kinoshita, M. Higashida, Y. Matsuoka, Y. Yoshida, Y. Hirata, M. Sakata, M. W. Maxfield, M. Shimabukuro, Y. Takahama, M. Sata, T. Tamaki, T. Kitagawa and S. Tomita, Cardiovasc. Res., 2013, 99, 705–715 CrossRef CAS PubMed.
- K. A. Mace, D. H. Yu, K. Z. Paydar, N. Boudreau and D. M. Young, Wound Repair Regener., 2007, 15, 636–645 CrossRef PubMed.
- T. T. Lau and D. Wang, Expert Opin. Biol. Ther., 2011, 11, 189–197 CrossRef CAS PubMed.
- S. Prokoph, E. Chavakis, K. R. Levental, A. Zieris, U. Freudenberg, S. Dimmeler and C. Werner, Biomaterials, 2012, 33, 4792–4800 CrossRef CAS PubMed.
- W. Zhao, L. Wang, L. Zhang, C. Yuan, P. C. Kuo and C. Gao, J. Biol. Chem., 2010, 285, 20452–20461 CrossRef CAS PubMed.
- C. Giachelli, D. Lombardi, R. Johnson, C. Murry and M. Almeida, Am. J. Pathol., 1998, 152, 353–358 CAS.
- S. R. Rittling, Expert Rev. Mol. Med., 2011, 13, e15 CrossRef PubMed.
- W. Zhao, L. Wang, M. Zhang, P. Wang, L. Zhang, C. Yuan, J. Qi, Y. Qiao, P. C. Kuo and C. Gao, J. Immunol., 2011, 186, 3173–3179 CrossRef CAS PubMed.
- N. Unoki, T. Murakami, K. Nishijima, K. Ogino, N. van Rooijen and N. Yoshimura, Invest. Ophthalmol. Visual Sci., 2010, 51, 3362–3371 Search PubMed.
- D. G. Duda, S. V. Kozin, N. D. Kirkpatrick, L. Xu, D. Fukumura and R. K. Jain, Clin. Cancer Res., 2011, 17, 2074–2080 CrossRef CAS PubMed.
- P. Carmeliet and R. K. Jain, Nature, 2011, 473, 298–307 CrossRef CAS PubMed.
- D. Delia, M. G. Lampugnani, M. Resnati, E. Dejana, A. Aiello, E. Fontanella, D. Soligo, M. A. Pierotti and M. F. Greaves, Blood, 1993, 81, 1001–1008 CAS.
- J. Dai, L. Peng, K. Fan, H. Wang, R. Wei, G. Ji, J. Cai, B. Lu, B. Li, D. Zhang, Y. Kang, M. Tan, W. Qian and Y. Guo, Oncogene, 2009, 28, 3412–3422 CrossRef CAS PubMed.
- W. Brodbeck, G. Voskerician, N. Ziats, Y. Nakayama, T. Matsuda and J. Anderson, J. Biomed. Mater. Res., Part A, 2003, 64A, 320–329 CAS.
- A. Nair, L. Zou, D. Bhattacharyya, R. B. Timmons and L. Tang, Langmuir, 2008, 24, 2015–2024 CrossRef CAS PubMed.
- S. Kamath, D. Bhattacharyya, C. Padukudru, R. B. Timmons and L. Tang, J. Biomed. Mater. Res., Part A, 2008, 86A, 617–626 CrossRef CAS PubMed.
- P. Thevenot, W. Hu and L. Tang, Curr. Top. Med. Chem., 2008, 8, 270–280 CrossRef CAS.
- C. Sperling, R. Schweiss, U. Streller and C. Werner, Biomaterials, 2005, 26, 6547–6557 CrossRef CAS PubMed.
- T. Schioppa, B. Uranchimeg, A. Saccani, S. Biswas, A. Doni, A. Rapisarda, S. Bernasconi, S. Saccani, M. Nebuloni, L. Vago, A. Mantovani, G. Melillo and A. Sica, J. Exp. Med., 2003, 198, 1391–1402 CrossRef CAS PubMed.
Footnotes |
| † On behalf of the current and recent graduate students and postdoctoral fellows in the Sefton Lab, Laura A. Wells would like to dedicate this paper to Michael V. Sefton in honour of his 65th Birthday and for his valuable inspiration, guidance and support. |
| ‡ Electronic supplementary information (ESI) available. See DOI: 10.1039/c4bm00159a |
| This journal is © The Royal Society of Chemistry 2014 |