 Open Access Article
Creative Commons Attribution 3.0 Unported Licence
Single particle inductively coupled plasma mass spectrometry with nanosecond time resolution†‡
Annika
Schardt
 a,
Johannes
Schmitt
 a and
Carsten
Engelhard
 *abc
*abc
aDepartment of Chemistry and Biology, University of Siegen, Adolf-Reichwein-Str. 2, D-57076 Siegen, Germany. E-mail: carsten.engelhard@bam.de
bResearch Center of Micro- and Nanochemistry and (Bio)Technology, University of Siegen, Adolf-Reichwein-Str. 2, D-57076 Siegen, Germany
cFederal Institute for Materials Research and Testing (BAM), Richard-Willstätter Str. 11, D-12489 Berlin, Germany
First published on 5th December 2023
Abstract
In this proof-of-principle study, we present our contribution to single particle inductively coupled plasma mass spectrometry (spICP-MS) developments with a novel in-house built data acquisition system with nanosecond time resolution (nanoDAQ) and a matching data processing approach. The new system can continuously sample the secondary electron multiplier (SEM) detector signal and enables the detection of gold nanoparticles (AuNP) as small as 7.5 nm with the commercial single quadrupole ICP-MS instrument used in this study. Recording of the SEM signal by the nanoDAQ is performed with a dwell time of approximately 4 ns. A tailored method was developed to process this type of transient data, which is based on determining the temporal distance between detector events that is denoted as event gap (EG). We found that the inverse logarithm of EG is proportional to the particle size and that the number of detector events corresponding to a particle signal distribution can be used to calibrate and determine the particle number concentration (PNC) of a nanoparticle dispersion. Due to the high data acquisition frequency, a statistically significant number of data points can be obtained in 60 s or less and the main time limitation for analyses is merely the sample uptake time and rinsing step between analyte solutions. At this stage, the data processing method provides average information on complete data sets only and will be adapted to enable particle-by-particle analysis with future hardware/software revision.
1. Introduction
Engineered nanomaterials (ENMs) are used in over 11.000 different products and produced in 68 countries according to a nanotechnology products database. Important application fields include electronics, medicine, construction, and cosmetics.1Single particle inductively coupled plasma mass spectrometry (spICP-MS) is now well established as a method for the analysis of nanoparticles (NP) in consumer and industrial products, laboratory tests, ecotoxicology tests, foods, as well as environmental and biological samples.2,3
When the concept of observing transient signals of airborne particles in an ICP was first applied to a mass spectrometer by Nomizu et al. in 1993,4 most available quadrupole mass spectrometers could be operated at dwell times (d.t.) in the range of milliseconds. However, highly-resolved temporal profiles of singular ion clouds, which were produced from colloids and droplets in the ICP, were already reported by Olesik and Hobbs in 1992, who were able to “oversample” the ion cloud signal with a dwell time of only a few microseconds by connecting the current amplifier of the secondary electron multiplier (SEM) to a digital oscilloscope.5 This mode of data acquisition was initially less favourable than the usage of millisecond dwell times, because the total measurement time was limited. Since the interest in microsecond time resolution has been rediscovered, researchers connected custom data acquisition systems6–8 or oscilloscope solutions9,10 to commercial ICP-MS instruments, while manufacturers adapted their hardware and software to the increasing request for fast data acquisition capabilities, as well.11–15
Sampling the detector signal with microsecond time resolution for the application in spICP-MS bears numerous benefits. A crucial factor for the establishment of spICP-MS as a routine method for NP characterization is the size detection limit, which can be lowered significantly by utilizing short dwell times, as reported in our earlier study, in which we were able to detect gold nanoparticles (AuNP) as small as 10 nm with a single quadrupole ICP-MS by utilizing data acquisition with 5 μs time resolution.8 With a dwell time of 50 μs, Lamsal et al. could quantify platinum nanoparticles with a diameter of 10 nm.16 Montaño et al. evaluated the advantage of employing dwell times from 25–100 μs for the detection of SiO2 NP over the previously common method of removing the polyatomic spectral interference of 14N14N+ on 28Si+ by use of a collision or reaction gas.17 Additionally, Kálomista et al. were able to distinguish gold nanorods from spherical gold NP by comparing the shape of the oversampled ion cloud profiles of both particle types,18 as well as to determine the structure and composition of Au–Ag bimetallic nanoparticles.19 Because it was suggested that the cytotoxicity of gold nanoparticles and the tendency of titanium dioxide particles to permeate the blood–brain-barrier is shape-dependent,20–22 this application could be of rising interest for future investigations. Another very recently demonstrated advantage of microsecond dwell times is the significant reduction of the 12C+ and 13C+ background signals, which was exploited by Bolea-Fernandez et al., Liu et al., and Gonzalez de Vega et al. to detect microplastic particles as small as 1.0 μm, 0.8 μm, and 0.6 μm, respectively, with dwell times of 100 μs.23–25 Mozhayeva and Engelhard showed that fast data acquisition and a tailored data processing method for spICP-MS enable to detect silver nanoparticles (AgNP) in the presence of up to 7.5 μg L−1 ionic silver.26 Naturally, these promising results led to an increasing usage of μs-spICP-MS (microsecond spICP-MS) for a wide range of applications, which to date makes up for ca. 45% of all reported applications of spICP-MS since 2014.3
Only recently, Duffin et al. recorded time stamps of individual detector output pulses of a multicollector ICP-MS with an accuracy of 0.5 ns by means of a time-to-digital-converter and utilized the time between two successive ion arrivals at the detector to distinguish between ions produced from particles and ions stemming from a continuous background. They observed a significant shortening of the time gap between ions during detection of an ion burst from a particle in comparison to longer gaps between background ions. The authors used an algorithm based on boxcar averages in combination with a reasonably set threshold value to determine the beginning and the end of a detected ion cloud in transient plots that present the cumulative count of detected ions vs. the measurement time stamp. This new approach allowed for the detection of 5 nm AuNPs in a citrate-buffered solution. The correlation between the number of detected counts per ion cloud vs. the theoretical number of atoms per particle was shown to be linear for gold particles from 5–20 nm. Above that size, however, the response curve flattens, which the authors attribute to non-detection of ions due to pulse pileup.27
In this feasibility study, we report spICP-MS data with a time resolution in the nanosecond range with single quadrupole ICP-MS instrumentation, investigate the possibilities of using dwell times that are significantly shorter than individual transients from AuNP entering the ICP using a standard sample introduction system, and describe a concept on how to process a continuous stream of nanosecond time-resolved spICP-MS (ns-spICP-MS) data for size calibration of nanomaterials.
2. Theory
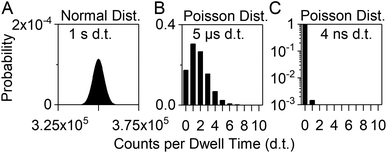
When the SEM is operated in pulse counting mode, each pulse is registered as a detector event (DE) by the pulse detection electronics (above a certain discriminator level). Accordingly, each DE is denoted as one “count”. Only two logical states are possible; either a DE occurs (1 count) or it does not (0 counts). Conventional pulse counting data acquisition systems for ICP-MS count the number of DE during certain, adjustable dwell times (nowadays as low as a few microseconds up to several seconds)8,15 and eventually store and display an output signal as a data point (dp) with the accumulated number of counts as y-value and the measurement time of the dwell as x-value. The typical upper limit of the linear dynamic range of the pulse counting stage of an SEM for ICP-MS is ca. 106 counts per second. A “simultaneous mode” SEM offers the possibility to switch to the analog detection mode above that count rate, which extends the linear dynamic range to ca. 1010 counts per second. In this work, the maximum count rate was expected to be below the linear range of the analog detection mode and therefore, only the pulse counting output current was sampled.During the measurement of solutions with high analyte concentration, many analyte ions are detected during each dwell of the detector and the output signal is accordingly high. When long dwell times are set and the analyte in the solution is highly concentrated, the output signal is assumed to be normally distributed with an integer median value and a standard deviation. For example, a measurement of the 115In+ ion signal during aspiration of a 1 μg L−1 dissolved indium solution with a dwell time of 1 s might produce dp with a mean y-value of 350 000 counts and a typical standard deviation of ±1% (Fig. 1A). According to normal distribution statistics, between 360![[thin space (1/6-em)]](https://www.rsc.org/images/entities/char_2009.gif) 500 and 339
500 and 339![[thin space (1/6-em)]](https://www.rsc.org/images/entities/char_2009.gif) 500 DE are counted during each dwell of 1 s with a probability of 99.7% (±3σ).
500 DE are counted during each dwell of 1 s with a probability of 99.7% (±3σ).
The lowest possible absolute number of counts is 0. Most of the dp will be 0, when the analyte ion concentration is extremely low and DE occur rarely during the measurement, or if the dwell time is sufficiently short. At this point, the probability distribution for a certain number of counts to occur during one dwell interval is best described by Poisson statistics. If the same indium solution as described above is analyzed with a dwell time of 5 μs, which can be achieved with our previously presented inhouse-built microsecond data acquisition unit (μsDAQ),8 the probability that a dp has the y-value 0 (no DE during dwell interval) is ca. 17% (Fig. 1B). The probability that more than 5 analyte ions are detected during one dwell is below 1%.
The nanosecond data acquisition unit (nanoDAQ), which is presented here, allows the acquisition and storage of the pulse counting signal with a recording time interval as low as 4 ns. For comparison, the same calculation as described above for 5 μs dwell time is now performed with 4 ns instead. According to Poisson statistics, the probability that no DE event occurs during one recording interval of 4 ns is ca. 99.85%. The probability that exactly one ion hits the detector during one dwell is less than 0.15%, and the coinciding detection of more than 1 ion has a probability of roughly 5 × 10⁻⁸%. Therefore, the risk that a dp has a y-value other than 0 or 1 is virtually eliminated and the transient output signal that is obtained with this nanoDAQ should in theory represent the actual pulse counting signal of the SEM.
In spICP-MS measurements with dwell times shorter than the duration of an analyte ion cloud from a nanoparticle, the ion cloud signal is “oversampled”, i.e., more than one dp is acquired per ion cloud. Different approaches have been described to identify and extract data from individual ion clouds (or particle events) from the raw data of such a time-resolved measurement.15,26,28 In an exemplary measurement in this study we analyzed ion cloud signal traces of AuNP that were acquired with 5 μs time resolution using the μsDAQ (data not shown). They were found to have an average duration of 435 μs and comprised 87 dp (average values of 639 ion clouds from 80 nm AuNP). The average maximum number of DE per 5 μs (i.e., per dp) was 40 counts. If the same measurement were to be carried out with 4 ns dwell time, the probability that more than one DE would occur during one dwell would be ca. 6 × 10⁻⁴%. So even during the measurement of nanoparticles up to a size of at least 80 nm, which produce ion clouds with very high analyte ion densities, the acquired data values of 0 or 1 should be reliable.
3. Experimental section
3.1 Sample preparation
Monodisperse spherical AuNP in aqueous dispersions with tannic acid coating, an initial total mass concentration of ca. 0.05 mg mL−1, and nominal sizes of 5, 7, 10, 20, 40, and 100 nm were obtained from nanoComposix (San Diego, CA, USA), as well as citrate-coated AuNP with an initial mass concentration of 0.05 mg mL−1 and nominal sizes of 5, 10, 30, 50, 80, and 100 nm. Citrate-coated AuNP with sizes of 70 nm (0.05 mg mL−1) and 125 nm (0.06 mg mL−1) were obtained from Nanopartz Inc. (Loveland, CO, USA). For particle number concentration (PNC) calibration and transport efficiency (TE) determination, quality control material LGCQC5050 (spherical AuNPs with a diameter of 32.7 ± 2.0 nm, a total mass concentration of 45.1 ± 1.5 mg kg−1, and a PNC of 1.47 × 10¹¹ ± 2.8 × 10¹⁰ NP per g in 1 mM citrate buffer) were obtained from LGC Limited (Middlesex, UK). For NP size validation, the NIST reference material 8011 (spherical AuNP with a diameter of 8.9 ± 0.1 nm (TEM) and a total mass concentration of 51.56 ± 0.23 μg g−1) were obtained from the NIST National Institute of Standards and Technology (Gaithersburg, Maryland, USA). Tri-sodium citrate dihydrate (p.a., ≥99%) was obtained from Carl Roth GmbH + Co. KG (Karlsruhe, Germany) and diluted in bi-distilled water to obtain a 1 mM citrate buffer solution.NP dispersions were stored at 4 °C in darkness until the sample dilutions were prepared, except for the NIST RM 8011, which was stored at r.t., as recommended by the manufacturer. Before analysis, NP standard dispersions were let come to r.t., shaken by hand for 30 s, and directly diluted to the desired PNC in 1 mM citrate buffer. The approximate PNC [number of particles per mL (# mL−1)] for size calibration solutions was calculated from the mass concentration and particle diameter provided by the manufacturer under the assumption that the AuNP are monodisperse, spherical, and have a density of 19.3 g cm−3. Exact NP diameters for size calibration of selected NP standards were determined via in-house S-TEM analysis with a minimum number of 100 analyzed particles per sample and are listed in Table 1, as well as the size values as declared by the manufacturers (determined via TEM). Nitric acid (≥99%, analytical reagent grade, Fisher Scientific, Loughborough, UK) was diluted to obtain a 2% HNO3 solution for rinsing the ICP-MS sample introduction system before each sample.
| LOT | Vendor declaration (TEM) | In-house analysis (S-TEM) | |
|---|---|---|---|
| Size/nm (±SD) | Size/nm (±SD) | No. of analysed particles | |
| DAC1299 | 4.7 ± 0.7 | 5.4 ± 0.9 | 165 |
| IAD0060 | 5.1 ± 0.6 | 5.3 ± 0.8 | 356 |
| DAC1294 | 6.5 ± 0.9 | 7.5 ± 0.7 | 209 |
| EAW1123 | 9.1 ± 0.8 | 9 ± 1 | 648 |
| IAD0033 | 10.3 ± 0.9 | 10 ± 2 | 950 |
| TJC0021 | 18 ± 1.5 | Not determined | — |
| JCL0014 | 30 ± 3 | 30 ± 3 | 509 |
| CWW0039 | 41 ± 4 | Not determined | — |
| JLC0019 | 51 ± 5 | 48 ± 6 | 206 |
| KDP0021 | 59 ± 5 | Not determined | — |
| 11H73-12430 | 70 ± 3 | Not determined | — |
| JSD0015 | 75 ± 10 | 78 ± 14 | 242 |
| ZYR0003 | 83 ± 8 | 83 ± 9 | 214 |
| JME1085 | 100.9 ± 12.1 | 96 ± 13 | 105 |
| SCK0012 | 101 ± 11 | 100 ± 10 | 174 |
| 11J311-12430 | 125 ± 4 | Not determined | — |
3.2 Instrumentation
All experiments were carried out on a model iCap Qc ICP-Q-MS (Thermo Fisher Scientific, Bremen, Germany). The Qtegra ISDS software (2.10.3324.131, Thermo Fisher Scientific) was used to control the instrument. Sample introduction was achieved with a model ESI SC-2 DX autosampler (ESI Elemental Service & Instruments GmbH, Mainz, Germany), a MicroFlow PFA-ST nebulizer (Thermo Fisher Scientific) with a sample flow rate of 165 ± 1 μL min−1 (determined gravimetrically), and a Peltier-cooled cyclonic quartz spray chamber (cooled to 3 °C). The plasma torch injector inner diameter was 1 mm and the sampling position was set to 1 mm, as well. The high-sensitivity skimmer cone insert “2.8” (Glass Expansion, Melbourne, Australia) for the nickel skimmer cone was used to increase the sensitivity of the instrument. The radio frequency (RF) generator power was set to 1450 W and extraction lens 1 and 2 voltages were 0 V and −154 V, respectively. A second roughing pump was attached to achieve an interface pressure of 1.4 mbar for highest NP detection efficiency. While a second roughing pump was used here, it is not a requirement for the nanosecond time resolution approach to work. The NP transport efficiency (TE) of the system was determined with the particle frequency method using three different concentrations of the reference material LGCQC5050 (3 replicates per concentration) as particle number calibration standard and was found to be 6.8 ± 0.2% (RSD = 3%, n = 3).Each NP sample dispersion was analyzed for 30 or 60 s. To avoid carry-over, the 197Au+ signal was observed via a live monitor view with 5 μs dwell time and the introduction system was rinsed with 2% HNO3 between samples until almost no more particle signals were detected (at least 30 s) and subsequently rinsed with bi-distilled water to avoid dissolution of NP in the remaining acid in the tubes during samples uptake of the next sample. Argon (5.0, Messer Industriegase GmbH, Siegen, Germany) was used as nebulizer gas and the flow rate was optimized for different NP types and sizes between 0.48–0.80 L min−1. Optimum values were obtained at a flow rate of 0.58 L min−1. Argon was also used as cooling gas and auxiliary gas with flow rates of 14 L min−1 and 0.8 L min−1, respectively. The mass resolution of the quadrupole was decreased using ICP-MS software settings to obtain higher sensitivity for the 197Au+ ion trace, an approach which was adapted from Meyer et al.29 The extent of the sensitivity improvement of the optimized setup compared to standard mode was not studied in detail. Preliminary results using the μsDAQ showed approximately 9% higher radius unit values for AuNP (+30% for AgNP) in spICP-MS measurements with reduced mass resolution in comparison to normal mass resolution. This is a result of the detection of more ions per particle due to a higher ion transmission through the quadrupole. It can be assumed that the increased ion transmission also benefits the size LOD using the new nanoDAQ system. However, the exact scale of this effect, nor the impact of the commercial high-sensitivity-skimmer cone insert (which we use as default instrumentation for spICP-MS analysis) were characterized in detail for this proof-of-concept study.
3.3 Data acquisition and data processing
The SEM was operated in pulse counting mode to ensure continuous signal detection with the two home-built data acquisition units. Therefore, the “Counting Threshold” value, above which the analog acquisition mode of the detector would be activated, was set to the maximum possible value of ∼65![[thin space (1/6-em)]](https://www.rsc.org/images/entities/char_2009.gif) 000. Data was acquired simultaneously with dwell times of approximately 4 ns and 5 μs (and 0.1 ms if indicated). The nanoDAQ samples the pulse counting output signal of the SEM with a frequency of 240 MHz, which results in a recording time interval of 4.167 ns. If the pulse counting output voltage exceeds a certain threshold limit at the time the signal is captured by the nanoDAQ, 1 count will be assigned to this data point and it will be processed as a detector event. If the SEM output signal is below the threshold, a data point with 0 counts will be stored. This high frequency sampling of the pulse counting signal is independent of the SEM detector dead time, i.e., only dp with 0 counts are recorded during the dead time, regardless of possible incident ions at the first SEM dynode. Because analysis with a digital oscilloscope showed that the durations of the pulse counting output pulses exceed the nanoDAQ sampling interval of 4.167 ns, it is possible that one pulse is sampled twice, which leads to the acquisition of two successive data points with 1 count. In turn, it is necessary to use such a high sampling frequency to ensure that no pulses are lost. Effects of this “pulse oversampling” on the data evaluation are discussed below.
000. Data was acquired simultaneously with dwell times of approximately 4 ns and 5 μs (and 0.1 ms if indicated). The nanoDAQ samples the pulse counting output signal of the SEM with a frequency of 240 MHz, which results in a recording time interval of 4.167 ns. If the pulse counting output voltage exceeds a certain threshold limit at the time the signal is captured by the nanoDAQ, 1 count will be assigned to this data point and it will be processed as a detector event. If the SEM output signal is below the threshold, a data point with 0 counts will be stored. This high frequency sampling of the pulse counting signal is independent of the SEM detector dead time, i.e., only dp with 0 counts are recorded during the dead time, regardless of possible incident ions at the first SEM dynode. Because analysis with a digital oscilloscope showed that the durations of the pulse counting output pulses exceed the nanoDAQ sampling interval of 4.167 ns, it is possible that one pulse is sampled twice, which leads to the acquisition of two successive data points with 1 count. In turn, it is necessary to use such a high sampling frequency to ensure that no pulses are lost. Effects of this “pulse oversampling” on the data evaluation are discussed below.
Graphical representation of results was performed with Origin 2017 (OriginLab Corporation, Northampton, MA, USA) and the Binary Viewer (Version 6.17.4.26) from ProXoft L.L.C.
4. Results and discussion
4.1 Nanosecond time-resolved data
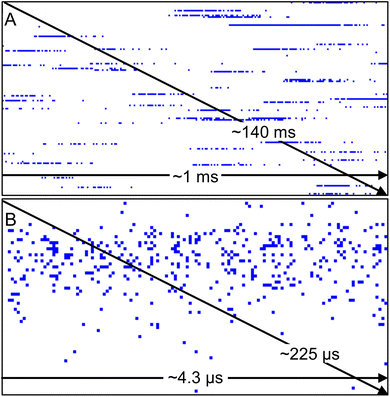
In this work, a custom nanoDAQ system was used to record the pulse counting signal in spICP-MS on a nanosecond timescale. Because the pulse counting signal was captured directly behind the preamplifier/discriminator stage of the instrument's detection electronics, a stream of data was recorded that represents the number of pulses in each dwell. Only data points with 1 and 0 counts can be obtained with the nanoDAQ, which should be reliable according to Poisson statistics (cf. Theory section above). Here, a value of 0 counts indicates that no detector event occurred during the dwell time, while a value of 1 is considered the result of an ion hit onto the detector (or that dark counts/electrical noise were recorded). Continuous signal acquisition of 30 s duration creates a data file containing ca. 7 × 10⁸ dp, which corresponds to a file size of roughly 680 MB. Even during the analysis of ion clouds with temporarily high analyte ion densities, detector events are well spaced out on the nanosecond time scale and the majority of dp have the value 0 (cf. Theory section above).Raw data of the nanoDAQ is visualized in this work with a binary viewer program in a simplified way (Fig. 2). The acquired binary data, which is a succession of 0 and 1 (bits), is shown as bytes (8 bits) by the binary viewer program for visualization purposes. Depending on the value of each byte, its respective pixel in the graph is assigned with a customized colour. Here, each byte with a value of 0 (no DE) is represented by a white pixel and each byte with a value other than 0 (i.e., one or up to 8 DE) is represented in blue. The first dp of the data set is in the upper left corner, subsequent dp are shown as pixels from left to right to complete a row and the data rows fill down from top to bottom to the last dp. When the analyte ion density in the plasma is low, ions that emerge from the mass analyzer region are very likely to hit the SEM spaced out in time. Such temporal gaps will appear as a white space in the display. Contrarily, analyte ions arrive at the detector in quick succession over a limited time span, if the analyte ion density is high. In spICP-MS, regions in the data display with a temporarily high density of blue pixels (i.e. representing DE) can be safely assumed to originate from the detection of an ion cloud with the SEM. Display settings can be changed to view a succession of ion clouds (Fig. 2A) or to zoom into a singular ion cloud (Fig. 2B) by choosing how many bytes should be binned for one logical pixel.
In both representations, similarities can be observed between this data and transient signal profiles of ion clouds that were produced from colloids in an ICP with microsecond time-resolved analysis. In μs-spICP-MS, if an appropriate amount of data points across a peak is available, one typically observes a mass-to-charge (m/z) signal trace with a fast “rising edge”, i.e., the ion density in space increases rapidly until a maximum is reached, which then gradually tails off to the background level. With nanosecond time-resolved analysis, it was similarly observed that the SEM pulse density in time, i.e., the density of DE in Fig. 2, seems to correlate with the ion density in space upstream the mass analyzer. Here, earlier studies using time-resolved measurements of particles and single droplets are helpful to understand these transient signals. Transient ion cloud signal profiles have been described previously by Stewart and Olesik via experiments and simulations.30 Both simulated and measured ion cloud signal traces in Stewart and Olesik's study support our assumption that the data visualized with the binary viewer shows signals that originated from nanoparticles. Further evidence to support this was obtained by additional data processing, which is explained in the next sections.
The number of successive dp with 0 counts between two DE is proportional to the time gap between the two respective detector events. Further in the manuscript, this will be referred to as “event gap (EG)”. If the dwell time (∼4 ns) and other SEM settings are kept constant throughout an experiment, multiplication of the observed EG with the dwell time provides transient information on the gap between two DE (e.g.: an EG value of 1000 would correspond to a lag of ∼4 μs between two ion impacts at the detector).
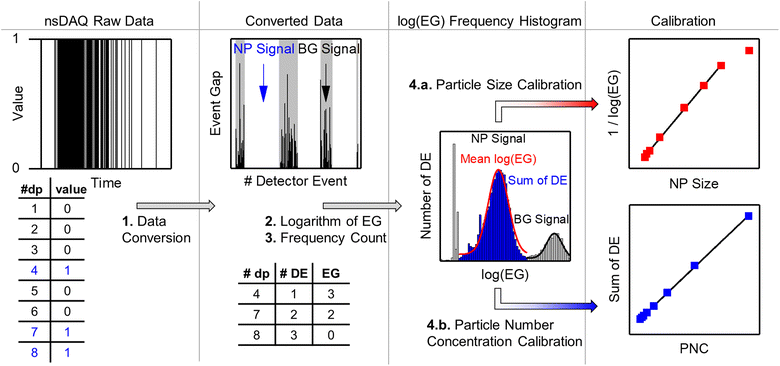
Acquired ns-spICP-MS data files are usually too large to be adequately processed with common data processing software as, for example, Origin and Excel. Therefore, a custom data processing software for ns-spICP-MS was developed that compresses the file size by removing all dp with the value 0 but preserving the timing information. Specifically, each individual dp with a value of 1 is now labeled with the number of preceding 0 s as ordinate (i.e., the numerical value of the EG) and with its consecutive number of dp (# dp) in the data set as abscissa (i.e., the timing information). In the following example the pulse counting raw data consisting of 8 dp would be converted to 3 dp in the new following format: raw: (1,0); (2,0); (3,0); (4,1); (5,0); (6,0); (7,1); (8,1) → converted: (4,3); (7,2); (8,0). The factor of data compression depends on the number of DE in the data file, because only the dp with 0-values are removed, i.e., the higher the analyte ion concentration, the larger the converted file size.
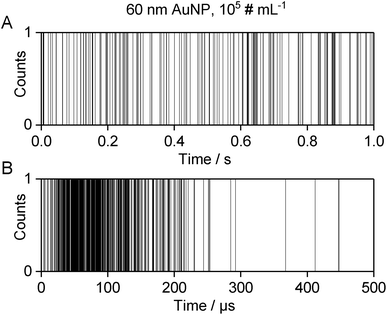
The converted data can be imported into Excel or Origin for further processing, for which there are several options: one possibility for data visualization is to plot the dp value (1 or 0) versus the absolute measurement time, which is obtained by multiplication of the sequential number of the dp in the data set with the dwell time, as described above. The resulting graph resembles the structure of a bar code. Processed transient data of 1 s analysis of a AuNP dispersion with the nanoDAQ are shown in Fig. 3A, while Fig. 3B shows a zoom into a time window, during which an individual ion cloud was detected. Note that the line thickness in these graphs gives the impression as if most of the dp represent DE, which is, in fact, not the case (cf.Fig. 2). However, what can be readily observed in this type of visualization of individual ion clouds is in accordance with observations that were made earlier with microsecond time-resolved ICP-MS: the pulse count (resp. ion beam density) is high at the temporal “front” of the detection window and declines towards the “back”, i.e. what would be the trailing edge of an ion cloud peak in a more customary visualization of microsecond time-resolved data.8,30–33
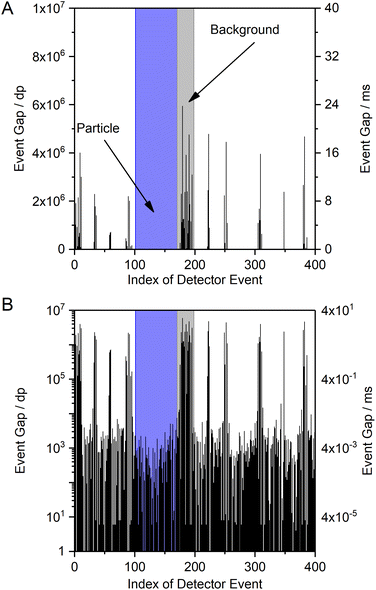
An alternative data visualization approach compared to the one above is to plot the EG versus the sequential number of the DE (Fig. 4A). Here, sections on the x-axis with DE that show high EG values correspond to the background (BG) signal and sections with low EG values indicate the detection of an ion cloud with high analyte ion density (short temporal gaps between DE). The sections of the x-axis in Fig. 4A that correspond to the BG appear spatially “narrow” in the plot, because DE occur rarely at low ion densities and few data points are extracted from the raw data files (raw data files contain all acquired data points with 0 or 1 counts of the complete measurement, while extracted data only contains the EG between DE). Sections that correspond to time spans, during which ion clouds were detected, are spatially “broader” on the abscissa in the plot, because each ion cloud consists of a large number of ions and many dp correspond to DE. Please note that, in contrast, the temporal duration of the BG sections is much longer compared to the short ion cloud events. A logarithmic scale of the EG (y-axis) helps to recognize the very low EG values during particle detection alongside the high EG of the background (Fig. 4B).
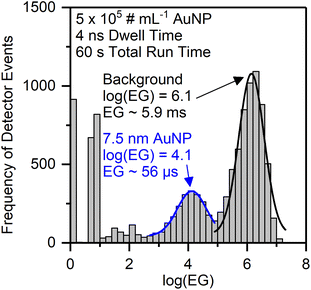
Because this approach allows to qualitatively differentiate between background signal and particle signals, we further processed the EG data to obtain characteristics that can be utilized for quantitative NP size determination. A frequency histogram of the entire data set was created to distinguish between the two data populations with either high or low EG values. However, the resulting histogram of EG vs. DE does not show two clearly separated signal populations, but simply confirms that most of the dp have low EG values (data not shown). We found, however, that a frequency histogram of the logarithm of the event gap (log(EG)) indeed allows to distinguish between a particle signal population (short log(EG)) and a background signal population (long log(EG)) (Fig. 5). This visualization will be used further below in the manuscript. Here, it is important to note that this style of representation is in contrast to typical spICP-MS size distribution data, in which the background signal is on the left and the particle signal is on the right. Also, the frequency histograms in this work are constructed from all detector events, so they only represent the merged information on ions from all nanoparticles, which is currently due to limitations in the data processing software and we hope to be able to improve this in a follow-up study to provide both nanosecond time resolution and size information on all individual particles. Hence, the mean log(EG) value of the NP signal population represents the mean temporal gap between two ions arriving at the detector, averaged over all ions in ion clouds from the respective NP population during the entire measurement. The calculation of the size resolution capability of the method is therefore not applicable.
We successively analyzed dispersions of AuNP with different sizes and processed the nanosecond time-resolved data as described above. With our nanoDAQ system in combination with decreased mass resolution we were able to distinguish signals from AuNP as small as 7.5 nm from the background in combination with a commercial single quadrupole ICP-MS (Fig. 5). Signals from particles with a size of 5.3 nm were also detected but the separation from the background signal was considered to be not sufficient.
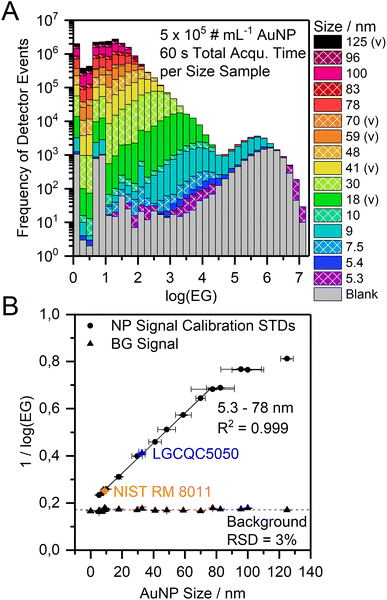
Because of these promising results above, the mean log(EG) value of the particle population (Gauss fit) was calculated for each particle size and it was found that the mean log(EG) is inversely proportional to the particle size (Fig. 6A). Ion clouds from small particles show a higher mean log(EG) than large particles, i.e., the mean time gap between two DE in an ion cloud from a small particle is longer. Smaller particles require less energy for complete vaporization, atomization, and ionization than larger particles and consequently, their ion clouds start to diffuse earlier in the plasma, which decreases their spatial ion density (in addition to broadening effects downstream). When an ion cloud with a low spatial ion density emerges from the mass analyzer, this results in the detection of ions with long temporal gaps between them. Based on this and our observation of the EG values one likely explanation is that the mean spatial ion density in ion clouds from small particles is lower at the detector than in ion clouds from large particles (assuming no other contributing factors such as space-charge effects, ion focusing etc.). Moreover, we empirically found that the correlation between inverse log(EG) (1/log(EG)) and original particle size is linear over a range of 5.3–78 nm (R2 = 0.999) and may, therefore, be a novel approach for NP size calibration (Fig. 6B). Apart from the qualitative considerations on the relationship between particle size and mean event gap of the corresponding detected ion clouds, we did not yet find a mathematical rationale behind that linear correlation. Other correlations might be considered in the future as well, for example, cubic root of (EG) vs. original particle size. In the present work, however, we observed a flattening of the size calibration curve above particle sizes larger than 78 nm. In order to investigate the cause of this non-linearity, we conducted in-house S-TEM measurements of the nanoComposix particle standard solutions to confirm their sizes. We found that all of the analyzed batches are in agreement with the vendor's specifications within the given error range (cf.Table 1). We concluded that most probably the underestimation for larger particle sizes in our calibration curve stems from short lags during data acquisition, which were observed to occur both periodically and irregularly and statistically affect the detection of larger particles more than the detection of smaller particles. If ions from an ion cloud are not detected, the recorded event gap between the preceding and the subsequent ion artificially increases and the inverse log(EG) for size calibration is underestimated. In addition, a dead time correction approach that was already successfully used with the μsDAQ was not yet incorporated into the nanoDAQ at the current stage.33
As mentioned in the introduction, Duffin et al. reported results from spICP-MS measurements with nanosecond time resolution with a multicollector detection system and showed that they were able to perform particle size calibration with the obtained data.27 Their results resemble ours with respect to the limited linear dynamic range, but due to the higher sensitivity of the multicollector they already observe a flattening of the size calibration curve above a AuNP size of 20 nm, which they attribute to pulse pile-up. With a time resolution of 0.5 ns, the group was able to determine the time difference between two incident ions (in our paper referred to as “event gap”), as well. Interestingly, they used this timing information as a parameter for a boxcar-based algorithm that determines the beginning and the end of an ion cloud to enable particle-by-particle analysis. In contrast to our study, Duffin et al. do not use the time difference/event gap information itself for the particle size determination, but instead use the cumulated number of detected counts per particle.
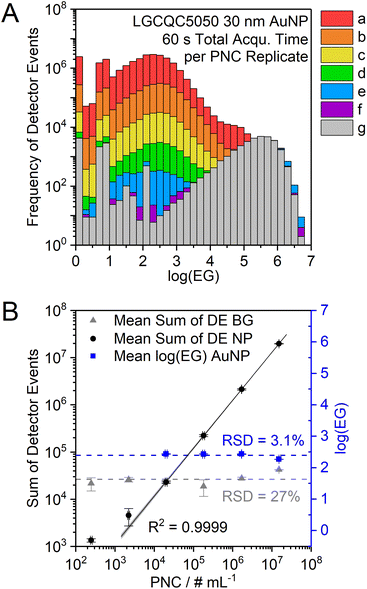
When the particle size and the mass flow rate are kept constant, the number of DE can be used to perform a particle number concentration calibration (Fig. 7). Because these two factors (particle size and PNC) co-dependently influence the sum of DE of the particle signal population, the mean particle size of an unknown sample should first be determined according to the mean log(EG) as described above. The mean log(EG) is not affected by the PNC and only varies by ±3% among the analysis of LGCQC5050 30 nm AuNP with different PNC.
4.2 Comparison of nanoDAQ with μsDAQ and vendor software
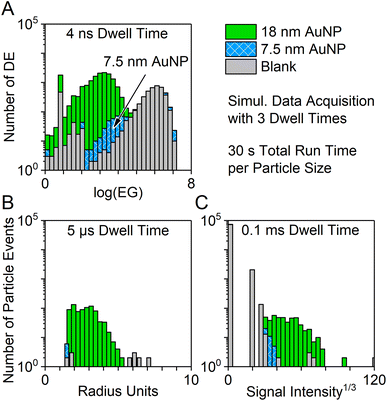
In order to compare the new nanosecond time-resolved data acquisition system to our previously presented μsDAQ and the vendor software, AuNP particle dispersions with nominal sizes of 7.5 nm or 18 nm and a blank solution were analyzed with all three systems simultaneously with dwell times of 4 ns, 5 μs, and 0.1 ms, respectively (Fig. 8).All data acquisition systems succeeded to detect 18 nm AuNP, but the short total run time (30 s) did not suffice to achieve a clear distinction of the particle signal distribution from the background when using dwell times of 0.1 ms and 5 μs. Smaller particles could not be detected at all. Data acquisition with 4 ns time resolution, however, even enabled the detection of 7.5 nm sized AuNPs, which could be clearly distinguished from the background signal.
It is important to keep in mind that the nanoDAQ provides combined data on the distance between detector events during the complete acquisition time, i.e., the log(EG) distribution corresponds to an average of all detected particles. Information on possible outliers or on the degree of monodispersity cannot be drawn from this with the current software prototype. Contrarily, the μsDAQ and vendor software can be used to show a representative particle size distribution and can distinguish different particle sizes in a polydisperse NP sample.
The clear advantage of the nanoDAQ over the other methods lies in the rapid analysis and low size detection capabilities. Because the log(EG) histograms are created from data of each detected ion from all ion clouds, it naturally contains more data points than the particle-based (ion cloud-based) histograms of the alternative methods. Therefore, a statistically relevant number of data points can be gathered in a shorter time span. In comparison: during 30 s of measurement, ∼400 and ∼560 particle signals were detected with the vendor software and the μsDAQ, respectively, while during the same time ca. 14![[thin space (1/6-em)]](https://www.rsc.org/images/entities/char_2009.gif) 000 detector events were recorded by the nanoDAQ.
000 detector events were recorded by the nanoDAQ.
4.3 Analysis of more complex nanoparticle dispersions
Mixtures of AuNP with two different sizes with a PNC ratio of 1![[thin space (1/6-em)]](https://www.rsc.org/images/entities/char_2009.gif) :
:![[thin space (1/6-em)]](https://www.rsc.org/images/entities/char_2009.gif) 1 were analyzed with the nanoDAQ to assess the methods capability to characterize more complex nanoparticle samples. As already outlined above, the log(EG) histograms obtained from the nanoDAQ data show the merged log(EG) values of all ions that were detected during the entire acquisition time. Results from the measurement of test mixtures confirm that the created log(EG) frequency histograms show a convolution of the event gaps between ions in the ion clouds from both types of particles, as well as the BG signal distribution (see ESI, Fig. S1‡). However, the log(EG) distributions are relatively broad in general, because the event gap is not even constant during the detection of one ion cloud. As shown above, the ion density in an individual ion cloud is high at the rising edge (low EG) and decreases towards the end (high EG). Therefore, each ion cloud creates a respective distribution of log(EG) values, and the measurement of many ion clouds creates a cumulated distribution of log(EG) values. The range of log(EG) values from measurements of monodisperse particle solutions ranges from ca. 1–5.5 (ca. 40 ns to 1.3 ms), which means that the distributions of all particle sizes overlap. Because smaller particles produce orders of magnitudes less ions than larger particles, the amplitudes of the log(EG) distribution of small particles are much lower than those of larger particles. Those two factors lead to difficulties in distinguishing two different particle sizes in a mixture, because the distribution of the larger particle size will overlap the distribution of the smaller particle type. The issue might be redeemed to some extend by increasing the particle number concentration of the smaller particles and to ensure a large size discrepancy between the two different types, which would severely impede the applicability of this approach to unknown samples.
1 were analyzed with the nanoDAQ to assess the methods capability to characterize more complex nanoparticle samples. As already outlined above, the log(EG) histograms obtained from the nanoDAQ data show the merged log(EG) values of all ions that were detected during the entire acquisition time. Results from the measurement of test mixtures confirm that the created log(EG) frequency histograms show a convolution of the event gaps between ions in the ion clouds from both types of particles, as well as the BG signal distribution (see ESI, Fig. S1‡). However, the log(EG) distributions are relatively broad in general, because the event gap is not even constant during the detection of one ion cloud. As shown above, the ion density in an individual ion cloud is high at the rising edge (low EG) and decreases towards the end (high EG). Therefore, each ion cloud creates a respective distribution of log(EG) values, and the measurement of many ion clouds creates a cumulated distribution of log(EG) values. The range of log(EG) values from measurements of monodisperse particle solutions ranges from ca. 1–5.5 (ca. 40 ns to 1.3 ms), which means that the distributions of all particle sizes overlap. Because smaller particles produce orders of magnitudes less ions than larger particles, the amplitudes of the log(EG) distribution of small particles are much lower than those of larger particles. Those two factors lead to difficulties in distinguishing two different particle sizes in a mixture, because the distribution of the larger particle size will overlap the distribution of the smaller particle type. The issue might be redeemed to some extend by increasing the particle number concentration of the smaller particles and to ensure a large size discrepancy between the two different types, which would severely impede the applicability of this approach to unknown samples.
4.4 Summary of the data processing workflow for spICP-MS with the nanoDAQ
Based on the findings in this work, the optimized data processing workflow for nanosecond time-resolved spICP-MS data is visualized in Fig. 9 and can be summarized into the following steps:(1) The nanoDAQ raw data is converted to remove data points (dp) with the value “0” and labels each detector event (DE) with the respective event gap (EG).
(2) The logarithm of the EG is calculated to obtain log(EG).
(3) The log(EG) values are binned and a frequency count is performed to create a histogram.
(4a) The inverse mean log(EG) of a Gaussian fit (red curve) to the particle signal distribution in the histogram is used for size calibration.
(4b) The sum of DE of the particle signal distribution (blue) is used for particle number concentration calibration.
5. Conclusions
These proof-of-principle experiments with nanosecond time resolution spICP-MS show that it is possible to acquire, store, and process data that represents the SEM pulse counting signal and to utilize the temporal gaps between individual detector events from ion clouds originating from AuNP in the plasma to quantify nanoparticle characteristics. Our method enables rapid nanoparticle size and PNC determination of monodisperse, non-complex particle dispersions with low size detection limits with a common single quadrupole ICP-MS instrument and a standard sample introduction system. In combination with reduced mass resolution for 197Au+, we could distinguish signals from 7.5 nm AuNPs from the background signal in 60 s of net measurement time (excluding sample uptake and rinsing times). Because the data acquisition system and data processing method are independent of the sample introduction system, the analysis speed could be increased significantly by exchanging the currently used autosampler with a syringe-driven autosampler with shorter sample tube lengths. The currently applied pathway for particle sizing provides only average size information on the complete dataset of one measurement. While this is a drawback for conventional spICP-MS, which demands for particle-by-particle analysis, it does immensely increase the number of data points in the size histogram (here, the number of detected ions in the measurement is counted instead of the number of particles). Therefore, the total measurement time could be reduced even further (e.g., to 30 or 10 s) and still a statistically significant number of data points would be obtained for the size histogram. Furthermore, the sum of detected events can be used for particle number concentration calibration of monodisperse particles with known sizes, provided that measurement parameters are constant.A custom-built data acquisition unit for spICP-MS with nanosecond time resolution enabled the recording of individual ion clouds at the SEM detector of the mass spectrometer. Time-resolved pulse counting signals were obtained and give some insights on ion arrival times at the detector. Time spans with no or very little counts were assumed to be background noise and time spans with a high event density were assumed to originate from dense ion clouds.
With our tailored data processing method, we could visualize and quantify the temporal gap or event gap, with which the ions arrive at the detector during the analysis of gold nanoparticle dispersions. We found empirically that the average inverse logarithm of the EG of the ions that stem from ion clouds is linearly proportional to the mean of the original particles' size. This proportionality can be utilized for a particle size calibration for unknown particle dispersions. However, the average value of the event gap is considered a measure for the ion density in the ion cloud. Large EG values are obtained from ion clouds, in which there is both a large temporal and, correspondingly, a large spatial gap between ions. Because we found a linear relationship between 1/log(EG) and particle size, we can conclude that the average ion density in an ion cloud from a particle appears to be inversely proportional to the original particle's diameter.
Our nanosecond data acquisition system allows us to sample the SEM pulse counting signal above a certain discriminator level within time intervals of circa 4 ns (4.167 ns). The detector dead time, however, is assumed to be in the order of 50 ns.33 Consequently, pulses (i.e. ion events) that occur within the dead time of the SEM cannot be acquired with the system. If the ion density in an ion cloud is sufficiently low, relatively few ions will be lost due to the dead time and the distances between detector events will remain mainly unaffected. Contrarily, the non-detection of an ion during the detector dead time will falsely increase the event gap between its proceeding and succeeding ion, which in consequence leads to an overestimation of the mean event gap of the particle signal distribution. This is a probable explanation for the underestimation of the 1/log(EG) value of larger NP, i.e., the AuNP with 100 nm diameter, which we observed in our data.
Similarly, the nanoDAQ data processing method does not yet correct for pulse oversampling effects of the SEM pulse counting output. Specifically, if the duration of a pulse from an incident ion exceeds 4 ns above the discriminator level, it will be sampled twice, and two (or more) successive data points will be stored with a value of 1. During data conversion, the second (or third) data point will be extracted as a detector event with an event gap of 0. Because it is not a valid mathematical operation to take the logarithm of 0, these DE will not be incorporated into the frequency count histograms.
Furthermore, with the current prototype version of the nanoDAQ we observed both periodically and irregularly occurring pauses during the data acquisition, which lead to data losses. Because the transient information presented above (Fig. 2–4) was calculated by multiplying the indices of DE in the data file with the dwell interval of 4 ns, the resulting ion cloud durations or event gaps in μs or ms can only be understood as rough estimates.
The subject of further studies will be to improve the data acquisition and processing (a) to remedy the data losses during acquisition, (b) to extend the linear size calibration range by applying a suitable dead time correction, (c) to increase the signal-to-noise ratio for analyses of samples with higher ionic background, (d) to distinguish between particles of different sizes in polydisperse mixtures, and (e) to utilize the event gap information to gain insights into the initial particle's geometry.
Author contributions
The manuscript was written through contributions of all authors. All authors have given approval to the final version of the manuscript.Conflicts of interest
There are no conflicts to declare.Acknowledgements
We gratefully acknowledge the FCI (chemical industry fund within the German Chemical Industry Association VCI) for providing a Kekulé fellowship for Annika Schardt. Ingo Strenge is gratefully acknowledged for his work on the original microsecond time resolution data acquisition system for ICP-MS and support of Johannes Schmitt. Dr Julian Müller is gratefully acknowledged for creating the S-TEM images of AuNPs in cooperation with the Micro- and Nanoanalytics Facility (MNaF Siegen). The machine shop team (especially Bernd Meyer and Markus Rabe for help with the ICP-MS) in the Department of Chemistry and Biology of the University of Siegen is gratefully acknowledged.Notes and references
- Nanotechnology Products Database, 2023, https://product.statnano.com/, accessed 28.10.2023 Search PubMed.
- D. Mozhayeva and C. Engelhard, J. Anal. At. Spectrom., 2020, 35, 1740–1783 RSC.
- E. Bolea, M. S. Jimenez, J. Perez-Arantegui, J. C. Vidal, M. Bakir, K. Ben-Jeddou, A. C. Gimenez-Ingalaturre, D. Ojeda, C. Trujillo and F. Laborda, Anal. Methods, 2021, 13, 2742–2795 RSC.
- T. Nomizu, S. Kaneco, T. Tanaka, T. Yamamoto and H. Kawaguchi, Anal. Sci., 1993, 9, 843–846 CrossRef CAS.
- S. E. Hobbs and J. W. Olesik, Anal. Chem., 1992, 64, 274–283 CrossRef CAS PubMed.
- T. Nomizu, H. Hayashi, N. Hoshino, T. Tanaka, H. Kawaguchi, K. Kitagawa and S. Kaneco, J. Anal. At. Spectrom., 2002, 17, 592–595 RSC.
- A. J. Managh, D. N. Douglas, K. Makella Cowen, H. J. Reid and B. L. Sharp, J. Anal. At. Spectrom., 2016, 31, 1688–1692 RSC.
- I. Strenge and C. Engelhard, J. Anal. At. Spectrom., 2016, 31, 135–144 RSC.
- S. Gschwind, L. Flamigni, J. Koch, O. Borovinskaya, S. Groh, K. Niemax and D. Günther, J. Anal. At. Spectrom., 2011, 26, 1166–1174 RSC.
- J. Koch, L. Flamigni, S. Gschwind, S. Allner, H. Longerich and D. Günther, J. Anal. At. Spectrom., 2013, 28, 1707–1717 RSC.
- K. Shigeta, H. Traub, U. Panne, A. Okino, L. Rottmann and N. Jakubowski, J. Anal. At. Spectrom., 2013, 28, 646–656 RSC.
- J. Liu, K. E. Murphy, R. I. MacCuspie and M. R. Winchester, Anal. Chem., 2014, 86, 3405–3414 CrossRef CAS PubMed.
- M. D. Montaño, H. R. Badiei, S. Bazargan and J. F. Ranville, Environ. Sci.: Nano, 2014, 1, 338–346 RSC.
- K. Newman, C. Metcalfe, J. Martin, H. Hintelmann, P. Shaw and A. Donard, J. Anal. At. Spectrom., 2016, 31, 2069–2077 RSC.
- P. Shaw and A. Donard, J. Anal. At. Spectrom., 2016, 31, 1234–1242 RSC.
- R. P. Lamsal, A. Hineman, C. Stephan, S. Tahmasebi, S. Baranton, C. Coutanceau, G. Jerkiewicz and D. Beauchemin, Anal. Chim. Acta, 2020, 1139, 36–41 CrossRef CAS PubMed.
- M. D. Montaño, B. J. Majestic, Å. K. Jämting, P. Westerhoff and J. F. Ranville, Anal. Chem., 2016, 88, 4733–4741 CrossRef PubMed.
- I. Kálomista, A. Kéri, D. Ungor, E. Csapó, I. Dékány, T. Prohaska and G. Galbács, J. Anal. At. Spectrom., 2017, 32, 2455–2462 RSC.
- A. Kéri, I. Kálomista, D. Ungor, Á. Bélteki, E. Csapó, I. Dékány, T. Prohaska and G. Galbács, Talanta, 2018, 179, 193–199 CrossRef PubMed.
- Y. J. Lee, E.-Y. Ahn and Y. Park, Nanoscale Res. Lett., 2019, 14, 129 CrossRef PubMed.
- K. P. Steckiewicz, E. Barcinska, A. Malankowska, A. Zauszkiewicz-Pawlak, G. Nowaczyk, A. Zaleska-Medynska and I. Inkielewicz-Stepniak, J. Mater. Sci.: Mater. Med., 2019, 30, 22 CrossRef PubMed.
- X. Liu, B. Sui and J. Sun, J. Mater. Chem. B, 2017, 5, 9558–9570 RSC.
- E. Bolea-Fernandez, A. Rua-Ibarz, M. Velimirovic, K. Tirez and F. Vanhaecke, J. Anal. At. Spectrom., 2020, 35, 455–460 RSC.
- Z. Liu, Y. Zhu, S. Lv, Y. Shi, S. Dong, D. Yan, X. Zhu, R. Peng, A. A. Keller and Y. Huang, Environ. Sci. Technol. Lett., 2021, 9, 50–56 CrossRef.
- R. Gonzalez de Vega, S. Goyen, T. E. Lockwood, P. A. Doble, E. F. Camp and D. Clases, Anal. Chim. Acta, 2021, 1174, 338737 CrossRef CAS.
- D. Mozhayeva and C. Engelhard, J. Anal. At. Spectrom., 2019, 34, 1571–1580 RSC.
- A. M. Duffin, E. D. Hoegg, R. I. Sumner, T. Cell, G. C. Eiden and L. S. Wood, J. Anal. At. Spectrom., 2021, 36, 133–141 RSC.
- J. Tuoriniemi, G. Cornelis and M. Hassellöv, J. Anal. At. Spectrom., 2015, 30, 1723–1729 RSC.
- S. Meyer, R. Gonzalez de Vega, X. Xu, Z. Du, P. A. Doble and D. Clases, Anal. Chem., 2020, 92, 15007–15016 CrossRef CAS PubMed.
- I. I. Stewart and J. W. Olesik, J. Am. Soc. Mass Spectrom., 1999, 10, 159–174 CrossRef CAS PubMed.
- J. W. Olesik and P. J. Gray, J. Anal. At. Spectrom., 2012, 27, 1143–1155 RSC.
- D. Mozhayeva, I. Strenge and C. Engelhard, Anal. Chem., 2017, 89, 7152–7159 CrossRef CAS PubMed.
- I. Strenge and C. Engelhard, J. Anal. At. Spectrom., 2020, 35, 84–99 RSC.
Footnotes |
| † This article is part of a JAAS themed collection dedicated to Prof. Ramon Barnes. |
| ‡ Electronic supplementary information (ESI) available. See DOI: https://doi.org/10.1039/d3ja00373f |
| This journal is © The Royal Society of Chemistry 2024 |

