 Open Access Article
Creative Commons Attribution 3.0 Unported Licence
Optimising the electrochemical reduction of CO2 to oxalic acid in propylene carbonate†
Halilu
Sale
ab,
Gangi Reddy
Ubbara
a and
Mark D.
Symes
 *a
*a
aWestCHEM, School of Chemistry, University of Glasgow, G12 8QQ Glasgow, UK. E-mail: mark.symes@glasgow.ac.uk
bEnergy Commission of Nigeria, Plot 701c, Garki-Abuja, Nigeria
First published on 6th September 2023
Abstract
Carbon dioxide (captured from the atmosphere or obtained by other routes) constitutes a useful and widely available building block for producing numerous valuable chemicals and fuels. Electrochemical methods for carbon dioxide reduction offer advantages in terms of scalability, the prospect of coupling directly to renewable power sources and the ability to reduce carbon dioxide without the co-production of harmful by-products. Of the various possible products of carbon dioxide electroreduction, oxalate/oxalic acid is an especially attractive target because of its wide use in many chemical and pharmaceutical processes. Herein, we report the results of a study on carbon dioxide electroreduction to oxalate/oxalic acid in a propylene carbonate solvent system, catalysed by the addition of benzonitrile. Our results show that the use of benzonitrile as a homogeneous electrocatalyst improves the faradaic and reaction yields of oxalate/oxalic acid production, as well as the area-normalised rate of formation of oxalate/oxalic acid, giving a new record rate of formation of 1.65 ± 0.35 mM cm−2 h−1 (averaged over 1 h) at a voltage of –2.7 V vs. SCE (–2.46 V vs. SHE). Such metrics in turn suggest that the electrochemical reduction of carbon dioxide to C2+ products via oxalate could be a promising avenue for further development for the sustainable production of key chemical feedstocks.
Introduction
Carbon dioxide emissions from the combustion of fossil fuels are amongst the major contributors to climate change, which has significant environmental impacts.1–3 However, atmospheric CO2 is a significant potential feedstock for producing synthetic fuels and other valuable chemicals.4–6 Amongst the more promising approaches to the conversion of CO2 to fuels and other useful small molecules, electrochemical routes offer advantages such as applicability across a wide range of scales, the potential to couple directly to renewably generated power, and the ability to reduce CO2 concomitant with the production of benign anode products (especially oxygen), instead of generating harmful waste.7,8To date, numerous systems for the electrochemical reduction of CO2 have been reported, operating in both aqueous and non-aqueous electrolytes.9,10 Depending on the reaction conditions (and especially on the nature of the cathode), typical reaction products include CO and formic acid/formate,11–13 with more reduced and longer-chain carbon products reported less frequently.14 In the latter cases, multi-carbon products are often produced as mixtures whose components can be hard to separate.15 Moreover, in aqueous solvents in particular, competing hydrogen production via the electroreduction of protons or water is often a major side reaction that erodes the efficiency of CO2 reduction.16,17 Achieving high selectivity for individual products from CO2 electroreduction reactions is therefore a critical goal for any potentially scalable electrochemical carbon dioxide reduction process.18–20 A wide range of potential products have been observed from the electroreduction of CO2 in liquid electrolytes. Of these various products, oxalic acid (C2H2O4) is of interest because of its wide use in pharmaceuticals, metallurgical industries, photography, cleaning products, the food industry, bleaching agents and as an analytical reagent.21–24
One strategy to minimise hydrogen evolution during electrochemical CO2 reduction is to employ non-aqueous solvents. Although different reaction mechanisms have been proposed, initial electroreduction of carbon dioxide in non-aqueous solvents is generally agreed to proceed via a single-electron reduction as in eqn (1):25
| CO2 + e− → CO2−˙ | (1) |
This first step is the rate-determining step of the process. In an aqueous medium, most flat metallic cathodes yield carbon monoxide and/or formic acid viaeqn (2) and (3).26,27 Conversely, in non-aqueous media, the radical anion generated in eqn (1) may undergo a reaction with a further CO2 molecule to form −OOC–COO˙ (ads) (eqn (4)), followed by a second reduction to give oxalate (eqn (5)):
 | (2) |
 | (3) |
 | (4) |
 | (5) |
According to Eggins et al.,28 upon further electrolysis, oxalic acid can be reduced by two electrons to give glyoxylic acid, which can itself be reduced by another two electrons to give glycolic acid as shown in eqn (6) and (7) respectively:
| C2H2O4 + 2H+ + 2e− → C2H2O3 + H2O | (6) |
| C2H2O3 + 2H+ + 2e− → C2H4O3 | (7) |
Previous studies examining the electroreduction of carbon dioxide to oxalate and oxalic acid are summarised in Table 1. These previous studies generally suffer from rather low current densities (<10 mA cm−2) and rates of formation of oxalic acid below 0.2 mM cm−2 h−1, both of which metrics could pose challenges for the potential economic viability of electrochemical CO2 reduction to oxalate at scale. Moreover, there are conflicting reports as to the extent of side-reactions: Garcia et al. suggest that glyoxylic acid can be produced directly by electrochemically reducing CO2 on glassy carbon and mercury electrodes, but that glycolic acid is the main side-product when using a lead cathode,29 whereas Boor et al.30 find that both glyoxylic acid and glycolic acid can be obtained directly by electrochemical reduction of CO2 on a lead electrode. Marx et al.31 recently re-examined electrochemical reduction of CO2 to oxalate and oxalic acid with first-row transition metal complexes and concluded that a number of previously-published reports are irreproducible, containing insufficient experimental and analytical detail.
| # | Applied potential (V vs. SHE) | Catholyte | Electrode | Catalyst (mM) | Average current density (mA cm−2) | Average faradaic efficiency of notable products (%) | Formation rate (mM cm−2 h−1) | Ref. |
|---|---|---|---|---|---|---|---|---|
| 1 | −2.40 | (CH3)4NClO4/propylene carbonate | Pb | No catalyst | Not reported | Oxalic acid (73.3) | Not reported | 37 |
| Glyoxylic acid (3.4) | ||||||||
| Formic acid (2.2) | ||||||||
| Carbon monoxide (11.0) | ||||||||
| 2 | −2.40 | (CH3)4NClO4/propylene carbonate | In | No catalyst | Not reported | Oxalic acid (0.1) | Not reported | 37 |
| Formic acid (1.3) | ||||||||
| Carbon monoxide (85.3) | ||||||||
| 3 | −1.80 to −2.80 | (CH3)4NCl/dimethylformamide | High-alloy steel | No catalyst | 5 | Oxalic acid (76) | Not reported | 38 |
| 4 | −2.50 | C8H2OClNO4/propylene carbonate | Pb | No catalyst | 5.1 | Oxalic acid (10) | Not reported | 38 |
| 5 | −1.80 to −2.80 | C8H2ONF/acetic anhydride | High-alloy steel | No catalyst | 5.1 | Oxalic acid (0.1) | Not reported | 38 |
| 6 | −2.80 to −3.80 | (CH3)4NCl/γ-butyrolactone | High-alloy steel | No catalyst | 5 | Oxalic acid (50) | Not reported | 38 |
| 7 | –1.96 | n-Bu4NClO4/N,N-dimethylformamide | Hg | 1.63 mM C6H5COOCH3 | 1.6 | Oxalic acid (84) | Not reported | 33 |
| 8 | –2.02 | n-Bu4NClO4/N,N-dimethylformamide | Hg | 2.1 mM C6H5CN | 1.6 | Oxalic acid (80) | Not reported | 33 |
| 9 | –2.20 | (C2H5)4N(ClO4)/acetonitrile | Pb | No catalyst | 1.92 | Oxalic acid (<80) | Oxalic acid (0.0065) | 39 |
| 10 | –2.40 | (C2H5)4N(BF4)/acetonitrile | Pb | No catalyst | 5.967 | Oxalic acid (13) | Oxalic acid (0.1113) | 40 |
| 11 | –2.40 | C16H36F6NP/acetonitrile | Pb | No catalyst | 0.423 | Oxalic acid (3) | Oxalic acid (0.00011) | 40 |
| 12 | –2.40 | [(C2H5)4N(C11H16O3Si)]/acetonitrile | Pb | No catalyst | 9.03 | Oxalic acid (86) | Oxalic acid (0.1684) | 40 |
| 13 | –2.50 | (CH3)4NCl/propylene carbonate | Pb | No catalyst | 14.0 | Oxalic acid (60) | Oxalic acid (0.7) | 30 |
| Glyoxylic acid (3.2) | ||||||||
| Glycolic acid (6.3) | ||||||||
| Formic acid (13.8) | ||||||||
| 14 | –2.46 | (CH3)4NCl/propylene carbonate | Pb | No catalyst | 13.7 | Oxalic acid (59.6) | Oxalic acid (1.32) | This work |
| Glyoxylic acid (8.2) | Glyoxylic acid (0.14) | |||||||
| Glycolic acid (9.2) | Glycolic acid (0.15) | |||||||
| 15 | –2.46 | (CH3)4NCl/propylene carbonate | Pb | C6H5CN | 16.9 | Oxalic acid (72.4) | Oxalic acid (1.65) | This work |
| Glyoxylic acid (9.4) | Glyoxylic acid (0.17) | |||||||
| Glycolic acid (10.8) | Glycolic acid (0.20) |
Furthermore, various benzonitriles and alkyl/phenyl benzoates have been employed previously as homogeneous catalysts for the electrochemical reduction of CO2 in non-aqueous aprotic solvents (e.g. dimethylformamide), generating oxalate as the overwhelmingly dominant product (see Table 1, entries 7 and 8).32,33 The proposed mechanism of this catalytic reaction involves the initial formation of the relatively stable C7H5N−˙ anion radical through a one electron reduction process. This radical then reacts with CO2 in solution to form CO2−˙ which in turn undergoes dimerization to form oxalates, as summarised in eqn (8)–(10):32
| C7H5N + e− ⇌ C7H5N−˙ | (8) |
| C7H5N−˙ + CO2 ⇌ C7H5N + CO2−˙ | (9) |
| 2CO2−˙ → C2O42− | (10) |
However, dimethylformamide is toxic and its use will soon be severely restricted in many countries,34 with N-methyl-2-pyrrolidone/ethyl acetate mixtures35 and propylene carbonate having been proposed as lower-toxicity replacements.36 In this context, it is noteworthy that by far the highest current densities and rates of formation of oxalic acid to date by CO2 electroreduction were reported by Boor et al.30 (Table 1, entry 13) in a (CH3)4NCl/propylene carbonate solvent system at a lead cathode. We therefore hypothesised that yet higher current densities and rates of formation of oxalate could be obtained if soluble electrocatalysts such as benzonitrile were employed at a lead cathode in a (CH3)4NCl/propylene carbonate solvent system.
Herein, we report a study along these lines, performed in propylene carbonate at room temperature in a simple H-cell configuration. Our results validate our hypothesis and show an improved current density of nearly 17 mA cm−2 and a faradaic yield for oxalate of 72%, giving a new record area-normalised rate of oxalate formation of 1.65 mM cm−2 h−1.
Experimental section
Materials
The following materials were obtained from their respective suppliers and used without further purification: anhydrous propylene carbonate (C4H6O3, Sigma-Aldrich, 99.7%), tetraethylammonium chloride (C8H20ClN, Sigma-Aldrich, 99.0%), sulfuric acid (H2SO4, Fisher Chemical, 95.0%), lead wire (Pb, Alfa Aesar, 1.0 mm diameter, 99.99% metals basis), lead rod (Pb, Alfa Aesar, 5 mm diameter, 99.99% metals basis), platinum wire (Pt, Alfa Aesar, 1.0 mm diameter, 99.99%), platinum foil (Pt, Alfa Aesar, 0.25 mm, 99.99% metals basis), anhydrous benzonitrile, (C7H5N, Sigma-Aldrich, 99%), Nafion membrane (Nafion-117, manufactured by Fuel Cell Store). Argon and CO2 were supplied by BOC (99.99%).Cyclic voltammetry (CV)
The cyclic voltammetry measurements were performed at 25 °C in single cells, using a Pb wire working electrode (area = 0.64 cm2), a saturated calomel reference electrode (SCE) and a Pt wire counter electrode. After setting up the cell as depicted in Fig. S1 in the ESI,† the electrolyte was purged with argon (Ar) for 20 minutes to remove any dissolved oxygen before running the cyclic voltammetry measurements using a CHI potentiostat. This control experiment was followed by purging with CO2 for another 20 minutes before another reading was taken to note the difference in the cyclic voltammograms resulting from a CO2-saturated atmosphere. To evaluate the influence of benzonitrile on CO2 reduction in the organic solvent, 2 mM benzonitrile was added to the electrolytic solution and further purged with CO2 for another 20 minutes. Cyclic voltammetry was then performed. Concentrations of benzonitrile of 1 mM, 2 mM, 4 mM, 6 mM, 8 mM and 10 mM were probed; however, only very modest changes were observed in the voltammograms when the quantity of benzonitrile was increased beyond 2 mM (see ESI, Fig. S2†), and so 2 mM concentrations were employed throughout the results presented below.Chronoamperometry
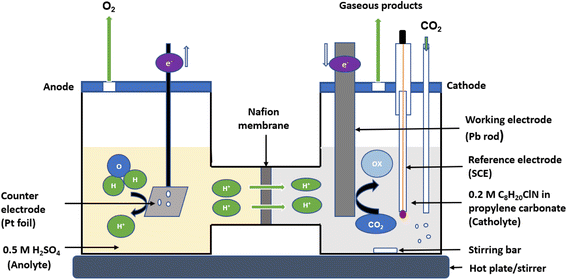
Chronoamperometric experiments (bulk electrolysis) were performed using a CHI potentiostat in a H-cell having two compartments for the anolyte and catholyte separated by a Nafion 117 membrane as shown in Fig. 1. The working electrode for bulk electrolysis (Pb rod, surface area = 3.5 cm2) and reference electrode (SCE) were placed in the catholyte (0.2 M tetraethylammonium chloride in propylene carbonate) while the counter electrode (platinum foil) was placed in the anolyte (0.5 M H2SO4). Bulk electrolysis was conducted at 25 °C for 5 h. To compare the outcome with the previously reported findings made with different reference electrodes, the potentials measured against SCE in this work were converted to the standard hydrogen electrode (SHE) scale using the equation E(SHE) = E(calomel) + E(SHE–calomel),41 while the potentials reported in other similar research against Ag/AgCl and other reference electrodes were also converted to SHE accordingly.41,42
Fig. 1 shows the configuration of the H-cell setup. Prior to each experiment, the Pb electrode was polished with sandpaper followed by sonicating in acetone for about 10 minutes, then rinsed with anhydrous propylene carbonate and dried under argon to remove any film of lead oxide impurities or moisture on the surface. The working electrode with a total surface area of 3.5 cm2 was immersed in 40 mL of the catholyte while the counter electrode having a total surface area of 4 cm2 was immersed in 40 mL of the anolyte solution. The cathodic compartment was then purged with Ar for 20 minutes to remove any dissolved oxygen, followed by purging with CO2 for additional 20 minutes to saturate the electrolyte with CO2 before commencing the chronoamperometric measurements under a constant supply of CO2. Chronoamperometry was carried out in a closed cell at a range of applied potentials for 5 hours at each potential, starting from −2.2 V and ranging to −2.7 V (vs. SCE) for both (1) 0.2 M tetraethylammonium chloride in propylene carbonate and (2) 0.2 M tetraethylammonium chloride in propylene carbonate with 2 mM benzonitrile. During the electrolysis, samples of the electrolyte solution were taken every hour for analysis of the products. The products were analysed by high-performance liquid chromatography (HPLC) using an Aminex HPX-87H, 300 mm × 7.8 mm column and an example chromatogram showing the peak intensity for a catalysed and uncatalysed sample at an applied potential of −2.2 (V vs. SCE) is depicted in Fig. S3 (ESI).† The mobile phase used was 0.1% formic acid in HPLC grade acetonitrile and 0.1% formic acid in water in a ratio of 30![[thin space (1/6-em)]](https://www.rsc.org/images/entities/char_2009.gif) :
:![[thin space (1/6-em)]](https://www.rsc.org/images/entities/char_2009.gif) 70 respectively. The HPLC machine was set at a flow rate of 0.6 mL min−1, at a temperature of 55 °C, and a detector wavelength of 210–230 nm. Standard calibration curves were developed to determine the concentration of the main products (oxalic, glyoxylic, and glycolic acids) produced in the unknown samples. These calibration curves are shown in Fig. S4 (ESI).†
70 respectively. The HPLC machine was set at a flow rate of 0.6 mL min−1, at a temperature of 55 °C, and a detector wavelength of 210–230 nm. Standard calibration curves were developed to determine the concentration of the main products (oxalic, glyoxylic, and glycolic acids) produced in the unknown samples. These calibration curves are shown in Fig. S4 (ESI).†
Results and discussion
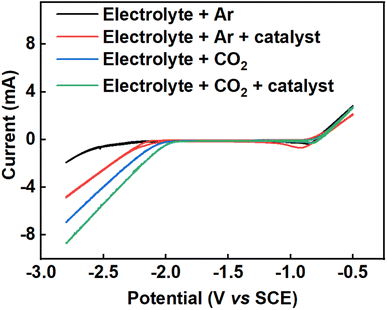
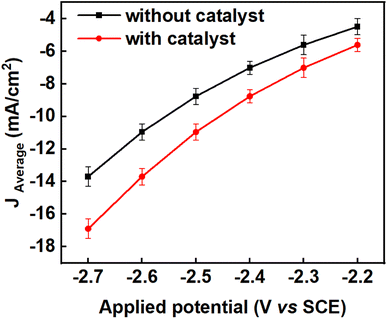
Fig. 2 shows cyclic voltammograms of the Pb electrode taken in Ar and CO2-saturated electrolyte between −0.5 V and −2.8 V (vs. SCE) at a sweep rate of 50 mV s−1. The cyclic voltammograms were taken under four different conditions: (i) 0.2 M tetraethylammonium chloride in propylene carbonate under argon (black line), (ii) 0.2 M tetraethylammonium chloride in propylene carbonate with 2 mM benzonitrile under argon (red line), (iii) 0.2 M tetraethylammonium chloride in propylene carbonate under CO2 (blue line) and (iv) 0.2 M tetraethylammonium chloride in propylene carbonate with 2 mM benzonitrile under CO2 (green line). The cyclic voltammograms in Fig. 2 show that there is increased current density at a given potential under CO2 compared to Ar, and also that the addition of benzonitrile to the cell results in a further increase in the current density. Together, these results suggested that CO2 reduction was occurring when CO2 was present, and that benzonitrile could be catalysing this reaction.To determine if CO2 reduction was occurring and what the products of this reaction might be, six constant potentials (ranging from −2.2 V to −2.7 V versus SCE) were applied by bulk electrolysis for 5 hours in each case. The current densities were evaluated with respect to the surface area of the working electrodes immersed in the electrolytic solution (mA cm−2). The experiments were repeated three times for the same duration at each of the applied potentials for reproducibility and to establish the error margins from the mean values of the current density, faradaic efficiency and yield of the products. Error bars were calculated from standard deviations from the mean value of each parameter. The average current densities obtained from the triplicate experiments together with their error bars across all the applied potentials are depicted in Fig. 3 and the corresponding values are tabulated in Table S1 in the ESI.†
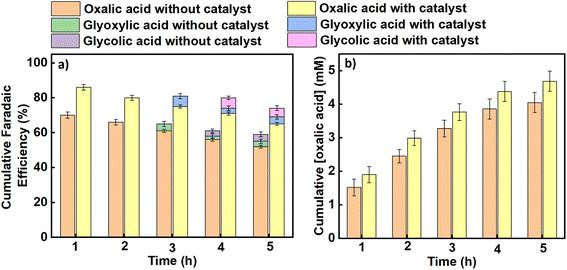
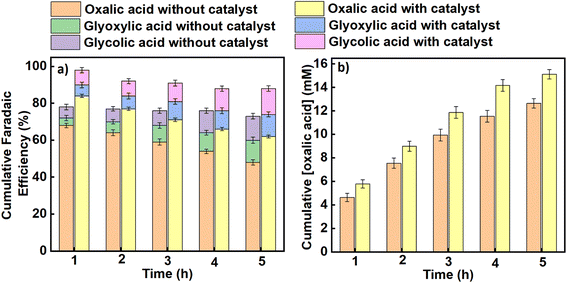
Similarly, average faradaic efficiencies alongside oxalic acid concentrations obtained at each applied potential are graphically indicated in Fig. 4 (for an applied potential of –2.2 V vs. SCE) and Fig. 5 (for an applied potential of –2.7 V vs. SCE), with data for the intermediate potentials of –2.3, –2.4, –2.5 and –2.6 V vs. SCE shown in the ESI (Figures S5–S8).† The average faradaic efficiency of oxalic acid and the detectable by-products at each potential is also shown in Table S2 (ESI).† In all cases, the balance is assumed to be due to competing hydrogen evolution. The faradaic efficiency towards oxalic acid generally increases with an increase in the magnitude of the applied potential until it reaches its maximum value at −2.5 V vs. SCE (−2.26 V vs. SHE), after which the faradaic efficiencies were observed to start declining for both the catalysed and uncatalysed reactions (Table S2†). Pickett and Yap43 reported that for a given charge passed during electrolysis, greater current efficiencies are observed at more negative potentials (up to a certain point) and lower temperatures. Regarding the declining faradaic efficiency when the voltage becomes more negative, Goodridge et al.44 attributed that to competing hydrogen evolution which erodes the faradaic efficiency for oxalate production. This finding is in agreement with research conducted by Yang et al. (Table 1, entries 10–12),40 which suggests that hydrogen evolution consumes an increasing proportion of the charge as the applied potentials become more negative, and is in agreement with our own data as presented here. On the other hand, the faradaic efficiency towards oxalic acid decreases with reaction time across all the applied potentials as shown in Fig. 4, 5 and S5–S8† (although it should be noted that oxalic acid continues to be made throughout the experiment). This phenomenon can be attributed to two factors. Firstly, at longer reaction times, some of the oxalic acid produced is converted to secondary products. Secondly, the water content of the catholyte will gradually increase over time due to electro-osmotic drag of water from the aqueous anolyte solution into the cathode side of the cell, and this in turn will lead to an increased rate of the competing hydrogen evolution reactions.30,45 Hence, the trends in faradaic efficiency with potential and reaction time observed in this work are in agreement with previous literature reports for this process.
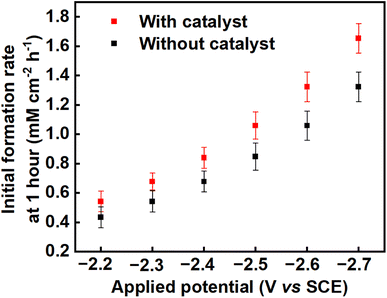
The average product concentrations for the various carboxylic acids obtained across all the applied potentials are shown in Table S3,† as well as being shown in Fig. 4b, 5b and S5–S8.† As detected, the main solution-phase products were oxalic, glyoxylic, and glycolic acids. In all cases, the use of benzonitrile as a catalyst improves the yields of oxalate/oxalic acid, with slight increases also in the yields of glyoxylic and glycolic acids (see Fig. S9, ESI†). The initial formation rate of oxalate/oxalic acid obtained at a potential of −2.70 V versus SCE at 25 °C as a function of electrode area is 1.32 mM cm−2 h−1 and 1.65 mM cm−2 h−1 in an uncatalysed and catalysed medium respectively (see the last entry of Table 1 and Fig. 6). Comparatively, the formation rate of 1.65 mM cm−2 h−1 recorded in this research under optimal conditions (−2.70 V versus SCE at 25 °C with catalyst over the first hour of electrolysis), is an improvement on the highest reported value of 0.70 mM cm−2 h−1 reported by Boor et al.,30 under similar conditions over 5 h but using a slightly more negative applied potential of −2.70 V versus Ag/AgCl (−2.75 V versus SCE). Averaged over 5 h, the rate of formation of oxalate/oxalic acid in the uncatalysed system in our case was 0.72 mM cm−2 h−1 in good agreement with Boor et al. The highest formation rates across the range of applied potentials (−2.2 V to −2.7 V vs. SCE) were recorded after 1 hour of the electrolysis, and these initial formation rates for catalysed and uncatalysed systems are depicted in Fig. 6.
Conclusion
Herein, we have explored the electrochemical reduction of carbon dioxide in propylene carbonate electrolyte on a Pb cathode, both in the presence and absence of benzonitrile as a homogeneous catalyst. Our results in the absence of catalyst are in excellent agreement with those reported previously by Boor et al.,30 also obtained on a Pb cathode in propylene carbonate. Our work therefore validates this previous result and suggests that these conditions can give reproducible carbon dioxide reduction, in terms of current densities, product distributions and rates of product formation. This finding will be useful to others interested in electrochemical carbon dioxide reduction who are looking for reliable model reactions.The use of benzonitrile as a homogeneous electrocatalyst was found to improve the faradaic and reaction yields to produce oxalate/oxalic acid, as well as its rate of formation (and to a lesser extent these metrics were also enhanced for the by-products glyoxylic acid and glycolic acid). These increases in faradaic yield were apparently obtained at the expense of the competing hydrogen evolution reaction. A new record rate of formation of oxalate/oxalic acid of 1.65 ± 0.35 mM cm−2 h−1 was obtained at a voltage of –2.7 V vs. SCE (–2.46 V vs. SHE) using a benzonitrile electrocatalyst, at which potential a current density of nearly 17 mA cm−2 could be obtained, delivering oxalate with a faradaic yield of 72%. All of these metrics are amongst the highest recorded to date for this transformation, suggesting that the electrochemical reduction of carbon dioxide to C2+ products via oxalate could be a promising avenue for further development.
Data availability
The data underpinning this study have been deposited in the University of Glasgow's Enlighten database under accession code http://dx.doi.org/10.5525/gla.researchdata.1497.Author contributions
Halilu Sale: methodology, data curation, investigation. Gangi R. Ubbara: methodology. Mark D. Symes: conceptualization, supervision, writing – review & editing.Conflicts of interest
The authors declare no conflicts of interest.Acknowledgements
This work was supported by the EPSRC (EP/W033135/1). HS thanks his sponsor (the Petroleum Technology Development Fund, Nigeria for funding his studies (PTDF/ED/OSS/PHD/HA/1638/19). MDS thanks the Royal Society for a University Research Fellowship (URF\R\211007).References
- K. Jiang, Y. Men, R. Xing, B. Fu, G. Shen, B. Li and S. Tao, Environ. Sci. Technol., 2023, 57, 2506–2515, DOI:10.1021/acs.est.2c08958.
- V. Ballal, O. Cavalett, F. Cherubini and M. D. B. Watanabe, Fuel, 2023, 338, 127316, DOI:10.1016/j.fuel.2022.127316.
- K. B. Keerthana, S. Wu, M. Wu and T. Kokulnathan, Sustainability, 2023, 15, 7932, DOI:10.3390/su15107932.
- K. Zhi, Z. Li, B. Wang, J. J. Klemeš and L. Guo, Process Saf. Environ. Prot., 2023, 172, 681–699, DOI:10.1016/j.psep.2023.02.046.
- M. M. Sarafraz, F. C. Christo, N. N. Tran, L. Fulcheri and V. Hessel, Int. J. Hydrogen Energy, 2023, 48, 6174–6191, DOI:10.1016/j.ijhydene.2022.05.272.
- T. Kumar and S. Eswari J, Energy Fuels, 2023, 37, 3570–3589, DOI:10.1021/acs.energyfuels.2c04122.
- M. König, J. Vaes, E. Klemm and D. Pant, iScience, 2019, 19, 135–160, DOI:10.1016/j.isci.2019.07.014.
- N. S. Spinner, J. A. Vega and W. E. Mustain, Catal. Sci. Technol., 2012, 2, 19–28, 10.1039/C1CY00314C.
- I. A. Novoselova, S. V Kuleshov and A. A. Omel'chuk, Advances in Science, Technology and Innovation, Springer Nature, 2022, pp. 113–136, DOI:10.1007/978-3-030-72877-9_6.
- A. R. Paris and A. B. Bocarsly, ACS Catal., 2019, 9, 2324–2333, DOI:10.1021/acscatal.8b04327.
- J. S. Yoo, R. Christensen, T. Vegge, J. K. Nørskov and F. Studt, ChemSusChem, 2016, 9, 358–363, DOI:10.1002/cssc.201501197.
- J. T. Feaster, C. Shi, E. R. Cave, T. Hatsukade, D. N. Abram, K. P. Kuhl, C. Hahn, J. K. Nørskov and T. F. Jaramillo, ACS Catal., 2017, 7, 4822–4827, DOI:10.1021/acscatal.7b00687.
- P. Duarah, D. Haldar, V. S. K. Yadav and M. K. Purkait, J. Environ. Chem. Eng., 2021, 9, 106394, DOI:10.1016/j.jece.2021.106394.
- S. D. Rihm, M. K. Kovalev, A. A. Lapkin, J. W. Ager and M. Kraft, Energy Environ. Sci., 2023, 16, 1697–1710, 10.1039/d2ee03752a.
- C. Ampelli, C. Genovese, D. Cosio, S. Perathoner and G. Centi, Chem. Eng. Trans., 2019, 74, 1285–1290, DOI:10.3303/CET1974215.
- S. E. Jerng and B. M. Gallant, iScience, 2022, 25, 104558, DOI:10.1016/j.isci.2022.104558.
- H. Ooka, M. C. Figueiredo and M. T. M. Koper, Langmuir, 2017, 33, 9307–9313, DOI:10.1021/acs.langmuir.7b00696.
- C. Chen, J. F. Khosrowabadi Kotyk and S. W. Sheehan, Chem, 2018, 4, 2571–2586, DOI:10.1016/j.chempr.2018.08.019.
- Y. Chen, L. Wang, Z. Yao, L. Hao, X. Tan, J. Masa, A. W. Robertson and Z. Sun, Acta Phys.-Chim. Sin., 2022, 38, 1–20, DOI:10.3866/PKU.WHXB202207024.
- K. Kang, M. Zhang, L. Yue, W. Chen, Y. Dai, K. Lin, K. Liu, J. Lv, Z. Guan and S. Xiao, Cells, 2023, 12, 771, DOI:10.3866/PKU.WHXB202006034.
- P. Santawaja, S. Kudo, A. Mori, A. Tahara, S. Asano and J. Hayashi, ACS Sustain. Chem. Eng., 2020, 8, 13292–13301, DOI:10.1021/acssuschemeng.0c03593.
- E. Schuler, M. Demetriou, N. R. Shiju and G. M. Gruter, ChemSusChem, 2021, 14, 3636–3664, DOI:10.1002/cssc.202101272.
- National Center for Biotechnology Information, PubChem Compound Summary for CID 971, Oxalic Acid, PubChem, https://pubchem.ncbi.nlm.nih.gov/compound/Oxalic-Acid, accessed 30 August, 2023 Search PubMed.
- Oxalic Acid Specific Uses, http://www.lubonchem.com/blog/?p=993, accessed 30 August, 2023 Search PubMed.
- R. P. S. Chaplin and A. A. Wragg, J. Appl. Electrochem., 2003, 33, 1107–1123, DOI:10.1023/B:JACH.0000004018.57792.b8.
- S. Kaneco, N. H. Hiei, Y. Xing, H. Katsumata, H. Ohnishi, T. Suzuki and K. Ohta, Electrochim. Acta, 2002, 48, 51–55, DOI:10.1016/S0013-4686(02)00550-9.
- M. Azuma, J. Electrochem. Soc., 1990, 137, 1772–1778, DOI:10.1149/1.2086796.
- B. R. Eggins, C. Ennis and J. T. S. Irvine, J. Appl. Electrochem., 1994, 24, 271–273, DOI:10.1007/BF00242896.
- A. C. Garcia, C. Sánchez-Martínez, I. Bakker and E. Goetheer, ACS Sustain. Chem. Eng., 2020, 8, 10454–10460, DOI:10.1021/acssuschemeng.0c02493.
- V. Boor, J. E. B. M. Frijns, E. Perez-Gallent, E. Giling, A. T. Laitinen, E. L. V. Goetheer, L. J. P. Van Den Broeke, R. Kortlever, W. De Jong, O. A. Moultos, T. J. H. Vlugt and M. Ramdin, Ind. Eng. Chem. Res., 2022, 61, 14837–14846, DOI:10.1021/acs.iecr.2c02647.
- M. Marx, H. Frauendorf, A. Spannenberg, H. Neumann and M. Beller, JACS Au, 2022, 2, 731–744, DOI:10.1021/jacsau.2c00005.
- G. Filardo, S. Gambino, G. Silvestri, A. Gennaro and E. Vianello, J. Electroanal. Chem., 1984, 177, 303–309, DOI:10.1016/0022-0728(84)80232-6.
- A. Gennaro, A. A. Isse, J. M. Savéant, M. G. Severin and E. Vianello, J. Am. Chem. Soc., 1996, 118, 7190–7196, DOI:10.1021/ja960605o.
- Commission Regulation (EU) 2021/2030 of 19 November 2021 amending Annex XVII to Regulation (EC) No. 1907/2006 of the European Parliament and of the Council concerning the Registration, Evaluation, Authorisation and Restriction of Chemicals (REACH) as regards N,N-dimethylformamide, http://data.europa.eu/eli/reg/2021/2030/oj, accessed 08 September 2023.
- V. Stancu, A. G. Tomulescu, L. N. Leonat, L. M. Balescu, A. C. Galca, V. Toma, C. Besleaga, S. Derbali and I. Pintilie, Coatings, 2023, 13, 378, DOI:10.3390/coatings13020378.
- H. L. Parker, J. Sherwood, A. J. Hunt and J. H. Clark, ACS Sustain. Chem. Eng., 2014, 2, 1739–1742, DOI:10.1021/sc5002287.
- S. Ikeda, T. Takagi and K. Ito, Bull. Chem. Soc. Jpn., 1987, 60, 2517–2522, DOI:10.1246/bcsj.60.2517.
- J. Fischer, T. Lehmann and E. Heitz, J. Appl. Electrochem., 1981, 11, 743–750, DOI:10.1007/BF00615179.
- L. Sun, G. K. Ramesha, P. V. Kamat and J. F. Brennecke, Langmuir, 2014, 30, 6302–6308, DOI:10.1021/la5009076.
- Y. Yang, H. Gao, J. Feng, S. Zeng, L. Liu, L. Liu, B. Ren, T. Li, S. Zhang and X. Zhang, ChemSusChem, 2020, 13, 4900–4905, DOI:10.1002/cssc.202001194.
- P. R. Roberge, Corrosion Engineering, McGraw-Hill Education, 2008, pp. 62–66 Search PubMed.
- V. V. Pavlishchuk and A. W. Addison, Inorg. Chim. Acta, 2000, 298, 97–102, DOI:10.1016/S0020-1693(99)00407-7.
- D. J. Pickett and K. S. Yap, J. Appl. Electrochem., 1974, 4, 17–23, DOI:10.1007/BF00615902.
- F. Goodridge, K. Lister, R. E. Plimley and K. Scott, J. Appl. Electrochem., 1980, 10, 55–60, DOI:10.1007/BF00937338.
- S. Subramanian, K. R. Athira, M. A. Kulandainathan, S. S. Kumar and R. C. Barik, J. CO2 Util., 2020, 36, 105–115, DOI:10.1016/j.jcou.2019.10.011.
Footnote |
| † Electronic supplementary information (ESI) available. See DOI: https://doi.org/10.1039/d3se00652b |
| This journal is © The Royal Society of Chemistry 2023 |

