 Open Access Article
High pressure behaviour of the organic semiconductor salt (TTF-BTD)2I3†
Fabio
Montisci‡
a,
Arianna
Lanza§
 a,
Martin
Fisch
a,
Camille
Sonneville
b,
Yan
Geng¶
a,
Martin
Fisch
a,
Camille
Sonneville
b,
Yan
Geng¶
 a,
Silvio
Decurtins
a,
Christian
Reber
a,
Silvio
Decurtins
a,
Christian
Reber
 b,
Shi-Xia
Liu
 *a and
Piero
Macchi
 *ac
*ac
aDepartment of Chemistry, Biochemistry and Pharmaceutical Sciences, University of Bern, Freiestrasse 3, 3012 Bern, Switzerland. E-mail: shi-xia.liu@unibe.ch
bDépartement de chimie, Université de Montréal, Montréal, QC H3C 3J7, Canada
cDipartimento di Chimica, Materiali e Ingegneria Chimica “Giulio Natta”, Politecnico di Milano, Via Mancinelli 7, I-20131 Milan, Italy. E-mail: piero.macchi@polimi.it
First published on 1st November 2023
Abstract
This study focuses on the effect of structure compression and cooling on the stereoelectronic properties of the planar π-conjugated TTF-BTD (TTF = tetrathiafulvalene; BTD = 2,1,3-benzothiadiazole) molecule, a prototypical example in which an electron-donor moiety is compactly annulated to an electron-acceptor moiety. Its partially oxidised iodine salt (TTF-BTD)2I3 is a crystalline semiconductor featuring segregated columns of TTF+0.5 units stacked via alternating short and long π–π interactions. We studied TTF-BTD at temperatures ranging from 300 K to 90 K and at pressures up to 7.5 GPa, using both X-ray diffraction and Raman spectroscopy to determine the properties of the compressed samples. Periodic DFT calculations and several theoretical tools were employed to characterize the calculated structural modifications and to predict the structural changes up to 60 GPa. The existence of an unprecedented new phase is predicted above 20 GPa, following a covalent bond formation between two neighbouring TTF-BTD units.
Introduction
The past few decades have witnessed great progress in the development of molecular conductive materials. Thereby, it has emerged that the vast architectural flexibility of molecules possessing a highly delocalized π-electron system, and the enormous diversity of their crystal structures, allow tuning the electrical conductivity of these materials from semiconducting to metallic or even to a superconducting regime.1–9 Very early on in the development of molecular organic conductors, tetrathiafulvalene (TTF) assumed a key role as an electron donor (D) building block in crystal engineering, as illustrated by the charge-transfer salt TTF–TCNQ (TCNQ = tetracyano-p-quinodimethane) which forms a highly conducting complex,10 or by the conductive salt α-(BEDT-TTF)2I3 (BEDT-TTF = bis(ethylenedithio)tetrathiafulvalene).11 Generally, (BEDT-TTF)2I3 is known to have the most diverse phases of crystal structures among BEDT-TTF salts, whereby the crystals comprise alternating cationic (BEDT-TTF)+ and anionic I3− layers.12 In the wake of these discoveries, preparative routes to many TTF derivatives have been reported,13–24 whereby the synthetic protocol for annulating electron acceptor (A) moieties compactly to TTF units stands out.25–28 Specifically, the electron acceptor benzothiadiazole (BTD)29 with its electron-deficient heterocyclic ring forms a planar and compactly fused electron donor–acceptor (D–A) dyad with TTF.30–32 However, it should not be disregarded that materials composed of molecular dyads with a spacer unit may also feature conductive properties. For example, TTF bridged by phenyl-vinylene to a perchlorotriphenylmethyl radical reveals semiconducting behaviour, though at high pressure (HP) only.33 Yet, having a planar and compactly fused molecular system can facilitate the manufacture of thin films for practical applications.34A neutral molecule, that some of us34,35 obtained by combining TTF and 2,1,3-benzothiadiazole (TTF-BTD), is one notable example of such planar π-conjugated D–A systems. The object of our experimental and computational study is its charge-transfer salt (TTF-BTD)2I3, obtained by iodine-induced partial oxidation.
(TTF-BTD)2I3 presents semiconductor behavior with a room temperature (RT) electrical conductivity of ∼2 S cm−1 and activation energies in the range of 150–100 meV.34 It crystallizes in the monoclinic C2/m space group, forming black shiny elongated plates. The planar TTF-BTD molecule lies across a mirror plane so that only half of it belongs to the asymmetric unit. Therefore, in the crystal structure, a TTF-BTD molecule formally bears a formal partial charge of +0.5 to counterbalance the negative charge of I3− (the anion also lies on an inversion center). In the crystal packing, the TTF-BTD molecules stack with alternating short and long distances between the average planes of the molecules (∼3.3 and ∼3.6 Å, respectively, at ambient pressure). Thus, a more physically consistent picture is that of one positive charge per tightly assembled TTF-BTD pair. Because one neutral and one cationic moiety cannot be unambiguously identified, either both forms are present but disordered in the structure, or the charge is genuinely delocalized over two identical molecules forming a radical cation. Judging from the atom–atom distances, the pairs are assembled only through non-covalent interactions and therefore we call them non-covalent pairs or π-dimers, and the corresponding structure is the non-covalent pair phase. However, the activated conductivity of the compound is consistent with an incipient dimerization of the structure and the presence of an unpaired electron per each (TTF-BTD)2 pair, which was shown to localize exclusively on the TTF units by a spin density distribution analysis.35
In the crystal, positive and negative moieties are segregated in columnar stacks. The TTF-BTD pillar extends along the crystallographic c* direction via π–π interactions, forming a ladder with a head-to-tail alternation so that the molecular dipole moments point towards each other and cancel out the polarization of the crystal, which in fact belongs to a non-polar space group. The large cavities between the stacks are filled by the linear I3− anions, parallel to the π-conjugated systems. The terminal iodine atoms display short contacts to the sulfur of the BTD moieties (∼3.5 Å). Other observable short contacts occur between one of the TTF sulfur atoms and the BTD nitrogen atom from the adjacent stack. Intra-stack S⋯S distances are close to the van der Waals distance for sulfur.
Topological analyses of the electron density distribution addressed S⋯S and C⋯C bond paths between each TTF-BTD unit, but the electron density properties are closer to those of closed-shell interactions (despite the presence of the delocalized unpaired electron suggesting that they are not exactly closed-shell moieties). A non-negligible electron delocalization was calculated between S atoms of adjacent molecules in the stacks (0.08 and 0.06 electron pairs for the shorter and longer interactions, respectively), while delocalization associated with the C⋯C interaction is smaller (0.03 electron pairs).35
DFT calculations of the magnetic properties performed on a cluster of molecules indicate that an antiferromagnetic ground state is more stable than a metallic one: the unpaired electrons on each (TTF-BTD)2 unit are coupled antiferromagnetically to form tetramers along the π stacks (J = −213 cm−1), while inter-stack interactions are negligible (<0.1 cm−1).35
(TTF-BTD)2I3 is a very promising starting point for electronic and/or structural modifications under non-ambient conditions. We therefore set out to investigate the system at temperatures between 300 K and 90 K and variable pressure (up to 7 GPa) using single-crystal X-ray diffraction (SCXRD) and powder X-ray diffraction (PXRD) experiments. Experimental data were complemented by periodic-DFT calculations of high-pressure (HP) structures (up to 60 GPa) and their analysis with different theoretical tools, including Fukui functions,36 semi-empirical potential forces,37 and topological analysis of the electron density in the frame of quantum theory of atoms in molecules (QTAIM).38
Experimental section
SCXRD at variable temperature
Crystals of (TTF-BTD)2I3 (obtained as described in Geng et al.)34 were selected and mounted on a glass needle with paratone oil, and their diffracted intensities were collected at 373, 323, 283, 173 and 90 K (see also ref. 34 and 35). The measurements were performed with an Oxford Diffraction SuperNova area-detector diffractometer using mirror optics monochromated Mo Kα radiation (λ = 0.71073 Å). The temperature was maintained constant with a Cryostream 700 by Oxford Cryosystems. The data reduction was carried out with CrysAlisPro,39 including corrections for Lorentz and polarization effects, and an absorption correction based on the SCALE3 ABSPACK multi-scan algorithm. The structure was solved by direct methods using SIR97,40 and least-squares refined with SHELXL-201341 using anisotropic thermal displacement parameters for all non-hydrogen atoms. Hydrogen atoms were assigned geometrically and refined with a riding model; to each hydrogen atom was assigned a fixed isotropic displacement parameter with a value equal to 1.2 Ueq of its parent atom. All crystals were found to be affected by twinning, and the intergrown twin domains being related by a 180° rotation about a*.SCXRD at variable pressure
Several SCXRD experiments were attempted at HP. Typically, a crystal of (TTF-BTD)2I3 was loaded in a Merrill–Bassett diamond-anvil cell (DAC)42 equipped with 0.5 mm Boehler diamond anvils43 and a steel gasket, pre-indented to 0.075–0.095 mm thickness and with a 0.20–0.25 mm hole diameter. A 4![[thin space (1/6-em)]](https://www.rsc.org/images/entities/char_2009.gif) :
:![[thin space (1/6-em)]](https://www.rsc.org/images/entities/char_2009.gif) 1 mixture of methanol and ethanol was used as pressure transmitting medium (PTM) and the pressure was calibrated with the ruby fluorescence method.44,45 The diffraction intensity measurements were carried out at RT with an Oxford Diffraction SuperNova area-detector diffractometer using mirror optics monochromated Mo Kα radiation (λ = 0.71073 Å). Attempts to index the diffraction patterns with CrysAlisPro39 showed the presence of multiple overlapping domains that could not be properly distinguished, indicating that the crystals fractured upon compression. Only in one case, at 2.4 GPa, it was possible to perform a data reduction; the quality of the measurement, however, did not allow us to extract reliable structural information besides the unit cell parameters.
1 mixture of methanol and ethanol was used as pressure transmitting medium (PTM) and the pressure was calibrated with the ruby fluorescence method.44,45 The diffraction intensity measurements were carried out at RT with an Oxford Diffraction SuperNova area-detector diffractometer using mirror optics monochromated Mo Kα radiation (λ = 0.71073 Å). Attempts to index the diffraction patterns with CrysAlisPro39 showed the presence of multiple overlapping domains that could not be properly distinguished, indicating that the crystals fractured upon compression. Only in one case, at 2.4 GPa, it was possible to perform a data reduction; the quality of the measurement, however, did not allow us to extract reliable structural information besides the unit cell parameters.
PXRD at variable pressure
To overcome the problems caused by the presence of multiple domains, a set of HP experiments was performed on a powder sample. The powder was loaded in a gas-driven Boehler type membrane-driven DAC equipped with 0.5 mm diamond anvils and a steel gasket pre-indented to ∼0.075 mm thickness with a 0.20 mm hole diameter. Quartz powder was added as an internal standard for pressure calibration46 and a 4![[thin space (1/6-em)]](https://www.rsc.org/images/entities/char_2009.gif) :
:![[thin space (1/6-em)]](https://www.rsc.org/images/entities/char_2009.gif) 1 mixture of methanol and ethanol was used as PTM. The experiment was performed at the X04SA Material Science Beamline at the Swiss Light Source, Paul Scherrer Institute, Villigen, Switzerland,47 using the Mythen II microstrip detector and a 16 keV focused beam. The pressure was increased in 0.3–1 GPa steps up to 7.5 GPa. Lattice parameters were refined from each pattern with Topas Academic48 and subsequently used to determine the equation of state and the strain tensor with EosFit7c.49
1 mixture of methanol and ethanol was used as PTM. The experiment was performed at the X04SA Material Science Beamline at the Swiss Light Source, Paul Scherrer Institute, Villigen, Switzerland,47 using the Mythen II microstrip detector and a 16 keV focused beam. The pressure was increased in 0.3–1 GPa steps up to 7.5 GPa. Lattice parameters were refined from each pattern with Topas Academic48 and subsequently used to determine the equation of state and the strain tensor with EosFit7c.49
Raman spectroscopy at variable pressure
Raman spectra were measured using a Renishaw InVia spectrometer coupled to an imaging microscope (Leica) with 785 nm excitation. All measurements were carried out at room temperature. Pressure was applied trough a diamond-anvil cell by High-Pressure Diamond Optics. Sample crystals were inserted into a 0.250 mm diameter hole in a 0.300 mm thick stainless-steel gasket with an outer diameter of 5 mm along with ruby, used for pressure calibration.44,45 Nujol oil was added as PTM.Periodic DFT calculations
Periodic DFT calculations were performed with the software CRYSTAL1750 using the hybrid functional B3LYP. The basis set pob-TZVP51 from the CRYSTAL library was employed for the S, N, C, and H atoms. Effective core potential pob-TZVP was used for the I atoms.52 London-type pairwise empirical correction to the energy, with a scaling factor of 0.5, was used to account for dispersion effects.53 The experimental XRD structure at ambient pressure (AP, i.e. 0.000101325 GPa) was used as a starting guess for a geometry optimization. The optimized structure was then used as a guess for the calculation of the next pressure point, and so on, iteratively. Calculations were performed at AP, 0.5, 1, 2, 5, 10, 15, 20, 30, 40, 50, and 60 GPa in the C2/m space group. Convergence with the pob-TZVP basis set could not be obtained for higher pressures. The formation of a genuine covalent bond between two TTF-BTD units was first observed for the calculations at 50 GPa, and this structure was then used to relax the pressure with geometry optimizations at 40, 30, 20, 10 GPa, and AP. Calculation of vibrational frequencies was performed for the structure at 50 GPa. An optimization in the P1 space group at the same pressure was also attempted, but it failed to converge. The band structure and density of states calculations were also performed for the optimized structures at AP, 50, and 60 GPa (Fig. S1–S3, ESI†). All the aforementioned calculations were performed assuming ferromagnetic coupling of the unpaired electrons; this approximation was adopted to reduce the computational cost, since an antiferromagnetic coupling would require more expensive supercell calculations. It is noteworthy, in fact, that the energy difference between ferromagnetic or antiferromagnetic structures is small and this typically implies only a little perturbation of the crystal geometry, while significantly affecting the magnetism. For example, PDFT calculations at ambient pressure predict volume differences well below 0.1% between ferro and antiferromagnetic coupling networks. Moreover, the experimental geometries have been determined above the Néel temperature (see ref. 35), therefore they cannot display structural distortions due to the magnetic ordering.Theoretical analysis
The topological analysis of the electron density through QTAIM was performed with the software TOPOND14.54,55 Semi-empirical potential energies and forces were calculated with the routine described in Montisci et al.37 up to 40 GPa (Fig. S4, ESI†). The additional repulsion parameters for the sulfur atom were taken from the parametrization of Abraha & Williams for sulfur allotropes.56 The atomic point charges were obtained from a multipolar expansion of the electrostatic potential of the calculated crystal structures assuming antiferromagnetic coupling. The radical Fukui function36 for the non-covalent pair undergoing an addition reaction was computed at 40 GPa and 50 GPa (for the structure before and after the reaction, respectively) with the finite difference approximation. The wavefunctions of the anion (N + 1) and cation (N − 1) structures were computed with Gaussian 1657 at the B3LYP//6-31g(d,p) level. Extraction of electron densities from the wavefunctions and subsequent arithmetic operations were performed with Multiwfn 3.3.9.58Results and discussion
The goal of our study is to observe and interpret the effects of controlled compression on the electronic structure of (TTF-BTD)2I3. To this end, we used two kinds of experimental techniques (X-ray diffraction and Raman spectroscopy) to validate the structural and electronic changes predicted by theoretical calculations. For the sake of a clear discussion, the crystal packing of (TTF-BTD)2I3 is illustrated in Fig. 1, where all the relevant structural parameters are defined.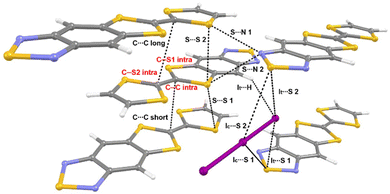 | ||
| Fig. 1 Structure and definition of structural parameters of (TTF-BTD)2I3. Intramolecular bonds are labelled in red, while intermolecular interactions are labelled in black. | ||
XRD experiments
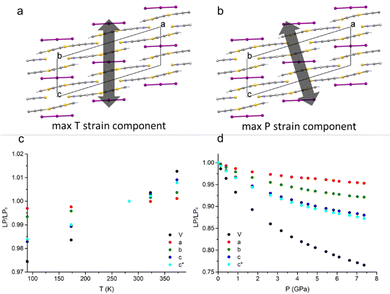
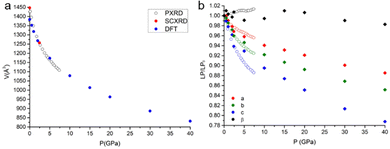
When decreasing the temperature down to 90 K, a volume contraction of ∼3% was observed, with a marked anisotropic character and the principal strain component directed along the crystallographic c-axis. This led to a shortening of ∼2% for both C⋯Cshort and C⋯Clong (see Fig. 1). Apart from this, no other relevant structural modifications were observed. The HP-PXRD study, instead, indicated a substantial shrinking of ∼24% up to ∼7.5 GPa, corresponding to a bulk modulus of 9.97(9) GPa. The compression was continuous and anisotropic, and the main component of the strain tensor was found along the c* direction (Fig. 2).The single-crystal high-pressure experiments performed were severely limited by the tendency of the crystals to break easily upon even moderate compression (see the experimental section). This fragility could be attributed to the presence of twin domains, a feature that affects the samples implying two contrasting orientations of the strain. Therefore, a detailed analysis of the HP (TTF-BTD)2I3 crystal structures was possible only from the theoretical calculations, using periodic-DFT to simulate an ideal crystal. In contrast, only the unit cell parameters are reliably obtained from the HP-PXRD data (see Fig. 3). The agreement between the experimental and calculated unit cell volumes is excellent, while some quantitative discrepancies are found for the length of the unit cell axes taken individually. The c-axis, in particular, is ∼2% more compressed in the PXRD experiment (in keeping with the only HP point of the single crystal experiment) compared to the periodic DFT calculations, compensating the opposite behaviour of the monoclinic angle β. These discrepancies are likely due to the temperature effects, which are not accounted for in the DFT calculations.
Raman spectroscopy
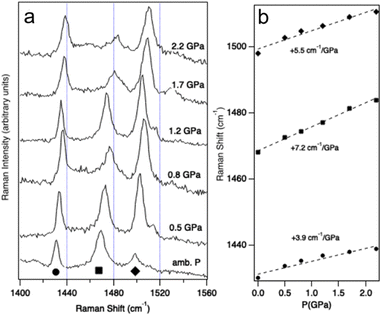
Vibrational spectroscopy is a well-established, experimental probe of the pressure effects,59 and is complementary to XRD. Discontinuities of vibrational frequencies at variable pressure are often indicative of phase transitions or severe changes of the intra- and intermolecular interactions. Raman signals at shifts between 1400 cm−1 and 1560 cm−1, corresponding to C![[double bond, length as m-dash]](https://www.rsc.org/images/entities/char_e001.gif) C stretching modes, are clues about the oxidation state of BEDT-TTF moieties.60 They are expected to show strong variations if pressure induces a significant change in charge localization and hence in the conductivity. Fig. 4 shows the Raman spectra of (TTF-BTD)2I3 measured between ambient pressure and 2.2 GPa. The band maxima in this region feature pressure-induced shifts between 4 cm−1 GPa−1 and 7 cm−1 GPa−1, given in Fig. 4b, without any obvious discontinuities. Such shifts are similar in magnitude to those reported for ligand modes in coordination compounds.61 Change of the oxidation states, from neutral to salts, has been shown to lead to Raman frequency changes on the order of 80 cm−1 to 100 cm−1.60 Extrapolating from the measured shifts of Raman frequencies, a pressure on the order of 20 GPa would be required to achieve this total shift, i.e. at least one order of magnitude higher than the experimentally accessible range. The vibrational spectra – over a much more limited pressure range compared to the diffraction experiments – do not reflect a pronounced change of the conducting properties and indicate that much higher pressures are required, as confirmed by the detailed structural considerations below. While the pressure-induced shifts are easily discernible in Fig. 4, those induced by a temperature change (between T = 90 K and T = 293 K) are smaller than 4 cm−1 over the entire temperature range, as shown in Fig. S4, ESI†
C stretching modes, are clues about the oxidation state of BEDT-TTF moieties.60 They are expected to show strong variations if pressure induces a significant change in charge localization and hence in the conductivity. Fig. 4 shows the Raman spectra of (TTF-BTD)2I3 measured between ambient pressure and 2.2 GPa. The band maxima in this region feature pressure-induced shifts between 4 cm−1 GPa−1 and 7 cm−1 GPa−1, given in Fig. 4b, without any obvious discontinuities. Such shifts are similar in magnitude to those reported for ligand modes in coordination compounds.61 Change of the oxidation states, from neutral to salts, has been shown to lead to Raman frequency changes on the order of 80 cm−1 to 100 cm−1.60 Extrapolating from the measured shifts of Raman frequencies, a pressure on the order of 20 GPa would be required to achieve this total shift, i.e. at least one order of magnitude higher than the experimentally accessible range. The vibrational spectra – over a much more limited pressure range compared to the diffraction experiments – do not reflect a pronounced change of the conducting properties and indicate that much higher pressures are required, as confirmed by the detailed structural considerations below. While the pressure-induced shifts are easily discernible in Fig. 4, those induced by a temperature change (between T = 90 K and T = 293 K) are smaller than 4 cm−1 over the entire temperature range, as shown in Fig. S4, ESI†
Theoretical calculations
DFT calculations were carried out not only for predicting the crystal structures at pressures for which detailed experimental characterization was not successful, but also to give more insights into the nature of the interactions occurring in the crystal and their correlation with the transport and mechanical properties.Given the alternation of the distances between the TTF-BTD molecules in the columnar π–π stacks and the fact that an unpaired electron must be shared between two molecules, a dimeric character is expected. However, the compressibility of the intra-pair stacking is comparable to that of the inter-pair stacking, at least up to 15 GPa (see Fig. 5a). At each pressure point, the forces calculated based on classical intermolecular energy decomposition schemes (electrostatics, induced polarization, dispersion, and short-range repulsion) obviously oppose further approach of TTF-BTD. The destabilization progressively increases upon compression, compensated by the energy introduced through the externally applied force. All interactions within a non-covalent pair are stronger than the inter-pair ones (Fig. S4, ESI†) because of the shorter distances, for which the repulsive energy term dominates. Intuitively, one would expect that only the inter-pair distances would shrink until inter- and intra-pair distances equalise, because the repulsive forces rapidly decrease with the intermolecular distance. However, because we observe a very similar compressibility for both kinds of contacts, despite the stronger repulsion associated with the intra-pair one, we conclude that an additional electronic factor (like an incipient covalency) favours the intra-pair compression, not accounted for by the classical energy terms.
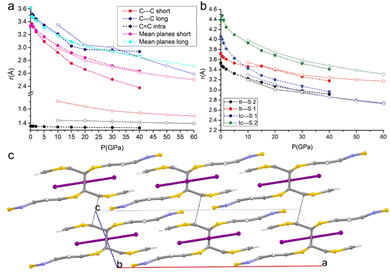 | ||
| Fig. 5 Pressure-induced formation of a covalent bond between the TTF-BTD moieties. The full circles with dashed lines and the open circles with dotted lines represent the phases before and after the intra-pair reaction that produces the covalent dimer; (a) variations of C⋯Cshort, C⋯Clong, and C–Cintra, and the distances between the mean planes of TTF-BTD moieties under compression; (b) variations of Ic⋯S1, Ic⋯S2, It⋯S1, and It⋯S2 distances under compression (see examples of sulphur-bonds in Beno et al. and Arkhipov et al.);62,63 and (c) crystal structure of the new phase viewed along the b-axis at 50 GPa; C⋯Cshort has turned into a covalent bond, while C⋯Clong contacts are indicated by the black dotted lines. | ||
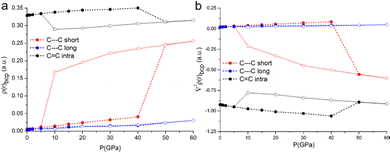
Deeper insight is gained from the accurate analysis of the electron density distribution ρ(r). The topological analysis of ρ(r) based on the QTAIM addresses bond critical points along the bond paths of all the interactions labelled in Fig. 1. As expected, the compression affects the electron density at the critical points, i.e. it increases progressively as a consequence of the shorter distances. It is worth noting that the intra-pair contact, C⋯Cshort, features not only a larger value of electron density but also a larger increase rate upon compression, see Fig. 6. The Laplacian is small and positive for all these contacts, and it also increases as a function of the applied pressure, with a steeper increase for the intra-pair one.
The volume reduction of the inter-stacks cavities brings the I3− anions closer to the TTF moieties on the same plane, favouring the symmetrical interactions between the terminal iodine atom (It) and the hydrogen atoms of the TTF (as inferred from the appearance of the corresponding bond critical points). Moreover, a slight slide between the layers occurs, bringing I3− in an inner position between the two closer BTD moieties along the c-axis. This is clearly visible in Fig. 5b: while at lower pressures the distances between the BTD sulfur atom and the central iodine atom (Ic) were much longer than those with the terminal iodine (It), at higher pressures they become comparable.
The DFT calculations enable predicting structures even above the measurable pressure ranges, limited experimentally by the fragility of the crystals. In the structure calculated at 50 GPa, a bond is formed between two carbon atoms of the TTF moieties aggregated through C⋯Cshort, leading to the crystal packing shown in Fig. 5c. The abrupt reduction of the C⋯Cshort distance (Fig. 5a) and of the Laplacian of its electron density (Fig. 6b) indicates the formation of a covalent bond between the two atoms and therefore a genuine σ-dimer. This is also reflected in the tetrahedral geometry of the two carbon atoms and the elongation of the C–Cintra and C–S1intra bonds of the TTF, all due to a sp3 re-hybridization of the two carbon atoms.
Fig. 7 shows the Fukui function f(0)(r) for the dimerized TTF-BTD moiety at 40 and 50 GPa which are, respectively, the highest pressures at which the non-covalent pair is predicted to occur, and the pressures at which only the covalently bonded species is predicted. f(0)(r) illustrates the regions of the molecule where a radical attack is more likely, strongly indicative of the localization of the unpaired electron. While prior to the formation of a covalent bond the density was localized on the entirety of TTF C–Cintra bonds (including the reactive C atoms), after the reaction it is localized only on the one carbon not involved in the newly formed bond (and on the sulfur atoms). This suggests that also the C⋯Clong interaction could be transformed into a covalent bond. Indeed, the shortening of C⋯Clong, which had reached a plateau in the phase of the non-covalent pair, resumes in the new phase as well, and one can expect that, eventually, a polymerization reaction may occur. However, it was not possible to obtain convergence for calculations at pressures higher than 60 GPa to substantiate this hypothesis.
 | ||
| Fig. 7 Fukui function f(0)(r) for (TTF-BTD)2 radicals before and after the addition reaction. (a) f(0)(r) for the non-covalent π-pair “extracted” from the crystal structure at 40 GPa. (b) f(0)(r) for the covalent σ-dimer extracted from the crystal structure at 50 GPa. Graphic elaboration performed with isovalue = 0.003 a.u. in Avogadro.64 | ||
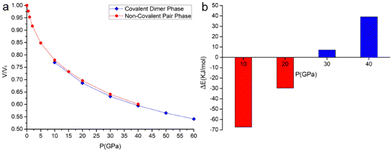
The phase of the covalently bonded dimer was also used as a starting guess for geometry optimizations at lower pressures (Fig. 8). According to the calculations, the two phases coexist at pressures between 10 and 40 GPa. From pseudo-enthalpic considerations (Eel + PV), the ambient pressure phase (without the covalent dimerization) is predicted to be the most stable up to 20 GPa, while the phase consisting of the covalently dimerized species is favoured at higher pressures.
Conclusions
We have investigated the (TTF-BTD)2I3 salt, a promising organic semiconductor, at variable temperature and pressure, using both X-ray diffraction and Raman spectroscopy, with the aim of determining the material properties upon compression. The theoretical calculations, used to interpret the experimental results up to the highest pressure achievable experimentally, predict an interesting evolution of the TTF-BTD pairing that eventually favours the formation of a genuine covalent bond between two TTF-BTD units (at P > 20 GPa). The variations with pressure of the electron density and its Laplacian at the bond critical points along the C⋯Cshort, C⋯Clong, and C–Cintra bond paths support the claimed formation of the covalent bond along C⋯Cshort and the sp3 hybridizations of the involved carbon atoms. Moreover, ρ(r)bcp along C⋯Clong is approaching the values of that along C⋯Cshort right before the addition reaction occurs. This is a strong indication that our calculations are close to the pressure at which an extensive polymerization might occur, and an even more interesting phase may be obtained. The experimental difficulties (and especially the fragility of the crystals) did not allow validating this hypothesis. Nevertheless, quantum chemical methods allowed a thorough study of the modified molecular structure, its bonding situation, and the consequences for the crystal properties.Author contributions
The manuscript was written through contributions of all authors. All authors have given approval to the final version of the manuscript.Conflicts of interest
There are no conflicts to declare.Acknowledgements
This work was financially supported by the Swiss NSF (200021_204053, 162861, and 182892). P. M. thanks the CINECA supercomputing centre for computational resources (project HP10CS2KL1). C. S. and C. R. gratefully acknowledge research grants from the Natural Sciences and Engineering Research Council (Canada).Notes and references
- M. Dressel, Crystals, 2018, 8(332), 1–3 Search PubMed.
- Y. Yoshida and H. Kitagawa, Chem. Commun., 2020, 56, 10100–10112 RSC.
- A. Frąckowiak, R. Świetlik, O. Jeannin, M. Fourmigué, W. Li and M. Dressel, J. Phys.: Condens. Matter, 2019, 31, 155601 CrossRef PubMed.
- J.-P. Pouget, P. Alemany and E. Canadell, Mater. Horiz., 2018, 5, 590–640 RSC.
- T. Mori, Electronic Properties of Organic Conductors, Springer Japan, Tokyo, 2016 Search PubMed.
- K. Murata, K. Yokogawa, S. Arumugam and H. Yoshino, Crystals, 2012, 2, 1460–1482 CrossRef CAS.
- M. Fourmigué and P. Batail, Chem. Rev., 2004, 104, 5379–5418 CrossRef PubMed.
- F. Wudl, Acc. Chem. Res., 1984, 17, 227–232 CrossRef CAS.
- M. R. Bryce, Chem. Soc. Rev., 1991, 20, 355 RSC.
- J. Ferraris, D. O. Cowan, V. Walatka and J. H. Perlstein, J. Am. Chem. Soc., 1973, 95, 948–949 CrossRef CAS.
- K. Bender, I. Hennig, D. Schweitzer, K. Dietz, H. Endres and H. J. Keller, Mol. Cryst. Liq. Cryst., 1984, 108, 359–371 CrossRef CAS.
- T. Mori, A. Kobayashi, Y. Sasaki, H. Kobayashi, G. Saito and H. Inokuchi, Chem. Lett., 1984, 957–960 CrossRef CAS.
- J. Yamada and T. Sugimoto, TTF Chemistry: Fundamentals and Applications of Tetrathiafulvalene, Springer Berlin Heidelberg, 2014 Search PubMed.
- P. Batail, Chem. Rev., 2004, 104, 4887–4890 CrossRef CAS.
- J. L. Segura and N. Martín, Angew. Chem., Int. Ed., 2001, 40, 1372–1409 CrossRef CAS PubMed.
- K. Simonsen and J. Becher, Synlett, 1997, 1211–1220 CrossRef CAS.
- Y. Yamashita and M. Tomura, J. Mater. Chem., 1998, 8, 1933–1944 RSC.
- R. Pfattner, S. T. Bromley, C. Rovira and M. Mas-Torrent, Adv. Funct. Mater., 2016, 26, 2256–2275 CrossRef CAS.
- P. Frère and P. J. Skabara, Chem. Soc. Rev., 2005, 34, 69–98 RSC.
- A. Jana, S. Bähring, M. Ishida, S. Goeb, D. Canevet, M. Sallé, J. O. Jeppesen and J. L. Sessler, Chem. Soc. Rev., 2018, 47, 5614–5645 RSC.
- S.-X. Liu, S. Dolder, E. B. Rusanov, H. Stoeckli-Evans and S. Decurtins, C. R. Chim, 2003, 6, 657–662 CrossRef CAS.
- K. Hervé, S.-X. Liu, O. Cador, S. Golhen, Y. Le Gal, A. Bousseksou, H. Stoeckli-Evans, S. Decurtins and L. Ouahab, Eur. J. Inorg. Chem., 2006, 3498–3502 CrossRef.
- D. Canevet, M. Sallé, G. Zhang, D. Zhang and D. Zhu, Chem. Commun., 2009, 2245 RSC.
- J. Yamada, H. Akutsu, H. Nishikawa and K. Kikuchi, Chem. Rev., 2004, 104, 5057–5084 CrossRef CAS PubMed.
- J. J. Bergkamp, S. Decurtins and S.-X. Liu, Chem. Soc. Rev., 2015, 44, 863–874 RSC.
- F. Dumur, N. Gautier, N. Gallego-Planas, Y. Şahin, E. Levillain, N. Mercier, P. Hudhomme, M. Masino, A. Girlando, V. Lloveras, J. Vidal-Gancedo, J. Veciana and C. Rovira, J. Org. Chem., 2004, 69, 2164–2177 CrossRef CAS PubMed.
- F. Otón, V. Lloveras, M. Mas-Torrent, J. Vidal-Gancedo, J. Veciana and C. Rovira, Angew. Chem., Int. Ed., 2011, 50, 10902–10906 CrossRef PubMed.
- J. Wu, N. Dupont, S.-X. Liu, A. Neels, A. Hauser and S. Decurtins, Chem. – Asian J., 2009, 4, 392–399 CrossRef CAS PubMed.
- C. R. Belton, A. L. Kanibolotsky, J. Kirkpatrick, C. Orofino, S. E. T. Elmasly, P. N. Stavrinou, P. J. Skabara and D. D. C. Bradley, Adv. Funct. Mater., 2013, 23, 2792–2804 CrossRef CAS.
- F. Pop, A. Amacher, N. Avarvari, J. Ding, L. M. L. Daku, A. Hauser, M. Koch, J. Hauser, S.-X. Liu and S. Decurtins, Chem. – Eur. J., 2013, 19, 2504–2514 CrossRef CAS PubMed.
- A. Amacher, H. Luo, Z. Liu, M. Bircher, M. Cascella, J. Hauser, S. Decurtins, D. Zhang and S.-X. Liu, RSC Adv., 2014, 4, 2873–2878 RSC.
- A. M. Amacher, J. Puigmartí-Luis, Y. Geng, V. Lebedev, V. Laukhin, K. Krämer, J. Hauser, D. B. Amabilino, S. Decurtins and S.-X. Liu, Chem. Commun., 2015, 51, 15063–15066 RSC.
- M. Souto, M. C. Gullo, H. Cui, N. Casati, F. Montisci, H. O. Jeschke, R. Valentí, I. Ratera, C. Rovira and J. Veciana, Chem. – Eur. J., 2018, 24, 5500–5505 CrossRef CAS PubMed.
- Y. Geng, R. Pfattner, A. Campos, J. Hauser, V. Laukhin, J. Puigdollers, J. Veciana, M. Mas-Torrent, C. Rovira, S. Decurtins and S.-X. Liu, Chem. – Eur. J., 2014, 20, 7136–7143 CrossRef CAS PubMed.
- P. Alemany, E. Canadell, Y. Geng, J. Hauser, P. Macchi, K. Krämer, S. Decurtins and S.-X. Liu, ChemPhysChem, 2015, 16, 1361–1365 CrossRef CAS PubMed.
- R. G. Parr and W. Yang, J. Am. Chem. Soc., 1984, 106, 4049–4050 CrossRef CAS.
- F. Montisci, A. Lanza, N. Casati and P. Macchi, Cryst. Growth Des., 2018, 18, 7579–7589 CrossRef CAS.
- R. F. W. Bader, Atoms in molecules: a quantum theory, Clarendon Press, 1990 Search PubMed.
- Rigaku Oxford Diffraction, 2016.
- A. Altomare, M. C. Burla, M. Camalli, G. L. Cascarano, C. Giacovazzo, A. Guagliardi, A. G. G. Moliterni, G. Polidori and R. Spagna, J. Appl. Crystallogr., 1999, 32, 115–119 CrossRef CAS.
- G. M. Sheldrick, Acta Crystallogr A, 2008, 64, 112–122 CrossRef CAS PubMed.
- L. Merrill and W. A. Bassett, Rev. Sci. Instrum., 1974, 45, 290–294 CrossRef.
- R. Boehler and K. De Hantsetters, High Press. Res., 2004, 24, 391–396 CrossRef.
- H. K. Mao, J. Xu and P. M. Bell, J. Geophys. Res., 1986, 91, 4673 CrossRef CAS.
- A. Dewaele, M. Torrent, P. Loubeyre and M. Mezouar, Phys. Rev. B: Condens. Matter Mater. Phys., 2008, 78, 1–13 CrossRef.
- R. J. Angel, D. R. Allan, R. Miletich, L. W. Finger and IUCr, J. Appl. Crystallogr., 1997, 30, 461–466 CrossRef CAS.
- P. R. Willmott, D. Meister, S. J. Leake, M. Lange, A. Bergamaschi, M. Böge, M. Calvi, C. Cancellieri, N. Casati, A. Cervellino, Q. Chen, C. David, U. Flechsig, F. Gozzo, B. Henrich, S. Jäggi-Spielmann, B. Jakob, I. Kalichava, P. Karvinen, J. Krempasky, A. Lüdeke, R. Lüscher, S. Maag, C. Quitmann, M. L. Reinle-Schmitt, T. Schmidt, B. Schmitt, A. Streun, I. Vartiainen, M. Vitins, X. Wang and R. Wullschleger, J. Synchrotron Radiat., 2013, 20, 667–682 CrossRef CAS PubMed.
- A. A. Coelho, J. Appl. Crystallogr., 2018, 51, 210–218 CrossRef CAS.
- R. J. Angel, J. Gonzalez-Platas and M. Alvaro, Z. Kristallogr., 2014, 229, 405–419 CAS.
- R. Dovesi, A. Erba, R. Orlando, C. M. Zicovich-Wilson, B. Civalleri, L. Maschio, M. Rérat, S. Casassa, J. Baima, S. Salustro and B. Kirtman, Wiley Interdiscip. Rev.: Comput. Mol. Sci., 2018, 8, e1360 Search PubMed.
- M. F. Peintinger, D. V. Oliveira and T. Bredow, J. Comput. Chem., 2013, 34, 451–459 CrossRef CAS PubMed.
- J. Laun, D. Vilela Oliveira and T. Bredow, J. Comput. Chem., 2018, 39, 1285–1290 CrossRef CAS PubMed.
- S. Grimme, J. Comput. Chem., 2006, 27, 1787–1799 CrossRef CAS PubMed.
- C. Gatti, V. R. Saunders and C. Roetti, J. Chem. Phys., 1994, 101, 10686–10696 CrossRef CAS.
- S. Casassa, A. Erba, J. Baima and R. Orlando, J. Comput. Chem., 2015, 36, 1940–1946 CAS.
- A. Abraha and D. E. Williams, Inorg. Chem., 1999, 38, 4224–4228 CrossRef CAS.
- G. A. Frisch, M. J. Trucks, G. W. Schlegel, H. B. Scuseria, G. E. Robb, M. A. Cheeseman, J. R. Scalmani, G. Barone and V. Petersson, Gaussian 16, Gaussian, Inc., Wallingford, CT, 2016 Search PubMed.
- T. Lu and F. Chen, J. Comput. Chem., 2012, 33, 580–592 CrossRef CAS PubMed.
- J. González and F. J. Manjón, in An Introduction to High-Pressure Science and Technology, ed. J. M. Recio, J. M. Menendez and A. O. de la Roza, Routledge/CRC press, 2016, pp. 265–300 Search PubMed.
- H. H. Wang, J. R. Ferraro, J. M. Williams, U. Geiser and J. A. Schlueter, J. Chem. Soc., Chem. Commun., 1994, 1893–1894 RSC.
- S. Poirier, L. Czympiel, N. Bélanger-Desmarais, S. Mathur and C. Reber, Dalton Trans., 2016, 45, 6574–6581 RSC.
- B. R. Beno, K.-S. Yeung, M. D. Bartberger, L. D. Pennington and N. A. Meanwell, J. Med. Chem., 2015, 58, 4383–4438 CrossRef CAS PubMed.
- S. G. Arkhipov, P. S. Sherin, A. S. Kiryutin, V. A. Lazarenko and C. Tantardini, CrystEngComm, 2019, 21, 5392–5401 RSC.
- M. D. Hanwell, D. E. Curtis, D. C. Lonie, T. Vandermeersch, E. Zurek and G. R. Hutchison, J. Cheminform., 2012, 4, 17 CrossRef CAS PubMed.
Footnotes |
| † Electronic supplementary information (ESI) available: Crystallographic coordinates of structures optimized with p-DFT at variable pressure; band structure and total DOS plots at variable pressure; Raman spectra at variable temperature; and forces calculated with semi-empirical potential. CCDC 2292085–2292087. For ESI and crystallographic data in CIF or other electronic format see DOI: https://doi.org/10.1039/d3cp04220k |
| ‡ Present address: Cambridge Crystallographic Data Centre, 12 Union Road, Cambridge CB2 1EZ, UK. |
| § Present address: Department of Chemistry, University of Copenhagen, Universitetsparken 5, Copenhagen, Denmark. |
| ¶ Present address: College of Chemistry, Chemical Engineering and Material Science, Shandong Normal University, Jinan 250014, P. R. China. |
| This journal is © the Owner Societies 2023 |

