
 Open Access Article
 This Open Access Article is licensed under a Creative Commons Attribution-Non Commercial 3.0 Unported Licence
Surface enhanced Raman scattering for probing cellular biochemistry
Cecilia
Spedalieri
 and
Janina
Kneipp
*
and
Janina
Kneipp
*
Humboldt-Universität zu Berlin, Department of Chemistry, Brook-Taylor-Str. 2, 12489 Berlin, Germany. E-mail: janina.kneipp@chemie.hu-berlin.de
First published on 15th March 2022
Abstract
Surface enhanced Raman scattering (SERS) from biomolecules in living cells enables the sensitive, but also very selective, probing of their biochemical composition. This minireview discusses the developments of SERS probing in cells over the past years from the proof-of-principle to observe a biochemical status to the characterization of molecule–nanostructure and molecule–molecule interactions and cellular processes that involve a wide variety of biomolecules and cellular compartments. Progress in applying SERS as a bioanalytical tool in living cells, to gain a better understanding of cellular physiology and to harness the selectivity of SERS, has been achieved by a combination of live cell SERS with several different approaches. They range from organelle targeting, spectroscopy of relevant molecular models, and the optimization of plasmonic nanostructures to the application of machine learning and help us to unify the information from defined biomolecules and from the cell as an extremely complex system.
1. Introduction: intrinsic SERS from animal cells
The excitation of localized surface plasmons of nanostructures can provide very high sensitivity to a Raman experiment through the high local optical fields that are the main reason for surface-enhanced Raman scattering (SERS). Although the discussion of SERS spectra from living eukaryotic cells dates back much shorter than the discussion of those from bacteria, about two decades1,2 have passed during which their potential and applicability have been assessed. Without the use of any additional labels, tags or reporter molecules, biomolecules and their functional groups identify themselves by their own SERS signal when plasmonic SERS substrates are positioned inside or around cells. The structural information that is conveyed by the SERS spectra is selective, it relies on the proximity of the molecules or part of a molecule to the plasmonic nanostructure. The molecule–nanostructure interactions, and thereby the selectivity in SERS, are determined by the molecules at the surface of the pristine nanostructure. They can be modified intentionally, e.g., by selecting specific stabilizing agents during synthesis or functionalization, or they are determined by the complex bio-environment, which itself is part of the analyte. The necessity to use plasmonic nanoparticles so that the enhanced vibrational signal from molecules in the cell is obtained, would justify classification of the nanoparticles as ‘labels’ as well in a strict sense. Nevertheless, often the term ‘label-free SERS’ is used, as opposed to so-called SERS tags that have become frequently used to highlight parts of cells based on the spectra of extrinsic reporter molecules that can even be quantified.3Many initial concerns regarding its actual applicability have been resolved since the first reports on live cell SERS. The main credit for this can be given to numerous applications that explicitly utilize the selectivity of a SERS experiment with respect to a cellular compartment, a particular molecular species, or molecular interaction. In contrast, aiming for a comprehensive description of the molecular composition of cells, without addressing a (literal) target, usually fails. Many challenges related to having a plasmonic substrate available at a specific location or compartment of a cell have been tackled with the help of biotechnology and drug delivery, such as the long-known concept of attaching localization sequences to nanostructures4 or by applying specific incubation conditions. In turn, SERS has revealed itself as a useful tool to evaluate theranostic approaches that involve nanostructures.5 The processing of SERS active nanostructures by the living cell and the success of a particular targeting approach can be validated thanks to improved ultrastructural imaging and tomography, e.g. by electron and X-ray microscopy that can be carried out on the intact cells.6 In addition to observing plasmonic nanoparticles in relation to the subcellular ultrastructure,7 high-resolution imaging can also provide a basis for predicting the enhancement provided by plasmonic nanoaggregates8,9 in the complex environments. Important advances have been made in the development of suitable nanomaterials and immobilized plasmonic nanostructures that provide high enhancement, biocompatibility, and/or multifunctionality for cellular probing. Lastly, the omnipresence of machine learning in biodiagnostic Raman spectroscopy has not left out the field of bio-SERS, and over the years the specific requirements of SERS data from complex samples in an automated analysis became more obvious.10,11 By combining all these and more aspects, a range of results have been obtained on molecule–nanostructure and molecule–molecule interactions in cells by SERS.
In this minireview we would like to discuss the important new developments in SERS of animal cells of the past few years and emphasize the transition this research has made from proof-of-principle to the observation of physiological processes in cells. We will show examples that illustrate the type of qualitative information that is gained from the spectra measured in different organelles and the outer cell membrane and the knowledge on SERS of pure biomolecules and cellular components that is required for a better understanding of the intracellular SERS. As an important conclusion, we see that, while understanding cellular processes remains a challenge due to the complexity of the biological machinery and the intrinsic difficulties of tracking processes in real time, SERS has become a unique option that brings us closer to this goal.
2. State of the art: physiological processes and probes
2.1 Understanding physiological processes with SERS
A wide range of biological and biochemical methods allow for the characterization of the physiological processes that constitute, e.g., the cellular response to stimuli, metabolism, proliferation, motility, or cell death. Amongst them, SERS has the advantage of being non-destructive, allowing for the study of individual living cells in real time, and the possibility of obtaining information from different molecules simultaneously using label-free probes of different physicochemical properties. The range of physiological processes that can be followed using SERS has significantly expanded in the last years, specifically with respect to the simultaneous probing of several intracellular or extracellular species and a more comprehensive understanding of cellular responses.The interaction between specific proteins and other molecules, either their substrates or inhibitors of activity can be probed using SERS. The dopamine receptors in living cells trigger the formation of cAMP when interacting with signaling molecules such as dopamine or amphetamine. Although not directly revealing the interaction itself, the intracellular increase or decrease of cAMP can be probed by SERS using silica coated silver nanoparticles and the 780 cm−1 and 1503 cm−1 bands of the molecule as indicators, and therefore whether the different dopamine receptors trigger the same signal cascade in the presence of the signaling molecules.12 Tricyclic antidepressants inhibit acid sphingomyelinase activity and block lipid degradation pathways, inducing lipid accumulation (Fig. 1A and B). This process can be identified by SERS when cells are incubated with gold nanoparticles and these inhibitors.13 Bands at 1018 cm−1 and 818 cm−1 related to sphingomyelin vibrations are observed in the spectra (Fig. 1C), which are relevant for identifying antidepressant treated from non-treated cells, and the presence of cholesterol bands indicate its accumulation due to inhibition of the enzyme.13 When selectively probing lysosomes (Fig. 1C), bands related to the tricyclic antidepressant drug desipramine14 indicated the intercalation of the molecule's aromatic rings between lipid acyl chains.13 The toxicity of different nanoparticles that have no inherent Raman enhancing properties, such as zinc dioxide, titanium dioxide and single walled carbon nanotubes, can be followed by SERS in cells incubated with gold nanoparticles.15 After incubation with these nanomaterials, major changes are observed in SERS bands related to proteins, particularly for disulfide bonds, the 1000 cm−1 phenylalanine band and in the amide III region, suggesting protein denaturation.15
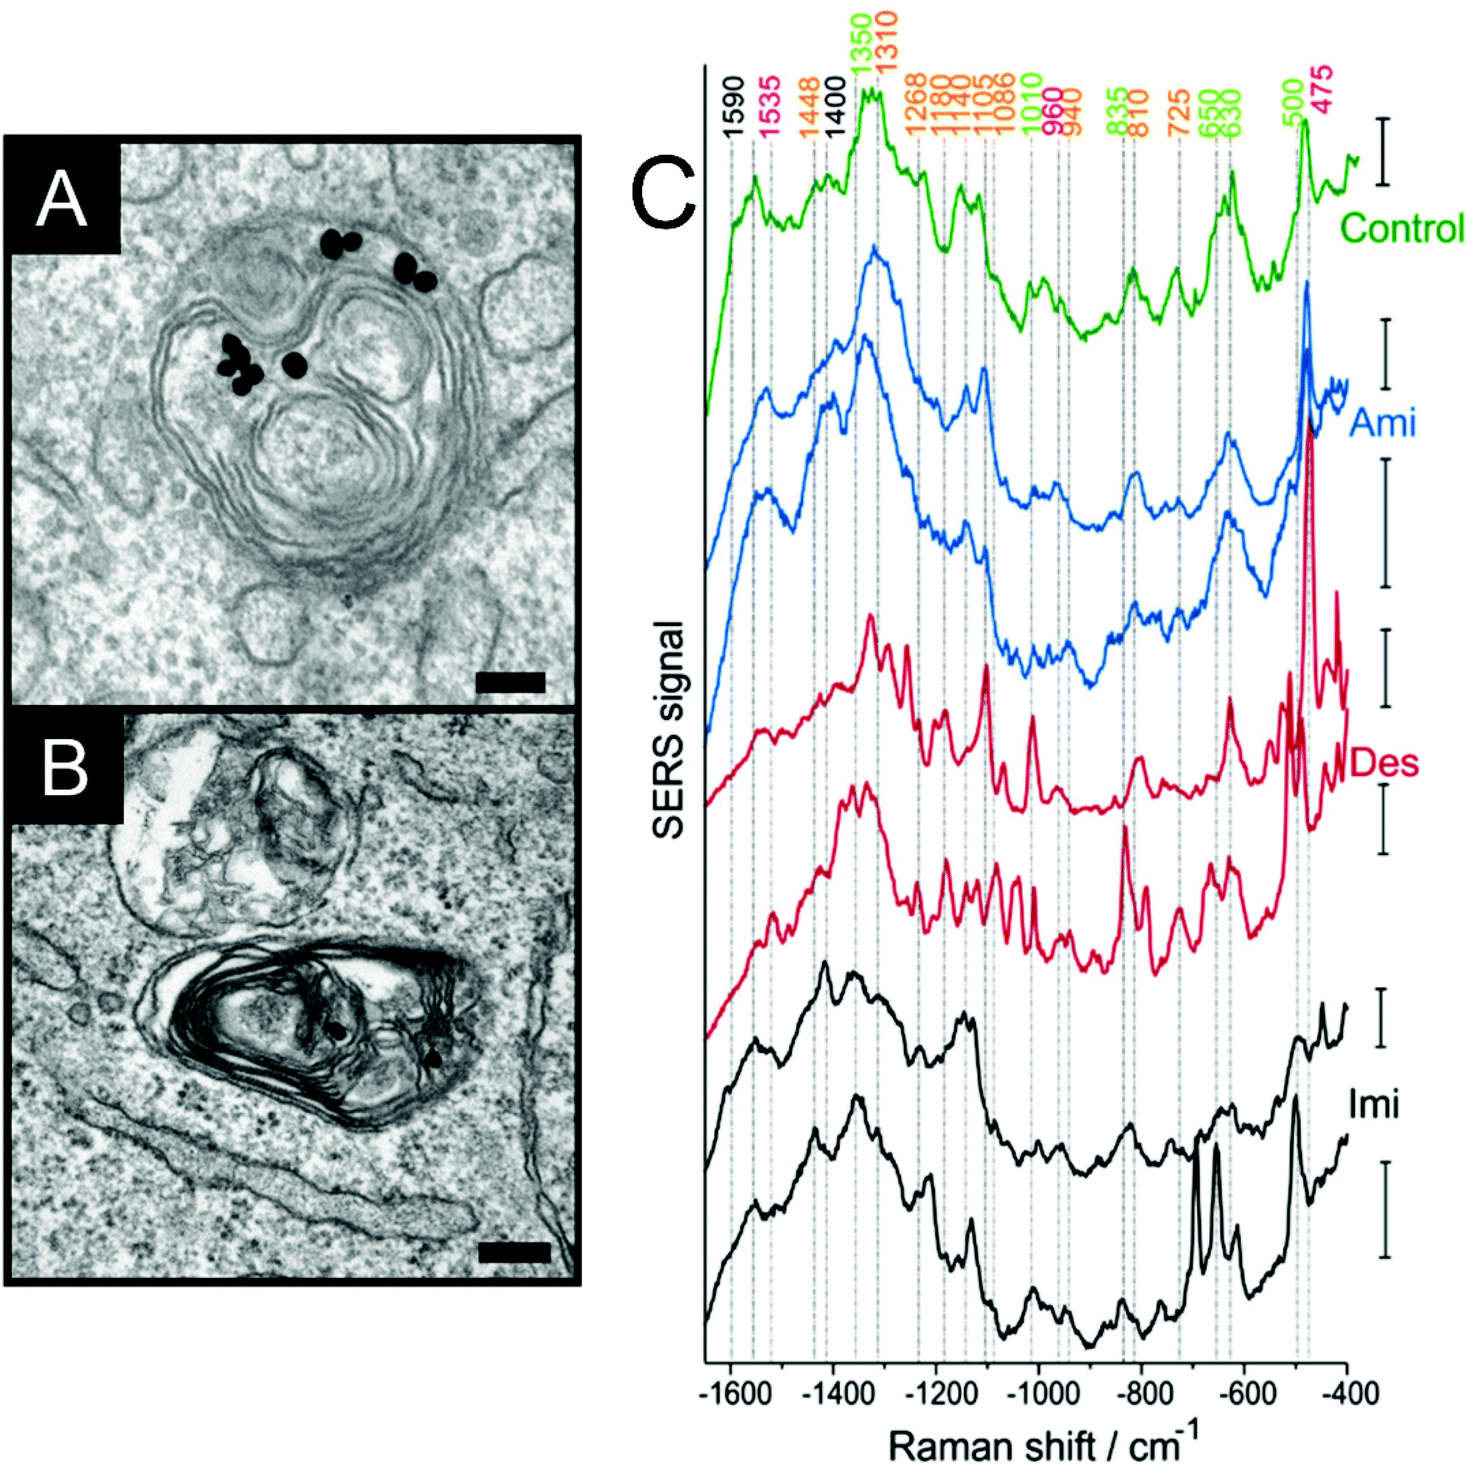 | ||
| Fig. 1 (A, B) Accumulation of lipids in the endolysosomal system upon inhibition of the enzyme acid sphingomyelinase as imaged by transmission electron microscopy in a cultured cells of fibroblast cell line 3T3. The gold nanoparticles reside between the myelin figures. Scale bars: 100 nm (C) representative SERS spectra obtained in lysosomes of cells, where lipid accumulation was induced by the three drugs amitriptyline (Ami), desipramine (Des), and imipramine (Imi) and in control cells. Excitation wavelength: 785 nm, acquisition time for the single spectra: 1 s, excitation intensity: 2 × 10⁵ W cm−2. All scale bars: 20 cps. Reproduced with permission from ref. 13, Copyright 2019 American Chemical Society. | ||
The apoptotic process in cells is amongst the most studied, due to its relevance in a vast range of theranostic applications. The lack of regulation of programmed cell death in cancerous cells is one of the targets of many bionanotechnological applications, and SERS spectroscopy has been used to follow the changes in treated cells and the effectiveness of induced cell death in different cellular compartments. After treatment of HepG2 cells with arbin, a cytotoxic, ribosome inactivating protein, bands related to important protein structural elements such as disulfide bridges or amide bonds decrease in intensity with time, while the phenylalanine signal at 1000 cm−1 increases.16 Both changes were discussed as indicators of cell death.17 When studying the apoptotic effect of cordycepin, an analog of adenosine, in HeLa cells, RNA related signals decreased with time, suggesting that this drug molecule interferes with RNA production.18 Treatment of cells with doxorubicin, a known chemotherapy agent, can be followed by SERS both in terms of the cellular response19 and the efficiency of drug delivery when the carrier is also a SERS probe.20 Another well-studied chemotherapy agent, cisplatin, could enhance the activation of a hemeoxygenase and the consequent degradation of heme groups in carbon monoxide.21 The triple bond Raman signal of carbon monoxide appears in the ‘Raman silent’ window in the spectra of biological samples, and CO generation was monitored in real time by SERS.21 When cancerous cells are subjected to electrical stimulation to induce cell death, DNA damage was shown to be evident from the decrease in intensity of adenine related bands, together with a variation of the methyl/methylene band at 1459 cm−1 and the phosphodiester band at 815 cm−1.22 In contrast non-cancerous cells show a decrease and further increase in intensity over treatment time of bands related to phosphate backbone and nucleobases that suggest successful DNA repair.22
The analysis of biomolecules excreted by single cells is a similar challenge as probing intracellular biomolecules. SERS can be applied to detect different nutrients and metabolites simultaneously in the extracellular medium around individual cells,23,24 with the possibility of probing the intracellular space at the same time. Using SERS probes that can be positioned in the close proximity of individual cells, metabolites can be detected simultaneously with a previously determined pattern that consists of the most intense SERS bands for each species.25,26 Extracellular vesicles are an important target for understanding cellular communication, and have become relevant systems of study for detecting markers for cancer diagnosis. Although their biomolecular components have been probed using different types of nanostructures,27,28 SERS characterization is mainly used for differentiation between exosomes from normal or cancerous cells.29–32
2.2 Probe properties and applications
Exploring SERS with the aim to follow, directly or indirectly, the processes or molecules involved in cellular response has benefited from the advancements made by research on nanoparticle properties and their interaction with cells. Gold nanoparticles are very efficient SERS substrates for label-free cellular probing due to tunable size and shape, which influence both their enhancement, aggregate formation, and transport inside cells. The shape of the particles in known to have an effect on the cellular uptake and retention,33,34 mediated by the protein corona composition and structure35,36 together with conformational changes of proteins,37,38 but less is known regarding the selectivity of nanoparticles of different shapes to probe physiological process other than particle uptake and transport.39,40 When gold nanoparticles are generated directly inside cells, the biomolecular corona will vary strongly in comparison to endocyted particles. In situ formation of gold nanoparticles was shown in cell cultures of several animal cell lines and in their supernatant after incubation with tetrachloroauric acid in buffer,41–45 and the SERS activity of the in situ generated nanoparticles was reported.42–45 Interestingly, also hybrid structures with graphene oxide could be obtained in this way.43 As was shown, SERS probes the biomolecular species involved in the formation of the nanoparticles in situ in the cell cultures.45Similar to a multifunctionality that is brought about by a combined drug-carrier-SERS probe, metallic nanostructures that provide SERS enhancement can be used for therapy, as they generate heat when irradiated with light, particularly with wavelengths close to their plasmon resonance. This is useful for photothermal treatments, since the heating is highly localized. Particles used for these treatments can also be used as SERS probes, and the cellular condition after irradiation can be assessed based on the vibrational spectra of the biomolecules in the environment surrounding the particles.46–48 Recently, materials with SERS properties that do not rely on the plasmonic properties of gold or silver, such as molybdenum oxide,49 or 2-D nanomaterials such as black phosphorous50 or graphene51,52 have been discussed as well for these applications.
The relatively facile synthesis of gold and silver nanostructures by wet-chemistry approaches in aqueous media enables different possibilities to combine both metals with other nanomaterials and to provide additional physical and chemical properties to them that can be beneficial both in SERS and theranostic applications. As a very popular example, the combination of silver or gold nanostructures with nanoparticles that provide magnetic properties should be mentioned, as the magnetic component can enable manipulation of cells and tissues in magnetic fields,53,54 especially powerful in microfluidic structures, where different cell types can be sorted and exposed to specific environmental conditions. The composition of the nanoparticle surface of composite nanostructures of gold with magnetite and silver with magnetite was characterized by SERS.54 Different from a magnetic moiety, a silica shell can also add additional functions to unlabeled intracellular SERS probes. As example, core–shell structures with a plasmonic core that mimic the surface of silica nanoparticles, termed BrightSilica, have different molecules interacting with their surface depending on the cell type and the associated route of uptake.55 At the same time, porosity of the silica shell can be tuned and influenced, therefore, use of such structures in drug delivery has been discussed as well.20
In addition to altered chemical and surface properties, SERS nanoprobes can also become multifunctional with respect to the optical properties that can enable much more versatile detection by a variety of optical signals in addition to the SERS. While the plasmonic moiety itself can be used for SERS imaging and also provides large scattering signals that can be observed in dark field microscopy,56 some inorganic crystals provide very advantageous non-linear optical properties57 that make a combined imaging and pre-screening of probes possible. As shown recently, it is possible to extend the capabilities of plasmonic nanoprobes that deliver chemical information through a SERS signature with the requirements of fast nonlinear imaging.58 There, barium titanate with well-established use as harmonic probe in second-harmonic generation (SHG) biomicroscopy was chosen as the core material and functionalized with gold or silver nanoparticles. While the barium titanate core material delivers a strong coherent SHG signal, the plasmonic nanoparticles on the surface can enhance Raman scattering, as well as the non-linear incoherent signal of hyper Raman scattering in macrophage cells.58
3. Probing different cellular compartments
3.1. Processes at the cellular membrane
While SERS of intracellular compartments requires the incorporation, either actively or passively, of SERS substrates into the cells, the plasma membrane can be brought easily into the proximity of plasmonic nanostructures.59–62 The selective probing of membrane proteins and ligand–receptor binding events at the plasma membrane level is usually assessed by fluorescence microscopy or other related techniques, but several recent examples show that SERS probing can provide a lot of additional chemical information without the addition of label molecules.Adherent cells represent an advantage for studying the plasma membrane, since they can be grown directly on 2D plasmonic substrates. On gold nanoisland decorated cover glasses, relevant features from the lipid bilayer structure can be studied in spite of the inherently low Raman cross section of lipids.60–62 By probing the polar heads and the acyl chains of the lipids in the membrane outer leaflet, specific lipid/lipid interactions and membrane properties can be distinguished. As examples, regions of higher or lower degrees of order of the lipid acyl chains are evidenced by the presence of specific C–C stretching frequencies in the spectra from different membrane regions (see Fig. 2), in agreement with known differences in the fluidity of the plasma membrane at different positions.61 Moreover, bands related to vibrations of phosphatidylethanolamine, a lipid mainly found in the inner leaflet of the membrane and that increases disorder in lipid bilayers are found in the regions with less order of the lipid tails, while cholesterol signals co-occur mainly with vibrations of ordered acyl chains.61 When mesenchymal stromal cells are grown on such gold nanoisland substrates, the formation of collagen and hydroxyapatite, characteristic of the stromal cells differentiation into osteoblasts, can be followed by SERS, and the role of the extracellular matrix in the differentiation can be better understood,62 in addition to a characterization of lipids, proteins and carbohydrates and their co-localization in the membrane.60
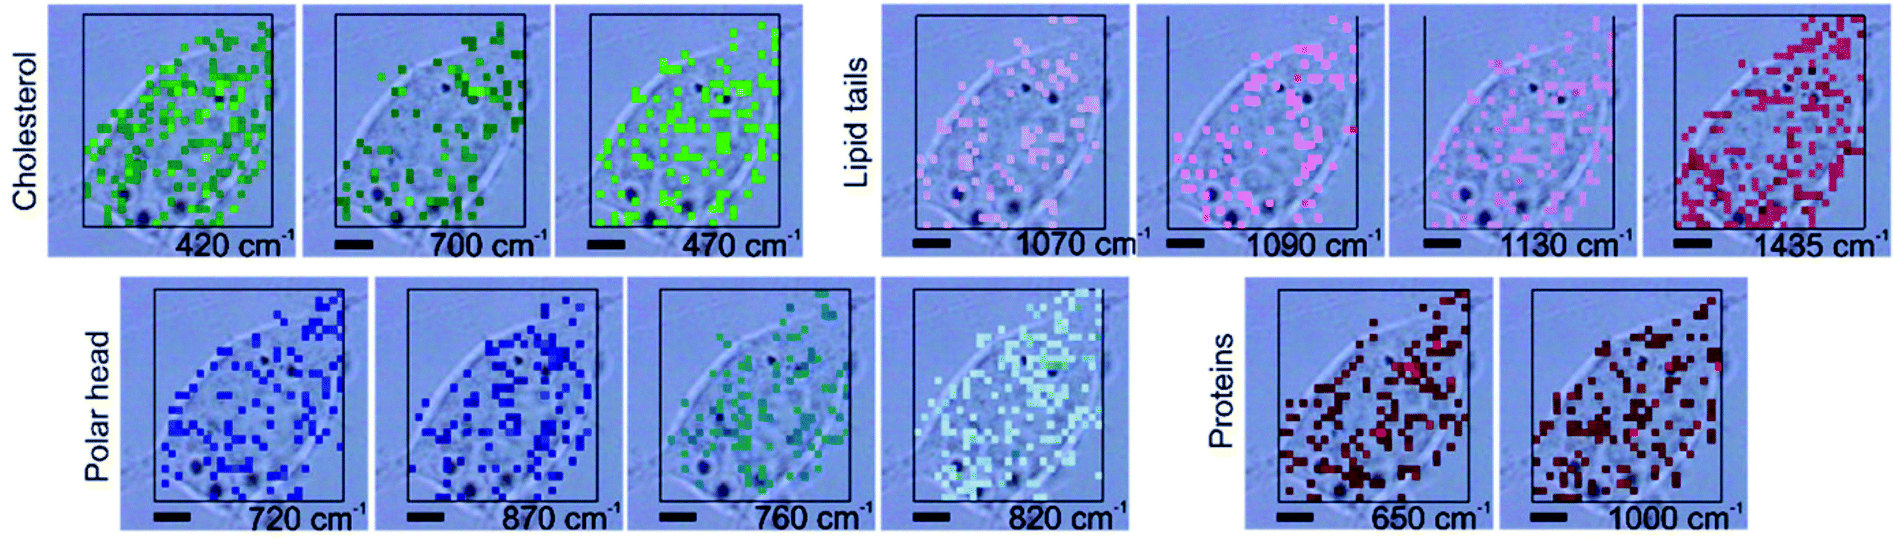 | ||
| Fig. 2 Distribution of characteristic SERS signals related to the components of the cellular membrane in a cell grown on a gold nanoisland substrate, where the cell membrane can be probed selectively, overlaid with a bright field image of the cell. Chemical images are generated by mapping the intensity of the bands at 420 cm−1 and 700 cm−1 assigned to cholesterol, 720 cm−1 and 870 cm−1 to C–N stretching of choline group, 760 cm−1 to the ethanolamine group in phosphatidylethanolamine, 820 cm−1 to phosphate group in phospholipids, 1070 cm−1, 1090 cm−1, and 1130 cm−1 to C–C stretching of lipid tails, 1435 cm−1 to CH2, CH3 deformations of alkyl chains, 650 cm−1 to C–S stretching in proteins, 1000 cm−1 to phenylalanine. All scale bars: 5 μm. Reproduced with permission from ref. 61, Copyright 2021 American Chemical Society. | ||
Probing specific constituents of the plasma membrane can provide information about the general physiological condition of the cells. Phosphatidylserine, a plasma membrane lipid, is usually located in the inner leaflet of the plasma membrane, but is translocated to the exterior leaflet during apoptosis. Cells subjected to electrical stimulation show this translocation, which was probed using zinc based metal organic frameworks decorated with gold nanoparticles, where zinc is able to interact with the phosphate head groups of the lipid membrane.63 Following the increasing 1152 cm−1 band related to phosphatidylserine and the decrease of a phosphate signal with increasing applied voltages, the effect is greater for cancerous cells when compared to non-cancerous cells.63 The phosphatidylserine in the outer membrane leaflet can also interact strongly with silver cations, and an in situ reduction by hydroxylamine generates a highly localized SERS probe that allows the characterization of the membrane composition during the apoptotic process.64
Gold nanostars functionalized with a known peptide sequence that targets αvβ3 integrins, transmembrane proteins involved in activating intracellular pathways and common drug target, restrict the formation of a protein corona around the particles and can therefore probe the binding interaction and other biomolecules in the immediate surroundings.65 This specific system can also be exploited to track the protein–particle tandem movement at the cell surface.66
3.2 Exploring endolysosomal pathways
The most common active route for incorporating metallic nanostructures into living cells is endocytosis, where particles remain enclosed in vesicles and transit the intracellular space through the endolysosomal pathway. Usually, the diversity of biomolecules in the endolysosomal compartments can be probed by SERS spectroscopy, even in real time,67,68 as the molecules access the nanoparticle surface, known to happen to different extent for different nanoparticle materials.54,55,69 With a so-called ‘pulse-chase’ strategy, where cells are incubated with nanoparticles for a certain period of time (‘pulse’), and then are incubated in fresh medium until further measurements (‘chase’), it is possible to probe selectively the biomolecular environment of particles in vesicles of a specific age, along the endolysosomal pathway.70–72 The composition of endolysosomes varies for the different stages, cell lines, and incubation conditions.39,40,70,72,73 The actual intraendosomal probing, rather than probing of the cytosol, is indicated by the higher abundance of signals related to hydrophobic protein residues and lack of bands due to protein backbone vibrations, as was found by collecting the spectra of isolated cytoplasm.74 Specific biomolecules can be monitored in endolysosomal vesicles, depending on the function of particular endosomes and because of the dynamic composition, e.g., due to interaction and fusion with other vesicles. Particularly lysosomes, where biomolecules are degraded, have been studied. In addition to protein fragmentation that was observed in vivo in the cells,73 endolysosomal lipid metabolism was characterized in diseased cells, e.g., by fusion of endolysosomes with vacuoles that contain parasites,75 or the inhibition of enzymes in lipid breakdown.13The dependence of the endolysosomal spectra were very obvious in experiments with cells from different cell lines incubated with gold nanostars, due to the cell line specific processing of these nanoparticles.39,40 In HCT-116 colorectal cancer cells, we found a higher abundance of amide III and lipids related bands, while 3T3 fibroblasts presented more signals from aromatic amino acid side chains, together with disulfide and carbon sulfide bands (Fig. 3A and B).40 Such differences in particle processing are already observed for short incubation times, as was studied for the non-macrophage cell lines 3T3 and HCT-116, and J774 macrophages.39 One common trend in the SERS spectra of these cells incubated with nanostars is that depending on nanostar morphology, specifically the tip length, interaction with the surrounding intracellular biomolecules is quite different: for increasing tip length, SERS spectra show a higher abundance of lipid related bands and fewer protein related bands (Fig. 3C).39,40 Possible different active uptake processes in cells give rise to different SERS spectra not only from the different proteins and lipids of the vesicles, but also from differences in the culture medium and the protein corona that is formed.73,76
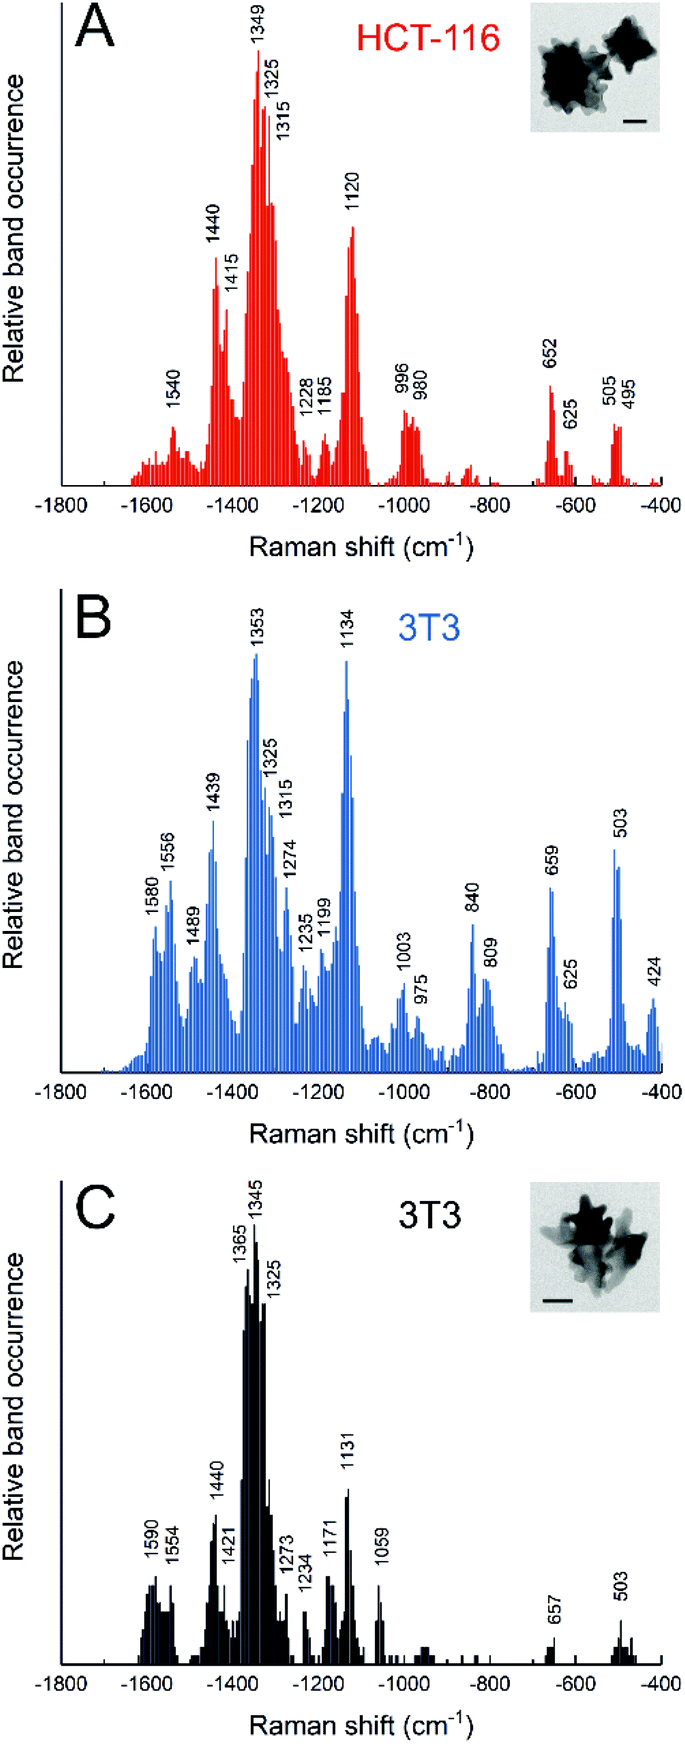 | ||
| Fig. 3 Relative band occurrence in SERS spectra from (A) HCT-116 cells incubated for 24 h with gold nanostars synthesized with 25 mM HEPES; (B) 3T3 cells incubated for 24 h with gold nanostars synthesized with 25 mM HEPES; (C) 3T3 cells incubated for 24 h with gold nanostars synthesized with 75 mM HEPES. Insets: TEM micrographs of gold nanostars synthesized with 25 mM HEPES (A) and 75 mM HEPES (C) that were shown to have different tip length. Adapted from ref. 40 with permission from the Royal Society of Chemistry. Copyright 2020 RSC. | ||
Autophagy is a self-regulated process in cells, where specific vesicles engulf damaged organelles or other biomolecules and direct them to the lysosome for degradation. This process is amplified in response to unfavorable conditions such as starvation, and may lead to cellular death. Fucoidan, a natural occurring polysaccharide, is a promoter of autophagy and can be used as a reducing agent to synthesize gold nanoparticles.77 Using the particles as SERS probes, the transit from uptake to autolysosome formation and cellular death can be followed by the different bands observed in the spectra over time.77 Autophagy associated vesicles can be selectively probed via SERS, with Ag@Au core–shell nanoparticles that induce autophagy and inhibitors of the formation of different fusion vesicles along the process.78 Lysosomes can be extracted from cells and the activity of the degradation proteins induced by depletion of glucose, emulating a digestive step in an autophagic process.79 SERS spectra obtained from the interaction of the outer region of these vesicles with gold nanorods show protein and lipid structural bands that suggest an active degradation of these biomolecules.79
SERS of living cells benefits greatly from using nanostructures whose surface is accessible for the surrounding molecules. The composition of the particular cell culture medium plays an important role in the formation of the biomolecular corona, with different composition and stability of the adsorbed species on different nanoparticle materials.69 Changes in the composition alter the uptake efficiency.76,80 The success in probing the intracellular environment in this case depends greatly on whether and which molecules are used for potential functionalization, how they change the uptake dynamics and how accessible the particle surface remains.58,81,82 Cells incubated with gold nanoparticles functionalized with polyadenine show different interactions within the same incubation period as non-functionalized particles.81 While the bare gold nanoparticles interact mainly with lipids after 4 h, and for longer incubation times lipid bands decrease and protein and nucleic acid related bands increase, functionalization with polyadenine results in a decreased interaction with lipids at shorter times and faster appearance of protein related bands in the spectra, suggesting that this functionalization facilitates cellular uptake of nanoparticles and induces a faster formation of endosomes.81 Composite Au@BaTiO3 nanoparticles that are synthesized in the presence of polyvinylpyrrolidone (PVP) benefit from lipid coating before delivery into cells for SERS probing,58 since it increases their biocompatibility and uptake by the cells.
3.3 Challenges in targeting the nuclei
In order to probe organelles other than endolysosomal vesicles or the outer cell membrane, particles have to be functionalized with targeting molecules that the cell can recognize for trafficking the particles to a specific location. The basic concept of targeting has been known for four decades, and was also proven by using gold nanoparticles that at that time were visualized by electron microscopy.4 Localization sequences are small peptides of cellular or viral origin that the cell identifies as directors for trafficking proteins to the targeted organelle. For delivery of nanostructures to the nucleus, nuclear localization sequences (NLS) can be used.46,47,82–84 In recent work we found that, when gold nanoparticles were functionalized with adenoviral and simianviral NLS, their actual entry into the nucleus occurs only for specific time sequences in a ‘pulse-chase’ experiment, but not for any incubation condition.82 Combined SERS and electron microscopy data indicated that the nanoparticles are processed differently in the endolysosomal system when they carry an NLS, even when they do not undergo endosomal escape.82 In the situation where endosomal escape does not take place, the endosomal molecular composition and interaction of the modified gold nanoparticles resembles that of unmodified nanoparticles. At the same time, the SERS spectra indicated special molecular properties of the intracellular agglomerates, which was related to their ‘attempt’ to engage in endosomal escape. For nanoparticles that made it into the nucleus, bands related to nucleic acid vibrations, such as thymine at 753 cm−1 or cytosine and adenine at 1246 cm−1 appeared more often.82 These combined SERS and electron microscopy experiments show that optimum incubation conditions for nuclear localization must be identified in order to utilize SERS signals from the nucleus. Experiments that can reveal the interaction of SERS nanoprobes with the cells at the level of the cellular ultrastructure, particularly electron microscopy and nanotomography based on X-ray microscopy have proven indispensable for understanding and controlling the targeting of organelles.7,82SERS spectra from the nucleus can probe changes that occur when cells undergo specific treatments or programmed cell death. The effect of hyperoxia in mouse lung fibroblasts cells,85 and cell damage upon UV irradiation84 were followed by SERS in the nucleus, using gold nanocubes with NLS. Interestingly, cancerous cells exposed to UV-C irradiation show an increase of a band assigned to C–S vibrations of gluthatione, indicating that the cells counteract reactive oxygen species, while control cells undergo apoptosis and cannot recover.84
Gold nanostructures, particularly nanorods have also been tagged with localization sequences for transport to the nucleus, with special interest in their further application for photothermal treatment.47,83,86 At the same time, their SERS can be used as reporters on the apoptotic processes that are induced during such treatment. As examples, murine melanoma cells underwent photothermal treatment using gold nanorods functionalized with both NLS and a cancer-cell specific peptide, and SERS data taken over time showed denaturation of proteins, oxidation of phenylalanine and DNA degradation in the constituting nucleic acids.46 Moreover, decrease in intensity of protein related bands, as well as bands also associated with lipids and lipid head groups were reported, all suggesting apoptosis-related protein denaturation and lipid degradation.87 The photothermal properties of the theranostic nanostructures can be further optimized by using combined plasmonic and other nanomaterials, such as porous Ag/Au bimetal nanoshells decorated with carbon dots.83
SERS signals from the nuclear region of cells, albeit not by intranuclear probes, have also been reported to be possible by membrane penetration, without the use of localization sequences. A multielectrode array of gold pillars was used to perform in situ electroporation of cells in contact with the substrate, and posterior SERS measurements indicated many changes in intensity for lipid and protein related bands, but also for DNA and RNA related bands, both from the nucleobases and from the backbone phosphate bonds of the chains, suggesting that intact nucleic acids were probed.88 Similarly, gold nanostars adsorbed on a PVP film were found to report on composition of the intracellular space.89 For positions close to the nucleus, bands related mainly to DNA and RNA were observed, while when far from the nucleus signals from proteins and lipids became more prominent.89
3.4 SERS from mitochondria
Nanorods functionalized with a mitochondria localization sequence were also used for SERS probing, showing spectra with contributions of bands related to proteins, lipids, and some nucleobases.47 Moreover, functionalization with triphenylphosphine also allows the targeting of mitochondria, since this lipophilic cation has been shown to accumulate in the mitochondrial membrane.90,91 Gold particles functionalized with this cation were used to study the biomolecular changes in mitochondria during photothermal or chemical treatments that induce apoptosis, following bands related to cytochrome c, proteins and lipids.92 The main changes during photothermal treatment or incubation with chemical inhibitors of different dehydrogenase kinases were observed for the cytochrome c and disulfide bond bands.92 The response to photothermal treatment using mitochondria targeted particles was found to vary for different cell lines.83 HeLa cells showed damage mainly at the protein level, with the main changes found in amino acid related bands, while L929 and H8 cells showed changes in signals assigned to nucleobases, suggesting DNA damage.83The verification that targeting of specific cellular organelles by SERS nanoprobes has been one of the main challenges faced by sub-cellular applications of SERS. Often, the plasmonic properties of the nanostructures are visualized by dark field microscopy, as they provide strong scattering signals, nevertheless, inspection of their cellular surroundings is difficult.93–95 Therefore, sufficient co-localization of the scattering signals with the organelles is often not clear, even when large compartments of the cell, such as the nucleus are targeted. Ultrastructural imaging, such as electron microscopy and X-ray tomography must be used to attain precise co-localization of nanoparticles with respect to the membranes of cellular compartments.7,82
4. SERS of molecular models improves our understanding of intracellular SERS
While the spectra from pure molecules carry detailed information about their structure and interaction with plasmonic nanostructures, different signal strengths observed for different molecular species can complicate the extraction of clear spectral signatures from the SERS data of the cells. Therefore, appropriate models must be identified for both, the experiments and the data analysis. Variations in SERS enhancement necessitate –very similar to other single cell experiments– the collection of statistically significant amounts of data in order to address cell-to-cell variation and/or variation between samples. The variation of non-resonant Raman cross sections for different types of molecules by orders of magnitude, and of selective molecule–metal interactions with a particular SERS substrate render some molecules undetected in the cellular multicomponent systems. As was shown, spectra of suitable molecular models including proteins, lipids, nucleic acids, and drugs ameliorate this SERS-specific problem and can be used to better understand and interpret the data of complex biomaterials where different molecular species co-occur and interact. The variety of SERS signals that are probed in cells and their organelles presents a broad picture of the biomolecules and important biomolecule functional groups that interact with the surface of the enhancing nanostructures. However, the assignment of specific bands and their presence or absence under different incubation conditions for the cells is not enough to properly interpret and understand the cellular molecular processes that may be taking place. Reducing the complexity of the biological system to focus on particular biomolecules or functional groups and their different possibilities of interactions with the metallic nanostructures was shown to be extremely helpful to obtain a more detailed picture of intracellular processes. As will be discussed, this can help to understand, for example, the composition and structure of the protein corona of nanoparticles in living cells73,74 and the impact of incubation time and cell line in the processing of nanostructures in the case of proteins,39,40 the inhibition of lipid degradation and accumulation in vesicles,13,96 and DNA degradation in cancer cells upon electrical stimulation induced apoptosis.224.1 SERS of proteins
Protein models can be used for investigating the biomolecule–nanoparticle interaction and the properties of the protein corona. Although the SERS spectra of a protein–nanoparticle mixture might still show a great variety of signals, and therefore point at a variety of interactions that can be probed, using well studied proteins reduces the difficulty of band assignment and helps to understand at a molecular level the main functional groups involved in the interactions. Proteins such as bovine serum albumin (BSA) and human serum albumin, of similar properties, show quite distinct SERS spectra, which indicates that the functional groups involved in the interaction with the gold particle surface are quite different.97 It was shown that the relative concentrations of proteins and nanoparticles strongly affects their interaction with gold nanoparticles. Decreasing the protein-to-nanoparticle ratio results in increased presence of SERS signals related to aromatic amino acid side chains and sulfur containing groups, both usually buried in the protein structure, suggesting that the interaction results in protein unfolding.98 Therefore, in order to apply spectra from molecular models, a broad range of experimental conditions, ideally adapted to those found in the actual biological environment in the cell must be investigated. Experiments were reported for conditions that enable the distinction of different situations occurring in a real cell, e.g., the presence and absence of enzymes that may digest proteins.74 The interaction of nanoparticles with proteins or protein fragments shows important distinctions in the SERS spectra, where co-occurrence of bands related to vibrations of specific functional groups gives information about the protein integrity in situ (Fig. 4A and B).74 The presence of bands related to disulfide bonds can be seen as an indicator of a stable secondary structure of the interacting protein, but they must be analyzed in concomitance with the presence or absence of bands related to hydrophobic groups, whose exposure suggests denaturation, and of bands related to amide bonds, all of which denote the integrity of the protein structure (Fig. 4B).74 Such model data also formed the basis for an interpretation of the SERS spectra of the protein corona on gold nanostructures in the endolysosomal system of different cell lines.73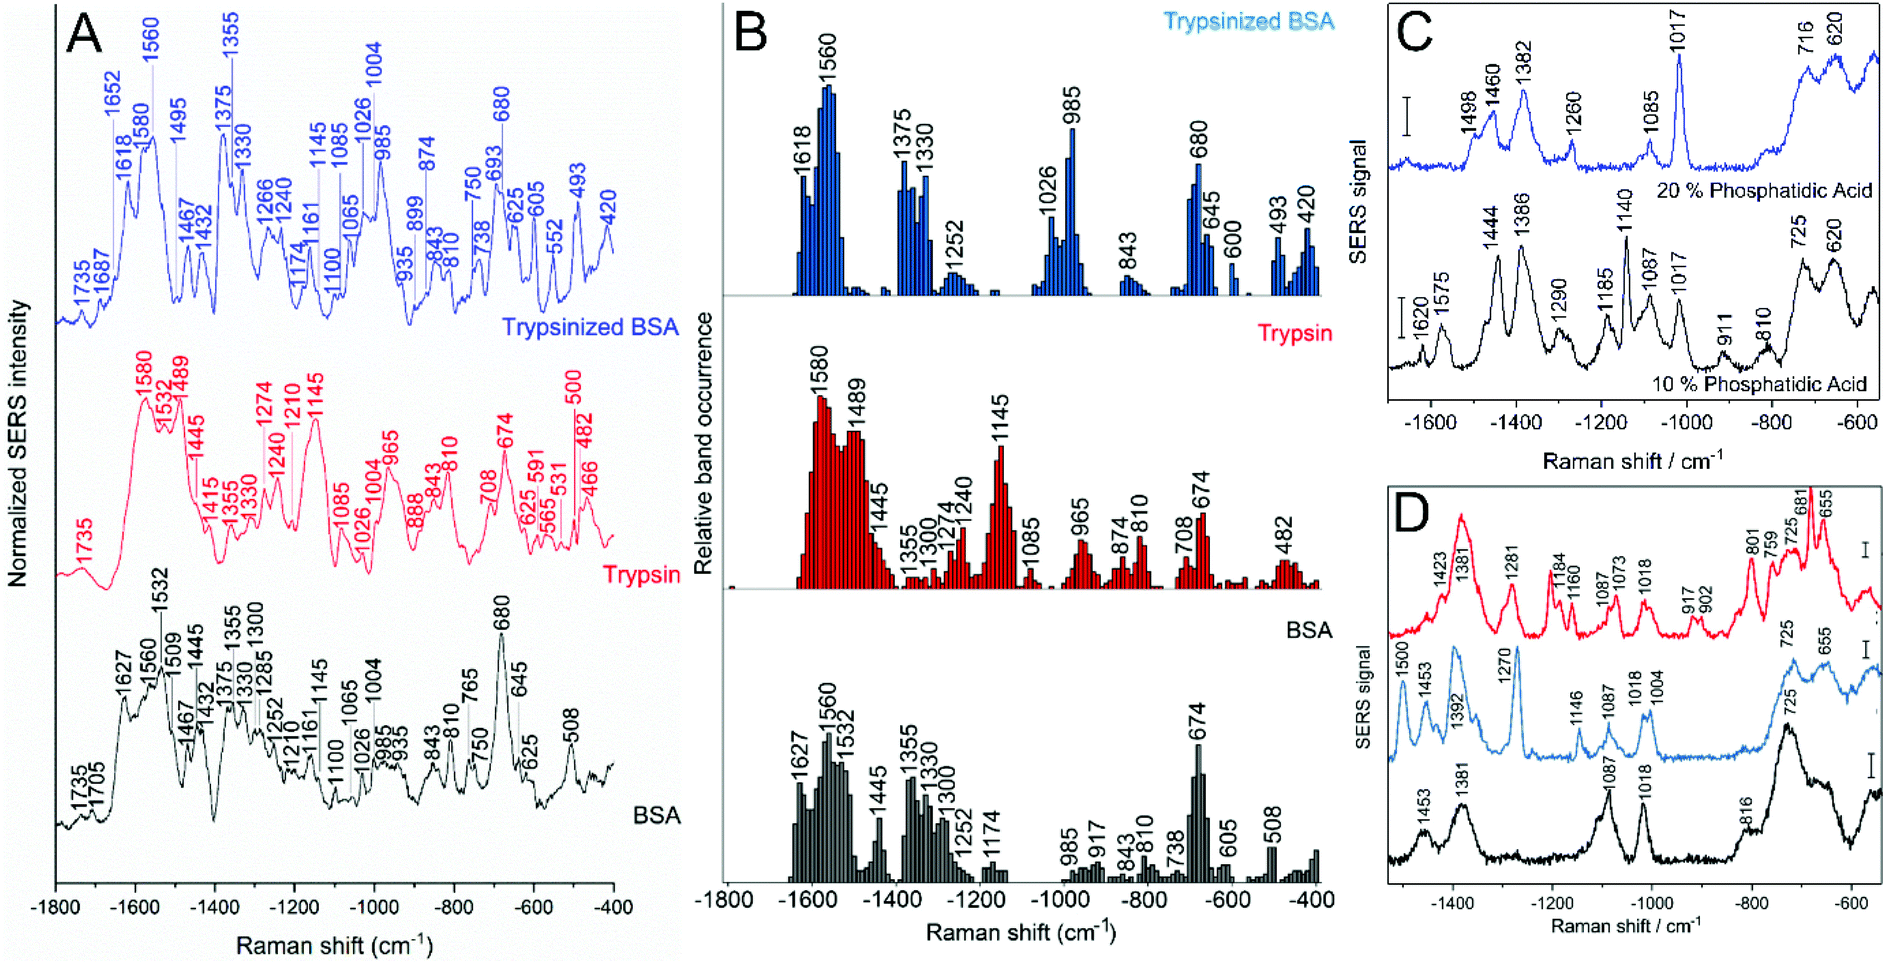 | ||
| Fig. 4 (A) Average spectra and (B) relative band occurrences in the SERS spectra of BSA (gray), trypsin (red) and trypsinized BSA (blue) in the presence of gold nanoparticles. Both averages and band occurrences were based on ∼100 SERS spectra per sample. Reprinted with permission from ref. 74. Copyright 2020 American Chemical Society. (C) Representative SERS spectra of citrate-stabilized gold nanoparticles and liposomes of different composition: 10 mol% phosphatidic acid, 10 mol% sphingomyelin, 20 mol% cholesterol, 60 mol% phosphatidylcholine (blue), and 20 mol% phosphatidic acid, 10 mol% sphingomyelin, 20 mol% cholesterol, 50 mol% phosphatidylcholine (black). Scale bars: 20 cps. Reprinted with permission from ref. 144. Copyright 2019 SPIE. (D) Representative SERS spectra of citrate-stabilized gold nanoparticles and liposomes of defined composition (10 mol% sphingomyelin, 20 mol% cholesterol, 70 mol% phosphatidylcholine) prepared using thin layer hydration and mixed under different conditions: liposomes hydrated with nanoparticles solution (black), liposomes mixed after hydration with nanoparticle solution (blue) and liposomes hydrated with nanoparticle solution after removal of excess citrate ions (red). Scale bars: 20 cps. Reprinted with permission from ref. 96. Copyright 2018 American Chemical Society. | ||
An analysis of the protein BSA at the single molecule level by SERS shows that a change in pH leads to changes in protein secondary structure, from a predominantly α-helical structure at pH 7 to an increase in the contribution by β-sheet and random coil at pH 3.99 Together with the analysis of the co-occurrence of bands related to specific amino acids, a more complete view on their distribution and environment both related to the protein structure and their interaction with the gold surface can be achieved.99,100 Bands related to specific amino acids and protein functional groups were also found in lysozyme SERS spectra obtained from the protein interacting with a gold nanostructured surface, where the protein–metal interaction was indicated to occur mainly through carboxylate and amine functional groups of aspartic acid and arginine, respectively, together with histidine and phenylalanine.101 Vibrations of disulfide bonds also appear in the SERS spectra, and their relative positions give information about the conformation of the bond related to the respective neighboring amino acids.101
Similar to the example of trypsin shown in Fig. 4A and B, also other proteins may have an enzymatic role that can result in chemical or conformational changes of themselves or their substrates. These changes, directly or indirectly, will reflect in the SERS spectra. As an example, extracellular protein kinase A (PKA) activity could be followed using BSA covered gold nanostars functionalized with a PKA-specific recognition peptide substrate.102 In the spectra, the bands at 725 cm−1, assigned to a C–S stretching vibration, and at 1395 cm−1, assigned to NH in-plane deformation, changed with the phosphorylation of the recognition peptide, and their ratio was used as indicator of PKA activity.102 Although the bands are not assigned to the phosphate group itself, the authors suggested that a changed charge of the phosphorylated group of the recognition peptide enables new interactions with BSA that translate to changes in its SERS spectra.102 In a similar way, conformational changes of a (prokaryotic) endonuclease that occur when this enzyme binds to Mg2+, resulting in promiscuous activity, or to Ca2+, enabling highly specific cleavage of DNA can be observed in SERS spectra of the enzyme.103 The interaction with silver nanoparticles that are used as SERS substrate does not result in a loss of enzyme activity.103 The authors report appearance of an amide I band associated to random coil secondary structural elements in the presence of Ca2+, that they do not observe under other conditions, and corroborated the result with molecular dynamics simulations.103
The potential of SERS spectra to reveal changes in protein secondary structure based on specific components of the amide I band and also the amide III region is illustrated in in vitro studies of BSA and myoglobin104 and of amyloid β fibrils under different conditions, respectively.105,106 Although these particular proteins may not be representative as common intracellular components, the sensitivity of gold-nanostructure based SERS spectra with respect to changes in the intramolecular interaction illustrates the potential of intrinsic protein SERS to characterize protein structure in living cells.
4.2 Local spectroscopic probing of membranes and lipids
Understanding lipid interactions and membrane structure is paramount for a complete characterization of live cells. Lipids and an affected lipid metabolism play an important role in a vast range of pathologies, and lipids are a major constituent of the molecular environment of animal cells. There are several pathologies that are characterized by a high local abundance of lipids, including metabolic disorders107 as well as parasite infections75 and certain models of neurodegenerative disease.108 The Raman characterization of lipid molecules carries an inherent difficulty due to the low Raman cross-section of this type of molecules109 and specifically for SERS the low affinity of lipid molecules for the surface of gold nanoparticles in an aqueous environment.110 Using plasmonic nanoparticles to enhance Raman signals allows to probe these biologically relevant molecules, and even to achieve single molecule resolution.111 Lipids can organize in bilayer membranes or liposomes, and these organizational interactions can also be probed via SERS. When gold nanoparticles are used, ionic strength and pH of the colloid becomes a major determinant of the lipid–lipid and lipid nanoparticle interaction, and ‘scrambled’ lipids or intact liposomes offer different SERS spectral signatures (Fig. 4C and D).96 SERS spectra of intact phosphatidylcholine liposomes interacting with the gold surface show not only a strong interaction via the choline head groups, but also that the head group has a specific conformation geometry in the interaction.96 Moreover, when studying the interaction with cholesterol containing liposomes, differences in the acyl chain related bands indicate a more disordered lipid conformation (transition from trans to gauche), as opposed to liposomes without cholesterol.96 A similar behavior was observed when using gold nanoislands SERS substrates to probe the interactions in liposomes of different composition with and without cholesterol.61 Another strategy relies on the formation of lipid layers surrounding each particle, aided by a functionalization with hydrophobic molecules such as octanethiol.112,113 As expected from the plasmonic coupling that occurs upon nanoparticle aggregation, aggregated particles with a phospholipid layer show a higher enhancement than individual particles, and changes in lipid order as a function of membrane composition and temperature can be followed by SERS.113 When the gold nanoparticles are small enough to fit the intralamellar space of liposomes, an octanethiol functionalization can direct them there, and they selectively enhance signals due to vibrations of the acyl chains.112 Cetyltrimethylammonium bromide (CTAB), a typical surfactant used in the synthesis of gold nanorods, can be displaced from the nanostructures’ surface by lipids, and a lipid bilayer can form around such particles without the need of further functionalization.114 SERS spectra reveal the dynamics of these membrane structures and indicate that lipid exchange occurs between the bilayer around the nanoparticles and vesicles contained in the same solution.114 A similar result was observed for lipid bilayers that had been formed on silver films-over-nanospheres (AgFON) where the lipid exchange was proven by the appearance of bands related to deuterated molecular groups.1154.3 DNA/RNA
It is widely known that DNA adopts a double helix structure, aided by the complementary pairing of nucleobases. However, when DNA is single stranded, for example during replication or transcription, depending on the sequence the biomolecule can fold onto itself forming different structures that have implications in biological processes and diseases. Such structural behavior of DNA can be accessed via SERS,116,117 in addition to detecting DNA pairing mismatch at the single nucleotide level,118,119 and quantifying nucleobases in a specific sequence.120,121 Surface chemistry and charge of the colloids takes an important role in the adsorption of DNA and, consequently, in the quality and features of the SERS spectra obtained.122,123 While single stranded or double stranded DNA cannot be distinguished when using negatively charged particles, the electrostatic interactions between the phosphate backbone and positively charged species in the metal surface can allow it.122 Spectral variations in the position of bands affected by hydrogen bond formation serve as indicators of the formation of double stranded DNA when compared to single stranded DNA spectra.118 Structural changes such as the ‘unzipping’ of hybridized DNA promoted by the biomolecule–nanoparticle interaction,123 or the formation of G-quadruplex secondary structures due to repetitive guanine sequences and their interaction with the metal surface116 can also be identified from SERS spectra. Since highly sensitive SERS-based nucleic acid analysis has been pursued for over two decades, it must be noted here that all these approaches utilize the intrinsic SERS signals of the nucleic acid molecules themselves, without further molecular labels.Also the structural analysis of RNA molecules is gaining interest, since new roles of RNA in biological processes and treatments are being discovered. Here, many of the same concepts found for SERS studies of DNA apply, such as the benefits of using positively charged surfaces or the base pairing assessment by band shifts related to hydrogen bond formation.124,125
5. SERS data and machine learning: information on molecular composition, structure, and interaction
The high sensitivity of SERS in the dynamic and complex environment of cellular compartments leads to fingerprint-like spectral data. Average spectra from such samples, e.g., individual cells, combine the molecular information from different spots and subcellular structures and are quite reproducible for particular experimental conditions. On the other hand, individual spectra must be analyzed in order to observe a particular molecular composition in defined subcellular locations, such as different endosomal structures, different regions of the cell membrane, or in the nucleus. Due to the nature of the SERS effect, different signal strengths or altered interactions with the plasmonic nanostructures that act as SERS substrate may complicate the extraction of clear spectral signatures from the SERS data. Varying relative intensities can be compensated for by converting the spectra to ‘bar codes’, neglecting absolute or relative signal strengths and simply analyzing the occurrence and co-occurrence of specific bands.10,71,74,126 Although band occurrence patterns are often in good agreement with average spectra, they are better suited to identify signals that are found only in very few individual spectra, that are weak, or that vary greatly in position due to the highly localized probing that occurs in SERS.The SERS spectral contributions from different types of cellular biomolecules, as well as from drugs or other molecules may be retrieved in multivariate data analyses. Usually, the SERS spectra from cells are not interpretable at a quantitative level, but qualitative information can be extracted from them. While different types of variance are identified in a principal component analysis (PCA), the analysis does not necessarily lead to data reduction, and the portion of variance covered by each principal component will be much lower than in a typical PCA of normal Raman or infrared microspectroscopic data. Machine learning tools such as artificial neural networks deep learning and random forests can be used for pre-selection of data and to support and precede e.g., a hierarchical multivariate analysis.
The application of machine learning approaches to SERS data ranges back until about a decade ago, when both, unsupervised multivariate classification,31,126–128 as well as supervised machine learning tools, including artificial neural networks,129,130 support vector machines,131,132 and lately also random forests13,133,134 were proposed for the classification of SERS spectra of biodiagnostic samples. Random forest analyses as machine learning approaches that use a large number of binary decision trees have shown great potential in first applications to intrinsic SERS spectra from cells.13,134 Random forest approaches can be used towards different goals: (i) attaining classification, (ii) regression, and (iii) the selection of variables that enable a certain classification. Classification by random forests can be employed for the selection of specific types of data, e.g., all spectra of a specific signal-to-noise. They can also be used to identify so-called important variables in a data set that lead to the discrimination of different groups of SERS spectra.
In order to learn more about the molecular interactions and co-localization of molecules that take place in the cells, and that may lead to discrimination of spectra, relations of the selected important variables with other, related variables can be investigated.134,135 As an example, such an analysis was used to study the interaction of tricyclic antidepressant molecules that induce the accumulation of lipids in endolysosomes of cell lines treated with the drugs (cf.Fig. 1).13 Although the SERS spectra of the tricyclic antidepressant molecules have been studied outside of cells,14,136 typical multivariate tools failed to identify differences between drug-treated and untreated cells. The use of random forests helped to identify important variables in large data sets of thousands of spectra from different cellular regions obtained for different incubation conditions, as well as other variables that relate to them.13 Important variables, characteristic of the drugs, were related to variables/bands assigned to lipid or protein molecules, indicating their co-occurrence in the spectra. The co-occurrence with the lipid molecules proved a hypothesis that the tricyclic antidepressant drugs interact with the lysosomal membrane, probably via electrostatic interactions. Furthermore, the spectra indicated that the composition and interactions of proteins in drug treated cells changed significantly.13
The assignments of important variables, or the identification of classifiers in eigenspectra or loadings in a PCA, to specific molecular vibrations that are characteristic of particular compounds or their particular interaction with the SERS substrate, is only possible by analyzing spectra of model compounds. In the example of the drug-induced lipidosis these are spectra of lipid vesicles (cf.Fig. 4D)96 or drug solutions.14 Of course, the large variability of ‘specific’ SERS spectra, also upon small variations of experimental conditions, requires comprehensive model data sets that must represent relevant aspects of the interactions in the complex bio-environment.74,137,138 The acquisition and utilization of such relevant model data has been achieved in other analytical applications of SERS recently139,140 and can be translated to problems in cellular biochemistry as well. Specifically, the combination of many different SERS spectra of a particular compound obtained under varied conditions and chemical interactions into ‘superprofiles’ yields robust statistical models and compound identification and analysis140 that may also be crucial for the detection of inconspicuous biomolecular species in cells. Solutions to the possibly immense combinatorial problems that are posed when trying to establish a sound model data set can also lie in machine-based optimization approaches, e.g., in multi-objective evolutionary optimization as shown by Goodacre and colleagues more than a decade ago,11,141 or for choosing optimal SERS substrates for the experiments.142 The prediction of SERS spectra for different interactions of molecules beyond atomistic electrodynamic and quantum mechanical approaches, using random forests, has been attained as well,143 an approach that may become very useful for studies of particular functional groups such as protein side chains with SERS nanoprobes. Fig. 5 summarizes the different roles taken by machine learning based data analysis, and illustrates the connections between the different types of data that are needed.
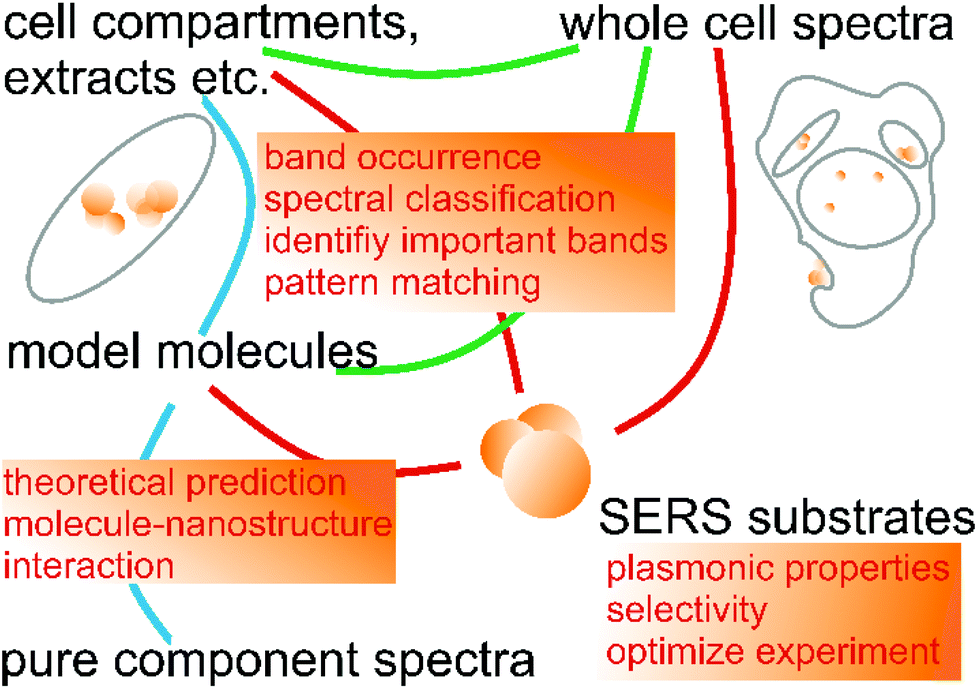 | ||
| Fig. 5 Summary of the different roles taken by machine learning based data analysis (orange boxes) of SERS spectra from systems that have a different degree of complexity, together with connection between the different types of experiments. Understanding of spectra from intact cells is improved by spectra from defined cellular components and model molecules. The latter rely on optimized plasmonic nanostructures, and on an understanding of molecule–nanoparticle interactions that can be based on theoretical predictions. | ||
6. Conclusions
The analysis of SERS data from biological cells appears less ‘straightforward’ than that of other vibrational data, because of several challenges that must be addressed in each individual application. Most of them are related to the use of a plasmonic substrate and its interaction with the complex biological system, specifically an assessment of selectivity, including the (verification of) successful targeting of specific parts of the biosystem, and the probing of multiple analyte species. Nevertheless, the success in using it to elucidate processes in cells illustrates that strategies can be found to fully make use of the high sensitivity and the selectivity. To understand biomolecular composition and interaction in a cell, machine learning must include an interpretation of potential classifiers. This requires information from relevant model systems that may have varying SERS profiles depending on their interaction with the SERS substrate and with other molecules. Such models can be parts of the complex system: individual molecular species, particular classes of molecules, obtained under experimental conditions that represent those in the cell with respect to interactions and composition, or purified cellular substructures. The latter represent complex ‘sub-systems’ as well and may help to evaluate the selectivity of a SERS substrate in the intact cell, or the success of targeting. Connecting the understanding of individual biomolecule–particle interaction in pure systems with that in whole cells is paving the way to an expansion of SERS for biotechnological applications, allowing not only for the structural characterization of intracellular assemblies but also for the interpretation of biochemical processes. The successful application of random forest based machine learning on SERS data from drug treated cells demonstrates that also cellular constituents with comparably weak spectral contributions can be detected. In addition to reliable spectral classification, SERS data can be used for different imaging procedures. The improved interpretation of automated classification results will constitute a major advancement in applications of SERS to biomolecule characterization, inside cells and elsewhere.Conflicts of interest
The authors declare no conflict of interest.Acknowledgements
The authors acknowledge collaboration and exchange with the co-authors of some of the work cited here, particularly D. Drescher, S. Seifert, G. P. Szekeres, and V. Zivanovic. Funding by Germany's Excellence Strategy – EXC 2008 – 390540038 – UniSysCat (C. S., J. K.) and ERC grant 259432 (J. K.) is gratefully acknowledged.References
- A. Beljebbar, G. D. Sockalingum, H. Morjani and M. Manfait, Proc. SPIE, 1999, 3608, 175–184 CrossRef CAS.
- K. Kneipp, A. S. Haka, H. Kneipp, K. Badizadegan, N. Yoshizawa, C. Boone, K. E. Shafer-Peltier, J. T. Motz, R. R. Dasari and M. S. Feld, Appl. Spectrosc., 2002, 56, 150–154 CrossRef CAS.
- S. E. J. Bell, G. Charron, E. Cortes, J. Kneipp, M. L. de la Chapelle, J. Langer, M. Prochazka, V. Tran and S. Schlucker, Angew. Chem., Int. Ed., 2020, 59, 5454–5462 CrossRef CAS PubMed.
- C. Feldherr, E. Kallenbach and N. Schultz, J. Cell Biol., 1984, 99, 2216–2222 CrossRef CAS PubMed.
- S. R. Panikkanvalappil, M. A. Mackey and M. A. El-Sayed, J. Am. Chem. Soc., 2013, 135, 4815–4821 CrossRef CAS PubMed.
- G. Schneider, P. Guttmann, S. Heim, S. Rehbein, F. Mueller, K. Nagashima, J. B. Heymann, W. G. Muller and J. G. McNally, Nat. Methods, 2010, 7, 985–987 CrossRef CAS PubMed.
- D. Drescher, T. Büchner, P. Guttmann, S. Werner, G. Schneider and J. Kneipp, Nanoscale Adv., 2019, 1, 2937–2945 RSC.
- G. Haberfehlner, A. Trugler, F. P. Schmidt, A. Horl, F. Hofer, U. Hohenester and G. Kothleitner, Nano Lett., 2015, 15, 7726–7730 CrossRef CAS PubMed.
- D. Zanaga, F. Bleichrodt, T. Altantzis, N. Winckelmans, W. J. Palenstijn, J. Sijbers, B. de Nijs, M. A. van Huis, A. Sanchez-Iglesias, L. M. Liz-Marzan, A. van Blaaderen, K. J. Batenburg, S. Bals and G. Van Tendeloo, Nanoscale, 2016, 8, 292–299 RSC.
- I. S. Patel, W. R. Premasiri, D. T. Moir and L. D. Ziegler, J. Raman Spectrosc., 2008, 39, 1660–1672 CrossRef CAS PubMed.
- R. M. Jarvis, W. Rowe, N. R. Yaffe, R. O'Connor, J. D. Knowles, E. W. Blanch and R. Goodacre, Anal. Bioanal. Chem., 2010, 397, 1893–1901 CrossRef CAS PubMed.
- A. P. Silwal and H. P. Lu, ACS Omega, 2018, 3, 14849–14857 CrossRef CAS PubMed.
- V. Zivanovic, S. Seifert, D. Drescher, P. Schrade, S. Werner, P. Guttmann, G. P. Szekeres, S. Bachmann, G. Schneider, C. Arenz and J. Kneipp, ACS Nano, 2019, 13, 9363–9375 CrossRef CAS PubMed.
- V. Živanović, F. Madzharova, Z. Heiner, C. Arenz and J. Kneipp, J. Phys. Chem. C, 2017, 121, 22958–22968 CrossRef.
- G. Kuku, M. Saricam, F. Akhatova, A. Danilushkina, R. Fakhrullin and M. Culha, Anal. Chem., 2016, 88, 9813–9820 CrossRef CAS PubMed.
- J. Zhang, X. Ma and Z. Wang, Talanta, 2019, 195, 8–16 CrossRef CAS PubMed.
- L. A. Austin, B. Kang and M. A. El-Sayed, J. Am. Chem. Soc., 2013, 135, 4688–4691 CrossRef CAS PubMed.
- P. Ma, L. Xu, L. Wang, N. Chen, X. Zhang, H. Chen and J. Li, Appl. Sci., 2019, 9, 3990 CrossRef CAS.
- R. Deng, H. Qu, L. Liang, J. Zhang, B. Zhang, D. Huang, S. Xu, C. Liang and W. Xu, Anal. Chem., 2017, 89, 2844–2851 CrossRef CAS PubMed.
- A. N. Ramya, M. M. Joseph, S. Maniganda, V. Karunakaran, T. T. Sreelekha and K. K. Maiti, Small, 2017, 13, 1700819 CrossRef PubMed.
- S. R. Panikkanvalappil, C. Garlapati, N. Hooshmand, R. Aneja and M. A. El-Sayed, Chem. Sci., 2019, 10, 4876–4882 RSC.
- G. Qi, D. Wang, C. Li, K. Ma, Y. Zhang and Y. Jin, Anal. Chem., 2020, 92, 11755–11762 CrossRef CAS PubMed.
- F. Lussier, D. Missirlis, J. P. Spatz and J. F. Masson, ACS Nano, 2019, 13, 1403–1411 CAS.
- V. Shalabaeva, L. Lovato, R. La Rocca, G. C. Messina, M. Dipalo, E. Miele, M. Perrone, F. Gentile and F. De Angelis, PLoS One, 2017, 12, e0175581 CrossRef PubMed.
- F. Lussier, T. Brule, M. Vishwakarma, T. Das, J. P. Spatz and J. F. Masson, Nano Lett., 2016, 16, 3866–3871 CrossRef CAS PubMed.
- F. Lussier, T. Brule, M. J. Bourque, C. Ducrot, L. E. Trudeau and J. F. Masson, Faraday Discuss., 2017, 205, 387–407 RSC.
- S. Stremersch, M. Marro, B. E. Pinchasik, P. Baatsen, A. Hendrix, S. C. De Smedt, P. Loza-Alvarez, A. G. Skirtach, K. Raemdonck and K. Braeckmans, Small, 2016, 12, 3292–3301 CrossRef CAS PubMed.
- J. C. Fraire, S. Stremersch, D. Bouckaert, T. Monteyne, T. De Beer, P. Wuytens, R. De Rycke, A. G. Skirtach, K. Raemdonck, S. De Smedt and K. Braeckmans, ACS Appl. Mater. Interfaces, 2019, 11, 39424–39435 CrossRef CAS PubMed.
- Z. Yan, S. Dutta, Z. Liu, X. Yu, N. Mesgarzadeh, F. Ji, G. Bitan and Y. H. Xie, ACS Sens., 2019, 4, 488–497 CrossRef CAS PubMed.
- N. Ferreira, A. Marques, H. Aguas, H. Bandarenka, R. Martins, C. Bodo, B. Costa-Silva and E. Fortunato, ACS Sens., 2019, 4, 2073–2083 CrossRef CAS PubMed.
- H. Shin, H. Jeong, J. Park, S. Hong and Y. Choi, ACS Sens., 2018, 3, 2637–2643 CrossRef CAS PubMed.
- H. J. Koster, T. Rojalin, A. Powell, D. Pham, R. R. Mizenko, A. C. Birkeland and R. P. Carney, Nanoscale, 2021, 13, 14760–14776 RSC.
- L. Ding, C. Yao, X. Yin, C. Li, Y. Huang, M. Wu, B. Wang, X. Guo, Y. Wang and M. Wu, Small, 2018, 14, e1801451 CrossRef PubMed.
- X. Xie, J. Liao, X. Shao, Q. Li and Y. Lin, Sci. Rep., 2017, 7, 3827 CrossRef PubMed.
- R. Garcia-Alvarez, M. Hadjidemetriou, A. Sanchez-Iglesias, L. M. Liz-Marzan and K. Kostarelos, Nanoscale, 2018, 10, 1256–1264 RSC.
- T. Bewersdorff, E. A. Glitscher, J. Bergueiro, M. Eravci, E. Miceli, A. Haase and M. Calderon, Mater. Sci. Eng., C, 2020, 117, 111270 CrossRef CAS PubMed.
- R. Lopes Rodrigues, F. Xie, A. E. Porter and M. P. Ryan, Nanoscale Adv., 2020, 2, 1144–1151 RSC.
- G. Wang, W. Wang, E. Shangguan, S. Gao and Y. Liu, Mater. Sci. Eng., C, 2020, 111, 110830 CrossRef CAS PubMed.
- C. Spedalieri, G. P. Szekeres, S. Werner, P. Guttmann and J. Kneipp, Nanomaterials, 2021, 11, 1183 CrossRef CAS PubMed.
- C. Spedalieri, G. P. Szekeres, S. Werner, P. Guttmann and J. Kneipp, Nanoscale, 2021, 13, 968–979 RSC.
- Anshup, J. S. Venkataraman, C. Subramaniam, R. R. Kumar, S. Priya, T. R. S. Kumar, R. V. Omkumar, A. John and T. Pradeep, Langmuir, 2005, 21, 11562–11567 CrossRef CAS PubMed.
- H. Huang, W. W. Chen, J. J. Pan, Q. S. Chen, S. Y. Feng, Y. Yu, Y. P. Chen, Y. Su and R. Chen, Spectrosc.-Biomed. App., 2011, 26, 187–194 CAS.
- Z. M. Liu, C. F. Hu, S. X. Li, W. Zhang and Z. Y. Guo, Anal. Chem., 2012, 84, 10338–10344 CrossRef CAS PubMed.
- A. Shamsaie, M. Jonczyk, J. Sturgis, J. P. Robinson and J. Irudayaraj, J. Biomed. Opt., 2007, 12, 020502 CrossRef PubMed.
- D. Drescher, H. Traub, T. Büchner, N. Jakubowski and J. Kneipp, Nanoscale, 2017, 9, 11647–11656 RSC.
- J. Yue, L. Liang, Y. Shen, X. Guan, J. Zhang, Z. Li, R. Deng, S. Xu, C. Liang, W. Shi and W. Xu, Front. Chem., 2018, 6, 665 CrossRef CAS PubMed.
- Y. Shen, L. Liang, S. Zhang, D. Huang, R. Deng, J. Zhang, H. Qu, S. Xu, C. Liang and W. Xu, ACS Appl. Mater. Interfaces, 2018, 10, 7910–7918 CrossRef CAS PubMed.
- N. Narayanan, L. V. Nair, V. Karunakaran, M. M. Joseph, J. B. Nair, A. N. Ramya, R. S. Jayasree and K. K. Maiti, Nanoscale, 2016, 8, 11392–11397 RSC.
- Y. Zhan, Y. Liu, H. Zu, Y. Guo, S. Wu, H. Yang, Z. Liu, B. Lei, J. Zhuang, X. Zhang, D. Huang and C. Hu, Nanoscale, 2018, 10, 5997–6004 RSC.
- Z. Liu, H. Chen, Y. Jia, W. Zhang, H. Zhao, W. Fan, W. Zhang, H. Zhong, Y. Ni and Z. Guo, Nanoscale, 2018, 10, 18795–18804 RSC.
- S. Z. Nergiz, N. Gandra, S. Tadepalli and S. Singamaneni, ACS Appl. Mater. Interfaces, 2014, 6, 16395–16402 CrossRef CAS PubMed.
- Y. Zhang, Y. Zou, F. Liu, Y. Xu, X. Wang, Y. Li, H. Liang, L. Chen, Z. Chen and W. Tan, Anal. Chem., 2016, 88, 10611–10616 CrossRef CAS PubMed.
- X. Jin, H. Li, S. Wang, N. Kong, H. Xu, Q. Fu, H. Gu and J. Ye, Nanoscale, 2014, 6, 14360–14370 RSC.
- T. Buchner, D. Drescher, V. Merk, H. Traub, P. Guttmann, S. Werner, N. Jakubowski, G. Schneider and J. Kneipp, Analyst, 2016, 141, 5096–5106 RSC.
- D. Drescher, I. Zeise, H. Traub, P. Guttmann, S. Seifert, T. Buchner, N. Jakubowski, G. Schneider and J. Kneipp, Adv. Funct. Mater., 2014, 24, 3765–3775 CrossRef CAS.
- B. Kang, L. A. Austin and M. A. El-Sayed, ACS Nano, 2014, 8, 4883–4892 CrossRef CAS PubMed.
- P. Pantazis, J. Maloney, D. Wu and S. E. Fraser, Proc. Natl. Acad. Sci. U. S. A., 2010, 107, 14535–14540 CrossRef CAS PubMed.
- F. Madzharova, Á. Nodar, V. Živanović, M. R. S. Huang, C. T. Koch, R. Esteban, J. Aizpurua and J. Kneipp, Adv. Funct. Mater., 2019, 29, 1904289 CrossRef CAS.
- C. Zhang, S. Siddhanta, D. Paria, Y. Li, C. Zheng and I. Barman, Small, 2021, 17, e2100161 CrossRef PubMed.
- A. Milewska, V. Zivanovic, V. Merk, U. B. Arnalds, O. E. Sigurjonsson, J. Kneipp and K. Leosson, Biomed. Opt. Express, 2019, 10, 6172–6188 CrossRef CAS PubMed.
- V. Zivanovic, A. Milewska, K. Leosson and J. Kneipp, Anal. Chem., 2021, 93, 10106–10113 CrossRef CAS PubMed.
- A. Milewska, O. E. Sigurjonsson and K. Leosson, ACS Appl. Bio Mater., 2021, 4, 4999–5007 CrossRef CAS PubMed.
- G. Qi, J. Wang, K. Ma, Y. Zhang, J. Zhang, W. Xu and Y. Jin, Anal. Chem., 2021, 93, 2183–2190 CrossRef CAS PubMed.
- H. Zhou, Q. Wang, D. Yuan, J. Wang, Y. Huang, H. Wu, J. Jian, D. Yang, N. Huang, C. Haisch, Z. Jiang and S. Chen, Analyst, 2016, 141, 4293–4298 RSC.
- S. Sloan-Dennison and Z. D. Schultz, Chem. Sci., 2019, 10, 1807–1815 RSC.
- C. D. L. De Albuquerque and Z. D. Schultz, Anal. Chem., 2020, 92, 9389–9398 CrossRef CAS PubMed.
- K. Bando, N. I. Smith, J. Ando, K. Fujita and S. Kawata, J. Opt., 2015, 17, 114023 CrossRef.
- J. Ando, K. Fujita, N. I. Smith and S. Kawata, Nano Lett., 2011, 11, 5344–5348 CrossRef CAS PubMed.
- D. Drescher, P. Guttmann, T. Buchner, S. Werner, G. Laube, A. Hornemann, B. Tarek, G. Schneider and J. Kneipp, Nanoscale, 2013, 5, 9193–9198 RSC.
- J. Kneipp, H. Kneipp, M. McLaughlin, D. Brown and K. Kneipp, Nano Lett., 2006, 6, 2225–2231 CrossRef CAS PubMed.
- T. Buchner, D. Drescher, H. Traub, P. Schrade, S. Bachmann, N. Jakubowski and J. Kneipp, Anal. Bioanal. Chem., 2014, 406, 7003–7014 CrossRef PubMed.
- A. Huefner, W. L. Kuan, K. H. Muller, J. N. Skepper, R. A. Barker and S. Mahajan, ACS Nano, 2016, 10, 307–316 CrossRef CAS PubMed.
- G. P. Szekeres, S. Werner, P. Guttmann, C. Spedalieri, D. Drescher, V. Zivanovic, M. Montes-Bayon, J. Bettmer and J. Kneipp, Nanoscale, 2020, 12, 17450–17461 RSC.
- G. P. Szekeres, M. Montes-Bayón, J. Bettmer and J. Kneipp, Anal. Chem., 2020, 92, 8553–8560 CrossRef CAS PubMed.
- V. Zivanovic, G. Semini, M. Laue, D. Drescher, T. Aebischer and J. Kneipp, Anal. Chem., 2018, 90, 8154–8161 CrossRef CAS PubMed.
- D. Yilmaz and M. Culha, Talanta, 2021, 225, 122071 CrossRef CAS PubMed.
- H. Jang, K. Kang and M. A. El-Sayed, J. Mater. Chem. B, 2018, 6, 5460–5465 RSC.
- Y. Hou, W. Zhang, S. Li, Z. Wang, H. Zhong, Z. Liu and Z. Guo, Analyst, 2018, 143, 3677–3685 RSC.
- J. Yue, Y. Shen, C. Liang, W. Shi, W. Xu and S. Xu, Anal. Chem., 2021, 93, 13038–13044 CrossRef CAS PubMed.
- J. Taylor, J. Milton, M. Willett, J. Wingfield and S. Mahajan, Faraday Discuss., 2017, 205, 409–428 RSC.
- D. Y. Oztas, M. Altunbek, D. Uzunoglu, H. Yilmaz, D. Cetin, Z. Suludere and M. Culha, Langmuir, 2019, 35, 4020–4028 CrossRef CAS PubMed.
- D. Drescher, T. Buchner, P. Schrade, H. Traub, S. Werner, P. Guttmann, S. Bachmann and J. Kneipp, ACS Nano, 2021, 15, 14838–14849 CrossRef CAS PubMed.
- G. Qi, Y. Zhang, S. Xu, C. Li, D. Wang, H. Li and Y. Jin, Anal. Chem., 2018, 90, 13356–13364 CrossRef CAS PubMed.
- S. R. Panikkanvalappil, S. M. Hira and M. A. El-Sayed, Chem. Sci., 2016, 7, 1133–1141 RSC.
- S. R. Panikkanvalappil, M. James, S. M. Hira, J. Mobley, T. Jilling, N. Ambalavanan and M. A. El-Sayed, J. Am. Chem. Soc., 2016, 138, 3779–3788 CrossRef CAS PubMed.
- M. R. Ali, Y. Wu, T. Han, X. Zang, H. Xiao, Y. Tang, R. Wu, F. M. Fernandez and M. A. El-Sayed, J. Am. Chem. Soc., 2016, 138, 15434–15442 CrossRef CAS PubMed.
- M. Aioub and M. A. El-Sayed, J. Am. Chem. Soc., 2016, 138, 1258–1264 CrossRef CAS PubMed.
- V. Caprettini, J. A. Huang, F. Moia, A. Jacassi, C. A. Gonano, N. Maccaferri, R. Capozza, M. Dipalo and F. De Angelis, Adv. Sci., 2018, 5, 1800560 CrossRef PubMed.
- E. I. Nikelshparg, E. S. Prikhozhdenko, R. A. Verkhovskii, V. S. Atkin, V. A. Khanadeev, B. N. Khlebtsov and D. N. Bratashov, Nanomaterials, 2021, 11, 2588 CrossRef CAS PubMed.
- R. A. Smith, C. M. Porteous, A. M. Gane and M. P. Murphy, Proc. Natl. Acad. Sci. U. S. A., 2003, 100, 5407–5412 CrossRef CAS PubMed.
- Q. Hu, M. Gao, G. Feng and B. Liu, Angew. Chem., Int. Ed., 2014, 53, 14225–14229 CrossRef CAS PubMed.
- H. J. Shin, J. H. Lee, Y. D. Kim, I. Shin, T. Sim and D. K. Lim, ACS Omega, 2019, 4, 8188–8195 CrossRef CAS PubMed.
- A. K. Oyelere, P. C. Chen, X. Huang, I. H. El-Sayed and M. A. El-Sayed, Bioconjugate Chem., 2007, 18, 1490–1497 CrossRef CAS PubMed.
- B. Kang, M. A. Mackey and M. A. El-Sayed, J. Am. Chem. Soc., 2010, 132, 1517–1519 CrossRef CAS PubMed.
- M. Aioub, B. Kang, M. A. Mackey and M. A. El-Sayed, J. Phys. Chem. Lett., 2014, 5, 2555–2561 CrossRef CAS PubMed.
- V. Zivanovic, Z. Kochovski, C. Arenz, Y. Lu and J. Kneipp, J. Phys. Chem. Lett., 2018, 9, 6767–6772 CrossRef CAS PubMed.
- G. P. Szekeres and J. Kneipp, Analyst, 2018, 143, 6061–6068 RSC.
- G. P. Szekeres and J. Kneipp, Front. Chem., 2019, 7, 30 CrossRef CAS PubMed.
- J. E. Clement, A. Leray, A. Bouhelier and E. Finot, Phys. Chem. Chem. Phys., 2016, 19, 458–466 RSC.
- T. Brulé, A. Bouhelier, A. Dereux and E. Finot, ACS Sens., 2016, 1, 676–680 CrossRef.
- N. R. Agarwal, M. Tommasini, E. Ciusani, A. Lucotti, S. Trusso and P. M. Ossi, Plasmonics, 2018, 13, 2117–2124 CrossRef CAS.
- S. He, Y. M. E. Kyaw, E. K. M. Tan, L. Bekale, M. W. C. Kang, S. S. Kim, I. Tan, K. P. Lam and J. C. Y. Kah, Anal. Chem., 2018, 90, 6071–6080 CrossRef CAS PubMed.
- S. Aggarwal, S. Mondal, S. Siddhanta, E. Bharat, E. Nagamalleswari, V. Nagaraja and C. Narayana, J. Phys. Chem. B, 2021, 125, 2241–2250 CrossRef CAS PubMed.
- N. Schwenk, B. Mizaikoff, S. Cardenas and A. I. Lopez-Lorente, Analyst, 2018, 143, 5103–5111 RSC.
- Y. Zhou, J. Liu, T. Zheng and Y. Tian, Anal. Chem., 2020, 92, 5910–5920 CrossRef CAS PubMed.
- K. Suga, Y. C. Lai, M. Faried and H. Umakoshi, Int. J. Anal. Chem., 2018, 2018, 2571808 Search PubMed.
- B. Moody, C. M. Haslauer, E. Kirk, A. Kannan, E. G. Loboa and G. S. McCarty, Appl. Spectrosc., 2010, 64, 1227–1233 CrossRef CAS PubMed.
- A. H. Futerman and G. van Meer, Nat. Rev. Mol. Cell Biol., 2004, 5, 554–565 CrossRef CAS PubMed.
- R. Manoharan, J. J. Baraga, M. S. Feld and R. P. Rava, J. Photochem. Photobiol., B, 1992, 16, 211–233 CrossRef CAS.
- L. Wang and N. Malmstadt, J. Phys. D: Appl. Phys., 2017, 50, 415402 CrossRef.
- R. W. Taylor, F. Benz, D. O. Sigle, R. W. Bowman, P. Bao, J. S. Roth, G. R. Heath, S. D. Evans and J. J. Baumberg, Sci. Rep., 2014, 4, 5940 CrossRef CAS PubMed.
- M. Faried, K. Suga, Y. Okamoto, K. Shameli, M. Miyake and H. Umakoshi, ACS Omega, 2019, 4, 13687–13695 CrossRef CAS PubMed.
- K. Suga, T. Yoshida, H. Ishii, Y. Okamoto, D. Nagao, M. Konno and H. Umakoshi, Anal. Chem., 2015, 87, 4772–4780 CrossRef CAS PubMed.
- J. R. Matthews, C. M. Payne and J. H. Hafner, Langmuir, 2015, 31, 9893–9900 CrossRef CAS PubMed.
- I. Bruzas, B. E. Brinson, Z. Gorunmez, W. Lum, E. Ringe and L. Sagle, ACS Appl. Mater. Interfaces, 2019, 11, 33442–33451 CrossRef CAS PubMed.
- Y. Li, X. Han, S. Zhou, Y. Yan, X. Xiang, B. Zhao and X. Guo, J. Phys. Chem. Lett., 2018, 9, 3245–3252 CrossRef CAS PubMed.
- Y. Li, X. Han, Y. Yan, Y. Cao, X. Xiang, S. Wang, B. Zhao and X. Guo, Anal. Chem., 2018, 90, 2996–3000 CrossRef CAS PubMed.
- Y. Li, T. Gao, G. Xu, X. Xiang, X. Han, B. Zhao and X. Guo, J. Phys. Chem. Lett., 2019, 10, 3013–3018 CrossRef CAS PubMed.
- L. Guerrini and R. A. Alvarez-Puebla, Analyst, 2019, 144, 6862–6865 RSC.
- Y. Li, T. Gao, G. Xu, X. Xiang, B. Zhao, X. X. Han and X. Guo, Anal. Chem., 2019, 91, 7980–7984 CrossRef CAS PubMed.
- L. J. Xu, Z. C. Lei, J. Li, C. Zong, C. J. Yang and B. Ren, J. Am. Chem. Soc., 2015, 137, 5149–5154 CrossRef CAS PubMed.
- A. Torres-Nunez, K. Faulds, D. Graham, R. A. Alvarez-Puebla and L. Guerrini, Analyst, 2016, 141, 5170–5180 RSC.
- P. Gisbert-Quilis, M. Masetti, J. Morla-Folch, J. M. Fitzgerald, N. Pazos-Perez, E. Garcia-Rico, V. Giannini, R. A. Alvarez-Puebla and L. Guerrini, Adv. Mater. Interfaces, 2017, 4, 1700724 CrossRef.
- J. Morla-Folch, H. N. Xie, R. A. Alvarez-Puebla and L. Guerrini, ACS Nano, 2016, 10, 2834–2842 CrossRef CAS PubMed.
- D. Li, L. Xia, Q. Zhou, L. Wang, D. Chen, X. Gao and Y. Li, Anal. Chem., 2020, 92, 12769–12773 CrossRef CAS PubMed.
- A. Huefner, W.-L. Kuan, R. A. Barker and S. Mahajan, Nano Lett., 2013, 13, 2463–2470 CrossRef CAS PubMed.
- A. Matschulat, D. Drescher and J. Kneipp, ACS Nano, 2010, 4, 3259–3269 CrossRef CAS PubMed.
- O. Prakash, S. Sil, T. Verma and S. Umapathy, J. Phys. Chem. C, 2020, 124(1), 861–869 CrossRef CAS.
- S. Seifert, V. Merk and J. Kneipp, J. Biophotonics, 2016, 9, 181–189 CrossRef CAS PubMed.
- F. Lussier, V. Thibault, B. Charron, G. Q. Wallace and J.-F. Masson, TrAC, Trends Anal. Chem., 2020, 124, 115796 CrossRef CAS.
- A. Walter, A. März, W. Schumacher, P. Rösch and J. Popp, Lab Chip, 2011, 11, 1013–1021 RSC.
- V. Karunakaran, V. N. Saritha, M. M. Joseph, J. B. Nair, G. Saranya, K. G. Raghu, K. Sujathan, K. S. Kumar and K. K. Maiti, Nanomedicine, 2020, 29, 102276 CrossRef CAS PubMed.
- K. Qian, Y. Wang, L. Hua, A. Chen and Y. Zhang, Thorac. Cancer, 2018, 9, 1556–1561 CrossRef CAS PubMed.
- S. Seifert, Sci. Rep., 2020, 10, 5436 CrossRef PubMed.
- S. Seifert, S. Gundlach and S. Szymczak, Bioinformatics, 2019, 35, 3663–3671 CrossRef CAS PubMed.
- A. Jaworska and K. Malek, J. Colloid Interface Sci., 2014, 431, 117–124 CrossRef CAS PubMed.
- A. Barucci, C. D'Andrea, E. Farnesi, M. Banchelli, C. Amicucci, M. De Angelis, B. Hwang and P. Matteini, Analyst, 2021, 146, 674–682 RSC.
- P. H. L. Nguyen, B. Hong, S. Rubin and Y. Fainman, Biomed. Opt. Express, 2020, 11, 5092–5121 CrossRef CAS PubMed.
- H. Shi, H. Wang, X. Meng, R. Chen, Y. Zhang, Y. Su and Y. He, Anal. Chem., 2018, 90, 14216–14221 CrossRef CAS PubMed.
- Y. X. Leong, Y. H. Lee, C. S. L. Koh, G. C. Phan-Quang, X. Han, I. Y. Phang and X. Y. Ling, Nano Lett., 2021, 21, 2642–2649 CrossRef CAS PubMed.
- C. Levene, E. Correa, E. W. Blanch and R. Goodacre, Anal. Chem., 2012, 84, 7899–7905 CrossRef CAS PubMed.
- T. Rojalin, D. Antonio, A. Kulkarni and R. P. Carney, Appl. Spectrosc., 2021 DOI:10.1177/00037028211034543.
- W. Hu, S. Ye, Y. Zhang, T. Li, G. Zhang, Y. Luo, S. Mukamel and J. Jiang, J. Phys. Chem. Lett., 2019, 10, 6026–6031 CrossRef CAS PubMed.
- V. Živanović and J. Kneipp, Proc. SPIE, 2019, 10894, 1089404 Search PubMed.
| This journal is © The Royal Society of Chemistry 2022 |