 Open Access Article
Microfluidic chip grafted with integrin tension sensors for evaluating the effects of flowing shear stress and ROCK inhibitor on platelets†
Subin
Mao‡
a,
Anwesha
Sarkar‡
ab,
Yongliang
Wang
b,
Chao
Song
a,
Dana
LeVine
 c,
Xuefeng
Wang
*b and
Long
Que
 *a
*a
aElectrical and Computer Engineering Department, Iowa State University, Ames, USA 50011. E-mail: lque@iastate.edu
bDepartment of Physics and Astronomy, Iowa State University, Ames, USA 50011. E-mail: xuefeng@iastate.edu
cVeterinary Clinical Sciences, Iowa State University, Ames, USA 50011
First published on 21st June 2021
Abstract
Integrins are key players in platelet adhesion and aggregation. Integrin molecular tensions, the forces transmitted by integrin molecules, are regulated by both mechanical and biochemical cues, and the outside-in and inside-out signaling has been extensively studied. While the mechanical properties of platelets at static status have been studied by atomic force microscopy, traction force microscopy and tension sensors, the biomechanical properties of flowing platelets remain elusive. Herein, we report microfluidic chips grafted with integrin tension sensors for microfluidic-force mapping in platelets. Specifically, the process of integrin αIIbβ3 mediating tension transmission and platelet adhesion under low flow rates has been obtained, and the process of platelet clustering at post-stenotic regions has been demonstrated. We found that flowing shear force can postpone the integrin-mediated tension transmission and platelet adhesion. We further evaluated the effect of Y-27632, a ROCK inhibitor that has been proven to reduce integrin-mediated platelet adhesion, at a series of concentrations and demonstrated that microfluidic chips with integrin tension sensors are sensitive to the concentration-dependent effects of Y-27632. Given their low cost and scalable throughput, these chips are ideal technical platforms for biological studies of platelets at flowing status and for platelet inhibitor or potential antiplatelet drug screening.
Introduction
Cardiovascular diseases are the major cause of death globally.1 In 2015, 17.7 million people died from cardiovascular diseases, representing 31% of all global deaths (facts listed by the World Health Organization). Thrombosis is the most common pathology causing life-threatening cardiovascular diseases such as ischemic heart disease, stroke, and venous thromboembolism. Primary hemostasis, a process of stopping bleeding from small vessels, is mediated by platelets.2–4 However, during thrombosis, platelets can abnormally adhere to blood vessel walls and promote cell-based coagulation and subsequent fibrin generation, resulting in blood clots that cause heart attacks, strokes, and peripheral vascular disease.5 Such abnormal platelet adhesion can be initiated by ruptured cholesterol plaques in blood vessels or by disturbed blood flow in areas of vascular stenosis, or narrowing. As mentioned in ref. 6, variation of hemodynamic parameters involved in blood flow influences thrombus formation and shear rates vary from zero to 1500 s−1 among different parts of the arterial tree. A clear correlation between platelet deposition and shear rate has been described. At zero shear rate, platelet deposition was (5.2 ± 2.8) × 106 platelets per cm2 and a maximum shear rate of 1500 s−1 yielded platelet deposition of (64.7 ± 8.3) × 106 platelets per cm2. Fibrin deposition was elevated similarly with increasing shear rate, demonstrating the importance of shear rate in platelet and fibrin deposition and thrombus formation. Because the local blood flow and shear conditions are important mechanical factors initiating platelet adhesion and activation, studying platelet functions under controllable flow conditions is desired for the understanding of the mechanism of thrombus formation. Previously, Chen et al.7 discussed mechanisms through which cell-generated forces, external forces applied on the cell and variation of substrate mechanics could bring about changes in cell function through mechanotransduction pathways. Using atomic force microscopy, Lam et al.8 observed the contraction dynamics, measured the mechanics of single platelets and discovered the maximum contractile force that platelets can generate. When they encountered environments with higher rigidity, platelets yielded larger stall forces, demonstrating the possibility of heterogeneous contraction of blood clots by platelets. Myers et al.9 quantified single-platelet contraction forces in varying clot environments and revealed that platelets combine biochemical and mechanical inputs to go through contraction. Through multiscale simulations, King et al.10 showed the process of adhesion of platelets and growth of thrombus.Initial adhesion and activation of platelets in blood flow are orchestrated by both biochemical and mechanical factors. The external mechanical force most relevant to platelet adhesion and activation in blood vessels is the shear stress of blood flow on the vessel wall.11 Shear stress is the product of blood shear viscosity η (2.8 mPa s) and shear rate. The pull/shear force on individual adherent platelets caused by the local shear stress can be estimated using the equation F = ηA![[small gamma, Greek, dot above]](https://www.rsc.org/images/entities/i_char_e0a2.gif) , where
, where ![[small gamma, Greek, dot above]](https://www.rsc.org/images/entities/i_char_e0a2.gif) is the shear rate and A is the area of adherent platelets (∼10−10 m2). As platelets must counteract this pull/shear force during thrombus formation, the shear stress likely plays critical roles in platelet tethering and adhesion in hemostasis by influencing the platelet adhesion force and contraction force. Multiple receptors mediate platelet adhesion and contraction on blood vessel walls. At a high flow rate (>10
is the shear rate and A is the area of adherent platelets (∼10−10 m2). As platelets must counteract this pull/shear force during thrombus formation, the shear stress likely plays critical roles in platelet tethering and adhesion in hemostasis by influencing the platelet adhesion force and contraction force. Multiple receptors mediate platelet adhesion and contraction on blood vessel walls. At a high flow rate (>10![[thin space (1/6-em)]](https://www.rsc.org/images/entities/char_2009.gif) 000 s−1), glycoprotein Ib-V-IX (GPIb-IX-V) tethering to von Willebrand factor (vWF) initiates the platelet adhesion without the participation of integrins αIIbβ3.12 After the initial tethering, integrin α5β1 (glycoprotein Ic–IIa) and integrin αIIbβ3 (glycoprotein IIb–IIIa)13–15 regulate the stable platelet adhesion, spreading, aggregation and contraction.16–18 At a flow rate of <1000 s−1, active integrins αIIbβ3 are capable of binding to the subendothelial ligands directly.19 Being indispensable in hemostasis and thrombosis, integrin αIIbβ3 is known to transmit cellular force which is essential for the retraction and stabilization of the blood clot. Therefore, visualizing and mapping platelet force transmitted by the GPIb-V-IX receptor and integrin αIIbβ3 under shear stress will likely reveal valuable biomechanical information about the mechanism of platelet adhesion and contraction that leads to thrombus formation in blood vessels.
000 s−1), glycoprotein Ib-V-IX (GPIb-IX-V) tethering to von Willebrand factor (vWF) initiates the platelet adhesion without the participation of integrins αIIbβ3.12 After the initial tethering, integrin α5β1 (glycoprotein Ic–IIa) and integrin αIIbβ3 (glycoprotein IIb–IIIa)13–15 regulate the stable platelet adhesion, spreading, aggregation and contraction.16–18 At a flow rate of <1000 s−1, active integrins αIIbβ3 are capable of binding to the subendothelial ligands directly.19 Being indispensable in hemostasis and thrombosis, integrin αIIbβ3 is known to transmit cellular force which is essential for the retraction and stabilization of the blood clot. Therefore, visualizing and mapping platelet force transmitted by the GPIb-V-IX receptor and integrin αIIbβ3 under shear stress will likely reveal valuable biomechanical information about the mechanism of platelet adhesion and contraction that leads to thrombus formation in blood vessels.
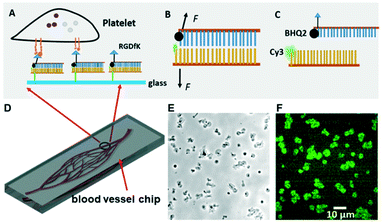
The biomechanical regulation in platelet function has been performed by a variety of techniques such as atomic force microscopy (AFM),20,21 traction force microscopy,22,23 and integrin tension sensors.24 Among integrin tension sensors, DNA engineering has been previously used in tension gauge tether (TGT) design,25–27 and the hairpin DNA structure was modified in monitoring receptor–ligand tension in real time.28,29 Since the sensor size is only a few nanometers, it allows us to detect a single macromolecular tension, like integrins. In principle, the double-stranded DNA fragment was immobilized on a glass surface by the bottom strand and the RGD peptide (integrin ligand) was conjugated onto the upper strand (Fig. 1A), as the RGD motif in vWF and fibrinogen is recognized by integrin αIIbβ3.30,31 The pairing or bonding between nucleotides will be overcome when the integrin tension is high enough. Using this tool, the platelet biomechanics with high data throughput at submicron resolution has been investigated.24
As mentioned in our previous work,24 platelet force map resolution on an integrative tension sensor platform has been calibrated. The integrin tension sensor (ITS) reports force distribution directly through fluorescence imaging (Fig. 1A–C). The Cy3 fluorophore in ITS is quenched by the BHQ2 quencher (95% quenching efficiency) when no force is applied for mechanical separation of dsDNA, yielding almost zero fluorescence (Fig. 1B). Once platelet receptor integrins form bonds with RGD in the ITS, tension transmission to the ITS occurs during platelet adhesion and contraction. The transmitted tension is capable of separating dsDNA and making Cy3 unquenched by freeing Cy3 from the quencher (Fig. 1C). The ITS retains fluorescence once it is activated. As a result, all integrin tensions larger than the ITS tension threshold will be reported. Signal integration of this kind keeps the force footprint intact even after the cells are immunostained or removed, enhances the sensitivity greatly, and yields high fluorescence intensity. The ITS copy number per unit area was determined to be 1200 μm−2.24
In our previous study, we demonstrated the existence of two levels of integrin tensions in platelets at static status.24 Here, we investigated how platelets behave in flowing status at the single molecular level since flowing status is more relevant to the in vivo conditions. In this work, we designed a series of microfluidic chips (straight-microchannel chip, single blood vessel mimicking chip composed of curved microchannels, and blood vessel-mimicking chips with an integrated solution concentration gradient generator) integrated with integrin tension sensors (Fig. 1A–D), in which the glass surface of the microfluidic channels was coated with ITS that will fluoresce when the integrin tension is higher than the threshold or tension tolerance (Fig. 1B and C). As an example, representative optical images and the corresponding fluorescence images of the integrin tension sensors are shown in Fig. 1E and F. In this case, the pairing between nucleotides is separated by the integrin tension resulting from the adhesion of platelets, dismantling the quencher from the dye and enabling the tension sensor to emit fluorescence.
Specifically, we report our recent studies by using platelet force maps as cell mechanical fingerprints to assess platelet behaviors under (i) flowing shear stress including post-stenotic shear stresses and (ii) Y-27632 (ROCK inhibitor) treatment using microchips. By controlling the flow rate, various shear stresses were applied to platelets, and at a certain range of low flow rate (tested 1–100 s−1), platelets adhered and retracted their integrin ligand RGD, and the recorded force pattern shows several force-enriched foci. In addition, since antiplatelet drugs can reduce the chance of myocardial infarction by reducing platelet aggregation and preventing pathologic thrombosis, the effect of Y-27632 (ROCK inhibitor that has been proven to reduce integrin-mediated platelet adhesion) on the biomechanical behaviors of platelets was also evaluated.
In this study, canine platelets were adopted for the mechanobiological study of platelets in a microfluidic chip due to the higher accessibility of dog blood than human blood. Dog platelets possess comparable biological traits to human platelets32 and dogs are close to humans sizewise, yielding similar metabolic rates and rheology in blood.33 Furthermore, signaling pathways, platelet sizes and platelet counts of dogs are similar to those of human platelets.34
There are also similarities between human and canine cardiovascular disease. Although dogs rarely suffer from myocardial infarction, other common human cardiac diseases like dilated cardiomyopathy and chronic valvular disease are very common in dogs.35 Furthermore, human and canine hearts share many similar characteristics at the cellular and organ levels.36 In addition to prothrombotic diseases, dogs also spontaneously develop immune thrombocytopenia, an autoimmune disease targeting platelets and leading to severely decreased platelet counts. Dogs provide an excellent model of this human disease, which can lead to fatal hemorrhage and thus provide a good platform to assess medications that might aid in platelet function and hemostasis.32 As a result of all these similarities, canine platelets represent a good translational model for human platelet mechanobiology.
Materials and methods
A. Materials and imaging
Polydimethylsiloxane (PDMS) and its curing agent were purchased from Dow Corning, Inc. SU-8 photoresist was purchased from MicroChem, Inc. Deionized (DI) water was obtained from a DI water purification system (Millipore, France). Y-27632, Rho-associated kinase (ROCK) inhibitor, was purchased from Sigma-Aldrich, Inc. A fluorescence microscope (Nikon Ti-E2) was used to obtain the fluorescence images of the platelets.B. Microfluidic chip design and fabrication
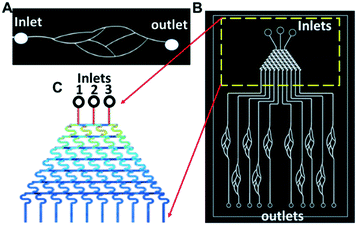
For simplicity, the sizes of all curved channels in the blood vessel mimicking chip (Fig. 3A and B) were kept the same at 80 μm (height) × 100 μm (width). The solution concentration gradient generator (Fig. 3C) was adapted from the tree-shaped microfluidic chip.38 The size of the channels was 80 μm (height) × 100 μm (width) with three inlets, 1, 2, and 3.
C. Tension sensor preparation
ITS with 12 pN threshold (with Cy3-BHQ2 pair): 5′-/RGD/GGG CGG CGA CCT CAG CAT/BHQ2/-3′. 5′-/Cy3/ATG CTG AGG TCG CCG CCC/Bio/-3′.
ITS with 54 pN threshold (with Cy5-BHQ2 pair): 5′-/RGD/GGG CGG CGA CCT CAG CAT/BHQ2/-3′. 5′-G/Cy5/T/Bios/ATGATGAGGTCGCCGCCC/-3′.
D. Washed platelet preparation
Canine blood was drawn from healthy staff- or student-owned volunteer dogs whose owners provided informed consent with approval from the Iowa State University's Institutional Animal Care and Use Committee and complied with ISU IACUC guidelines. The dogs were cared for as outlined in the NIH guide for the care and use of laboratory animals. In brief, 2 ml of blood was drawn from a dog's cephalic vein into a 3 mL syringe containing acid citrate dextrose (ACD) buffer (ACD buffer: 135 mM glucose, 75 mM sodium citrate, 38 mM citric acid) in a 1![[thin space (1/6-em)]](https://www.rsc.org/images/entities/char_2009.gif) :
:![[thin space (1/6-em)]](https://www.rsc.org/images/entities/char_2009.gif) 9 ratio and then transferred to a 15 ml Falcon tube containing an equal volume of buffered saline glucose citrate (BSGC: 129 mM NaCl, 14 mM Na3citrate, 11 mM glucose, 10 mM NaH2PO4, pH 7.3). ACD was the anticoagulant of choice to minimize Ca2+-dependent platelet activation prior to washing the platelets free of plasma. Platelet-rich plasma (PRP) was generated by spinning this blood/BSGC mixture at room temperature at 170g for 8 minutes. The resulting supernatant was harvested as PRP. Platelets were isolated from PRP using centrifugation with washing buffer (113 mM NaCl, 4.3 mM K2HPO4, 4.2 mM Na2HPO4, 24.3 mM NaH2PO4, 5.5 mM dextrose, pH 6.3) to remove the unwanted components such as anti-coagulants, and fibrinogen and 100 units per ml apyrase (product # A6237, Millipore Sigma) and 1 mM PGE1 (product # P5515, Millipore Sigma) were added to prevent immediate activation during washing. Then, the fresh platelets were resuspended in F12 medium (HFL05, Caisson Laboratories) without phenol red. This resuspension restored Ca2+ to a concentration required for platelet function similar to ionized calcium available in citrated PRP.
9 ratio and then transferred to a 15 ml Falcon tube containing an equal volume of buffered saline glucose citrate (BSGC: 129 mM NaCl, 14 mM Na3citrate, 11 mM glucose, 10 mM NaH2PO4, pH 7.3). ACD was the anticoagulant of choice to minimize Ca2+-dependent platelet activation prior to washing the platelets free of plasma. Platelet-rich plasma (PRP) was generated by spinning this blood/BSGC mixture at room temperature at 170g for 8 minutes. The resulting supernatant was harvested as PRP. Platelets were isolated from PRP using centrifugation with washing buffer (113 mM NaCl, 4.3 mM K2HPO4, 4.2 mM Na2HPO4, 24.3 mM NaH2PO4, 5.5 mM dextrose, pH 6.3) to remove the unwanted components such as anti-coagulants, and fibrinogen and 100 units per ml apyrase (product # A6237, Millipore Sigma) and 1 mM PGE1 (product # P5515, Millipore Sigma) were added to prevent immediate activation during washing. Then, the fresh platelets were resuspended in F12 medium (HFL05, Caisson Laboratories) without phenol red. This resuspension restored Ca2+ to a concentration required for platelet function similar to ionized calcium available in citrated PRP.
Unless specifically mentioned otherwise, washed platelets were used for the following experiments. In addition to using washed platelets for most of our experiments, platelet force maps were also observed by plating just ACD anticoagulated whole blood samples with added ADP (platelet agonist) on the integrin tension sensor coated glass substrate.
E. Observation of platelet activity in flowing status
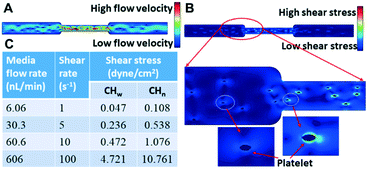
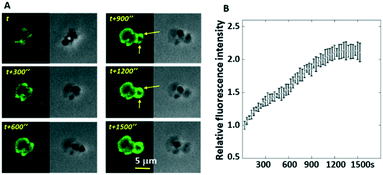
The recording of platelet activity was done using an epifluorescence microscope. The ADP addition and platelet flow were controlled by a syringe pump (Harvard Apparatus, Inc.). ADP is a standard platelet agonist. We used a few different agonists in our initial ITS studies and ADP worked the best. ADP was added from the beginning of flow, and the video recording was started either from the flow beginning or from the initiation of platelet adhesion. Since the platelets could not adhere at a high flow rate without the aid of von Willebrand factor (vWF), and in order to study the effect of shear stress on platelet adhesion mediated through GPIIb/IIIa (also called integrin αIIbβ3) alone, the shear rate was set at relatively low levels i.e. 1, 5, 10, and 100 s−1.F. ROCK inhibitor test with microfluidic-force mapping system
Previously, we tested the inhibition of platelet integrin molecular tensions, the forces transmitted by integrin molecules by tirofiban (GPIIb/IIIa inhibitor) at static status.24 However, the force generation during the adhesion process of flowing platelets remained unknown. Here, the platelets with or without Y-27632 were pumped through micro-channels coated with integrin tension sensor.G. Statistical analysis
The photos or videos were processed and analyzed using MATLAB (code is available upon request). All the data were presented as mean ± SD if applicable. The analysis of platelets was based on at least three independent experiments and the sample size for platelet in each assay was more than 10.Results and discussion
A. Effects of the flow rate on the platelets in microfluidic chips
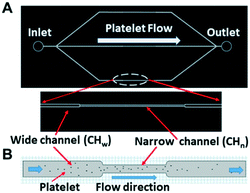
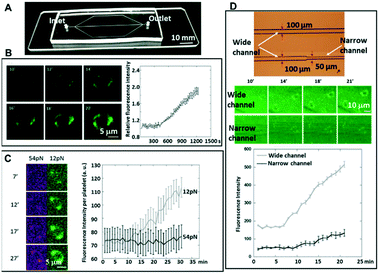
The chip illustrated in Fig. 2 was used for the measurements summarized in this section. A photo of the corresponding fabricated chip is shown in Fig. 5A.To test whether the flowing platelets still show two-level integrin tensions, platelets activated with ADP were flowed at 5 s−1 through the microchannels, which were coated with two types of tension sensors (12 pN and 54 pN sensors), simultaneously. It was found that even under shear stress, the platelets still finished the process of adhesion and spreading, which did not generate high integrin tension (>54 pN) at the initial adhesion stage, but high integrin tension occurred later in 2–10 minutes after initial adhesion (Fig. 5C).
Whole blood can also be used instead of isolated platelets in our flow model. In our previous experiments, we have observed that ITS rupture intensity remains at the same level if we utilized whole canine blood instead of using washed platelets (Fig. S1 in the ESI†). The only difference is that numerous red blood cells will be floating around if we plate whole blood instead of washed platelets, and the number of platelets per um2 will be low. Also, red blood cells would not be able to adhere to the ITS-coated substrates unlike platelets (using binding of platelet integrins to RGD in ITS). Fig. S1† shows platelet force maps on the ITS-coated substrate (Ttol = 12 pN) using whole blood and washed platelets.
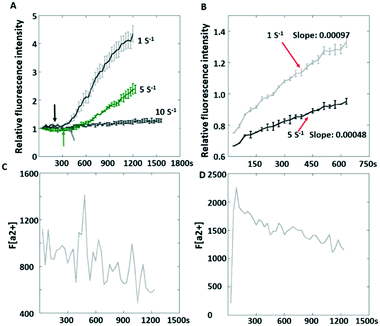
It was also observed that the increasing rate of the fluorescence intensity (indicating how actively the integrin tensions are generated in platelets) was different after platelet adhesion at different flow rates. To avoid inaccurate comparison due to sampling, the platelets were allowed to adhere first prior to shear flow. Interestingly, the slopes of fluorescence increment over time were still different, with a larger slope (0.00097) at 1 s−1 compared to 0.00048 at 5 s−1 (Fig. 6B). This phenomenon may be attributed to the normal stress acting on platelets inhibiting actomyosin assembly due to the ventral integrins' decreased outside-in signaling. We observed that Ca2+ fluctuation was found at 1 s−1 but not at 10 s−1 (Fig. 6C), which indicates that the integrin αIIbβ3 was not activated since Ca2+ oscillation occurs with firm platelet adhesion.30 The Ca2+ transient (Fig. 6D) suggested a low level of integrin αIIbβ3 activation.
It has been well known that during systole inside the coronary arteries, the blood flow is pulsatile with zero or reversing flow,51 indicating that the shear stress is pulsatile and thus changes over time. Given that the shear stress also depends on the locations, sizes and shapes of the blood vessels, in order to analyze the behaviors of platelets more accurately, it is important to study their spatiotemporal behaviors inside the blood vessel mimicking chip. To this end, for future work, a similar piezoelectric pumping system as reported in ref. 52 can be adopted for monitoring the pulsatile flow effect on the platelets.
B. Y-27632 (ROCK inhibitor) treatment on platelets in a blood vessel mimicking chip
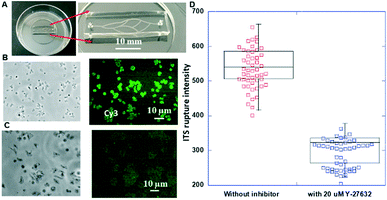
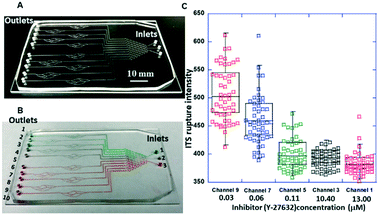
The chips illustrated in Fig. 3 were used for the measurements summarized in this section. The photos of the corresponding fabricated chips are shown in Fig. 8A and 9A.A picture of the fabricated chip is shown in Fig. 8A. A representative optical micrograph and its corresponding fluorescence image of the integrin tension sensors in the microfluidic channel are shown in Fig. 8B, and a representative optical micrograph and corresponding fluorescence image of integrin tension sensors after the treatment with Y-27632 at a concentration of 20 μM are shown in Fig. 8C. As shown in Fig. 8D, after the Y-27632 treatment, the fluorescence intensity dropped significantly, indicating that the tension force induced by the platelets on the dsDNA integrin tension sensors was reduced. These results confirmed that Y-27632 can effectively reduce integrin tensions in adherent platelets.
To accurately determine the concentrations generated by the concentration gradient generator, high-performance liquid chromatography (HPLC) was used to determine the concentrations of the Y-27632 flowed into the blood vessel chip. To this end, the Y-27632 solutions were first collected from the outlets of the gradient generator, and then their concentrations were measured, respectively. The measured fluorescence intensities of the integrin tension sensors after the treatment of different concentrations of Y-27632 are given in Fig. 9C. The coefficient of variation (CV) in Fig. 9C is always less than 1. For example, for a Y-27632 concentration of 0.03 μM, the CV is ∼0.1. Y-27632, the selective ROCK inhibitor, has an IC50 value of 600 nM as provided by the manufacturer (Tocris Bioscience, Inc.).
Clearly, the higher the Y-27632 concentration was, the lower the fluorescence intensity of the integrin tension sensors the platelets produced. Washed platelets were used for this experiment. This result indicates that Y-27632 can reduce integrin tensions in platelets during adhesion and may also effectively decrease platelet aggregation and inhibit thrombus formation as these two processes are also mediated by integrins.53,54 Since this chip can be readily scaled up for high-throughput applications, these results indicate that this type of chip can be potentially used (i) for determining the optimal concentration and/or dose of a ROCK inhibitor and/or an antiplatelet drug for optimal treatment and (ii) for screening possible drug candidates for platelet-related diseases.
Conclusions
Microfluidic chips have been developed for the first time to study the behaviors of platelets by combining microfluidics and molecular tension sensors. Using these chips grafted with the integrin tension sensors on the inner surfaces of microchannels, integrin αIIbβ3 force maps in platelets under low flow status (<1000 s−1) have been obtained. Specifically, these chips allow us to mimic blood vessel occlusion and to study the integrin tension affected by flow rate, namely, the effect of the shear stress on platelets, which can decrease the adhesion activity due to the decreased integrin αIIbβ3 activation reflected by measurements of calcium oscillations and with the tension sensor. The effect of ROCK inhibitor Y27632 on platelets has also been studied with these chips, suggesting their potential in platelet assays for high-throughput applications. Hence, using these chips, it is possible to screen drug candidates for medications that either inhibit or promote platelet function and thus optimize drug concentrations for the treatment of platelet-related diseases.Author contributions
S. Mao, A. Sarkar: chip fabrication and experiments, data analysis, review and editing. Y. Wang, C. Song: experiments, data analysis. D. LeVine: platelet sample preparation, review and editing. X. Wang: conceptualization, writing – original draft, review and editing. L. Que: conceptualization, writing – original draft, review and editing.Conflicts of interest
There are no conflicts to declare.Acknowledgements
The authors acknowledge the funds from the McGee-Wagner Interdisciplinary Research Award at Iowa State University and the National Institutes of Health (1R35GM128747). The authors thank the technical staff at Iowa State University for the measurement of the concentrations of ROCK inhibitor Y-27632 using high-performance liquid chromatography (HPLC). The authors would like to thank the volunteer dogs for sharing their platelets and the technicians of the Small Animal Internal Medicine Service at Iowa State University for helping to obtain blood samples.References
- R. Tracy, Chest, 2003, 124(3), 49S CrossRef CAS PubMed.
- G. Raskob, et al. , Arterioscler., Thromb., Vasc. Biol., 2014, 34(11), 2363 CrossRef CAS PubMed.
- G. Davì and C. Patrono, N. Engl. J. Med., 2007, 357(24), 2482 CrossRef PubMed.
- S. Willoughby, A. Holmes and J. Loscalzo, Eur. J. Cardiovasc. Nurs., 2002, 1(4), 273 CrossRef PubMed.
- M. Packham, Can. J. Physiol. Pharmacol., 1994, 72(3), 278 CrossRef CAS PubMed.
- K. Ouriel, et al. , J. Vasc. Surg., 1991, 14(6), 757 CrossRef CAS PubMed.
- C. Chen, J. Cell Sci., 2008, 121(20), 3285 CrossRef CAS PubMed.
- W. Lam, Nat. Mater., 2011, 10(1), 61 CrossRef CAS PubMed.
- D. Myers, et al. , Nat. Mater., 2007, 16(2), 230 CrossRef PubMed.
- W. Wang and M. King, Ann. Biomed. Eng., 2012, 40(11), 2345 CrossRef PubMed.
- M. H. Kroll, et al., Platelets and shear stress, 1996 Search PubMed.
- Z. Ruggeri, et al. , Blood, 2006, 108(6), 1903 CrossRef CAS PubMed.
- J. Bennett, B. Berger and P. Billings, J. Thromb. Haemostasis, 2009, 7, 200 CrossRef CAS PubMed.
- M. Moser, et al. , Nat. Med., 2008, 14(3), 325 CrossRef CAS PubMed.
- J. Rivera, et al. , Haematologica, 2009, 94(5), 700 CrossRef CAS PubMed.
- J. Gibbins, J. Cell Sci., 2004, 117(16), 3415 CrossRef CAS PubMed.
- Z. Li, et al. , Arterioscler., Thromb., Vasc. Biol., 2010, 30(12), 2341 CrossRef CAS PubMed.
- M. Moroi and S. M. Jung, Front. Biosci., Landmark Ed., 1998, 3, 719–728 CrossRef PubMed.
- S. Jackson, W. Nesbitt and E. Westein, J. Thromb. Haemostasis, 2009, 7, 17 CrossRef CAS PubMed.
- V. Karagkiozaki, et al. , Nanomed.: Nanotechnol., Biol. Med., 2009, 5(1), 64 CrossRef CAS PubMed.
- M. Hussain, A. Agnihotri and C. Siedlecki, Langmuir, 2005, 21(15), 6979 CrossRef CAS PubMed.
- D. Myers, et al. , Nat. Mater., 2017, 16(2), 230 CrossRef CAS PubMed.
- S. Henriques, et al. , J. Cell Sci., 2012, 125(16), 3914 CAS.
- Y. Wang, et al. , Biosens. Bioelectron., 2018, 100, 192 CrossRef CAS PubMed.
- X. Wang and T. Ha, Science, 2013, 340(6135), 991 CrossRef CAS PubMed.
- Y. Wang and X. Wang, Sci. Rep., 2016, 6(1), 1 CrossRef CAS PubMed.
- A. Sarkar, et al. , Curr. Biol., 2020, 30(20), 4022 CrossRef CAS PubMed.
- Y. Zhang, et al. , Nat. Commun., 2014, 5(1), 1 CAS.
- Y. Liu, et al. , Proc. Natl. Acad. Sci. U. S. A., 2016, 113(20), 5610 CrossRef CAS PubMed.
- J. Sánchez-Cortés and M. Mrksich, Chem. Biol., 2009, 16(9), 990 CrossRef PubMed.
- P. Litjens, et al. , J. Thromb. Haemostasis, 2005, 3(6), 1274 CrossRef CAS PubMed.
- D. LeVine, et al. , Br. J. Haematol., 2014, 167(1), 110 CrossRef CAS PubMed.
- K. Son, Clin. Hemorheol. Microcirc., 2010, 44(1), 27 Search PubMed.
- M. Boudreaux, Transl. Res., 2007, 150(2), 81 CrossRef CAS.
- A. Hill, et al., in Handbook of cardiac anatomy, physiology, and devices, Springer, Cham, 2015, pp. 89–114 Search PubMed.
- P. Camacho, et al. , J. Cardiovasc. Dev. Dis., 2016, 3(4), 30 CrossRef PubMed.
- M. Wilkerson, et al. , Vet. Clin. Pathol., 2001, 30(3), 141 CrossRef PubMed.
- X. Li, H. Yin and L. Que, Biomed. Microdevices, 2014, 16(5), 771 CrossRef CAS PubMed.
- Y. Zhang, et al. , Proc. Natl. Acad. Sci. U. S. A., 2018, 115(2), 325 CrossRef CAS PubMed.
- A. Sarkar, D. LeVine, Y. Zhao, K. Mollaeian, J. Ren and X. Wang, bioRxiv, 2020, DOI:10.1101/2020.01.24.918946.
- E. Westein, et al. , Proc. Natl. Acad. Sci. U. S. A., 2013, 110(4), 1357 CrossRef CAS.
- W. Nesbitt, et al. , J. Cell Biol., 2003, 160(7), 1151 CrossRef CAS.
- P. Blair and R. Flaumenhaft, Blood Rev., 2009, 23(4), 177 CrossRef CAS.
- E. Golebiewska and A. Poole, Blood Rev., 2015, 29(3), 153 CrossRef CAS PubMed.
- T. Abshire and S. Jobe, Overview of the Coagulation System, in Transfusion Medicine and Hemostasis, Elsevier, 2009, pp. 431–438 Search PubMed.
- S. Yun, et al., BioMed research international, 2016, vol. 2016.
- D. Woulfe, J. Yang and L. Brass, J. Clin. Invest., 2001, 107(12), 1503 CrossRef CAS PubMed.
- A. Chu, Int. J. Inflammation, 2011, 2011, 367284 Search PubMed.
- M. Murrell, et al. , Nat. Rev. Mol. Cell Biol., 2015, 16(8), 486 CrossRef CAS PubMed.
- F. Albert and F. N. Christopher, JRSM Cardiovasc. Dis., 2012, 1(2), 1 CrossRef PubMed.
- Y. Huo and G. Kassab, Am. J. Physiol., 2006, 291, H1074–H1087 CAS.
- M. Mohammed, et al. , Anal. Chem., 2019, 91, 12077 CrossRef CAS.
- J. Sweeny, D. Gorog and V. Fuster, Nat. Rev. Cardiol., 2009, 6(4), 273 CrossRef CAS PubMed.
- P. Harrison, et al. , Thromb. Res., 2007, 120(3), 323 CrossRef CAS PubMed.
Footnotes |
| † Electronic supplementary information (ESI) available: Two figures in the supplementary document. See DOI: 10.1039/d1lc00259g |
| ‡ These authors contributed equally. |
| This journal is © The Royal Society of Chemistry 2021 |

