
A polymeric nanoformulation improves the bioavailability and efficacy of sorafenib for hepatocellular carcinoma therapy†
Yang
Chen
ab,
Jia-Xian
Li
a,
Na
Shu
c,
Sui-Juan
Zheng
 a,
Min
Ma
a,
Zhi-Bin
Zhao
a,
Zhi-Ting
Cao
*d,
Qi
Zhou
*ef,
Jin-Zhi
Du
*ab and
Jun
Wang
bcg
a,
Min
Ma
a,
Zhi-Bin
Zhao
a,
Zhi-Ting
Cao
*d,
Qi
Zhou
*ef,
Jin-Zhi
Du
*ab and
Jun
Wang
bcg
aGuangzhou First People's Hospital, and Institutes for Life Sciences, School of Medicine, South China University of Technology, Guangzhou 510006, China. E-mail: djzhi@scut.edu.cn
bNational Engineering Research Center for Tissue Restoration and Reconstruction, Key Laboratory of Biomedical Engineering of Guangdong Province, South China University of Technology, Guangzhou 510006, China
cSchool of Biomedical Sciences and Engineering, Guangzhou International Campus, South China University of Technology, Guangzhou 511442, China
dSchool of Biopharmacy, China Pharmaceutical University, Nanjing 210009, China. E-mail: caozt@scut.edu.cn
eDepartment of Liver Surgery, The First Affiliated Hospital of Sun Yat-sen University, Guangzhou 510080, China
fDepartment of General Surgery, Huiya Hospital of The First Affiliated Hospital, Sun Yat-sen University, Huizhou 516081, Guangdong, China. E-mail: zhouqi@mail.sysu.edu.cn
gKey Laboratory of Biomedical Materials and Engineering of the Ministry of Education, and Innovation Center for Tissue Restoration and Reconstruction, Medical Devices Research & Testing Center, South China University of Technology, Guangzhou 510006, China
First published on 28th December 2020
Abstract
Hepatocellular carcinoma (HCC) is a leading cause of cancer-related death worldwide. Sorafenib (sfb) is widely used in clinics for advanced HCC therapy. However, the therapeutic efficacy of sfb is suboptimal due to its poor water solubility, low bioavailability, and side effects. Here, we employed a clinically safe polymer poly(ethylene glycol)-b-poly(lactic acid) (PEG-b-PLA) to prepare a nanoparticle (NP)-based sfb formulation (NP-sfb) and tested its antitumor effect in multiple HCC models. NP-sfb could achieve effective drug loading and remain stable under physiological conditions. NP-sfb could be taken up by HepG2, Hepa1-6, and H22 cells and could efficiently inhibit cell proliferation and/or promote cell apoptosis. In vivo studies indicated that NP-sfb showed significantly improved therapeutic efficacy compared with free-sfb at the same dose or even higher doses. Mechanistic studies demonstrated that NP-sfb not only inhibited tumor proliferation and angiogenesis but also stimulated the tumor microenvironment by reducing the infiltration of immunosuppressive myeloid cells and increasing the ratio of cytotoxic T cells. This study demonstrates that the NP-based formulation is a promising strategy to improve the clinical application of sfb.
Introduction
Liver cancer is a leading cause of cancer-related death in the world, and hepatocellular carcinoma (HCC) accounts for the majority.1,2 For early and intermediate HCC, surgery and local ablation are the main treatment options. Nonetheless, a large portion of HCC is diagnosed in an advanced stage, in which systemic administration of sorafenib (sfb) is a feasible treatment option. sfb is a tyrosine kinase inhibitor (TKI)2,3 with multiple targets including Raf-1, c-kit, VEGFR2, VEGFR3, etc.4–6 The anticancer mechanisms of sfb include inhibiting tumor angiogenesis and tumor cell proliferation and inducing ferroptosis.7–9 Despite this progress, sfb can only increase the overall survival time of HCC patients from 7.9 months to 10.7 months.10 The main reason is its poor solubility and low bioavailability. Increasing the drug dose may improve the therapeutic effect but undoubtedly causes severe side effects, such as skin toxicity, diarrhea, fatigue, hypertension, etc.11–13 Improving the bioavailability of sfb using clinically relevant approaches may be a feasible way to boost its curative effect.Nanoparticles (NPs) have been widely utilized to increase the delivery efficacy of anticancer drugs due to their unique size effect.14,15 Likewise, various NP-based delivery systems have been developed for sfb delivery, and improved therapeutic effects have been observed. For example, Wang et al. prepared a porous silicon NP encapsulating sfb to improve its drug dissolution rate and therapeutic effect.16,17 Zhao et al. reported that lipid-coated calcium carbonate NPs could effectively encapsulate sfb and enhance its therapeutic efficacy in an HCC xenograft model.18 Xie et al. used Gal-PEG-PPMS as a carrier to co-deliver miR122 and sfb to treat HCC.19 However, it should be noted that most of the delivery systems are made from materials that are not approved for clinical use. More importantly, recent studies have revealed that sfb can affect the functions of immune cells, such as macrophages, myeloid-derived suppressor cells (MDSCs), T cells, etc.20,21 However, many previous sfb nanoformulations were studied in immune-deficient mice, and few studies have been performed on immune-competent mice, especially on the HCC tumor model.16,22,23 Thus, little is known about the relationship between its immunostimulatory effect on immune cells and its therapeutic efficacy.
In this study, we chose a clinically safe polymer poly(ethylene glycol)-b-poly(lactic acid) (PEG-b-PLA) as a nanocarrier to deliver sfb and examined its antitumor effects on HCC in vitro and in vivo. The sfb-loaded NP (NP-sfb) was prepared by a single emulsion method, and high loading efficiency was achieved by using PEG-b-PLA. Then, the cellular uptake and in vitro cell killing efficiency were studied in three HCC cells, including mouse-derived Hepa1-6 cells, H22 cells, and human-derived HepG2 cells. The in vivo antitumor effects were examined in immune-competent mice bearing H22 and Hepa1-6 tumor models. The results indicated that NP-sfb could significantly inhibit the growth of tumors in both models. Mechanistic studies demonstrated that NP-sfb could inhibit tumor angiogenesis and tumor cell proliferation and promote apoptosis more effectively. Additionally, NP-sfb could remarkably reduce the infiltration of CD11b+ myeloid cells and F4/80+ macrophages and increase the tumor infiltration of CD3+ T cells. Overall, our study reveals that the clinically relevant NP-sfb may be a promising candidate for HCC treatment.
Materials and methods
Cell culture
The mouse hepatoma cell line Hepa1-6 and the normal hepatocyte cell line AML-12 were kindly provided by Prof. Zhe-Xiong Lian (South China University of Technology), and H22 was provided by Prof. Xintao Shuai (Sun Yat-Sen University). The human hepatoma cell line HepG2 was kindly provided by M.D. Ji-You Yao (South China University of Technology). Hepa1-6 and HepG2 cells were cultured in DMEM complete medium (Gibco, China) containing 10% FBS (Gibco, Brazil) at 37 °C under a 5% CO2 atmosphere. H22 cells were cultured in RPMI-1640 complete medium (Gibco, China) containing 10% FBS (Gibco, Brazil) at 37 °C under a 5% CO2 atmosphere. AML-12 cells were cultured in DMEM:F12 medium (Gibco, China) containing 10% FBS (Gibco, Brazil), 10 μg mL−1 insulin and 40 ng mL−1 dexamethasone at 37 °C under a 5% CO2 atmosphere.Preparation and characterization of NP-sfb
NP-sfb was prepared by a dialysis method. PEG5k-b-PLA11k was synthesized as described previously, and the subscript numbers denote the number-average molecular weight of each block determined by 1H NMR.24 PEG5k-b-PLA11k (100 mg mL−1) was dissolved in ethyl acetate, and sfb (100 mg mL−1) was dissolved in dimethyl sulfoxide (DMSO) and diluted to 10 mg mL−1 with ethyl acetate. PEG5k-b-PLA11k and sfb (10![[thin space (1/6-em)]](https://www.rsc.org/images/entities/char_2009.gif) :1, w:w) were added into a centrifuge tube and then five times volume of sterile water was added. The mixture was sonicated for 2 minutes under ice bath conditions. After that, the mixture was rotary-evaporated to remove organic reagents. Free-sfb was removed by centrifugation at 3000 rpm for 10 min. The obtained NPs were concentrated using an ultrafiltration tube with an MWCO of 10 kDa (Millipore) for further use. Blank NPs were prepared according to the same procedure as that for NP-sfb, but without sfb. The particle size and zeta potential were determined using an Anton Paar Litesizer 500 particle analyzer (Anton Paar Corporation, Austria). The concentration of sfb-loaded NPs was recorded using a Shimadzu UV-2600 spectrophotometer (Shimadzu, Japan). The drug loading content (DLC) and drug loading efficiency (DLE) were calculated by the following formulas, respectively: DLC % = (weight of loaded drug/weight of polymer) × 100% and DLE % = (weight of loaded drug/weight of drug in feed) × 100%.
:1, w:w) were added into a centrifuge tube and then five times volume of sterile water was added. The mixture was sonicated for 2 minutes under ice bath conditions. After that, the mixture was rotary-evaporated to remove organic reagents. Free-sfb was removed by centrifugation at 3000 rpm for 10 min. The obtained NPs were concentrated using an ultrafiltration tube with an MWCO of 10 kDa (Millipore) for further use. Blank NPs were prepared according to the same procedure as that for NP-sfb, but without sfb. The particle size and zeta potential were determined using an Anton Paar Litesizer 500 particle analyzer (Anton Paar Corporation, Austria). The concentration of sfb-loaded NPs was recorded using a Shimadzu UV-2600 spectrophotometer (Shimadzu, Japan). The drug loading content (DLC) and drug loading efficiency (DLE) were calculated by the following formulas, respectively: DLC % = (weight of loaded drug/weight of polymer) × 100% and DLE % = (weight of loaded drug/weight of drug in feed) × 100%.
Preparation of NP-DiD
To prepare DiD-loaded NPs, the PEG5k-b-PLA11k copolymer (10 mg) and DiD (100 μg) were dissolved in N,N-dimethylformamide (1 mL). Then ultrapure water (4 mL) was added. After stirring overnight at room temperature, the mixture was dialyzed in a dialysis bag (MWCO 3.5 kDa) for 24 h. The obtained NP-DiD was concentrated with an ultrafiltration tube (MWCO 10 kDa) for further use.Analysis of the serum stability of NP-sfb
NP-sfb was dispersed in PBS with 10% FBS and shaken at 37 °C. At a scheduled time point, the size of NP-sfb was measured by dynamic light scattering (DLS).In vitro release of NP-sfb
NP-sfb (500 μL) was placed into a dialysis bag (MWCO 3.5 kDa), immersed in 20 mL of PBS solution (pH 7.4, pH 6.8, pH 5.5, containing 0.1% Tween-80), and kept in a shaking incubator at 37 °C. Five milliliter of external solution was taken out at the indicated interval and replaced with 5 mL of fresh PBS solution. The concentration of sfb of each sample was recorded on a Shimadzu UV-2600 spectrophotometer at a detection wavelength of 270 nm.Cell viability
MTT assay was used to test cell viability. 5 × 10³ cells (Hepa1-6, HepG2, H22, AML-12) were seeded in 96-well plates and cultured overnight. Then, the cells were treated with free-sfb and NP-sfb at different concentrations for 24 or 48 hours. Next, 10 μL of MTT (5 mg mL−1, Beyotime, #ST316) was added into each well and incubated for another 4 hours at 37 °C. Subsequently, the medium was gently removed and 100 μL of DMSO was added into each well. Finally, a microplate reader (Biotek) was used to read the absorbance at 490 nm.Cell colony
Hepa1-6 cells (500 cells per plate) or HepG2 cells (1000 cells per plate) were seeded in a 6-well plate and cultured for four days. Next, the cells were treated with free-sfb (0, 5, 10, 20 μM) or NP-sfb (0, 5, 10, 20 μM) for 72 hours. After washing twice with PBS buffer, the cells were fixed with cold methanol at 4 °C for 10 minutes and stained with 1% crystal violet (Solarbio, #C8470) for 20 minutes. After washing out free crystal violet with tap water, photos were taken after drying.Apoptosis test
1 × 10⁵ cells (Hepa1-6, HepG2, H22) were seeded in 12-well plates. When the cell coverage was appropriate, PBS, NP, NP-sfb (10 μM, 20 μM) or free-sfb (10 μM, 20 μM) was added to treat the cells for 48 hours. Next, the cells were digested with trypsin and collected. After washing once with cold PBS, the cells were stained with FITC-Annexin and PI (Beyotime, #C1062L) for 15 minutes at room temperature. Finally, flow cytometry (Celesta, BD) was used to detect the apoptotic cells.Immunoblotting
1 × 10⁵ cells (Hepa1-6, HepG2) were seeded in 12-well plates. When the cell coverage was appropriate, PBS, NP, NP-sfb (10 μM, 20 μM) or free-sfb (10 μM, 20 μM) was added to treat the cells for 24 hours. Next, the cells were lysed with RIPA buffer containing 0.1% phosphatase and protease inhibitors (Beyotime, #P1045). The supernatant of the cell lysate was separated by electrophoresis, blotted with a PVDF membrane and blocked with 5% skimmed milk at room temperature for 1 hour. The blots were incubated with caspase-3 antibody (Abclonal, #A2156, 1/1000) or actin antibody (Abclonal, #RM2001, 1/3000) at 4 °C overnight. After incubation with secondary antibodies (Abclonal, #AS014, #AS003, 1/5000) at room temperature for 1 hour, the blots were detected by ECL chemiluminescence and scanned with an AI600 imaging system.Cellular uptake
For flow cytometry analysis, 1 × 10⁵ cells (Hepa1-6, HepG2, H22) were seeded in 24-well plates overnight. The cells were treated with NP-DiD (0.1 μg mL−1 DiD) for 0, 0.5, 1, 2, 4, and 6 hours. Then, the cells were washed twice with PBS buffer, digested with trypsin, collected, and subjected to flow cytometry (Celesta, BD) detection. Data analysis was performed using FlowJo Software (Tree Star, Inc, Ashland, USA). For fluorescence analysis, the cells were treated with NP-DiD (0.4 μg mL−1 DiD) for 4 hours. Then, the cells were washed twice with PBS and immobilized with 4% paraformaldehyde. After washing out residual paraformaldehyde with PBS, the cells were counterstained with DAPI. Finally, the cells were washed with PBS, sealed with a fluorescence quenching agent, and subjected to confocal microscopy imaging (Ti-E A1, Nikon).Animal study
BALB/c and C57BL/6 mice were purchased from Hunan SJA Laboratory Animal Co. (China). For the H22 tumor model, 2 × 10⁶ H22 cells were mixed with 20% volume of matrigel (BD, China) and injected into the right back of 5-week-old female BALB/c mice. One week later, when the tumor volume reached 100 mm3, the mice were randomly divided into four groups: control (PBS), free-sfb (10 mg kg−1), free-sfb (30 mg kg−1), and NP-sfb (10 mg kg−1) with seven mice in each group. For the free-sfb groups, the drug was injected intraperitoneally (i.p.) and NP-sfb was administered intravenously every two days. The tumor volume and mice body weight were measured every two days. For the Hepa1-6 tumor model, 2 × 10⁶ Hepa1-6 cells were injected into the right back of 5-week-old female C57BL/6 mice. One week later, when the tumor volume reached 50 mm3, the mice were randomly divided into four groups: control (PBS), free-sfb (10 mg kg−1), free-sfb (50 mg kg−1), and NP-sfb (10 mg kg−1). For the free-sfb groups, the drug was injected intraperitoneally (i.p.) and NP-sfb was administered intravenously every three days. The tumor volume and mice body weight were measured every three days. The tumor volume calculation formula is V = ab2/2, where a represents the longest radius and b represents the shortest radius. All mouse studies were carried out following a protocol (2018018) approved by the Institutional Animal Care and Use Committee at South China University of Technology and complied with all relevant ethical regulations.H&E staining
Paraffin-embedded heart, liver, spleen, lung, and kidney tissues were cut into 4 μm consecutive sections, deparaffinized and hydrated. Then the sections were stained with hematoxylin (#9610, ZsBio, China) for 0.5 to 4 minutes, rinsed with tap water, and stained with eosin (#9613, ZsBio, China) for 5–30 seconds. After washing out residual eosin with 80% alcohol, the sections were dehydrated and transparentized. Finally, the sections were sealed and scanned using a digital pathology scanning system (Leica).TUNEL staining
Paraffin-embedded tumor samples were cut into 4 μm consecutive sections, deparaffinized and antigen-retrieved by microwave heating for 15 minutes in citric acid–sodium citrate buffer (pH 6.0). After eliminating endogenous peroxidase with 3% H2O2 buffer and blocking with goat serum, the sections were treated with 30 μg mL−1 proteinase K (#ST535, Beyotime) for 15 minutes at 37 °C. Next, the sections were rinsed with TBST buffer and incubated with TUNEL detection solution (#12156792910, Roche) for 60 minutes at 37 °C. Finally, the sections were washed with PBS buffer, sealed and photographed with a fluorescence microscope (Olympus, Japan).Immunohistochemical staining
Paraffin-embedded tumor samples were cut into 4 μm consecutive sections, deparaffinized and antigen-retrieved by microwave heating for 15 minutes in citric acid–sodium citrate buffer (pH 6.0). After eliminating endogenous peroxidase with 3% H2O2 buffer and blocking with goat serum, the sections were incubated with diluted primary antibodies CD3 (#ab16669, Abcam, 1/300), CD11b (#ab133357, Abcam, 1/300), F4/80 (#70076, CST, 1/300), CD31 (#ab28364, Abcam, 1/100), and Ki67 (#ab16667, Abcam, 1/200) overnight at 4 °C; then, the sections were washed with PBS and stained with anti-mouse/rabbit HRP-labeled secondary antibody (#007100020, PANOVUE) following the manufacturer's instructions. After washing with TBST buffer, the sections were counterstained with DAPI (#007100020, PANOVUE) and imaged using a multispectral tissue section imaging system (PerkinElmer, USA).Statistical analysis
Statistical analysis was performed by the two-sided Student's t test for two groups and the ANOVA test for three or more groups. The value of P < 0.05 was considered significant. All analysis procedures were performed using SPSS 20.Results and discussion
Characterization of NP-sfb
To improve the solubility of sfb, a simple but clinically approved polymer PEG-b-PLA was used to prepare NPs for sfb encapsulation through a single emulsion method. The 1H NMR structure of PEG-b-PLA is shown in Fig. S1,† from which the molecular weight of PLA was determined to be 11 kDa. Dynamic light scattering (DLS) showed typical size distribution profiles of the blank NP and NP-sfb (Fig. 1a). The hydrodynamic size of NP-sfb (94.7 ± 0.3 nm, PDI = 0.179 ± 0.029) was smaller than that of the blank NP (134.5 ± 4.6 nm, PDI = 0.110 ± 0.052). Transmission electron microscopy (TEM) showed that NP-sfb was spherical with a size of around 70 nm, which was slightly smaller than the DLS result (Fig. 1b). Both blank NP and NP-sfb showed a slightly negative surface charge (Fig. 1c). The drug loading content was 8.4 ± 1.1%, and the encapsulation efficiency was 82.6 ± 2.6%. The drug release behaviors were studied in PBS of different pH values. As indicated in Fig. 1d, sfb was released slowly over a 72-hour period, and lower pH facilitated drug release slightly. In addition, the size of NP-sfb was not significantly changed after incubation in PBS with 10% fetal bovine serum (FBS) at 37 °C (Fig. 1e), indicating that NP-sfb was quite stable under the simulated physiological conditions. These results proved that sfb was successfully encapsulated into NP-sfb, and the NP showed favorable properties. | ||
| Fig. 1 Characterization of NP-sfb. (a) Size determination of the NP and NP-sfb by DLS. (b) TEM image of NP-sfb. Scale bar = 100 nm. (c) Zeta potential of the NP and NP-sfb detected by DLS. (d) Release profiles of sfb from NP-sfb in PBS of different pH values (pH 7.4, 6.8 and 5.5) at 37 °C. (e) Stability of NP-sfb incubated in PBS with 10% FBS at 37 °C. The data are shown as mean ± SD (n = 3). | ||
Cellular uptake study
To test whether NP-sfb can be taken up by hepatoma cells, a nanoprecipitation method was used to encapsulate the hydrophobic DiD fluorescent dye (NP-DiD). Three different cell lines including the mouse hepatoma cell lines Hepa1-6 and H22 and the human hepatoma cell line HepG2 were tested. Confocal microscopy and flow cytometry were used to study cellular uptake behaviors of NP-DiD in the three cell lines. Before the confocal study, HepG2, Hepa1-6 or H22 cells were incubated with NP-DiD at 37 °C for 4 hours. As shown in Fig. 2, we observed granular red fluorescence around the tumor nuclei, indicating that NP-DiD could be taken up by all three hepatoma cells.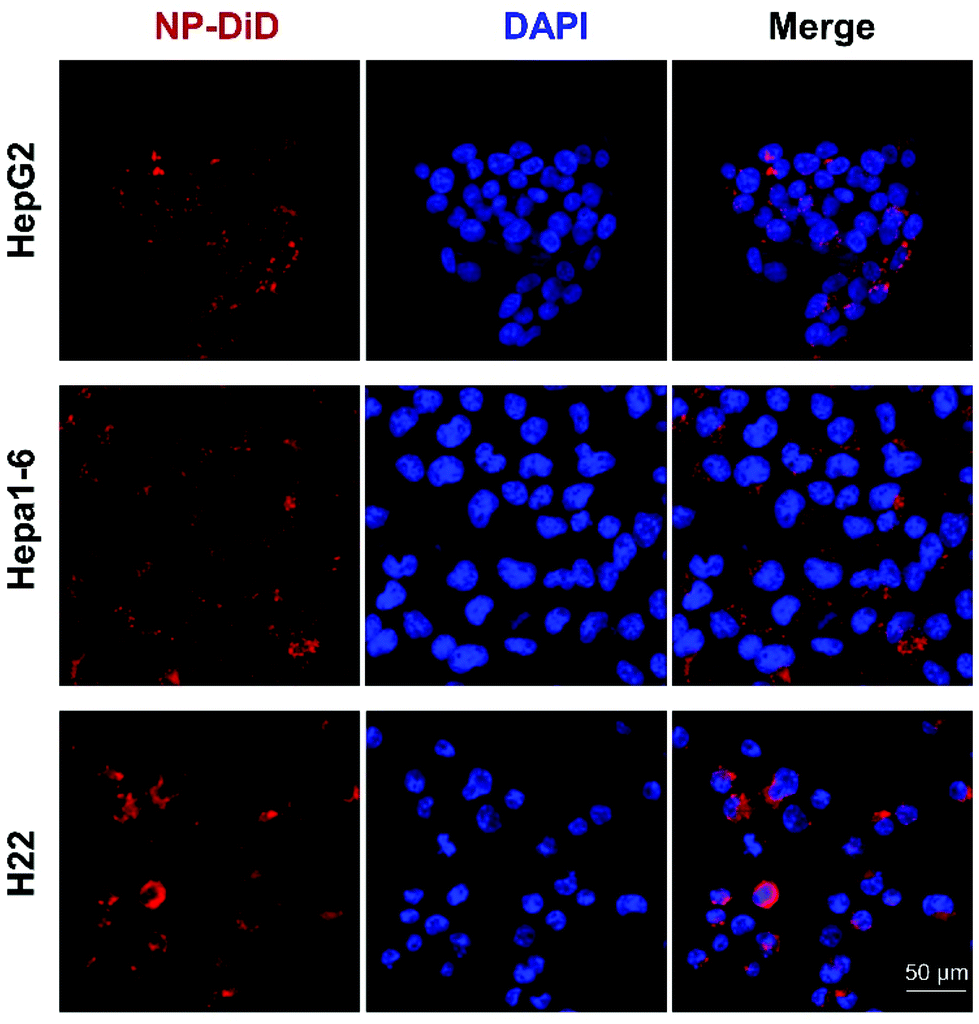 | ||
| Fig. 2 Confocal images showing the cellular uptake of NP-DiD in HepG2, Hepa1-6, and H22 cells. Scale bar = 50 μm. | ||
The uptake process was monitored by flow cytometry analysis. NP-DiD was incubated with the cells for various periods of time from 0.5 to 6 hours. As shown in Fig. 3, the cellular uptake of NP-DiD increased with increasing incubation time for all cell lines. In addition, we also found that different cells showed different internalization kinetics. For HepG2 and Hepa1-6 cells, the cellular uptake of NP-DiD increased significantly until 2 hours of incubation, whereas H22 cells showed remarkable internalization at 0.5 hour. The mean fluorescence intensity (MFI) of DiD at 6 hours was 100.0- and 176.6-fold higher than that at 0.5 hour for HepG2 and Hepa1-6 cells, respectively, whereas it was only 5.2-fold higher for H22 under the same conditions. Collectively, we concluded that PEG-b-PLA NPs can be well internalized by hepatoma cancer cells.
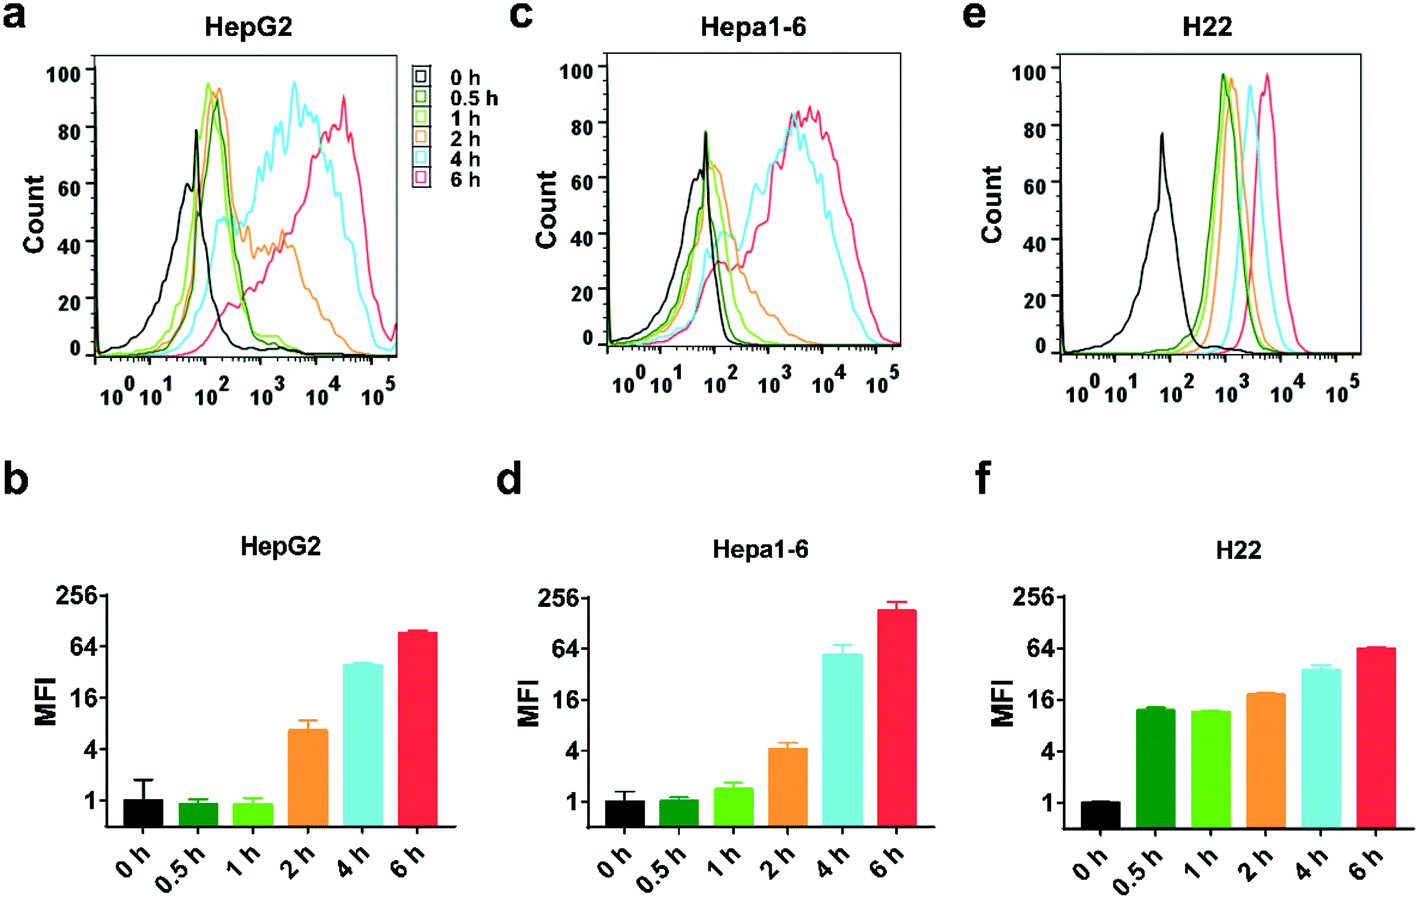 | ||
| Fig. 3 Flow cytometric analysis of HepG2 cells (a and b), Hepa1-6 cells (c and d), and H22 cells (e and f) after treatment with NP-DiD at the indicated time points. | ||
In vitro cell cytotoxicity and apoptosis
Next, we measured the inhibitory effects of NP-sfb on the proliferation of hepatoma cells. After incubation of the drug formulations with tumor cells for 24 or 48 hours, MTT assay was utilized to measure cell cytotoxicity. As indicated in Fig. 4a–c and S2,† both free-sfb and NP-sfb could suppress the growth of Hepa1-6, H22 and HepG2 cells, and the inhibitory efficacy was positively correlated with the drug concentration. In addition, HepG2 and Hepa1-6 cells were more sensitive to sfb, and their IC50 values after NP-sfb treatment were about only one-third of that of H22 cells (10.26 μM for HepG2 vs. 9.99 μM for Hepa1-6 vs. 32.96 μM for H22). In contrast, they showed lower cytotoxicity to the normal hepatocyte AML-12 under the same conditions (Fig. S3†). More interestingly, it was found that NP-sfb exhibited comparable inhibitory rates to free-sfb on the three cells, which was also proved by cell colony experiments (Fig. S4†). The blank NP had no inhibitory effect on the proliferation of hepatoma cells (Fig. S5†).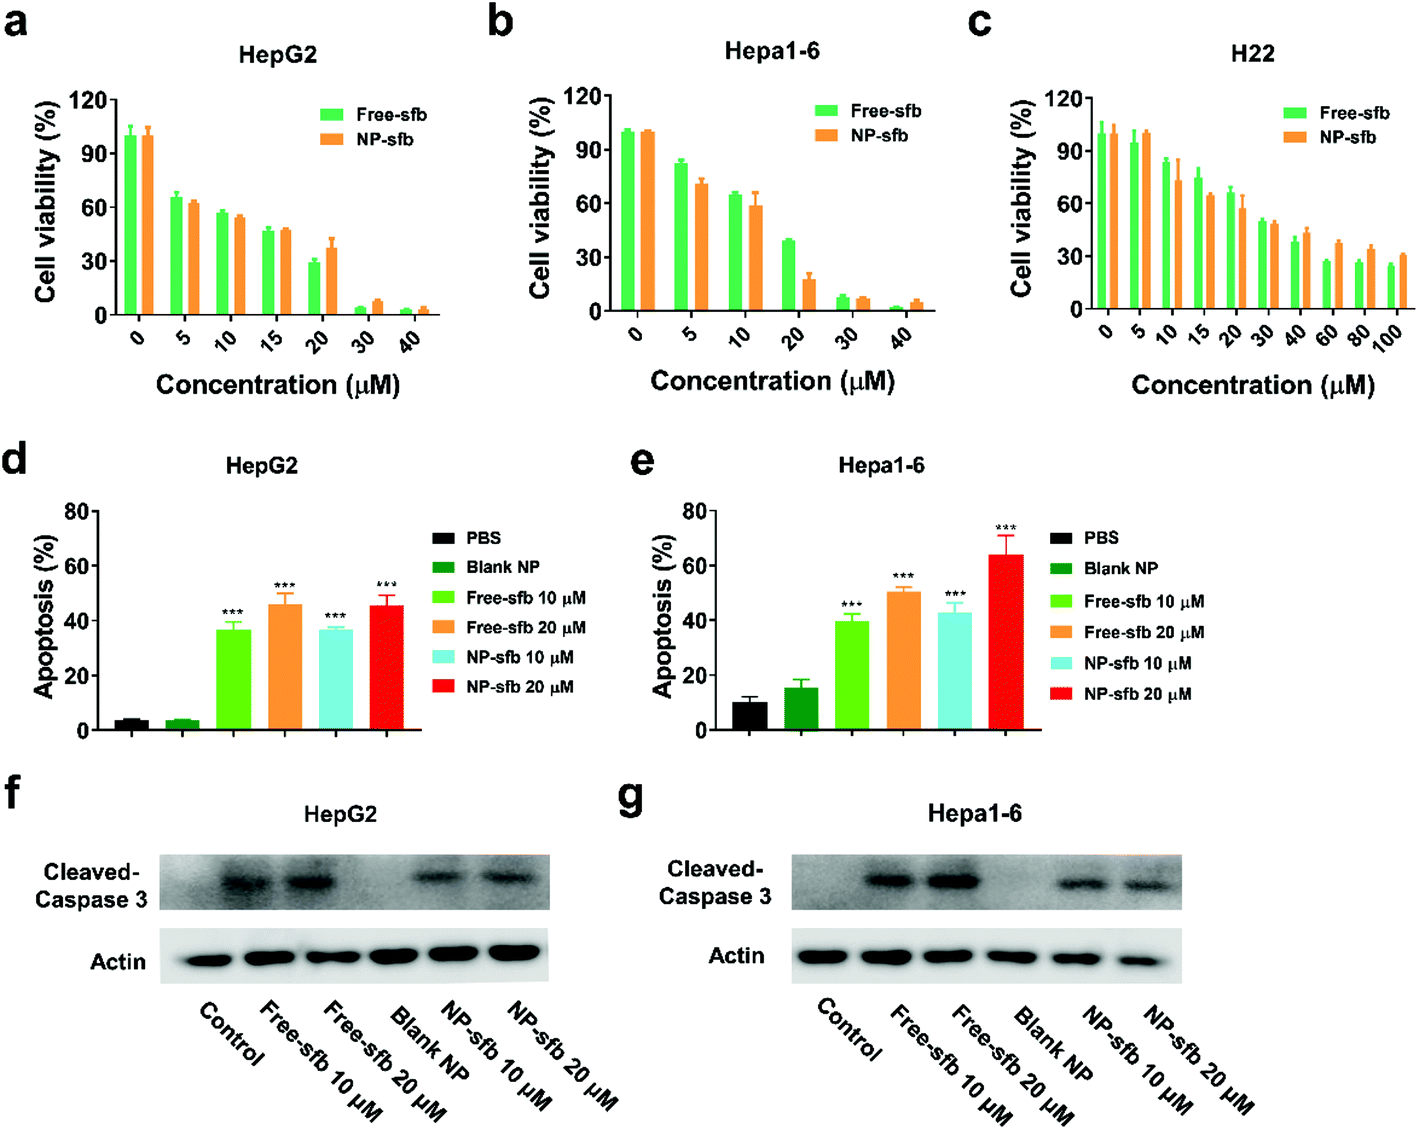 | ||
| Fig. 4 NP-sfb suppressed the growth of hepatoma cells. (a–c) The relative viability inhibitory effect of different concentrations of free-sfb and NP-sfb on HepG2 cells (a), Hepa1-6 cells (b) and H22 cells (c) after 48 hours of treatment. (d and e) Statistical analysis of the apoptosis ratio of HepG2 cells (d) and Hepa1-6 cells (e). (f and g) Immunoblotting of cleaved caspase-3 in HepG2 cells (f) and Hepa1-6 cells (g) as indicated after 24 hours of treatment. Data are shown as mean ± SEM (n = 3), * P < 0.05, ** P < 0.01, ***P < 0.001. | ||
Thereafter, we further examined the apoptotic effect of free-sfb and NP-sfb on hepatoma cells. As shown in Fig. 4d and e, NP-sfb induced slightly higher cell apoptosis than free-sfb at the same sfb concentration in both HepG2 and Hepa1-6 cells, but the difference between them was not statistically significant. In addition, western blot assays as shown in Fig. 4f and g showed that both free-sfb and NP-sfb could induce the cleavage of caspase-3, which is an apoptosis-related protein. However, free-sfb or NP-sfb could not induce apoptosis of H22 cells (Fig. S6†), though they significantly suppressed the proliferation of H22 cells. This may be due to the various sensitivities of different cell lines to sfb.25 Nevertheless, these results indicated that NP-sfb could remarkably suppress the proliferation of HCC cells in vitro.
In vivo antitumor activity
Next, we examined the in vivo antitumor effect of NP-sfb on HCC. Hence, we constructed an H22 subcutaneous transplantation tumor model to test the treatment efficacy. For the H22 model, on the 7th day after tumor implantation, free-sfb (10 mg kg−1, 30 mg kg−1) or NP-sfb (10 mg kg−1) was given every two days. The tumor volume and body weight of mice were recorded (Fig. 5a and Fig. S7†). As shown in Fig. 5b and Fig. S8,† 10 mg kg−1 free-sfb slightly inhibited tumor growth (P = 0.618), while 30 mg kg−1 free-sfb and 10 mg kg−1 NP-sfb significantly inhibited tumor growth (P = 0.003, P < 0.001). Statistical analysis showed that the inhibition rate of 10 mg kg−1 free-sfb and NP-sfb was statistically significant (P = 0.022), but there was no significant difference between 30 mg kg−1 free-sfb and NP-sfb (P = 0.12). At the end of the treatment, the mice were sacrificed and their tumors were collected for weighing. As shown in Fig. 5c and d, the average tumor weight in the NP-sfb group was about 54.9% of the free-sfb (10 mg kg−1) group (0.28 ± 0.08 g vs. 0.51 ± 0.11 g) and there was a significant difference between them (P = 0.004). Furthermore, the Hepa1-6 subcutaneous tumor model was used to verify the therapeutic effect of NP-sfb. As shown in Fig. 8a and b, compared with free-sfb, NP-sfb can remarkably inhibit the growth of Hepa1-6 subcutaneous tumors. These indicated that the therapeutic effect of NP-sfb was better than that of free-sfb.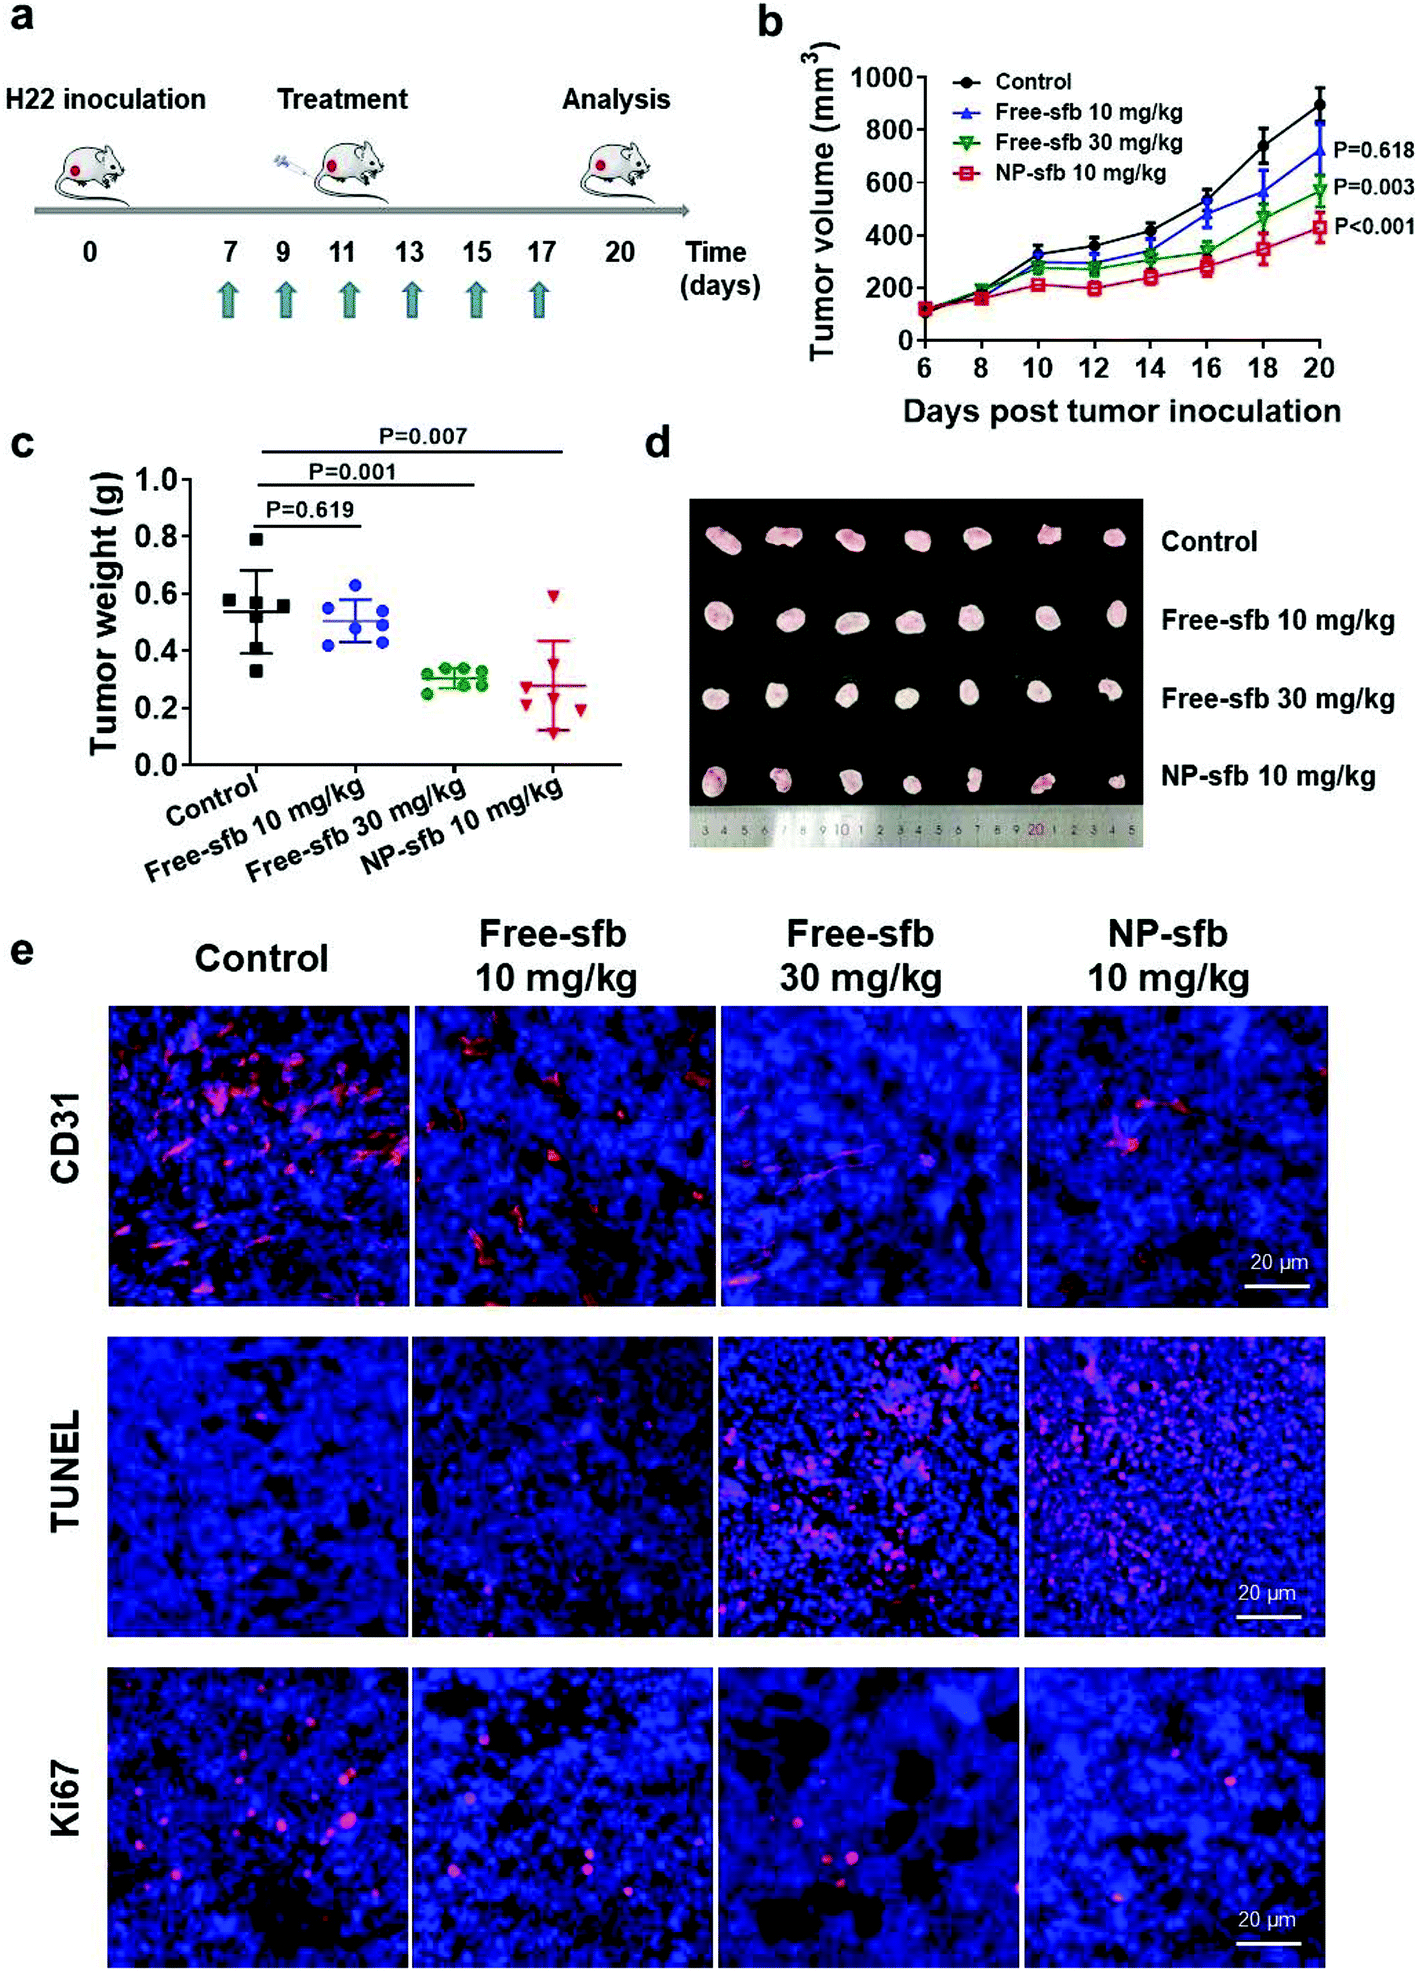 | ||
| Fig. 5 In vivo antitumor activity of NP-sfb in the H22 tumor model. (a) Schematic diagram of the treatment scheme. (b) Tumor suppression profiles of the H22 tumors after administration of PBS, free-sfb (10 mg kg−1, 30 mg kg−1) or NP-sfb (10 mg kg−1). Data are shown as mean ± SEM (n = 7). (c) The weight of the H22 tumors at the end of the treatment. (d) Images of the H22 tumors at the end of the treatment. (e) Immunohistochemical analysis of CD31, as well as TUNEL and Ki67 assays of tumor tissues after the treatment. | ||
As a multi-kinase inhibitor, sfb can directly inhibit the proliferation and promote the apoptosis of tumor cells by inhibiting the Raf-1 or c-kit signaling pathway.26,27 In addition, angiogenesis-related kinases such as VEGFR-2 and PDGFR β were substrates of sfb.28,29 In order to understand the mechanism of NP-sfb-mediated liver cancer therapy, we determined the angiogenesis, proliferation and apoptosis of tumor tissues. As shown in Fig. 5e, the blood vessels of the tumor site in the treatment group were reduced, and the effect of the 30 mg kg−1 free-sfb group and the NP-sfb group was better than that of the 10 mg kg−1 free-sfb group. Besides, Ki67 immunohistochemical experiments and TUNEL assay demonstrated that the 30 mg kg−1 free-sfb group and the NP-sfb group could effectively inhibit tumor growth and induce apoptosis, but the effect of the 10 mg kg−1 free-sfb group was not obvious. These results indicated that NP-sfb could inhibit tumor angiogenesis and tumor cell proliferation and promote tumor cell apoptosis in vivo.
The toxicity of sfb as a multi-target inhibitor should not be ignored despite the therapeutic effect.11–13 Therefore, we collected the heart, liver, spleen, lungs and kidneys of different treatment groups and performed H&E staining. As shown in Fig. 6, the morphology of the heart, liver, spleen, lungs and kidneys in each experimental group was complete, and no edema, steatosis or inflammatory cell infiltration was found. The mice weight data showed that mice receiving free-sfb 10 mg kg−1 and NP-sfb 10 mg kg−1 treatment exhibited a slightly increased weight, whereas mice receiving free-sfb 30 mg kg−1 treatment did not show increased weight (Fig. S7†), suggesting that NP-sfb improves the therapeutic effect and reduces side effects.
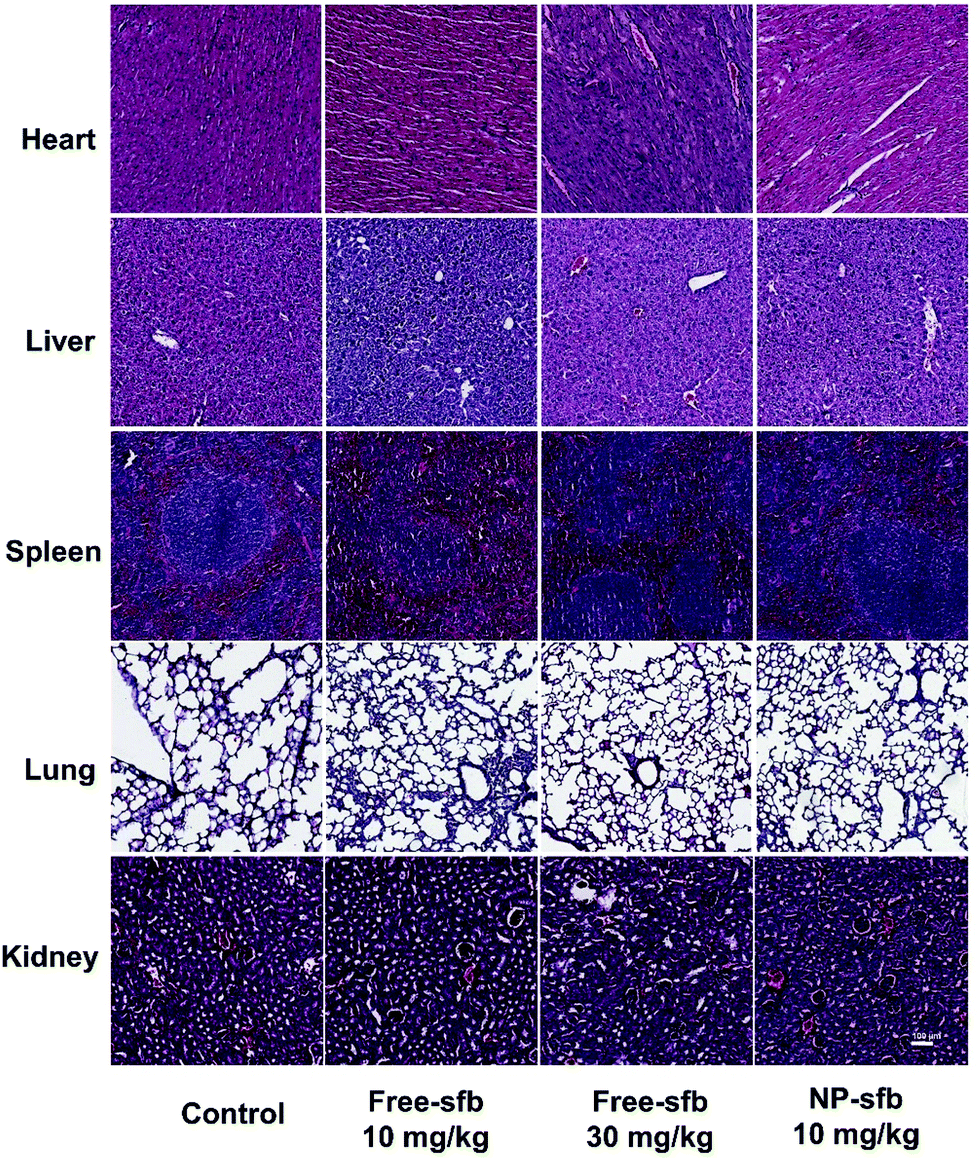 | ||
| Fig. 6 H&E histological staining of major organs after different treatments. | ||
HCC develops a severe immunosuppressive microenvironment manifested by the infiltration of abundant tumor-associated macrophages (TAMs) and myeloid cells such as myeloid-derived suppressor cells (MDSCs). The presence of these cells are associated with reduced treatment efficacy and poor prognosis.30,31 Recent studies have shown that sfb not only plays a role of a kinase inhibitor but also mediates immune effects, such as reducing TAMs and MDSCs and/or activating T cells.32–35 However, many of these experiments have been conducted in vitro or in other tumors such as melanoma and thyroid cancer.20,21 To understand the relationship between improved therapeutic efficacy and changes of the tumor immune microenvironment, we measured the alteration of tumor-infiltrating immune cells in the H22 model after the treatment using immunohistochemical staining. Myeloid cells, TAMs, and T cells were stained with CD11b, F4/80, and CD3 antibodies, respectively. As shown in Fig. 7a, CD11b+ cells and F4/80+ macrophages were extensively infiltrated in the control group, while CD3+ T cells were rarely presented, indicating that this model was an immunosuppressive tumor model. After NP-sfb treatment, we found that the proportion of CD11b+ myeloid cells (Fig. 7b) and F4/80+ macrophages (Fig. 7c) significantly decreased in comparison with the control group and free-sfb treatment groups. Meanwhile, the proportion of CD3+ T cells increased significantly (Fig. 7d).
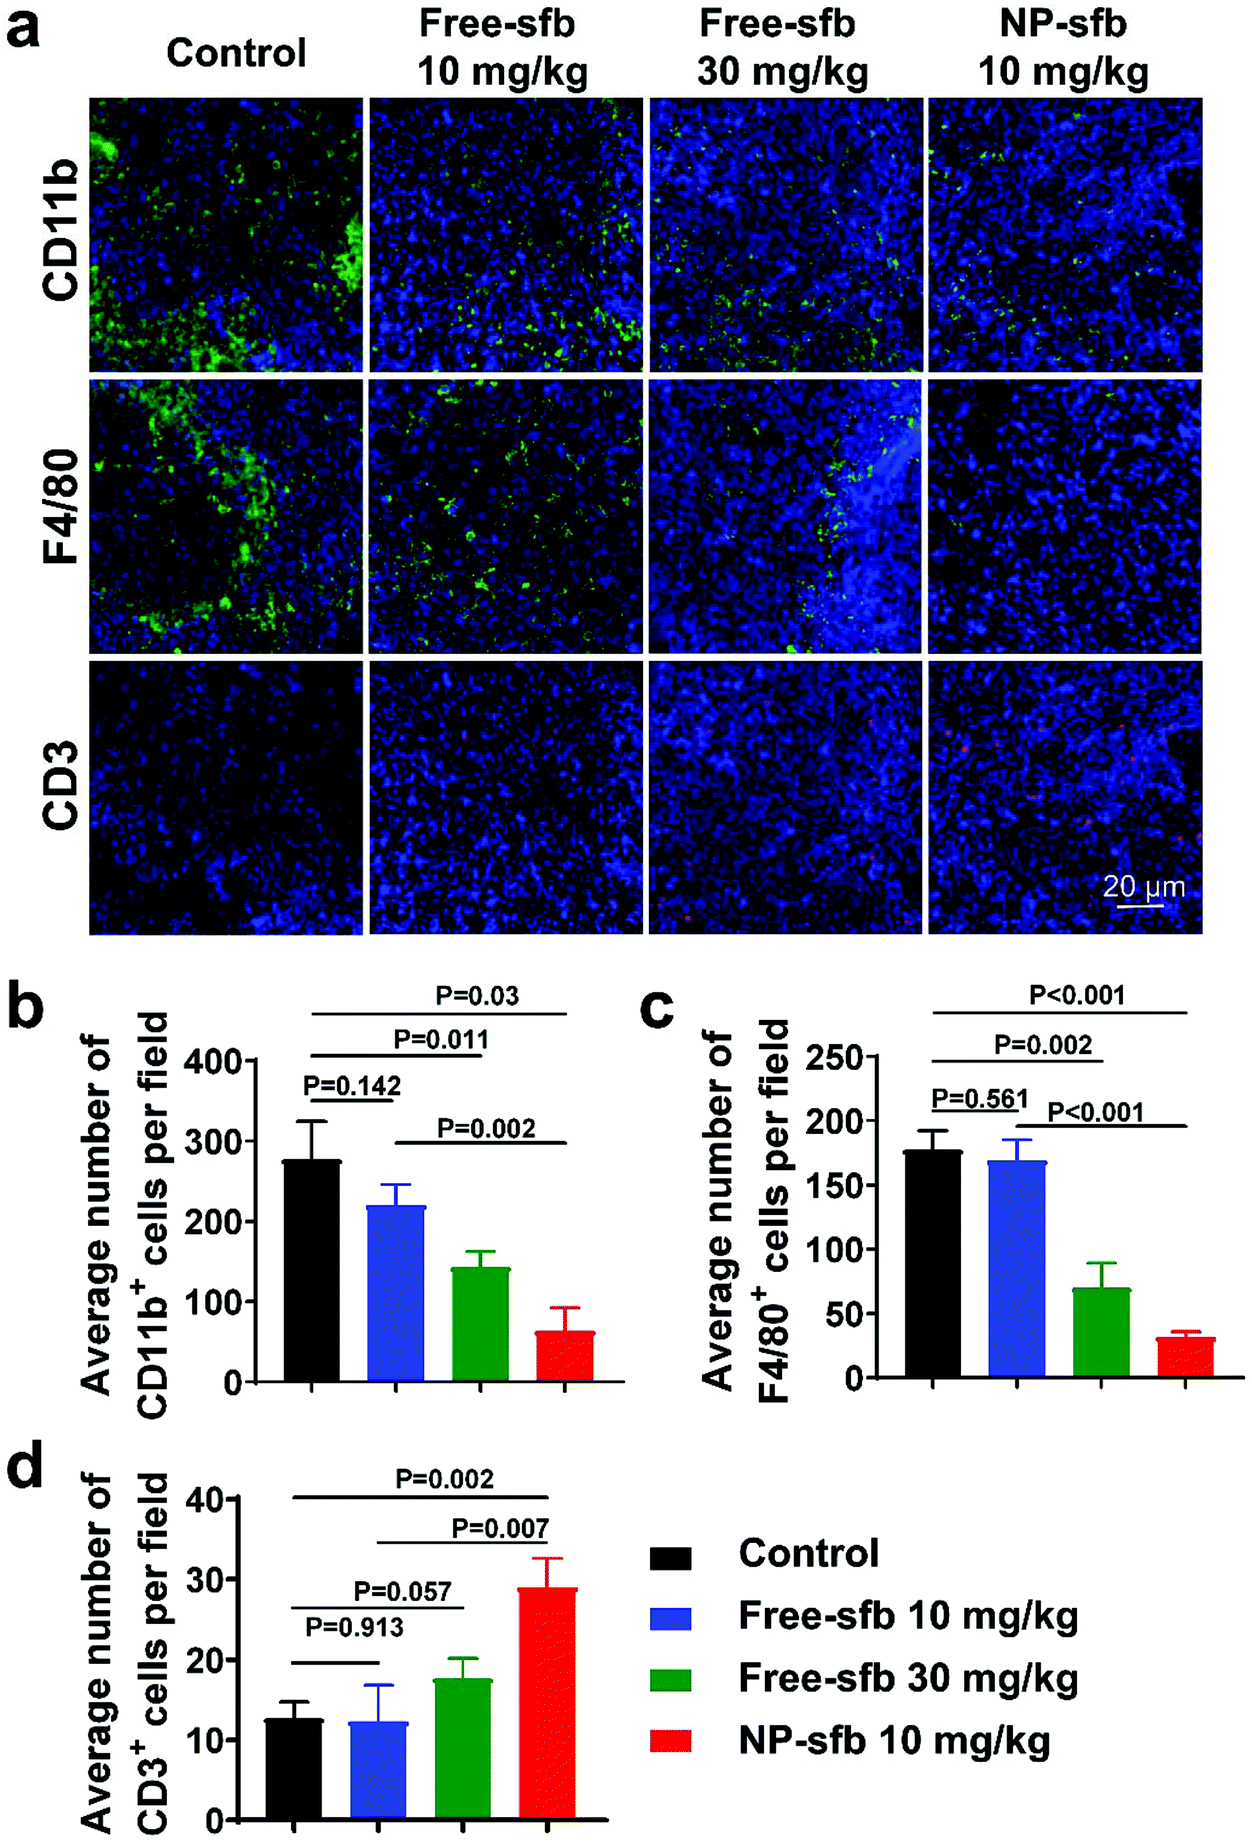 | ||
| Fig. 7 NP-sfb improved the immune microenvironment in the H22 tumor model after the treatment. (a) CLSM images showing the infiltration of T cells (CD3+), myeloid cells (CD11b+) and macrophages (F4/80+) in tumor sections. Scale bar = 20 μm. (b–d) Quantitative analysis of numbers of CD11b+ cells (b), F4/80+ cells (c) and CD3+ cells (d) infiltrated in tumor sections. This was obtained by counting and analyzing the immunohistochemical staining images from three tumor samples. | ||
The in vivo antitumor effect was further studied in a Hepa1-6 tumor model, which is derived from a C57BL/6 mouse lineage. As indicated, NP-sfb also showed the most effective tumor growth inhibition in comparison with free-sfb of even 5-fold higher injection dose (Fig. 8a and b). As in the H22 model, immunohistochemical staining of Hepa1-6 tumors after the treatment indicated that all treatments reduced the tumor-infiltrating CD11b+ myeloid cells. However, the NP-sfb treatment was the most effective than free-sfb treatments. Furthermore, the depletion of suppressive myeloid cells remarkably elevated the infiltration of CD3+ T cells in the tumor receiving NP-sfb treatment (Fig. 8c–e). This indicated that sfb can indeed improve the immune microenvironment of HCC, including reduction of CD11b+ myeloid cells and F4/80+ macrophages and enhancement of T cell infiltration, and the effect of NP-sfb was better than that of free-sfb at the same dose or even higher dose.
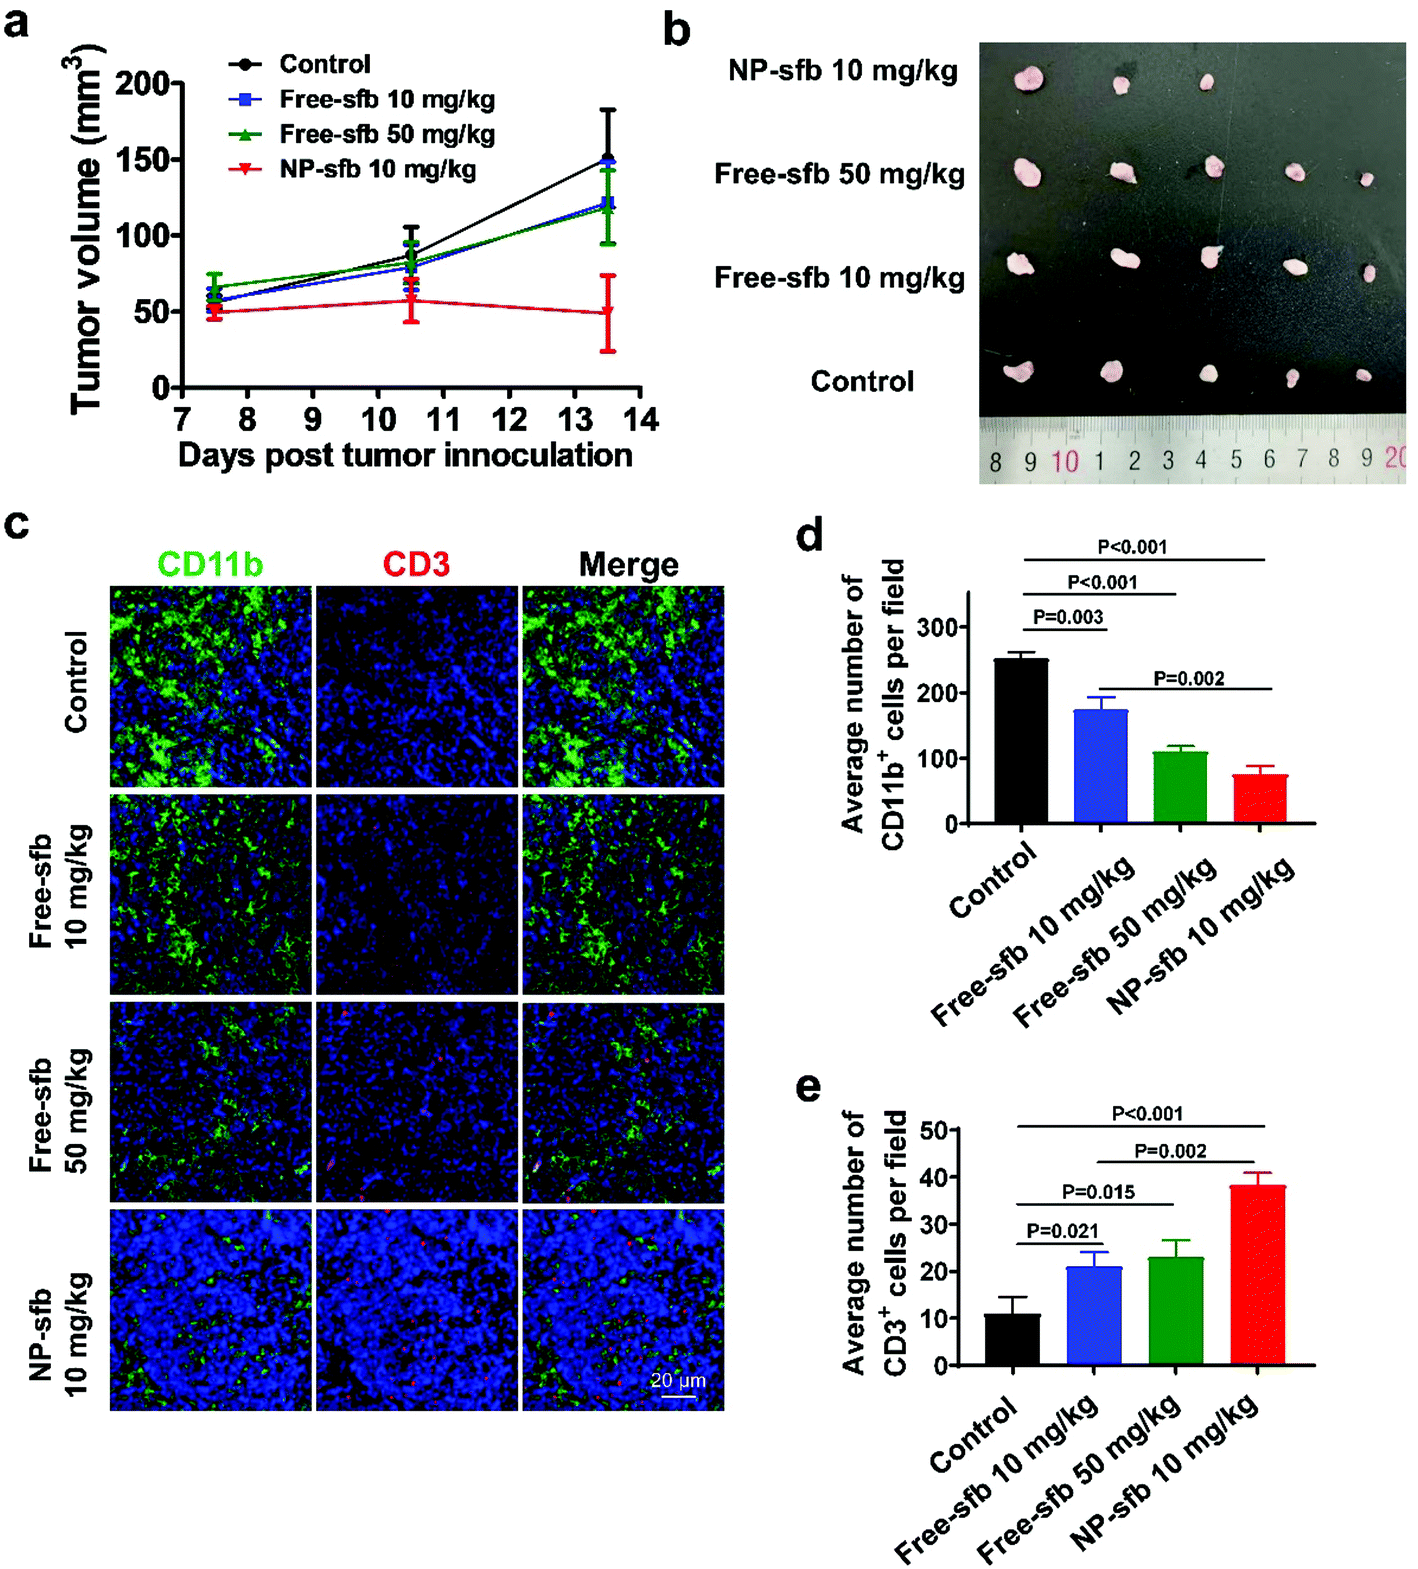 | ||
| Fig. 8 In vivo antitumor activity of NP-sfb in a Hepa1-6 tumor model. (a) Tumor volume change after administration of PBS, free-sfb (10 mg kg−1, 50 mg kg−1) or NP-sfb (10 mg kg−1). (b) Images of Hepa1-6 tumors at the end of treatment. (c) CLSM images showing the infiltration of T cells (CD3+), myeloid cells (CD11b+) and macrophages (F4/80+) in tumor sections. Scale bar = 20 μm. (d and e) Quantitative analysis of numbers of CD11b+ cells (d) and CD3+ cells (e) infiltrated in tumor sections. This was obtained by counting and analyzing the immunohistochemical staining images from three tumor samples. | ||
Conclusions
In summary, we demonstrated that an sfb nanoformulation made from a clinically safe polymer PEG-b-PLA successfully improved the bioavailability and effectiveness in HCC therapy. NP-sfb could be effectively internalized by HCC cells, including HepG2, Hepa1-6, and H22, and could inhibit their proliferation in vitro. The in vivo study further manifested the superiority of the nanoformulation compared with free drugs since NP-sfb showed a significantly improved therapeutic effect at the same dose or even much lower injection dose. Mechanistic studies revealed that NP-sfb not only inhibited tumor angiogenesis and tumor cell proliferation as a TKI inhibitor but also reprogramed the immunosuppressive microenvironment of HCC by depleting tumor infiltration of myeloid cells and macrophages and increasing the infiltration of cytotoxic T lymphocytes. Our study provides a simple but effective approach to improve the therapeutic effect of sfb for HCC therapy.Conflicts of interest
The authors declare that there are no conflicts of interest.Acknowledgements
This work was supported by the Guangdong Natural Science Funds for Distinguished Young Scholar (2017A030306018), the Guangdong Provincial Programs (2017ZT07S054, 2017GC010304), the National Natural Science Foundation of China (51922043, 31771091), the Science and Technology Program of Guangzhou (201902020018, 201804020060), the Science and Technology Program of Huizhou (2018Y305, 2019C0602009), the Funding for the Construction of Key Specialty in Huizhou, and the Fundamental Research Funds for Central Universities.References
- A. Forner, M. Reig and J. Bruix, Lancet, 2018, 391, 1301–1314 CrossRef.
- A. A. Mokdad, A. G. Singal and A. C. Yopp, J. Am. Med. Assoc., 2015, 314, 2701 CrossRef.
- A. Villanueva, N. Engl. J. Med., 2019, 380, 1450–1462 CrossRef CAS.
- A. B. Siegel, S. K. Olsen, A. Magun and R. S. Brown Jr., Hepatology, 2010, 52, 360–369 CrossRef CAS.
- C. O. N. Leung, M. Tong, K. P. S. Chung, L. Zhou, N. Che, K. H. Tang, J. Ding, E. Y. T. Lau, I. O. L. Ng, S. Ma and T. K. W. Lee, Hepatology, 2020, 72, 155–168 CrossRef CAS.
- D. J. Crona, A. D. Skol, V. M. Leppänen, D. M. Glubb, A. S. Etheridge, E. Hilliard, C. E. Peña, Y. K. Peterson, N. Klauber-DeMore, K. K. Alitalo and F. Innocenti, Cancer Res., 2019, 79, 231–241 CrossRef CAS.
- B. Y. Cheng, E. Y. Lau, H. W. Leung, C. O. Leung, N. P. Ho, S. Gurung, L. K. Cheng, C. H. Lin, R. C. Lo, S. Ma, I. O. Ng and T. K. Lee, Cancer Res., 2018, 78, 2332–2342 CrossRef CAS.
- G. Ranieri, G. Gadaleta-Caldarola, V. Goffredo, R. Patruno, A. Mangia, A. Rizzo, R. L. Sciorsci and C. D. Gadaleta, Curr. Med. Chem., 2012, 19, 938–944 CrossRef CAS.
- S. Wang, H. Liao, F. Li and D. Ling, Chin. Chem. Lett., 2019, 30, 847–852 CrossRef CAS.
- M. Kudo, K. Imanaka, N. Chida, K. Nakachi, W. Y. Tak, T. Takayama, J. H. Yoon, T. Hori, H. Kumada, N. Hayashi, S. Kaneko, H. Tsubouchi, D. J. Suh, J. Furuse, T. Okusaka, K. Tanaka, O. Matsui, M. Wada, I. Yamaguchi, T. Ohya, G. Meinhardt and K. Okita, Eur. J. Cancer, 2011, 47, 2117–2127 CrossRef CAS.
- V. L. Williams, P. R. Cohen and D. J. Stewart, Int. J. Dermatol., 2011, 50, 396–402 CrossRef CAS.
- J. M. Llovet, S. Ricci, V. Mazzaferro, P. Hilgard, E. Gane, J. F. Blanc, A. C. de Oliveira, A. Santoro, J. L. Raoul, A. Forner, M. Schwartz, C. Porta, S. Zeuzem, L. Bolondi, T. F. Greten, P. R. Galle, J. F. Seitz, I. Borbath, D. Häussinger, T. Giannaris, M. Shan, M. Moscovici, D. Voliotis and J. Bruix, N. Engl. J. Med., 2008, 359, 378–390 CrossRef CAS.
- M. M. Gounder, M. R. Mahoney, B. A. Van Tine, V. Ravi, S. Attia, H. A. Deshpande, A. A. Gupta, M. M. Milhem, R. M. Conry, S. Movva, M. J. Pishvaian, R. F. Riedel, T. Sabagh, W. D. Tap, N. Horvat, E. Basch, L. H. Schwartz, R. G. Maki, N. P. Agaram, R. A. Lefkowitz, Y. Mazaheri, R. Yamashita, J. J. Wright, A. C. Dueck and G. K. Schwartz, N. Engl. J. Med., 2018, 379, 2417–2428 CrossRef CAS.
- W. Song, S. N. Musetti and L. Huang, Biomaterials, 2017, 148, 16–30 CrossRef CAS.
- F. Peng, Y. Su, Y. Zhong, C. Fan, S. T. Lee and Y. He, Acc. Chem. Res., 2014, 47, 612–623 CrossRef CAS.
- C. F. Wang, E. M. Mäkilä, M. H. Kaasalainen, D. Liu, M. P. Sarparanta, A. J. Airaksinen, J. J. Salonen, J. T. Hirvonen and H. A. Santos, Biomaterials, 2014, 35, 1257–1266 CrossRef CAS.
- C. F. Wang, M. P. Sarparanta, E. M. Mäkilä, M. L. Hyvönen, P. M. Laakkonen, J. J. Salonen, J. T. Hirvonen, A. J. Airaksinen and H. A. Santos, Biomaterials, 2015, 48, 108–118 CrossRef CAS.
- P. Zhao, M. Li, Y. Wang, Y. Chen, C. He, X. Zhang, T. Yang, Y. Lu, J. You, R. J. Lee and G. Xiang, Acta Biomater, 2018, 72, 248–255 CrossRef CAS.
- J. Xie, Y. Lu, B. Yu, J. Wu and J. Liu, Chin. Chem. Lett., 2020, 31, 1173–1177 CrossRef CAS.
- Z. B. Zhao, J. Long, Y. Y. Zhao, J. B. Yang, W. Jiang, Q. Z. Liu, K. Yan, L. Li, Y. C. Wang and Z. X. Lian, Biomater. Sci., 2018, 6, 893–900 RSC.
- X. Sun, Z. Cao, K. Mao, C. Wu, H. Chen, J. Wang, X. Wang, X. Cong, Y. Li, X. Meng, X. Yang, Y. G. Yang and T. Sun, Biomaterials, 2020, 240, 119845 CrossRef CAS.
- X. Chen, T. Chen, L. Zhang, Z. Wang, Q. Zhou, T. Huang, C. Ge, H. Xu, M. Zhu, F. Zhao, M. Yao, H. Tian, H. Li, X. Zhu and J. Li, Biomaterials, 2020, 261, 120304 CrossRef CAS.
- C. Phan, Z. Zheng, J. Wang, Q. Wang, X. Hu, G. Tang and H. Bai, Biomater. Sci., 2019, 7, 4758–4768 RSC.
- H. X. Wang, Z. Q. Zuo, J. Z. Du, Y. C. Wang, R. Sun, Z. T. Cao, X. D. Ye, J. L. Wang, K. W. Leong and J. Wang, Nano Today, 2016, 11, 133–144 CrossRef CAS.
- R. Zhao, T. Li, G. Zheng, K. Jiang, L. Fan and J. Shao, Biomaterials, 2017, 143, 1–16 CrossRef CAS.
- S. M. Wilhelm, C. Carter, L. Tang, D. Wilkie, A. McNabola, H. Rong, C. Chen, X. Zhang, P. Vincent, M. McHugh, Y. Cao, J. Shujath, S. Gawlak, D. Eveleigh, B. Rowley, L. Liu, L. Adnane, M. Lynch, D. Auclair, I. Taylor, R. Gedrich, A. Voznesensky, B. Riedl, L. E. Post, G. Bollag and P. A. Trail, Cancer Res., 2004, 64, 7099–7109 CrossRef CAS.
- E. Weisberg, C. Meng, A. E. Case, M. Sattler, H. L. Tiv, P. C. Gokhale, S. J. Buhrlage, X. Liu, J. Yang, J. Wang, N. Gray, R. M. Stone, S. Adamia, P. Dubreuil, S. Letard and J. D. Griffin, Br. J. Haematol., 2019, 187, 488–501 CrossRef CAS.
- F. V. Negri, B.D. Bello, C. Porta, N. Campanini, S. Rossi, C. Tinelli, G. Poggi, G. Missale, S. Fanello, S. Salvagni, A. Ardizzoni and S. E. Maria, Liver Int., 2015, 35, 2001–2008 CrossRef CAS.
- E. Lierman, I. Lahortiga, H. Van Miegroet, N. Mentens, P. Marynen and J. Cools, Haematologica, 2007, 92, 27–34 CrossRef CAS.
- Q. Zhang, Y. He, N. Luo, S. J. Patel, Y. Han, R. Gao, M. Modak, S. Carotta, C. Haslinger, D. Kind, G. W. Peet, G. Zhong, S. Lu, W. Zhu, Y. Mao, M. Xiao, M. Bergmann, X. Hu, S. P. Kerkar, A. B. Vogt, S. Pflanz, K. Liu, J. Peng, X. Ren and Z. Zhang, Cell, 2019, 179, 829–845 CrossRef CAS.
- M. Liu, J. Zhou, X. Liu, Y. Feng, W. Yang, F. Wu, O. K. Cheung, H. Sun, X. Zeng, W. Tang, M. T. S. Mok, J. Wong, P. C. Yeung, P. B. S. Lai, Z. Chen, H. Jin, J. Chen, S. L. Chan, A. W. H. Chan, K. F. To, J. J. Y. Sung, M. Chen and A. S. Cheng, Gut, 2020, 69, 365–379 CrossRef CAS.
- R. Cabrera, M. Ararat, Y. Xu, T. Brusko, C. Wasserfall, M. A. Atkinson, L. J. Chang, C. Liu and D. R. Nelson, Cancer Immunol. Immunother., 2013, 62, 737–746 CrossRef CAS.
- Y. Chen, Y. Huang, T. Reiberger, A. M. Duyverman, P. Huang, R. Samuel, L. Hiddingh, S. Roberge, C. Koppel, G. Y. Lauwers, A. X. Zhu, R. K. Jain and D. G. Duda, Hepatology, 2014, 59, 1435–1447 CrossRef CAS.
- Y. Chen, R. R. Ramjiawan, T. Reiberger, M. R. Ng, T. Hato, Y. Huang, H. Ochiai, S. Kitahara, E. C. Unan, T. P. Reddy, C. Fan, P. Huang, N. Bardeesy, A. X. Zhu, R. K. Jain and D. G. Duda, Hepatology, 2015, 61, 1591–1602 CrossRef CAS.
- M. J. Zheng, Y. H. Weng, Z. Y. Cao, S. Guo, B. Hu, M. Lu, W. S. Guo, T. R. Yang, C. H. Li, X. Z. Yang and Y. Y. Huang, ACS Appl. Mater. Interfaces, 2020, 12, 32289–32300 CrossRef.
Footnote |
| † Electronic supplementary information (ESI) available. See DOI: 10.1039/d0bm01881c |
| This journal is © The Royal Society of Chemistry 2021 |