
Methodologies for evaluation of metal–organic frameworks in separation applications†
Rajamani Krishna
Van 't Hoff Institute for Molecular Sciences, University of Amsterdam, Science Park 904, 1098 XH Amsterdam, The Netherlands. E-mail: r.krishna@contact.uva.nl; Fax: +31 20 525 5604; Tel: +31 20 627 0990
First published on 8th June 2015
Abstract
Metal–organic frameworks (MOFs) offer considerable potential for separating a wide variety of mixtures. For any given separation, there are several MOFs that could be employed. Therefore, there is a need for reliable procedures for screening and ranking MOFs with regard to their anticipated performance in fixed-bed adsorbers, commonly used in industry. Such fixed-bed adsorbers are invariably operated in a transient mode. The separation performance of fixed-bed adsorbers is governed by a number of factors that include adsorption selectivity, uptake capacity, and intra-crystalline diffusion limitations. We undertake a detailed analysis of the separations of several mixtures that include: C2H2/CO2, CO2/N2, CO2/CH4, H2S/CO2/CH4, H2/CO2/CO/CH4/N2, Xe/Kr, C2H2/C2H4, C2H4/C2H6, C3H6/C3H8, O2/N2, N2/CH4, hexane isomers, xylene isomers, and styrene/ethylbenzene. For each separation, we compare the performance of a few carefully selected MOFs by using transient breakthrough simulations that are representative of practical operations. These case studies demonstrate that screening MOFs on the basis of adsorption selectivity alone, as is common practice, often leads to wrong conclusions as regards their separation capability in fixed-bed adsorbers. High uptake capacities often compensate for low selectivities. Conversely, low uptake capacities diminish the separation performance of MOFs with high selectivities. Intra-crystalline diffusion limitations lead to distended breakthroughs, and diminished productivities in a number of cases. We also highlight the possibility of harnessing intra-crystalline diffusion limitations to reverse the adsorption selectivity; this strategy is useful for selective capture of nitrogen from natural gas, and in air separations.
 Rajamani Krishna | Rajamani Krishna is a Professor at the University of Amsterdam in the Netherlands. His current research focus is on adsorption and diffusion in nanoporous crystalline materials. He has published two text books, 450 peer-reviewed journal articles, and holds several patents. A complete list of his research contributions can be found on Google Scholar: http://scholar.google.nl/citations?user=cKqtQ0MAAAAJ%26hl=en. According to the latest statistics on Google scholar, his publications have been cited more than 23 |
1 Introduction
There is increasing research on the synthesis and development of new materials such as metal–organic frameworks (MOFs), and zeolitic imidazolate frameworks (ZIFs) for use as adsorbents in a wide range of separation applications. These materials could offer significant improvements in separation performance as compared to traditionally used adsorbents such as zeolites, and activated carbon. In industrial processing operations, the microporous materials are normally used in powder or pelleted form in fixed bed adsorbers. Such units are most commonly operated in a transient mode, with adsorption and desorption cycles; they are called either pressure swing adsorbers (PSA) or temperature swing adsorbers (TSA) depending on the regeneration strategy employed. The separation performance of PSA and TSA units are governed by a wide variety of factors that include adsorption selectivity, uptake capacity, and intra-crystalline diffusion.1 The costs of regeneration are linked, inter alia, to the cycle times, and the heats of adsorption.For any given separation application, it may be possible to identify the microporous material with the ideal pore size, and surface area that offers the right degree of interactions (van der Waals, electrostatic, π-electron exchange) with the guest molecules. In comparison to traditionally used porous materials such as zeolites, MOFs and ZIFs offer significantly higher surface areas and porosities. As illustration, Fig. 1 presents data for surface areas, pore volumes, framework densities, and characteristic channel dimensions of some representative zeolites, MOFs and ZIFs. The commonly used NaX zeolite, for example, has a characteristic size (window aperture) of 7.4 Å, pore volume of 0.28 cm3 g−1, and surface area of 950 m2 g−1. Significantly higher surface areas are available with MOFs; for example CuBTC has an area of 2100 m2 g−1. The accessible pore volumes of MOFs are commonly in the 0.5–2 cm3 g−1 range. The pore dimensions of MOFs are often significantly larger than for zeolites; NiMOF-74, for example, has one-dimensional (1D) hexagonal-shaped channels of approximately 11 Å.
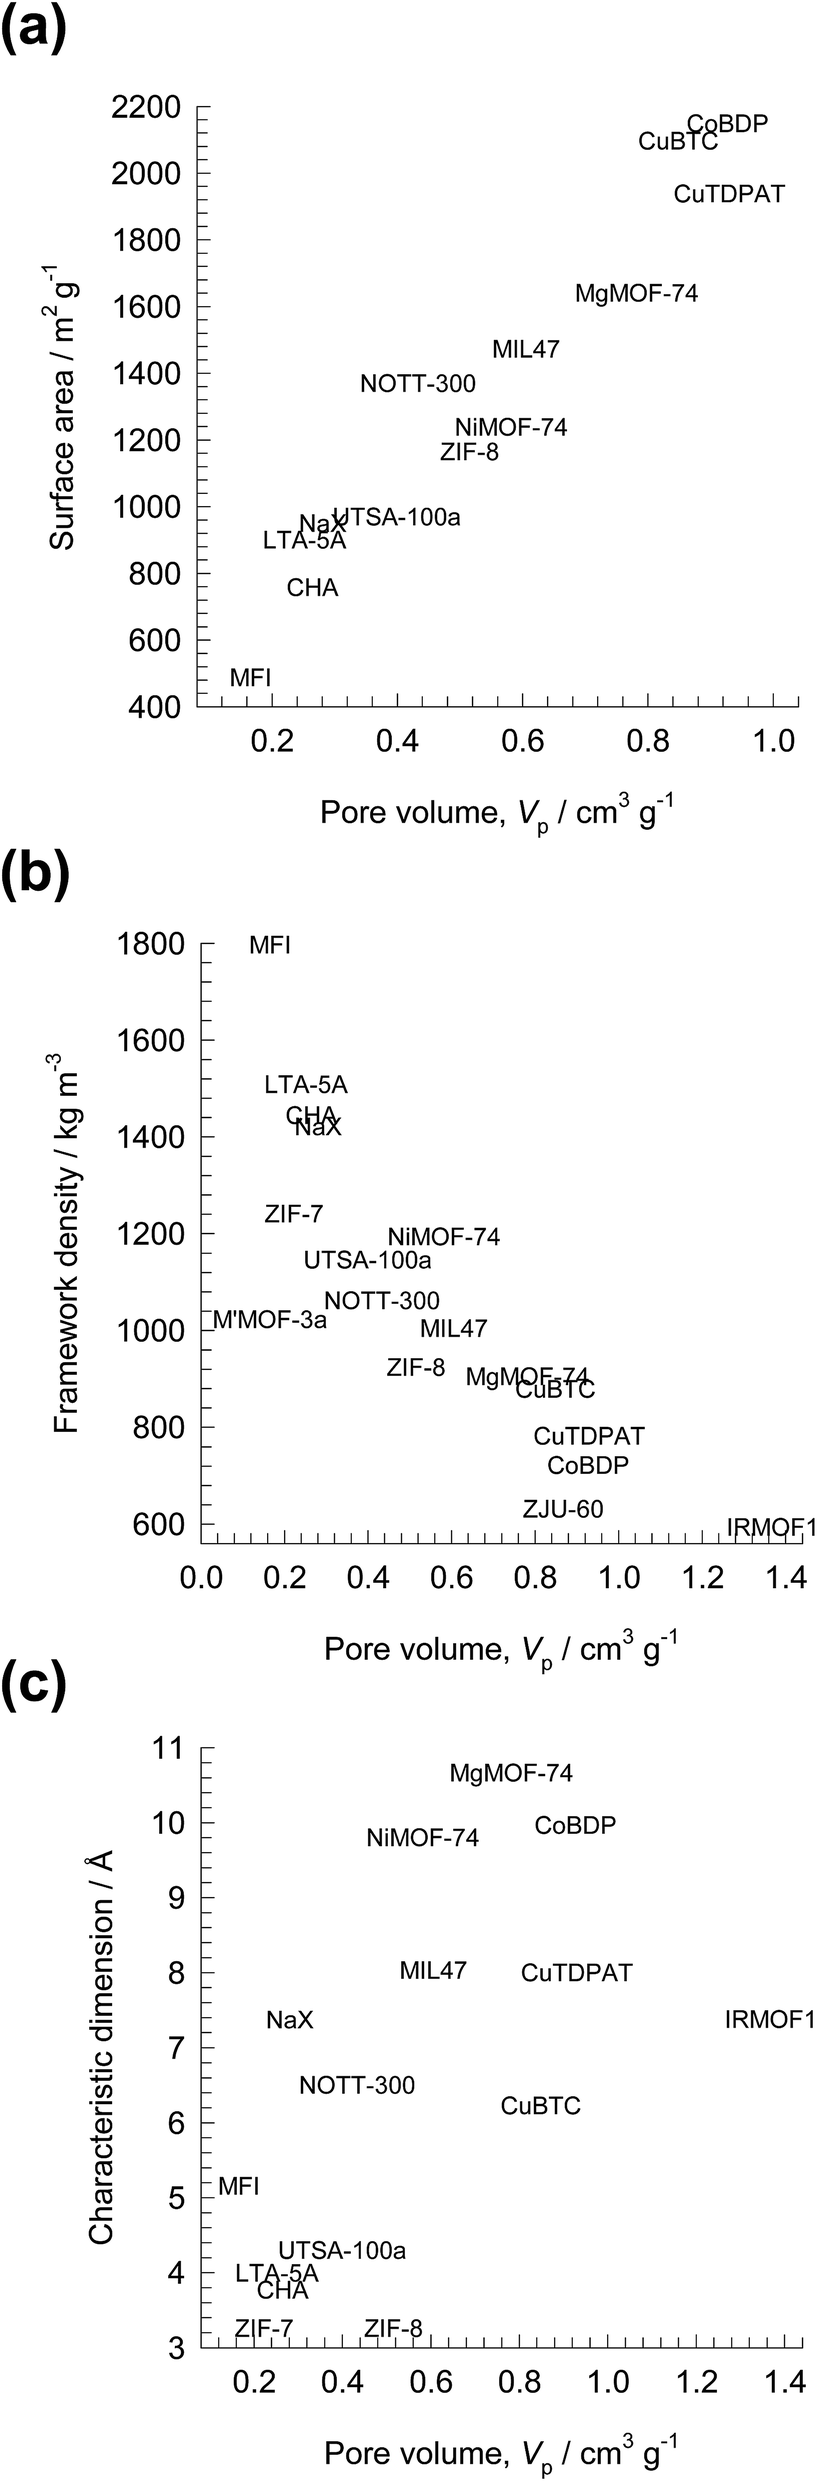 | ||
| Fig. 1 Comparison of surface area, pore volumes, framework densities, and characteristic dimensions of some representative zeolites, MOFs and ZIFs. | ||
Framework flexibility has, in most cases, a negligible influence on the adsorption and diffusion characteristics of zeolites;2 this is because zeolite frameworks are constructed with strong covalent bonds that are rigid.3 On the other hand, many MOFs, and ZIFs possess soft “dynamic” frameworks that may undergo guest-induced structural changes; such transformations can be exploited to achieve selective separations.4,5
MOFs can be synthesized to yield 1D triangular-shaped channels;6,7 this channel geometry is not feasible with zeolites. Unique separation possibilities emerge; for example, 1,3,5-tri-chlorobenzene (TCB) can be selectively separated from its isomers due to optimum face-to-face stacking within the triangular channels;8 see Fig. 2. Separations using MOFs with bespoke-tailored triangular channels for separation of TCB isomers may be difficult to surpass with regard to separation performance.
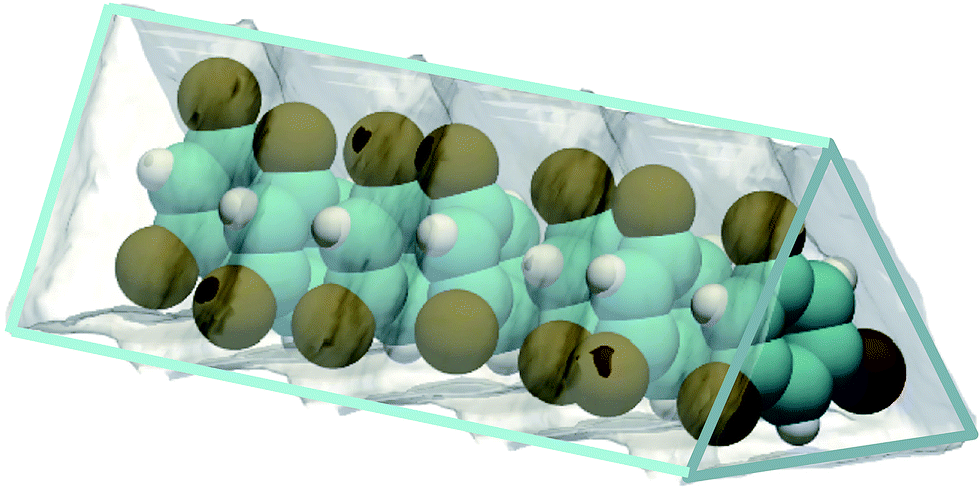 | ||
| Fig. 2 Snapshot showing face-to-face stacking of 1,3,5-trichlorobenzene (TCB) within the triangular channels of Fe2(BDP)3.8 | ||
To set the scene for this article, let us consider the separation of C2H2(1)/CO2(2) mixtures. This separation is important in industry for production of pure C2H2, that is required for a variety of applications in the petrochemical and electronic industries.9 The separation is particularly challenging in view of the similarity in the molecular dimensions.9,10 Both molecules possess zero dipole moments and approximately the same quadrupole moment. The polarizability of C2H2 is slightly higher than that CO2. On the basis of available data on unary isotherms, we conclude that four MOFs have the potential of being applied in this separation task: HOF-3 (a rod-packing 3D microporous hydrogen-bonded organic framework),11 CuBTC (=Cu3(BTC)2 with BTC = 1,3,5-benzenetricarboxylate, also known as HKUST-1),11 ZJU-60a (=Cu2(MFDI)),12 and PCP-33.13 All four MOFs can selectively adsorb ethyne. With HOF-3, the preferential adsorption of ethyne over CO2 is attributed to the unique pockets and pore surfaces.11 The coordinatively unsaturated Cu(II) sites of CuBTC exert stronger interactions with C2H2 than with the O atoms of CO2.10
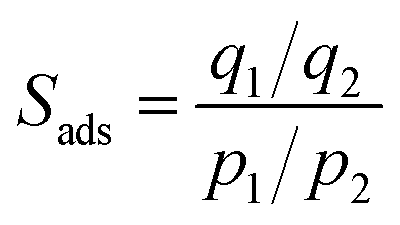
As is commonly done in evaluating the separation performance of MOFs, let us determine the adsorption selectivity, Sads, defined for separation of a binary mixture of species 1 and 2 by
 | (1) |
Fig. 3a presents IAST estimates of Sads for separation of 50/50 C2H2/CO2 mixtures. The hierarchy of Sads values is HOF-3 > CuBTC ≈ ZJU-60a ≈ PCP-33, suggesting HOF-3 as the best choice. The performance of PSA units is also dictated by the uptake capacity. The component loading of C2H2, q1, can be determined from IAST; see Fig. 3b. The hierarchy of uptake capacities, expressed as the number of moles of C2H2 adsorbed per L of adsorbent, is CuBTC > PCP-33 > ZJU-60a > HOF-3.
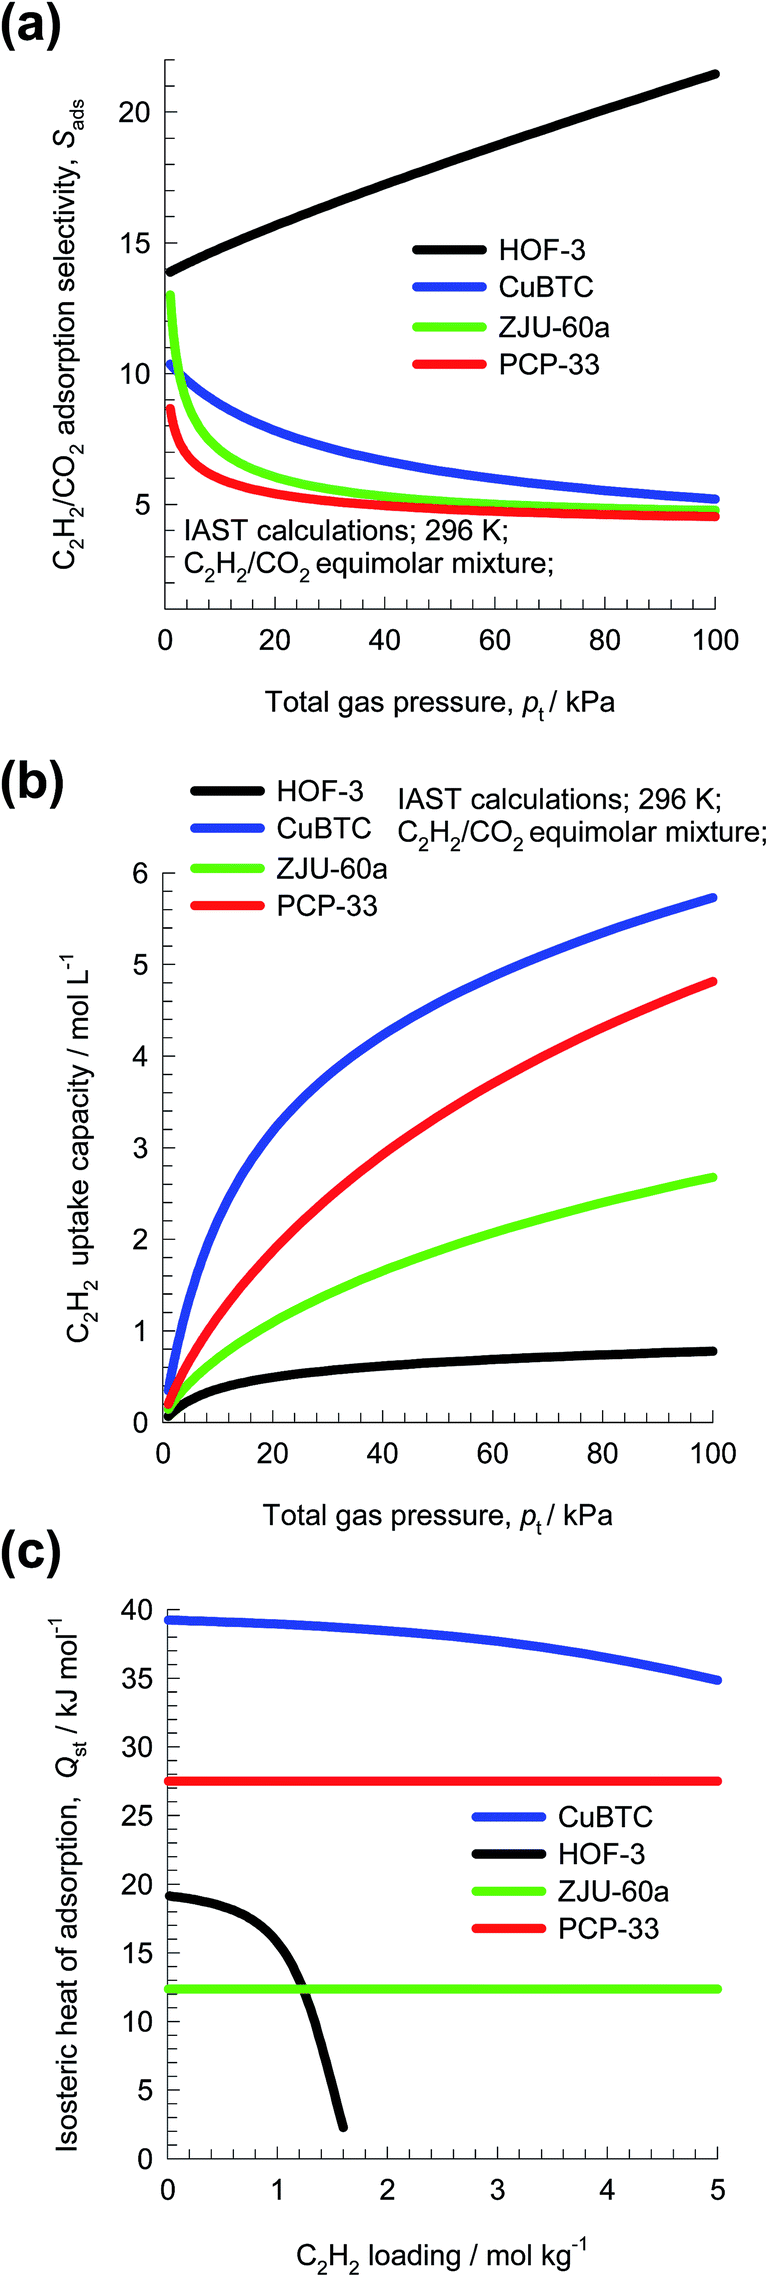 | ||
| Fig. 3 (a and b) IAST calculations of (a) adsorption selectivity, Sads, and (b) uptake capacity of C2H2, for separation of 50/50 C2H2/CO2 mixture at 296 K using HOF-3, CuBTC, ZJU-60a, and PCP-33. (c) Comparison of the isosteric heat of adsorption of C2H2 in four MOFs. | ||
The costs of regenerating the adsorbed C2H2 may be related to the heat of adsorption; Fig. 3c is a plot of the isosteric heats of adsorption, Qst, as a function of loading. We note that the hierarchy in the Qst values is CuBTC > PCP-33 > ZJU-60a ≈ HOF-3. Since the selectivity, capacity, and Qst metrics do not go hand-in-hand, the question arises: how do we weigh the three metrics in an appropriate manner? The primary objective of this review is to discuss methodologies for arriving at a rational choice of the best adsorbent for a specified separation task.
When the number of components in the mixture exceeds two, it is often not obvious, a priori, how the Sads and capacity metrics need to be defined for a meaningful comparison of MOFs. For example, the production of pure H2 from steam-methane reformer off-gas requires separation of H2/CO2/CO/CH4/N2 mixtures. The purity requirement of H2 is stringent, and less than 500 ppm of impurities can be tolerated. The impurity level will be dictated primarily by the sequence of breakthroughs of the exit gas from the fixed bed adsorber; this sequence is not known a priori. The separation of hexane isomers (n-hexane (nC6), 2-methylpentane (2MP), 3-methylpentane (3MP), 2,2-dimethylbutane (22DMB), and 2,3-dimethylbutane (23DMB)) for the purpose of octane enhancement is another example for which the definition of selectivity is not meaningful because the objective is to produce high octane product from the adsorber; sharp separations are not demanded. The secondary objective of this review is to examine and analyze a number of multicomponent mixture separations in order to suggest procedures that need to be adopted in such cases.
The ESI† accompanying this article provides salient structural details of all the adsorbent materials that are evaluated for any specific separation application, along with references to data sources for unary isotherms. For any given separation application, the adsorbent materials have been carefully chosen to highlight a number of issues that are important in selection of the right adsorbent.
2 C2H2/CO2 separations
Fig. 4 shows a schematic of fixed bed adsorber for C2H2/CO2 mixture separations. Transient breakthrough simulations were performed to analyze the separations, using the methodology described in earlier works;20,21 the simulation details are summarized in the ESI.† The validity of the breakthrough simulation methodology has been established by detailed comparisons with experimental data for a wide variety of guest/host combinations.21–26 For all the simulations reported in this article we choose: adsorber length, L = 0.3 m; cross-sectional area, A = 1 m2; superficial gas velocity in the bed, u = 0.04 m s−1; voidage of the packed bed, ε = 0.4. The volume of MOF used in the simulations is (1 − ε)AL. If ρ is the framework density, the mass of the adsorbent in the bed is ρ(1 − ε)AL kg. For presenting the breakthrough simulation results, we use the dimensionless time, , obtained by dividing the actual time, t, by the characteristic time,
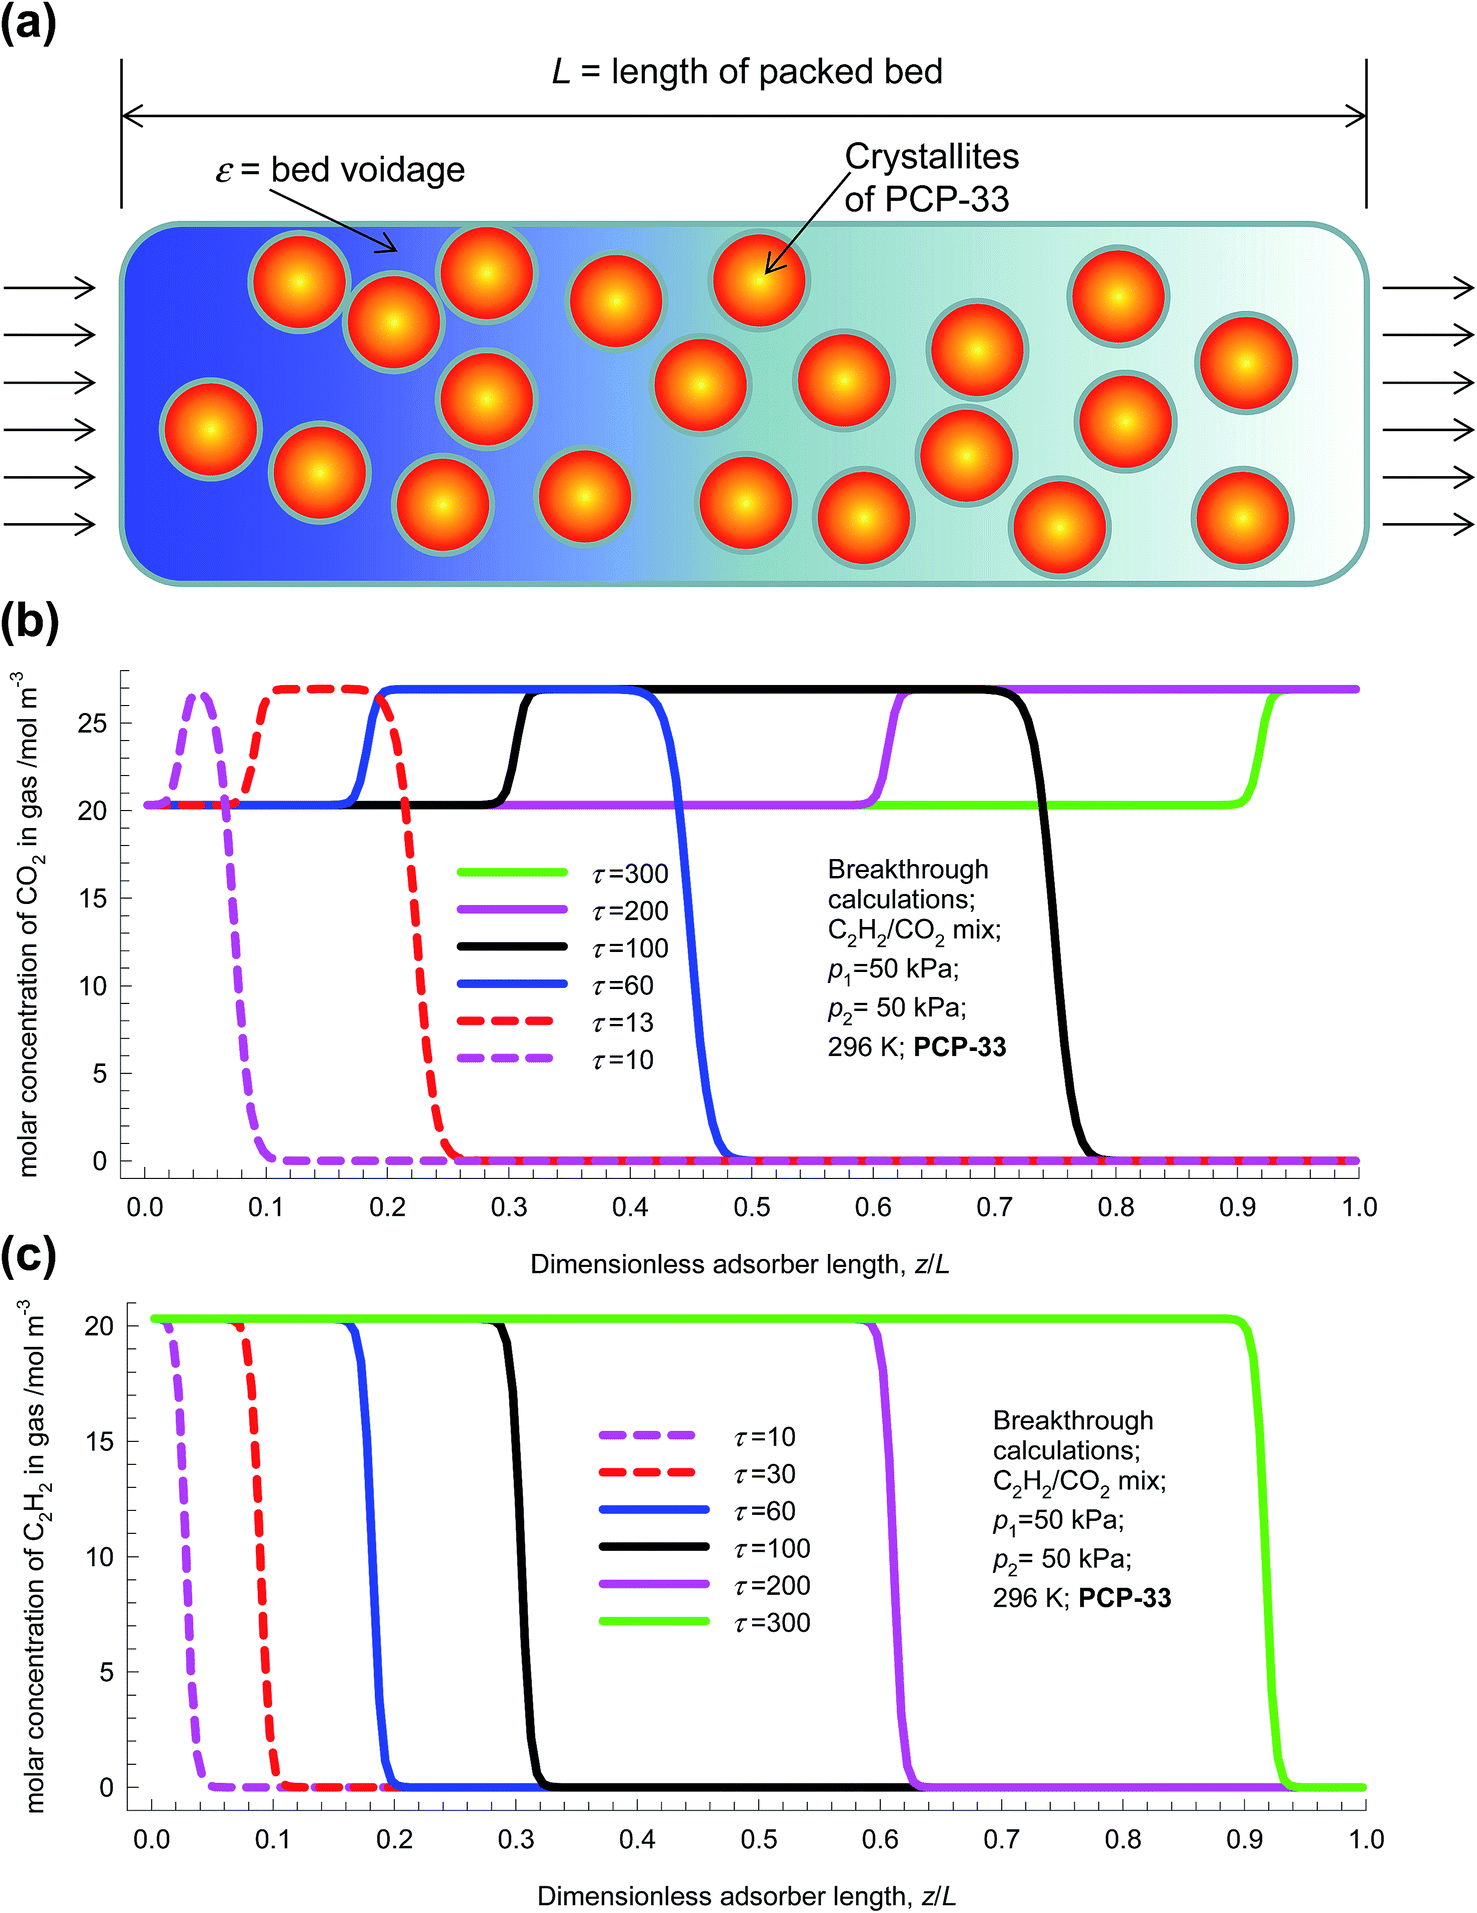 | ||
| Fig. 4 (a) Schematic of fixed bed adsorber for C2H2/CO2 mixture separations. (b and c) Transient development of concentrations of (b) CO2, and (c) C2H2 along the length of the fixed bed adsorber. | ||
For a 50/50 mixture feed to a bed packed with PCP-33 operating at a total pressure of 100 kPa and 298 K, the transient development of concentrations of CO2, and C2H2 along the length of the adsorber are shown in Fig. 4b and c. The gas phase concentration of the more poorly adsorbed CO2 traverses the bed faster than the more strongly adsorbed C2H2. Particularly noteworthy are the concentration overshoots for CO2 during the early stages of the transience. To get a better appreciation of the transient behaviors, video animations are provided as ESI;† these video animations are constructed from the data such as those plotted in Fig. 4b and c. Analogous video animations for the other separations, to be discussed later, are also available as ESI.†
In transient breakthrough experiments, the gas phase concentrations can only be monitored at the exit of the adsorber. It is customary, therefore, to present the transient breakthroughs in the form shown in Fig. 5a. Here, the normalized gas phase concentrations, ci/ci0, monitored at the exit of the adsorber (at position z = L) is plotted as a function of the dimensionless time, τ.
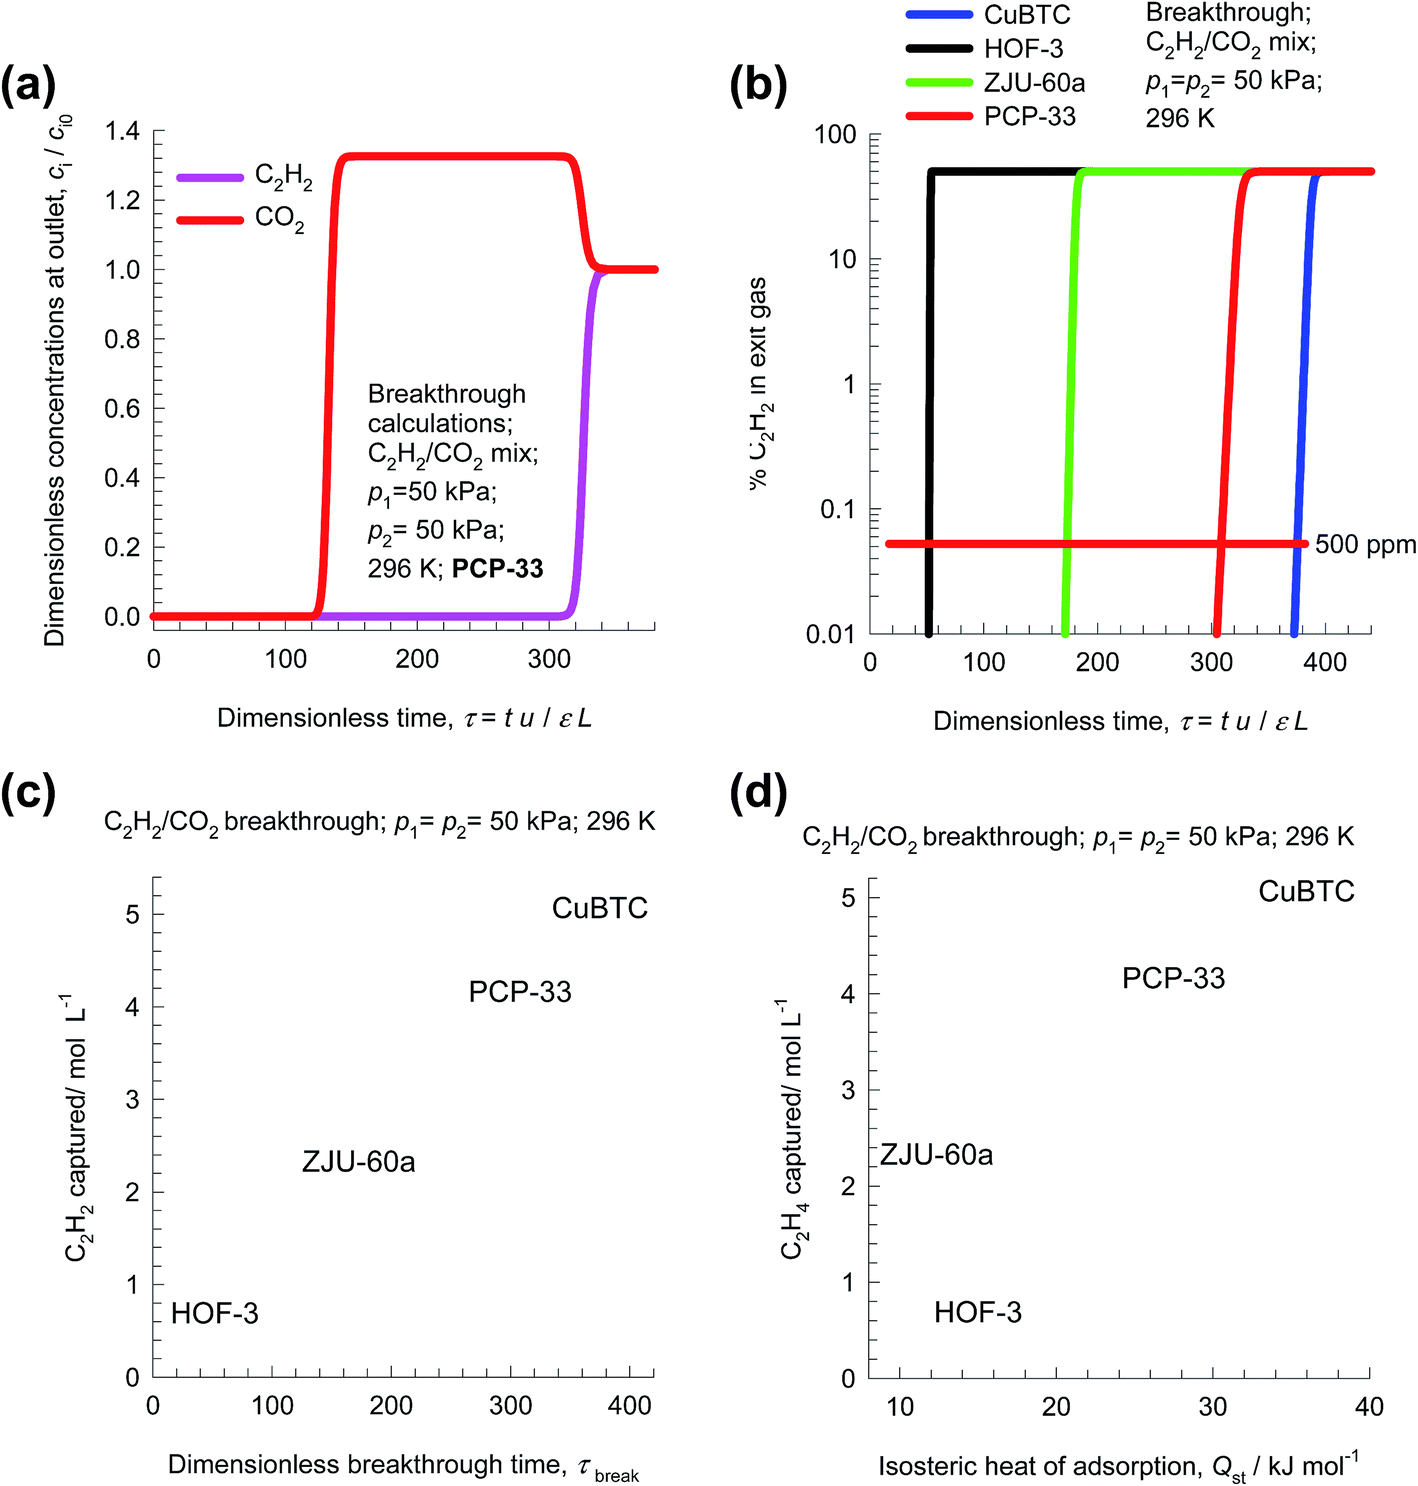 | ||
| Fig. 5 (a) Transient breakthrough of C2H2/CO2 mixture separations in a bed packed with PCP-33. (b) Comparison of % C2H2 in the exit gas for beds packed with HOF-3, CuBTC, ZJU-60a, and PCP-33 plotted as a function of the dimensionless time. (c) Comparison of the moles of C2H2 captured per L of material during the interval for which the product gas is 99.95% CO2, plotted as a function of the dimensionless breakthrough time, τbreak. (d) Plot of the amount of C2H2 captured per L of material during the time interval 0 − τbreak versus the isosteric heat of adsorption. | ||
During the initial transience, the effluent gas contains pure CO2 and this continues until C2H2 starts breaking through because its uptake capacity within the MOF has been reached. Fig. 5b presents a comparison of the % C2H2 in the exit gas for beds packed with HOF-3, CuBTC, ZJU-60a, and PCP-33. In these breakthrough simulations, as with all other simulations in this article, we use the same volume of adsorbent in the breakthrough apparatus, i.e. (1 − ε)AL. Since the framework densities of the three MOFs are different (HOF-3: ρ = 453; CuBTC: ρ = 879; ZJU-60a: ρ = 631; PCP-33: ρ = 1261 kg m−3), the masses of adsorbents are also different. We note that the CuBTC and PCP-33 breakthroughs occur significantly later than the breakthroughs for HOF-3 and ZJU-60a. Delayed breakthroughs are desirable because increased amounts of C2H2 can be captured in each cycle. CuBTC has the longest breakthrough time primarily because of its significantly higher C2H2 uptake capacity (cf. Fig. 3b). The earlier breakthrough with HOF-3 is attributable to its low uptake capacity.
Let us define the breakthrough time, τbreak, as the time at which the exit gas contains <0.05% = 500 ppm C2H2. The value of τbreak is lowest for HOF-3, despite the fact that it has the highest selectivity. The amount of C2H2 captured during the time interval 0 − τbreak can be determined from a material balance. These amounts, expressed as mol C2H2 captured per L of framework material are plotted against τbreak in Fig. 5c. We note that the amount of C2H2 captured is linearly dependent on τbreak. On the basis of this comparison, we conclude that CuBTC has the best separation capability.
Let us turn to regeneration energy requirements. The isosteric heat of adsorption, Qst, can be considered to be representative of regeneration energy required per mole of captured C2H2. Fig. 5d plots the amount of C2H2 captured against Qst. The high capture capacity of CuBTC needs to be weighed against the higher regeneration costs. Detailed costing is required to arrive at the final choice of MOF; such an exercise is beyond the scope of this article. Since CuBTC is a commercially available MOF, it may still end up as the most cost-effective option.
The important message that emerges from this case study C2H2/CO2 mixture separations is that high uptake capacities can overcome the disadvantage of low selectivities, resulting in good separations in fixed beds. Also, low values of the isosteric heats of adsorption, Qst, will not necessarily reduce regeneration energy requirements if the attendant capture capacities are low.
A further point to note is that the water and chemical stability aspects have only been investigated for PCP-33,13 and CuBTC.27,28
3 Xe/Kr separations
The recovery of noble gases such as Xe and Kr from used nuclear fuels is an important industrial problem.29 Fig. 6a presents data on the kinetic diameters and polarizabilities, α, of noble gases (He, Ne, Ar, Kr, Xe). The value of α generally increases with increasing molar mass, because more electrons are available for polarization; see Fig. 6a. As illustration of the efficacy of MOFs for separation of noble gases, Fig. 6b presents pulse chromatographic simulations for separation of a 5-component He/Ne/Ar/Kr/Xe mixture in a fixed bed of CuBTC. The times at which each of the component pulses peak correlates with the corresponding polarizability of the noble gas; see Fig. 6b. Pulse chromatographic simulations and experiments are representative of separations in the Henry regime at low pore occupancies.30,31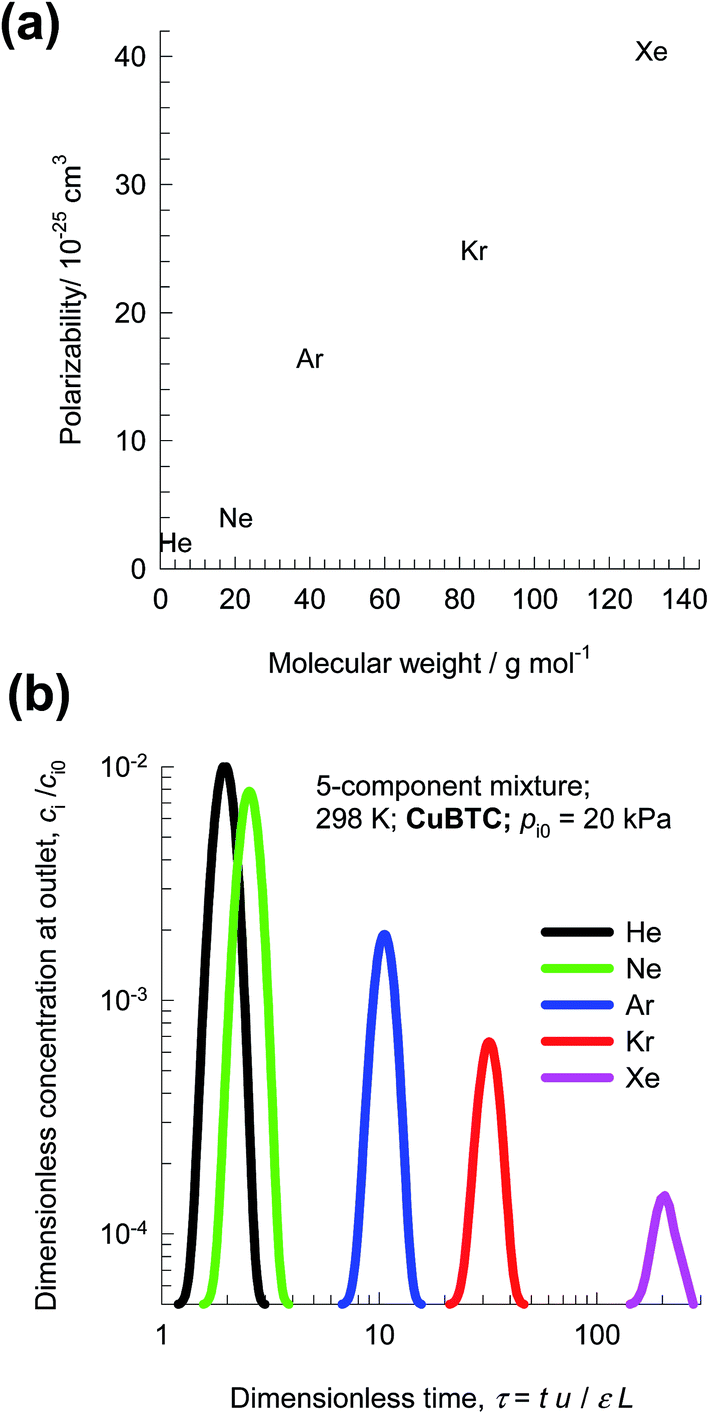 | ||
| Fig. 6 (a) Comparison of molar masses, kinetic diameters, boiling points and polarizabilities of noble gases (He, Ne, Ar, Kr, Xe). (b) Pulse chromatographic simulations for separation of a 5-component mixture of noble gases He/Ne/Ar/Kr/Xe in a fixed bed of CuBTC operating at 298 K and a total pressure of 100 kPa. | ||
Let us now examine the separation of Xe/Kr mixtures in more detail. In the published literature, a number of MOFs have been developed with the potential for application in the Xe/Kr separation process. Wang et al.32 demonstrate the highly selective adsorption of Xe in CoFormate (=Co3(HCOO)6), that is attributed to its commensurate positioning of Xe within the cages. This commensurate positioning also implies that the intra-crystalline diffusivity of Xe will be significantly lower than that of Kr.29,33,34 The experimental breakthroughs reported by Wang et al.32 for 10/90 Xe/Kr mixtures in a bed packed with CoFormate are shown in Fig. 7a. The experimental breakthrough of Xe has a distended character; this indicates strong diffusion limitations.
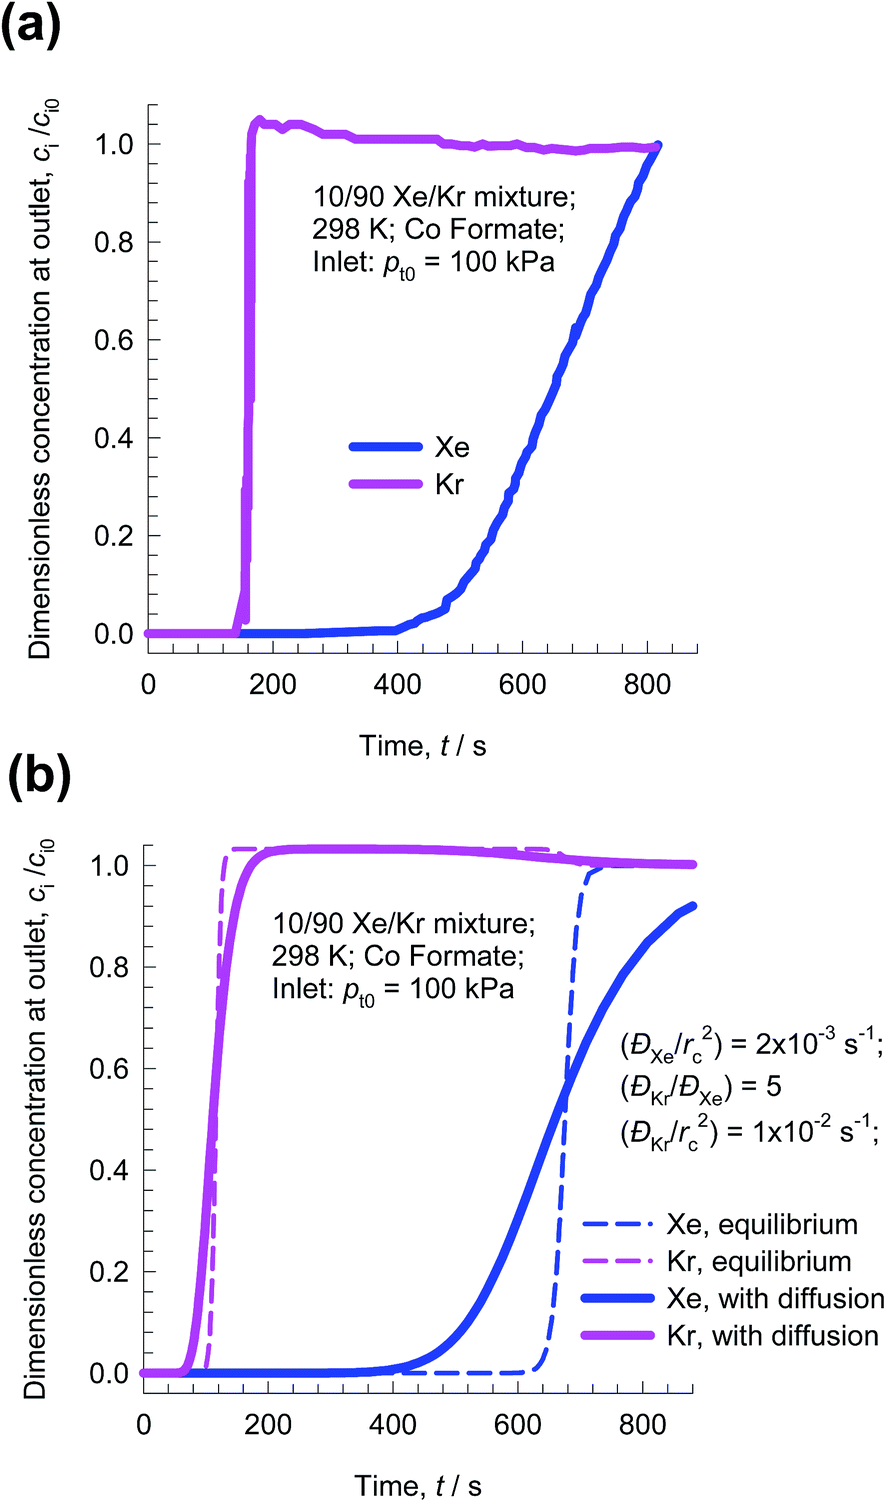 | ||
| Fig. 7 (a) Experimental breakthroughs for 10/90 Xe/Kr mixtures at 298 K and 100 kPa in a bed packed with CoFormate; the data are scanned from Fig. S9 of the ESI† accompanying the paper by Wang et al.32 (b) Simulations without intra-crystalline diffusion limitations (i.e. equilibrium between bulk gas and crystal at any location and indicated by dashed lines) are compared with breakthrough simulations that include intra-crystalline diffusion effects. The chosen diffusivity values are ĐXe/rc2 = 2 × 10⁻³ s−1; ĐKr/rc2 = 1 × 10⁻² s−1. | ||
Fig. 7b presents the transient breakthrough simulations using the data inputs corresponding to the experiments of Wang et al.32 The experimental breakthroughs are reproduced, nearly quantitatively, by transient breakthrough simulations that include the influence of intra-crystalline effects with the chosen values ĐXe/rc2 = 2 × 10⁻³ s−1; ĐKr/rc2 = 1 × 10⁻² s−1; here Đi is the intra-crystalline diffusivity, and rc is the radius of the crystallites. We note that the diffusivity of Xe within the pores is a factor five lower than that of Kr because of the much more strongly confined Xe that adsorbs commensurately within the cages. If intra-crystalline diffusional influences are ignored and adsorption equilibrium is assumed to prevail at every position z, and any time t, we obtain the sharp breakthroughs represented by the dashed lines in Fig. 7b. The distended breakthrough of Xe has an impact on the separations, as we explain below.
Following the earlier works of Banerjee et al.,29 and Chen et al.,35 let us compare the separation performance of CoFormate with four other MOFs: NiMOF-74 (ref. 36 and 37) Ag@NiMOF-74,37 CuBTC,36,38 and SBMOF-2.35 Fig. 8a presents a comparison the Sads values for 20/80 Xe/Kr mixtures as a function of the total gas pressure pt = p1 + p2. We note that the hierarchy of Sads is CoFormate > Ag@NiMOF-74 > NiMOF-74 > SBMOF-2 > CuBTC. The introduction of well-dispersed Ag nanoparticles into NiMOF-74, results in stronger interactions of the polarizable Xe with the adsorbent Ag@NiMOF-74. The geometry of the channels of SBMOF-2 provides a better match for the larger Xe atoms rather than smaller Kr, and helps explain the selectivity for Xe over Kr.
 | ||
| Fig. 8 (a) Comparison of adsorption selectivity, Sads, for 20/80 Xe/Kr mixtures using NiMOF-74, Ag@NiMOF-74, CuBTC, SBMOF-2, and CoFormate as a function of the total gas pressure. (b) Ppm Xe in the outlet gas mixture of 20/80 Xe/Kr mixtures in fixed beds packed with five different MOFs, plotted as a function of the dimensionless time. (c) Dependence of the productivity of pure Kr (with <1000 ppm Xe), expressed in mol of product per L of MOF, as a function of the dimensionless breakthrough time, τbreak. | ||
Let us compare the separation of 20/80 Xe/Kr mixtures in fixed beds packed with the four MOFs. The transient breakthrough simulations for NiMOF-74, Ag@NiMOF-74, SBMOF-2, and CuBTC assume thermodynamic equilibrium because the influence of diffusional limitations are established to be of negligible importance.29 For CoFormate the breakthrough simulations include intra-crystalline diffusion effects with the diffusivity values that are chosen to match the published breakthrough experimental data in Fig. 7.29 On the basis of the outlet gas compositions, we can determine the ppm Xe in the exiting gas as a function of the dimensionless time, τ; see Fig. 8b. Let us assume that the desired product Kr should have a purity corresponding to 1000 ppm Xe. Corresponding to this purity requirement we can determine the dimensionless breakthrough time, τbreak, at which the operation of the fixed bed needs to be stopped and regeneration started to recover pure Xe. From a material balance, we can determine the productivity of Kr during the time interval 0 − τbreak. The productivities, expressed as mol of pure Kr produced per L of MOF are plotted in Fig. 8c as a function of the dimensionless breakthrough time, τbreak. The MOF with the highest productivity is Ag@NiMOF-74. Despite having the highest adsorption selectivity, CoFormate has a productivity that is significantly lower than that of Ag@NiMOF-74. The reasons for the lower productivity of CoFormate are two-fold: (a) lower uptake capacity, and (b) strong diffusional limitations.
This case study on Xe/Kr separations highlights the negative influence of intra-crystalline diffusion effects in CoFormate, leading to diminished capture capacities in fixed bed adsorbers.
4 CO2/N2 separations
For CO2 capture from flue gas, typically containing 15% CO2, and 85% N2,39 we can rely on selective CO2 binding with extra-framework cations (e.g. Na+, K+, Ca++, Ba++) of zeolites NaX, LTA-4A, and LTA-5A. With MOFs, selective CO2 binding could, for example, achieved with M2+ of M2(dobdc) [Mg, Mn, Co, Ni, Zn, Fe, Cu, Mg] or M2+ of M3(BTC)2 [M = Cu, Cr, Mo]. Wu et al.40 have established that the O atoms of CO2 bind with the Mg atoms of MgMOF-74 (see Fig. 9a), with an associated binding energy of about 42 kJ mol−1. Fig. 9b compares the isosteric heat of adsorption of CO2 in six different adsorbents. The stronger the CO2 binding, the higher is the selectivity in favor of CO2 in separations.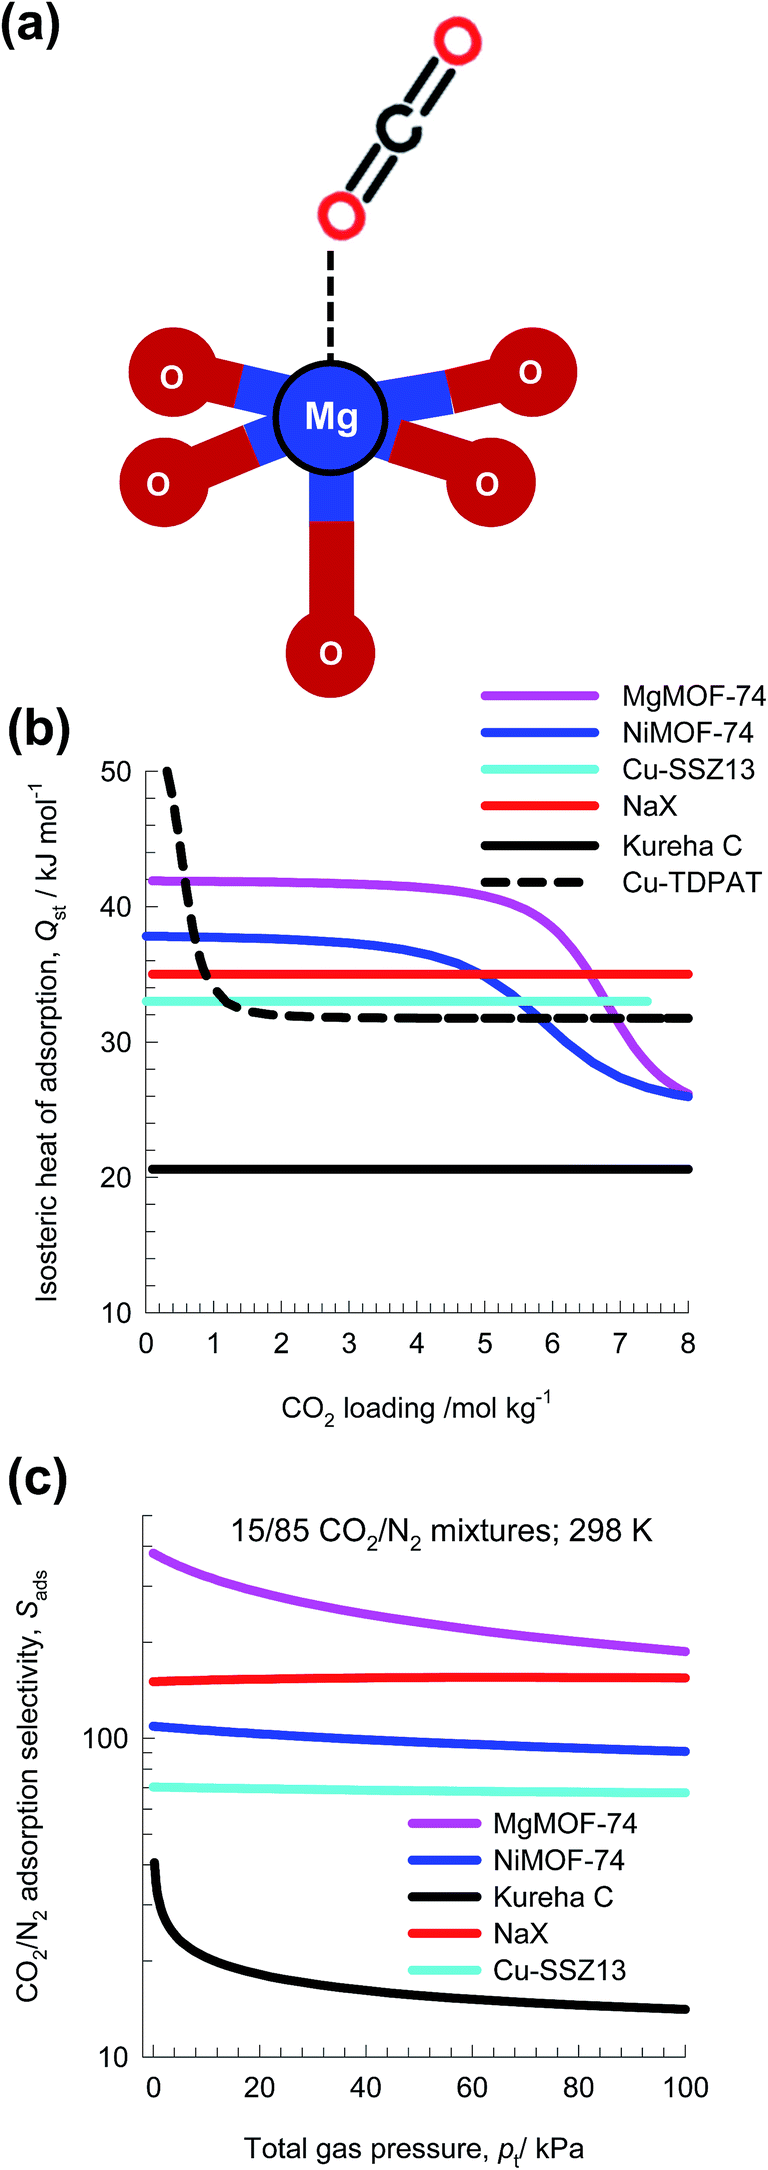 | ||
| Fig. 9 (a) O atom of CO2 binds with metal atoms of MgMOF-74. (b) Isosteric heat of adsorption of CO2 in six different adsorbents: MgMOF-74, NiMOF-74, NaX zeolite, Kureha carbon, Cu-SSZ13, and Cu-TDPAT. (c) IAST calculations of adsorption selectivity, Sads for separation of 15/85 CO2/N2 mixtures at 298 K. | ||
Fig. 9c presents the IAST calculations of Sads for separation of 15/85 CO2/N2 mixtures at 298 K using five different adsorbents: MgMOF-74,39 NiMOF-74,41 NaX zeolite,42 Kureha carbon,26 and Cu-SSZ13.43 Kureha carbon exhibits the lowest CO2/N2 selectivity. The high selectivities of MgMOF-74, and NiMOF-74 are attributable to the strong binding of CO2 with open metal sites. The electrostatic interactions of CO2 with the extra framework cations Na+ and Cu2+ account for the high selectivities exhibited by NaX and Cu-SSZ13 zeolites. The hierarchy of Sads is the same as the hierarchy of values of Qst shown in Fig. 9b; this is to be expected.
Transient breakthrough simulations are carried out to determine the relative separations in fixed bed adsorbers. Intra-crystalline diffusion resistances are of negligible importance for MgMOF-74, NiMOF-74, and NaX zeolites, that have characteristics pore dimensions larger than 7.4 Å. Detailed analyses of the breakthrough experimental data of Chen et al.24 and Yu et al.26 confirm that intra-particle diffusion limitations are of negligible for NiMOF-74 and Kureha carbon. The situation with Cu-SSZ13 zeolite is different; this cage-type zeolite has the CHA topology and consists of consists of 316 Å3 sized cages separated by 3.8 Å × 4.2 Å sized windows. Inter-cage hopping of CO2 and N2 occurs one-at-a-time and is strongly limited by diffusion.2,44 In order to underscore the influence of intra-crystalline diffusion on the separations in fixed beds, Fig. 10a presents two types of simulation results for Cu-SSZ13, both neglecting diffusion limitations (dashed lines) and taking intra-crystalline diffusional influences into account (continuous solid lines). Inclusion of diffusion influences results in distended breakthrough characteristics, causing significantly earlier breakthrough of the more strongly adsorbed CO2. Consequently, the productivity of purified N2 is significantly diminished.
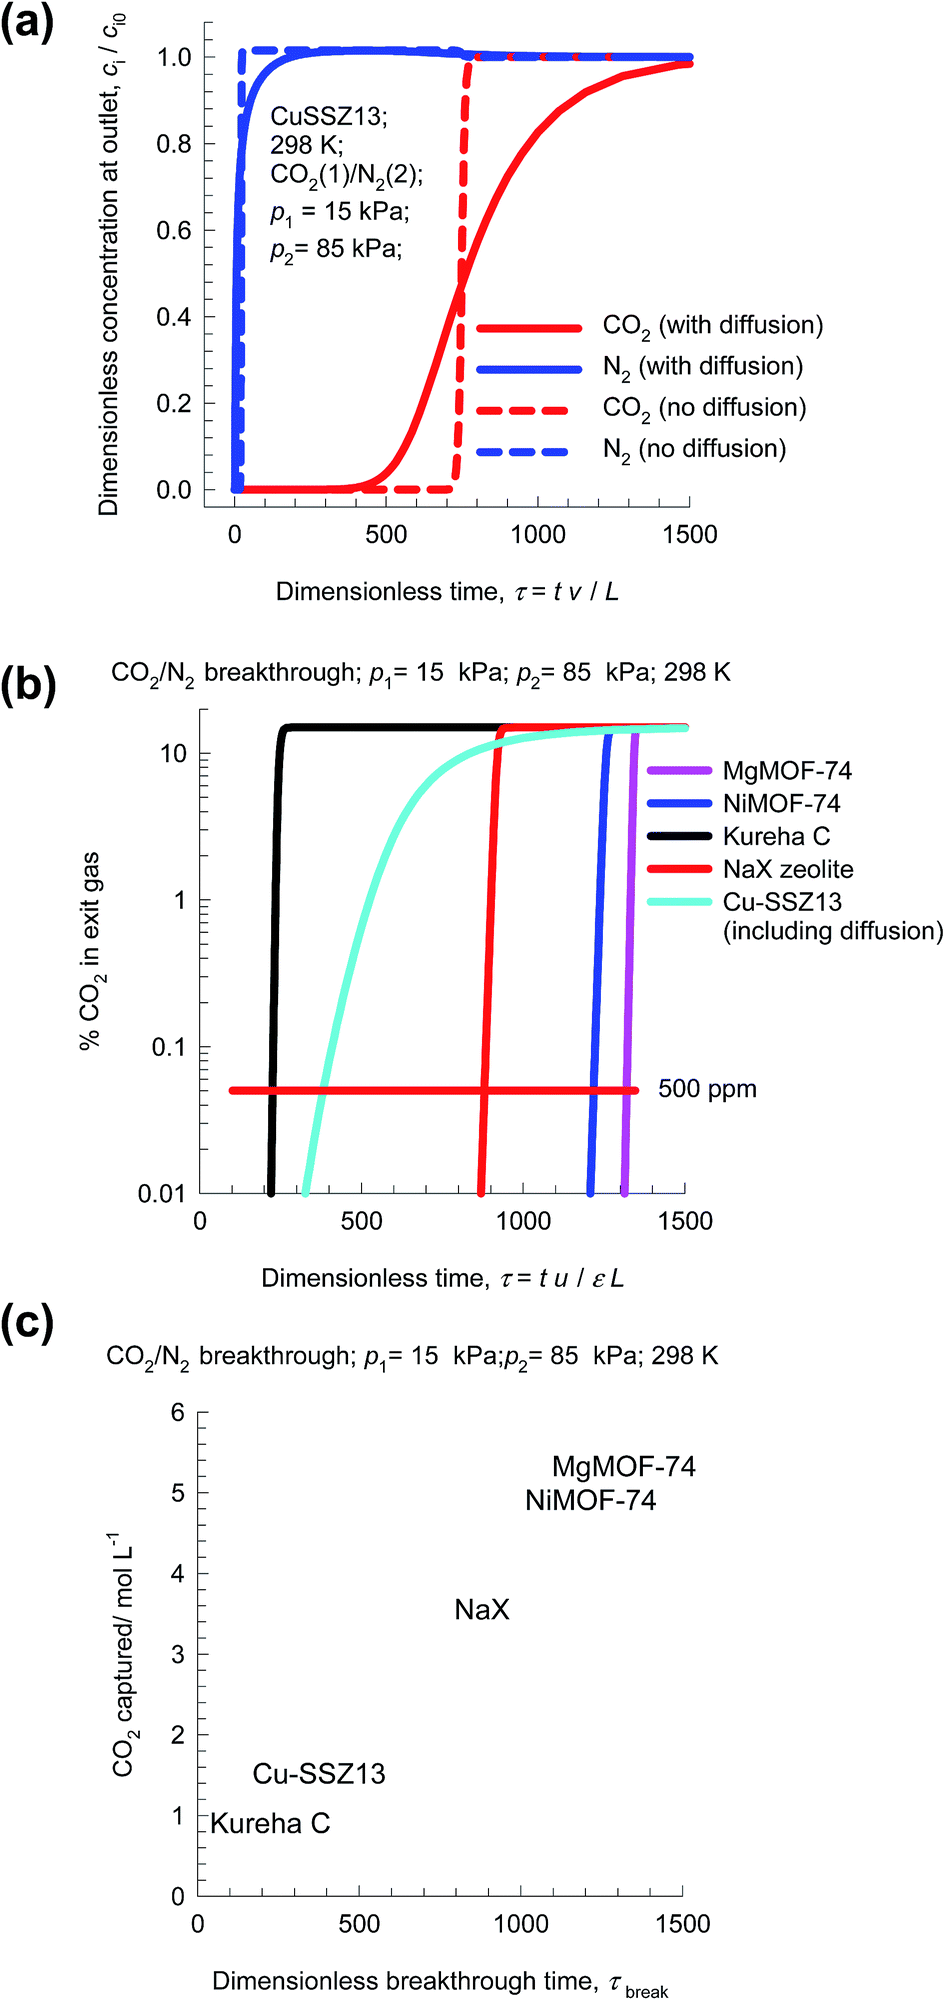 | ||
| Fig. 10 (a) Transient breakthrough simulations for 15/85 CO2/N2 mixtures in CuSSZ-13, including intra-crystalline diffusional limitations (continuous solid lines), and ignoring diffusion (dashed lines). (b) Comparison of % CO2 in the exit gas for beds packed with five different adsorbents, as a function of the dimensionless time. (c) Comparison of the moles of CO2 captured per L of material during the interval for which the product gas is 99.95% N2, plotted as a function of the dimensionless breakthrough time, τbreak. | ||
Fig. 10b presents a comparison of % CO2 in the exit gas for beds packed with the five different adsorbents. Let us arbitrarily define the breakthrough time, τbreak, as the time at which the exit gas contains <0.05% = 500 ppm CO2. The amount of CO2 captured during the time interval 0 − τbreak can be determined from a material balance. These amounts, expressed as mol CO2 captured per L of framework material, are plotted against τbreak in Fig. 10c. The CO2 capture capacity of Cu-SSZ13 is only marginally higher than the value for Kureha carbon. The message emerging from the analysis of CO2/N2 mixtures is that for achieving high CO2 capture capacities, it is of vital importance to avoid use of adsorbents with characteristic pore dimensions significantly smaller than say 7 Å. This implies that materials such as LTA-4A, LTA-5A, SAPO-34, DDR, and KFI zeolites are unlikely to be effective for use in fixed bed separations; such materials are more suitable in membrane constructs.44,45
In addition to capture of CO2 from flue gases, other impurities such as SO2 present in the flue gas mixture need to be removed along with CO2. The hydroxyl groups within the 6.5 Å × 6.5 Å channels of NOTT-300 bind both CO2 and SO2 selectively.46 Fig. 11 presents simulation of transient breakthroughs of 15/75/10 CO2/N2/SO2 mixtures in fixed bed adsorber packed with NOTT-300. The breakthrough of SO2 occurs much later than CO2, indicating the much stronger binding of SO2 as compared to CO2; the SO2/N2 selectivity is not of major importance. The selection of adsorbents should be based primarily on CO2/N2 separation performance.
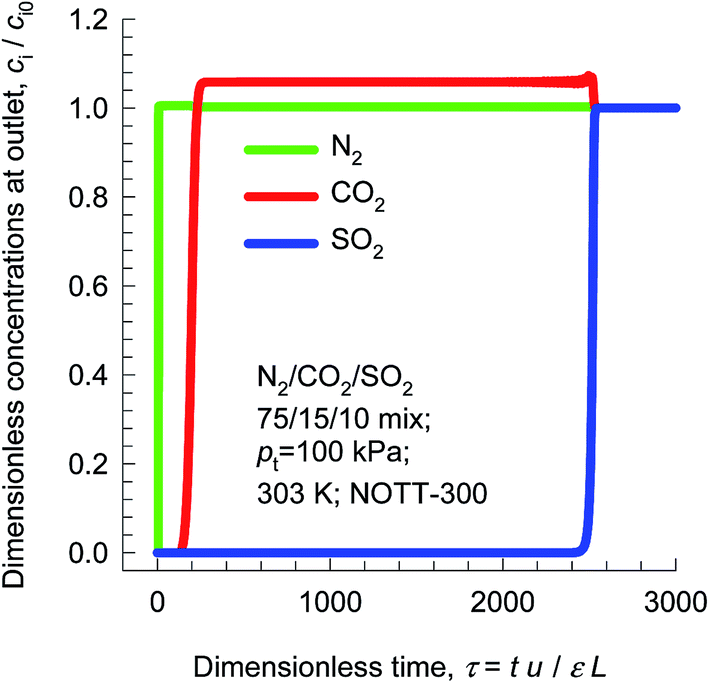 | ||
| Fig. 11 Simulation of transient breakthroughs in fixed bed adsorber with input of 15/75/10 CO2/N2/SO2 mixture using NOTT-300. | ||
5 CO2/CH4 separations
Separation of CO2 from CH4 is relevant to the purification of natural gas, which can have up to 92% CO2 impurity at its source.47 Removal of CO2, which is most commonly accomplished using amines, is conducted between 2 MPa and 7 MPa.48 The separation requirements for production of liquefied natural gas (LNG) are rather stringent, often requiring the achievement of impurity levels of less than 500 ppm CO2.For separation of CO2 from CH4 at high pressures, uptake capacities are of paramount importance. To illustrate this, let us compare separations of 50/50 CO2/CH4 mixtures at 298 K using MgMOF-74, NiMOF-74, NaX zeolite, Kureha carbon, and Cu-TDPAT. The experimental isotherm data for Kureha carbon is available only for pressures up to 0.3 MPa;26 consequently the selectivity and uptake capacities are calculated only up to a total pressure of 0.6 MPa. Fig. 12a presents IAST calculations of Sads; the hierarchy of Sads values is MgMOF-74 > NiMOF-74 ≈ NaX ≫ Cu-TDPAT > Kureha carbon. The CO2 uptake capacity in 50/50 CO2/CH4 mixtures is plotted in Fig. 12b as a function of the total pressure pt. For operations at pressure pt < 100 kPa, the hierarchy of CO2 uptake capacity is MgMOF-74 > NiMOF-74 > NaX > Cu-TDPAT > Kureha carbon. However, for pt > 1 MPa, the hierarchy of CO2 uptake capacity is MgMOF-74 > Cu-TDPAT > NiMOF-74 > NaX. The uptake capacity of NaX is severely limited due to its significantly lower pore volume than available with MOFs (cf. Fig. 1). Transient breakthrough simulations were carried out for fixed bed adsorbers operating at total pressures pt = 100 kPa, and pt = 2 MPa. The amount of CO2 captured during the during the time interval 0 − τbreak, as a function of τbreak are presented in Fig. 12c and d. We define the breakthrough time, τbreak, as the time at which the outlet gas contains the arbitrarily chosen purity level of 500 ppm CO2. We note that for operations at pt = 100 kPa, the hierarchy of CO2 captured is MgMOF-74 > NiMOF-74 ≈ NaX ≫ Cu-TDPAT > Kureha carbon, that is dictated by the uptake capacities plotted in Fig. 12b. However, for operations at pt = 2 MPa, the hierarchy of CO2 captured is MgMOF-74 > Cu-TDPAT > NiMOF-74 > NaX. The worst separation performance is with NaX; the diminished effectiveness of NaX at high pressures is due to capacity limitations. The higher uptake capacity of Cu-TDPAT, accounts for improved performance with increasing pressures. Generally speaking, MOFs with pore volumes in excess of say 0.9 cm3 g−1 are desirable for CO2/CH4 separations at high pressures.
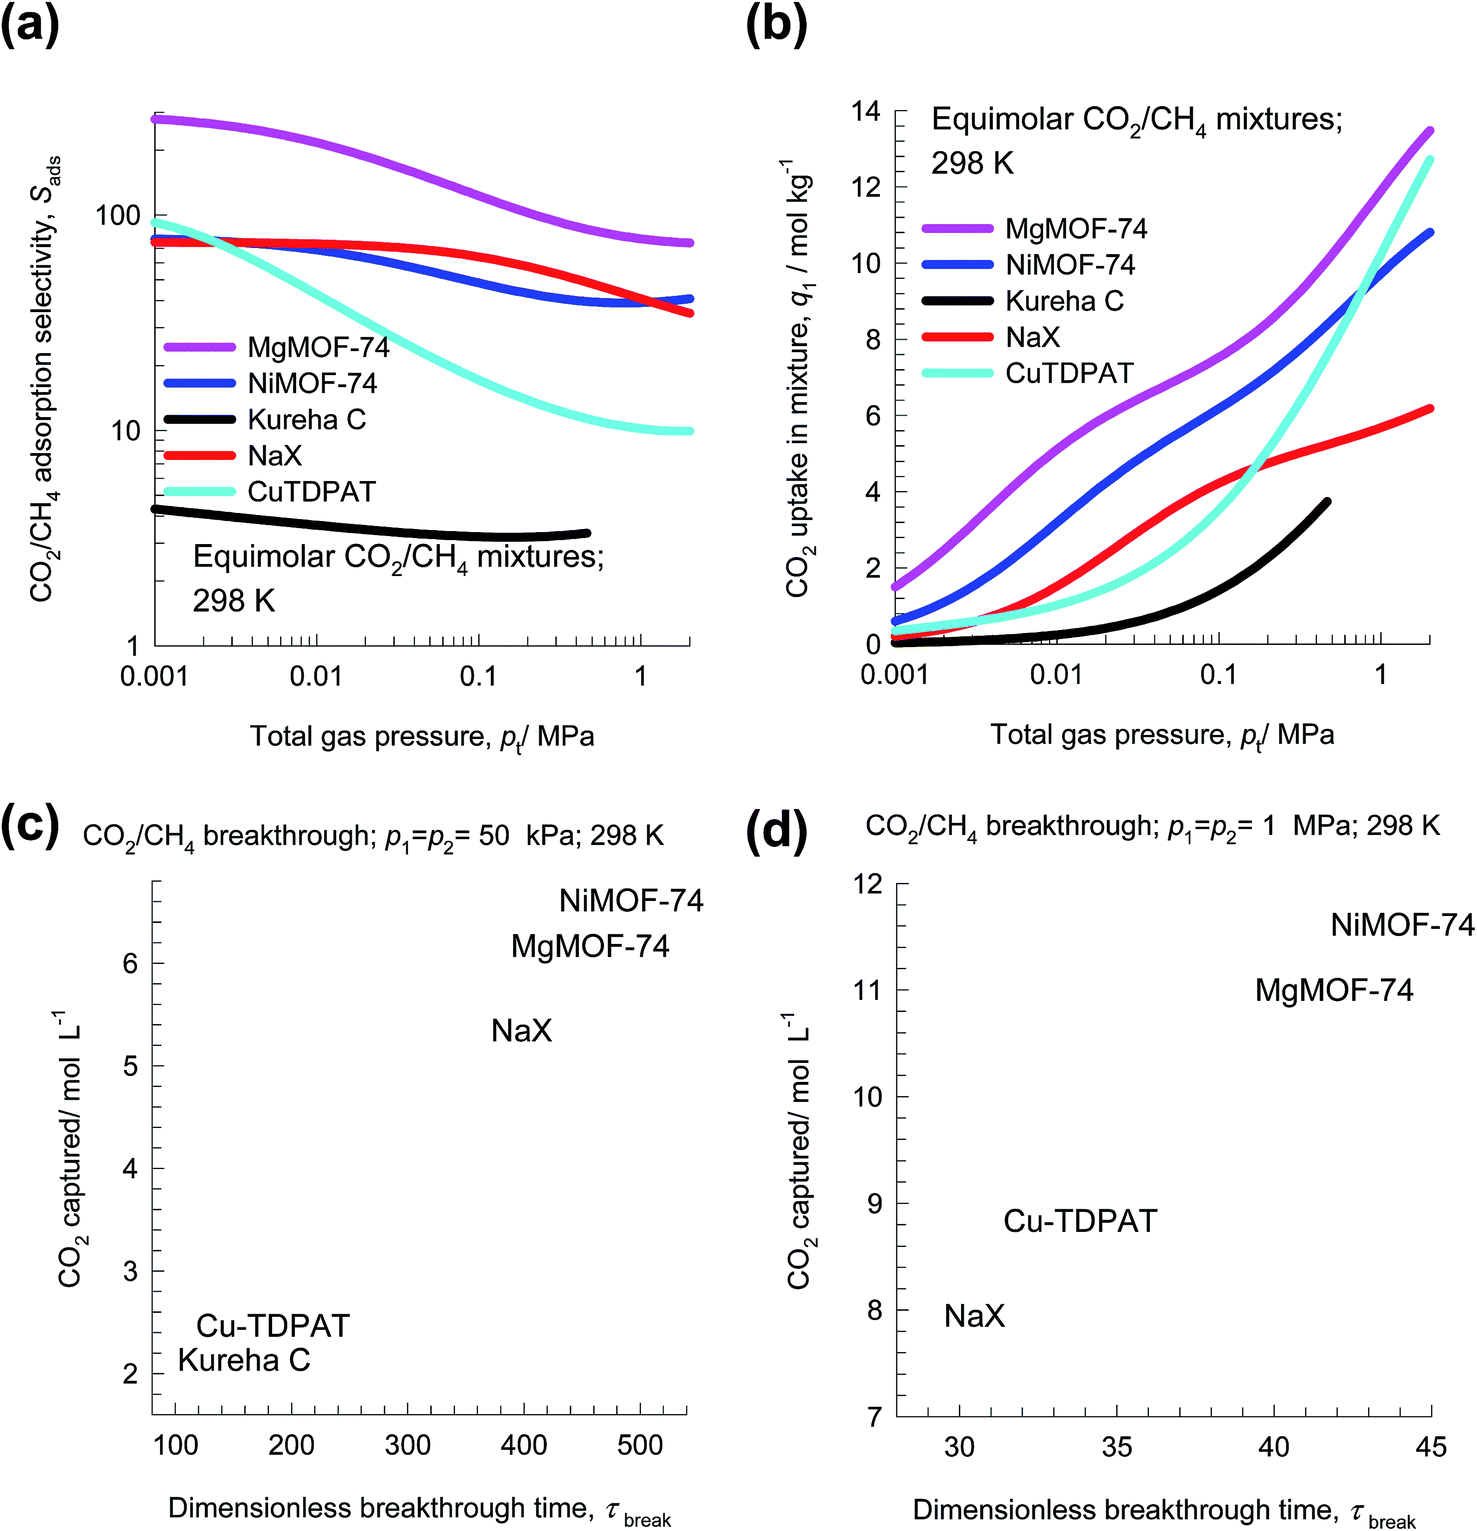 | ||
| Fig. 12 (a and b) IAST calculations of (a) adsorption selectivity, Sads, and (b) CO2 uptake capacity of 50/50 CO2/CH4 mixture at 298 K using MgMOF-74, NiMOF-74, NaX zeolite, Kureha carbon and Cu-TDPAT. (c and d) Plots of the amount of CO2 captured per L of material during the time interval 0 − τbreak as function of the dimensionless breakthrough time, τbreak, for operations at (c) 100 kPa, and (b) 2 MPa. | ||
Plots such as those shown Fig. 5c, 8b, 10c, 12c and d are useful in selecting MOFs for a specified separation task. In these plots, the transient breakthrough simulations are performed under precisely the same set of conditions with respect to fixed bed dimension, flow rates, temperature, and inlet partial pressures of guest species. Under these conditions, the breakthrough times are representative of the capture capacities for the more strongly adsorbed component.
Such plots can also be constructed using experimental breakthroughs. However, it is unusual to find a set of experimental breakthroughs with different materials for the same set of operating conditions. We examine two available sets of data below; the ESI† contains details of the analysis of experimental breakthroughs.
Fig. 13a presents the experimental data of Li et al.49 for % CO2 in exit gas for breakthroughs of 40/60 CO2/CH4 mixtures in a fixed bed packed with five different adsorbents. The observed hierarchy of breakthroughs is Activated Carbon (AC) MIL-100(Cr), NiMOF-74, CoMOF-74, and MgMOF-74. The respective breakthrough times are representative of the CO2 capture capacities; this data can be used to rank MOFs.
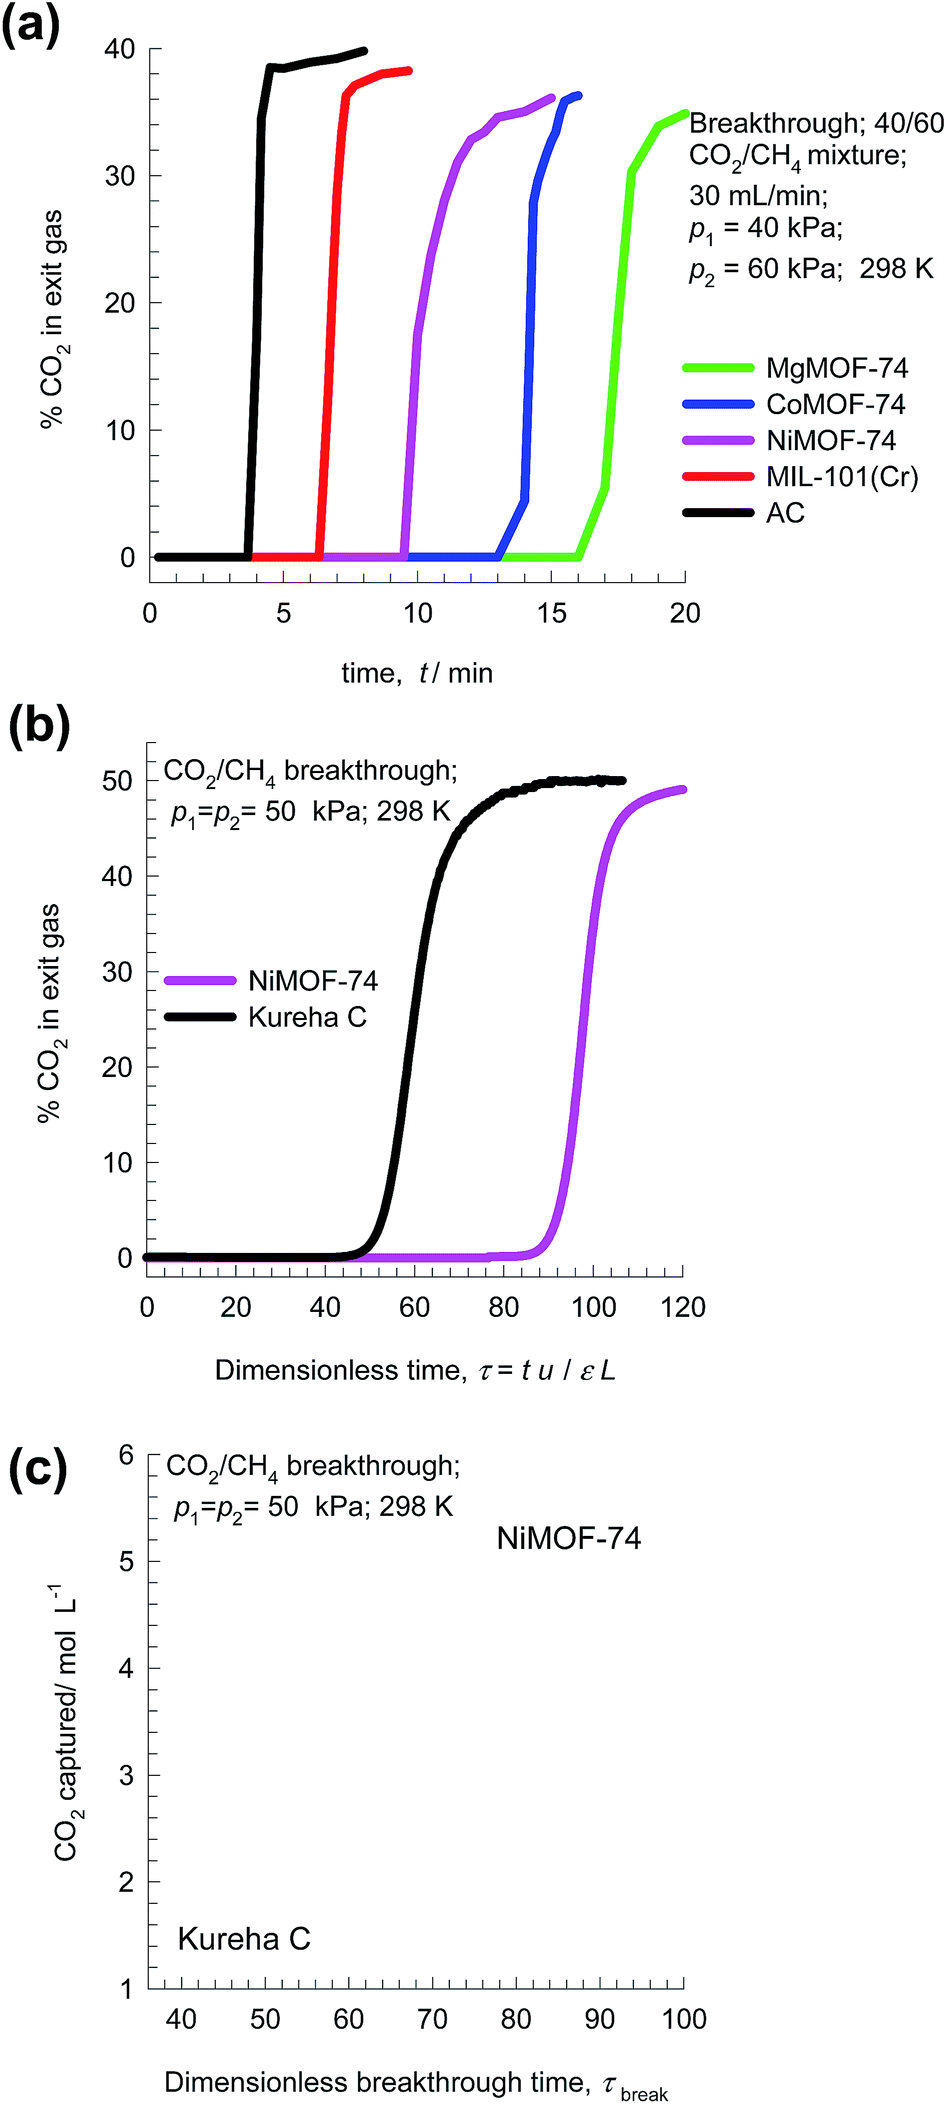 | ||
| Fig. 13 (a) Experimental data of Li et al.49 on the % CO2 in exit gas for transient breakthroughs of 40/60 CO2/CH4 mixtures in a fixed bed packed with five different adsorbents MgMOF-74, CoMOF-74, NiMOF-74, MIL-100(Cr), and Activated Carbon (AC). (b and c) Experimental data of Chen et al.24 and Yu et al.26 for transient breakthroughs of CO2/CH4 mixtures in bed packed with NiMOF-74 and Kureha carbon. The inlet partial pressures are p1 = p2 = 50 kPa, and T = 298 K. | ||
Another set of experimental breakthroughs are for 50/50 CO2/CH4 mixtures in bed packed with NiMOF-74 and Kureha carbon measured in the same set-up and reported by Chen et al.24 and Yu et al.;26 see Fig. 13b. The breakthrough with NiMOF-74 occurs at a significantly later time than Kureha carbon. From a material balance, we can determine the corresponding volumetric CO2 capture capacities; see Fig. 13c. We note that the volumetric CO2 capture capacity of NiMOF-74 is 3.5 times that of Kureha carbon. From the corresponding data determined from transient breakthrough simulations (presented in Fig. 12c), the ratio of the capture capacities of NiMOF-74 and Kureha carbon is 3.1. The closeness in the two sets of CO2 capture capacity values is testimony to the accuracy of the transient breakthrough simulations in quantifying the separation capability of a MOF in fixed bed adsorbers. Indeed, the papers of Chen et al.24 and Yu et al.26 demonstrate good agreement of experimental breakthroughs with simulated breakthroughs for a wide range of temperatures and pressures.
Besides CO2, other components such as H2S are also present in small concentrations in natural gas; these also need to be adsorbed. The binding of H2S with metal atoms of MOFs is much stronger than that with CO2. Using NiMOF-74 as adsorbent, for example, the binding is between the S atoms with Ni atoms of NiMOF-74; see Fig. 14a. The stronger binding of H2S with Ni atoms is reflected in a higher heat of adsorption that has a value of 60 kJ mol−1, compared to the value of 38 kJ mol−1 for CO2.50
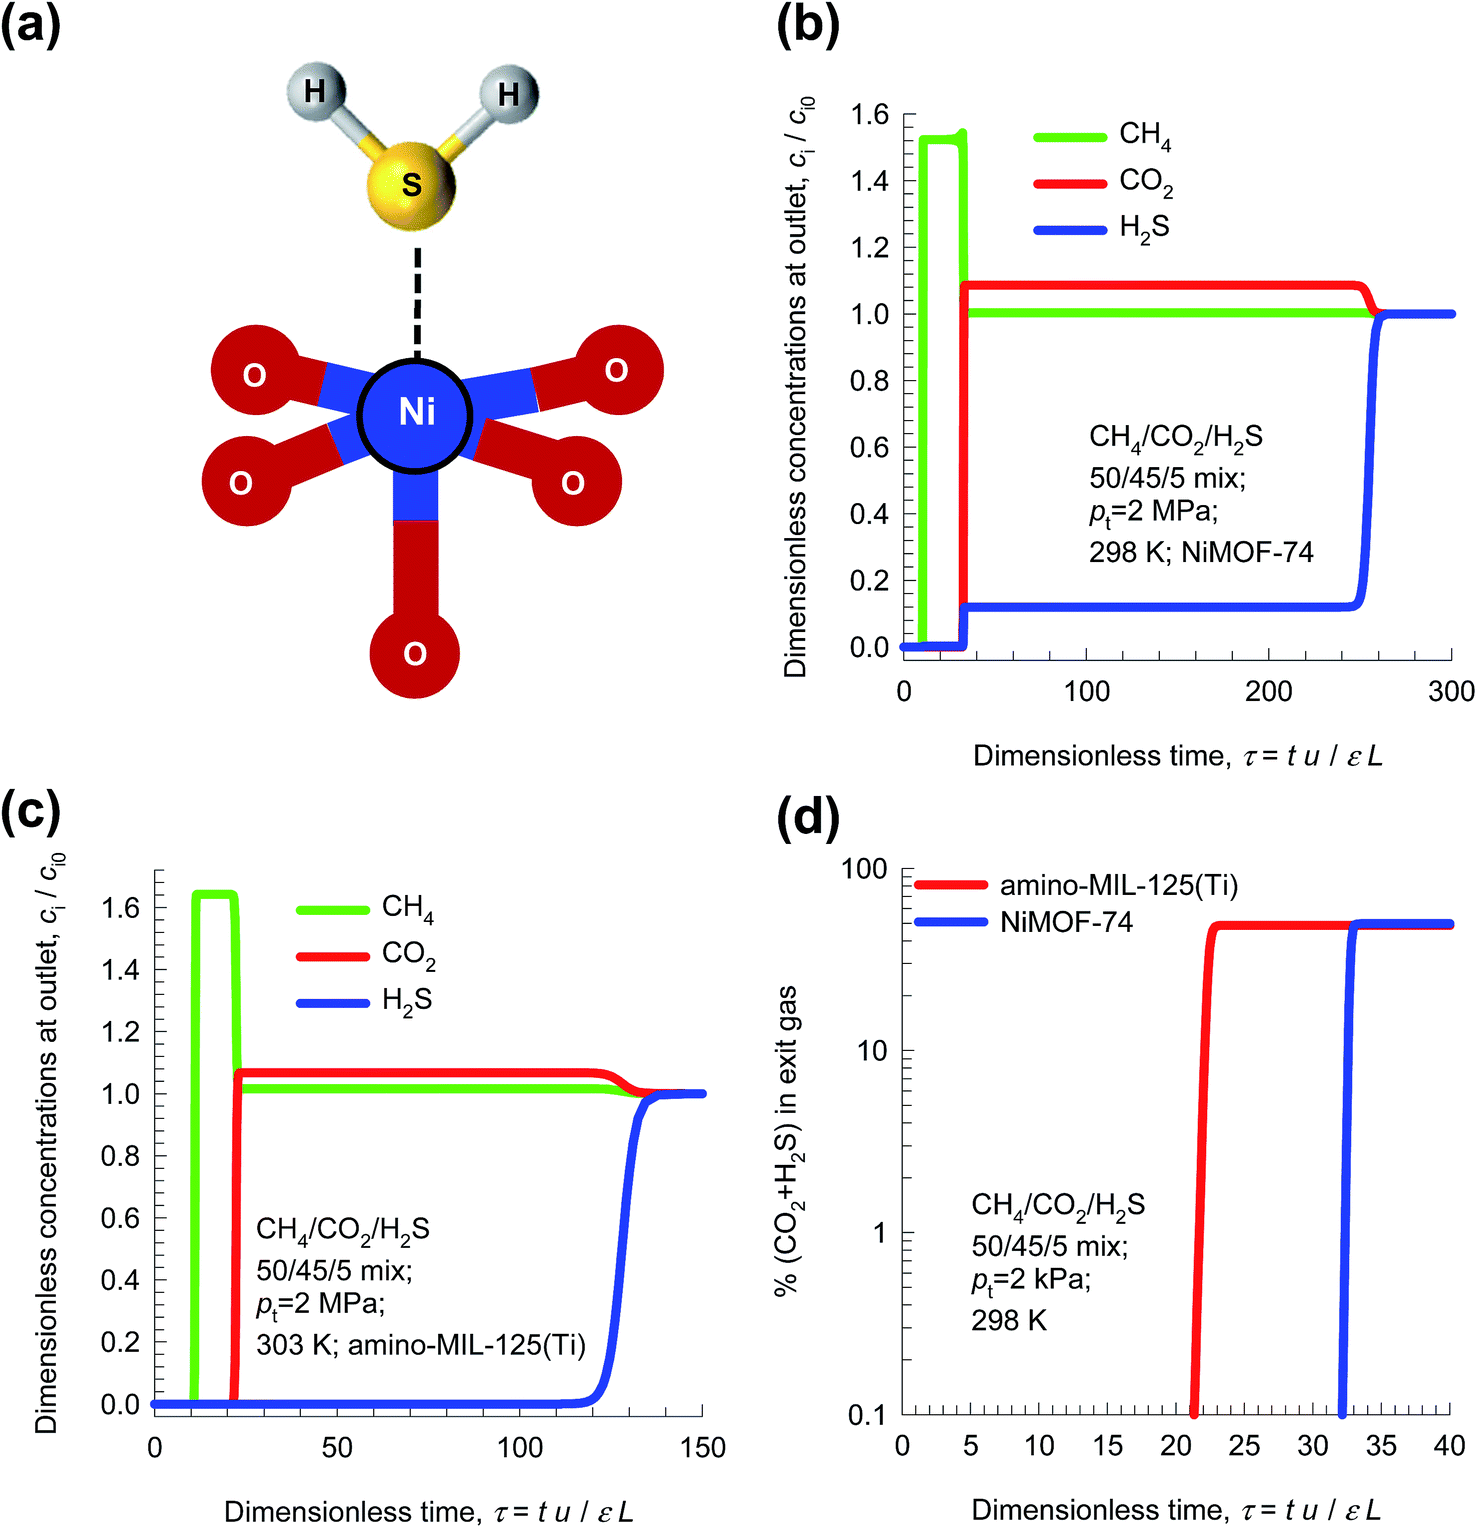 | ||
| Fig. 14 (a) S atoms of H2S bind with metal atoms of NiMOF-74.50 (b and c) Simulation of transient breakthroughs in fixed bed adsorber with input of 45/50/5 CO2/CH4/H2S mixture using (b) NiMOF-74, and (c) amino-MIL-125(Ti). (d) Comparison of the % (CO2 + H2S) in outlet gas stream leaving fixed bed adsorber packed with NiMOF-74 and amino-MIL-125(Ti) as a function of the breakthrough time. | ||
The stronger binding of H2S as compared to CO2 has the consequence that the breakthrough of H2S in a fixed bed adsorber packed with NiMOF-74 occurs significantly later than for CO2. This is illustrated in Fig. 14b for transient breakthrough of 45/50/5 CO2/CH4/H2S mixtures in an adsorber packed with NiMOF-74, operating at 2 MPa and 298 K. Fig. 14c presents the corresponding results of the breakthroughs of CO2/CH4/H2S mixtures using amino-MIL-125(Ti) whose potential for this separation task has been established by Vaesen et al.51 Since the objective is to obtain purified CH4, the purity level will be dictated primarily by the breakthrough of CO2, the first impurity to exit the adsorber. This implies that the separation of CO2/CH4/H2S mixtures can be treated as that for CO2/CH4 separations; there is no point in seeking materials with high adsorption selectivity towards H2S. Put another way, the H2S/CH4 selectivity is not of major importance. Fig. 14d presents a comparison of the % (CO2 + H2S) in outlet gas stream leaving fixed bed adsorber packed with either NiMOF-74 or amino-MIL-125(Ti). For both adsorbents, the purity level of CH4 in the outlet gas is dictated by the breakthrough of CO2. On the basis of this comparison we conclude that NiMOF-74 is the more effective adsorbent for separation of CO2/CH4/H2S mixtures.
The message emerging from the data presented in Fig. 11 and 14 is that for evaluation of MOFs, we need to identify the “key components” that determine multicomponent separations. In these two examples, the key components are, respectively, CO2/CH4 and CO2/N2 mixtures.
6 Separation of H2 from H2/CO2/CO/CH4/N2 mixtures
Pressure swing adsorption is the most commonly used technology for recovery of pure hydrogen from a gaseous streams containing 60–90 mol% H2.52 Steam-methane reformer off-gas (SMROG), after it has been further treated in a water–gas shift reactor, is a commonly used feed gas stream, with typical compositions 70–80% H2, 15–25% CO2, 3–6% CH4, 1–3% CO, and also containing some N2.52–54 The production of pure H2 from steam-methane reformer off-gas requires operation of PSA units at pressures reaching about 5 MPa. Typically, H2 is required with 99.95%+ purity. In fuel cell applications, the purity demands are as high as 99.999%.55 In recent years there has been a considerable amount of research on the development of MOFs for use as adsorbents in PSA processes.22,47,54,56Fig. 15a presents the breakthrough characteristics a 5-component 73/16/3/4/4 H2/CO2/CO/CH4/N2 mixture in an adsorber packed with Cu-TDPAT, and maintained at isothermal conditions at 298 K and total pressure of 0.7 MPa. The sequence of breakthroughs is: H2, N2, CH4, CO, and CO2. The sequence of breakthroughs in a fixed bed packed with UTSA-16a extrudates57,58 is somewhat different: H2, N2, CO, CH4, and CO2; see Fig. 15b. The purity of H2 in the product gas exiting the adsorber is primarily dictated by the presence of the less-strongly adsorbed N2, CO, CH4, rather than CO2, that is the main impurity in the feed gas mixture. The N2/H2, CO/H2, CH4/H2 adsorption selectivities are far more relevant than the CO2/H2 selectivity. The proper methodology for comparing different adsorbents is to perform breakthrough calculations; simple IAST calculations of mixture adsorption equilibrium do not present the complete picture on separation capabilities.
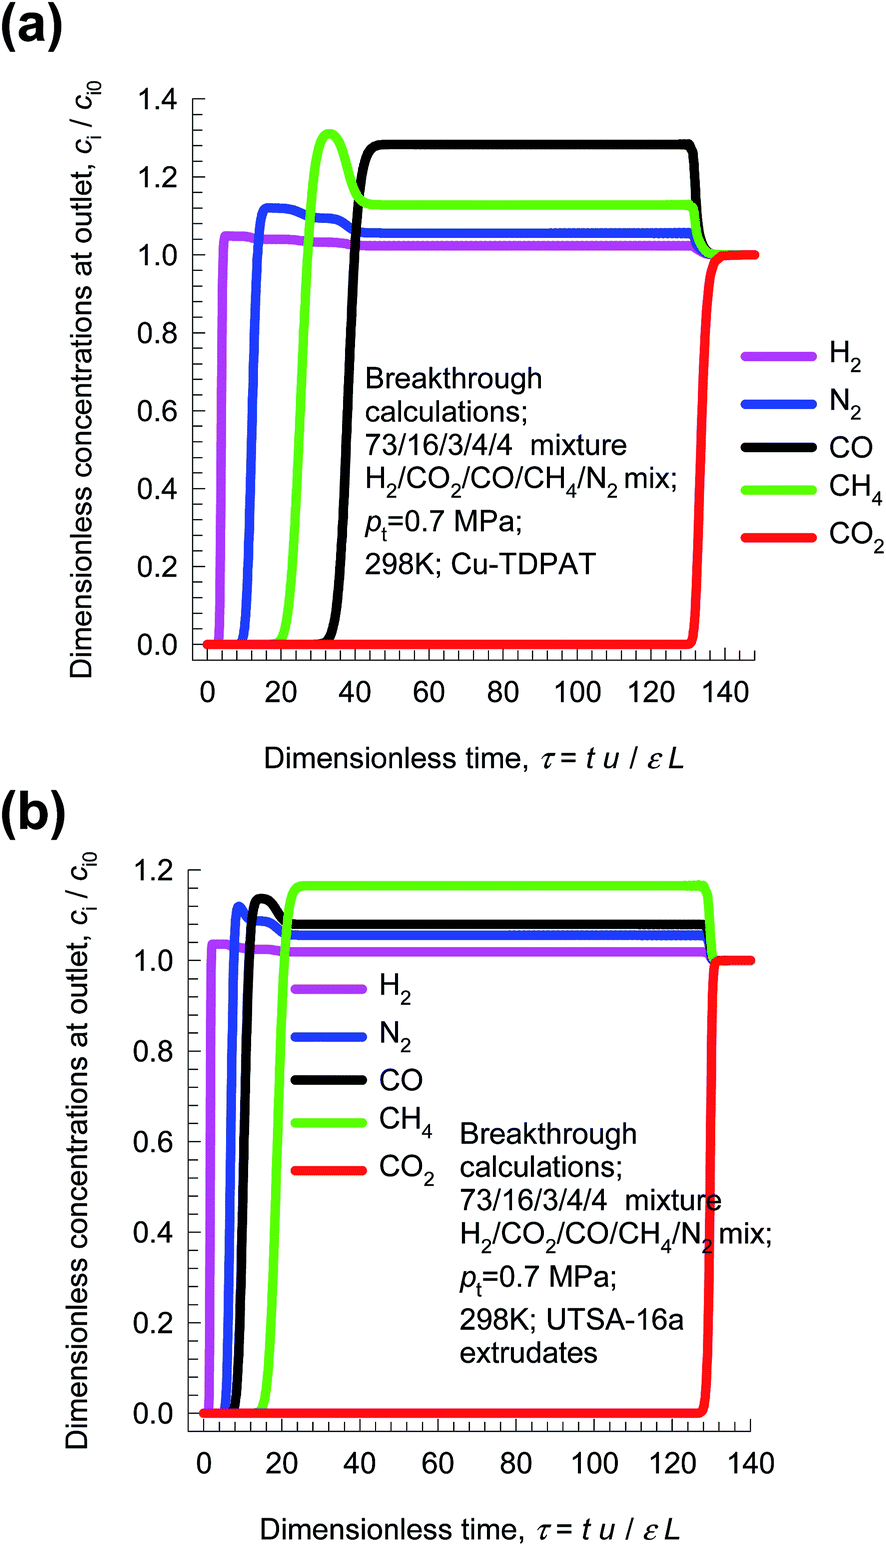 | ||
| Fig. 15 Breakthrough characteristics of 5-component 73/16/3/4/4 H2/CO2/CO/CH4/N2 mixture in adsorber packed with (a) Cu-TDPAT, and (b) UTSA-16a and maintained at isothermal conditions at 298 K and total pressure of 0.7 MPa. | ||
From breakthrough calculations of the type shown in Fig. 15, we can compare different adsorbents by plotting the ppm (CO2 + CO + CH4 + N2) in outlet gas as a function of the dimensionless time, τ, for various adsorbent materials. Fig. 16a compares the performance of four different adsorbents. We choose the impurity level to be 500 ppm (CO2 + CO + CH4 + N2) in outlet gas; this is a typical requirement in industry. When this impurity level is reached, the corresponding dimensionless breakthrough time, τbreak, can be determined. The values of τbreak are largely dictated by the breakthrough time of the N2, the “first” impurity that appears at the exit of the adsorber. NaX zeolite has the highest value of τbreak, implying that the bed can be run for a longer time before shutting down for regeneration. The productivity of purified H2, with the desired purity level, correlates with τbreak; see Fig. 16b. Remarkably, the worst separation performance is with UTSA-16a, that emerged in the study of Xiang et al.58 as a promising candidate for CO2 capture. This re-emphasizes the fact that best adsorbents for H2 production do not need to be the best materials for CO2 capture.
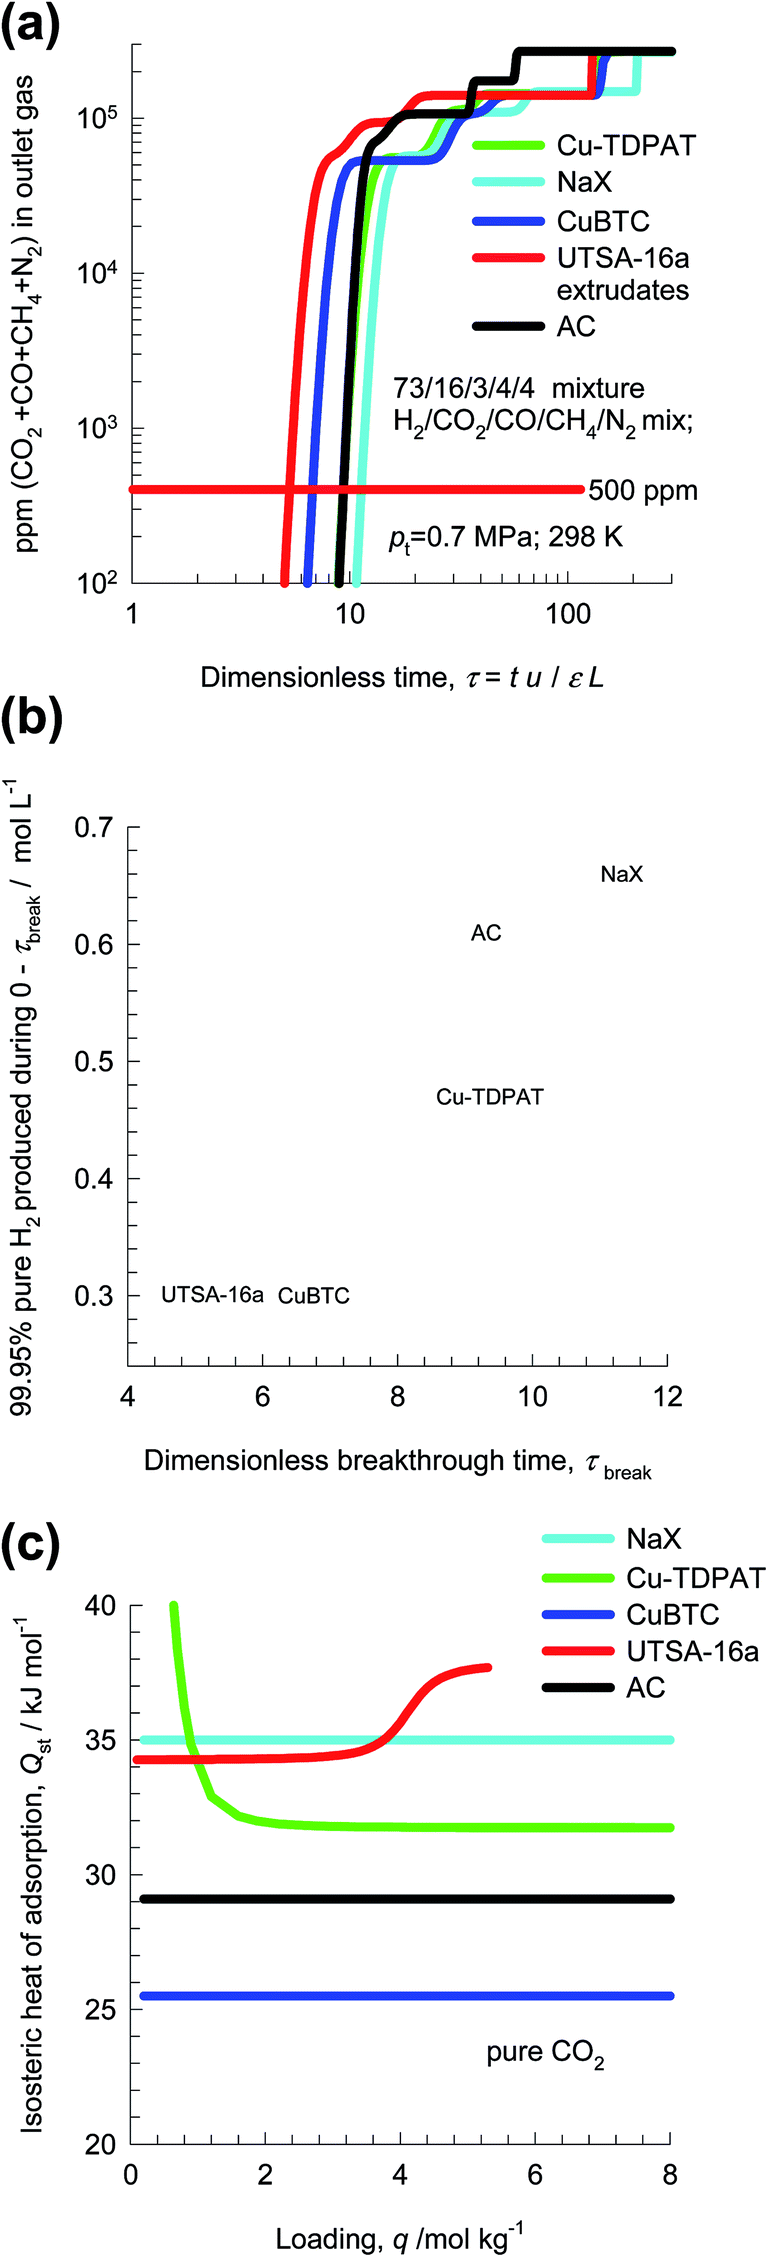 | ||
| Fig. 16 (a) ppm (CO2 + CO + CH4 + N2) in outlet gas as a function of the dimensionless time for separation of 5-component 73/16/3/4/4 H2/CO2/CO/CH4/N2 mixture using various adsorbent materials. (a) Plots of the amount of H2 produced (<500 ppm impurities) per L of material during the time interval 0 − τbreak as function of the dimensionless breakthrough time, τbreak. (c) Isosteric heats of adsorption of CO2 in different adsorbents. | ||
Fig. 16c compares the isosteric heats of adsorption of the four different adsorbents. It is likely that Activated Carbon (AC), could be also be a cost-effective option for H2 production because this material is relatively cheap and has a low Qst value, and separation performance only slightly lower than that of NaX zeolite. Indeed, Majlan et al.55 have experimentally demonstrated that H2 of purities demanded in fuel cell applications can be achieved in PSA units with activated carbon.
7 C2H2/C2H4 separations
In steam cracking of ethane to produce ethene, one of the by-products is ethyne, more commonly referred to as acetylene. Typically, the C2H2 content of C2H2/C2H4 feed mixtures is 1%. Ethyne has a deleterious effect on end-products of ethene, such as polyethene. Recovery, or removal of ethyne from ethene streams is essential because the presence of ethyne at levels higher than 40 ppm will poison the catalyst used for polymerization of ethene. The selective removal of ethyne is conventionally carried out by absorption in dimethyl formamide (DMF). A typical processing scheme involves three steps: (1) acetylene absorption in a tray column, (2) stripping of ethene from the solvent DMF, and (3) DMF regeneration with recovery of ethyne. Selective C2H2 adsorption using microporous materials affords an energy-efficient alternative. For example, ethyne binds more strongly than C2H4, with side-on attachment and π-coordination, with Fe2+ of FeMOF-74;59,60 see Fig. 17a.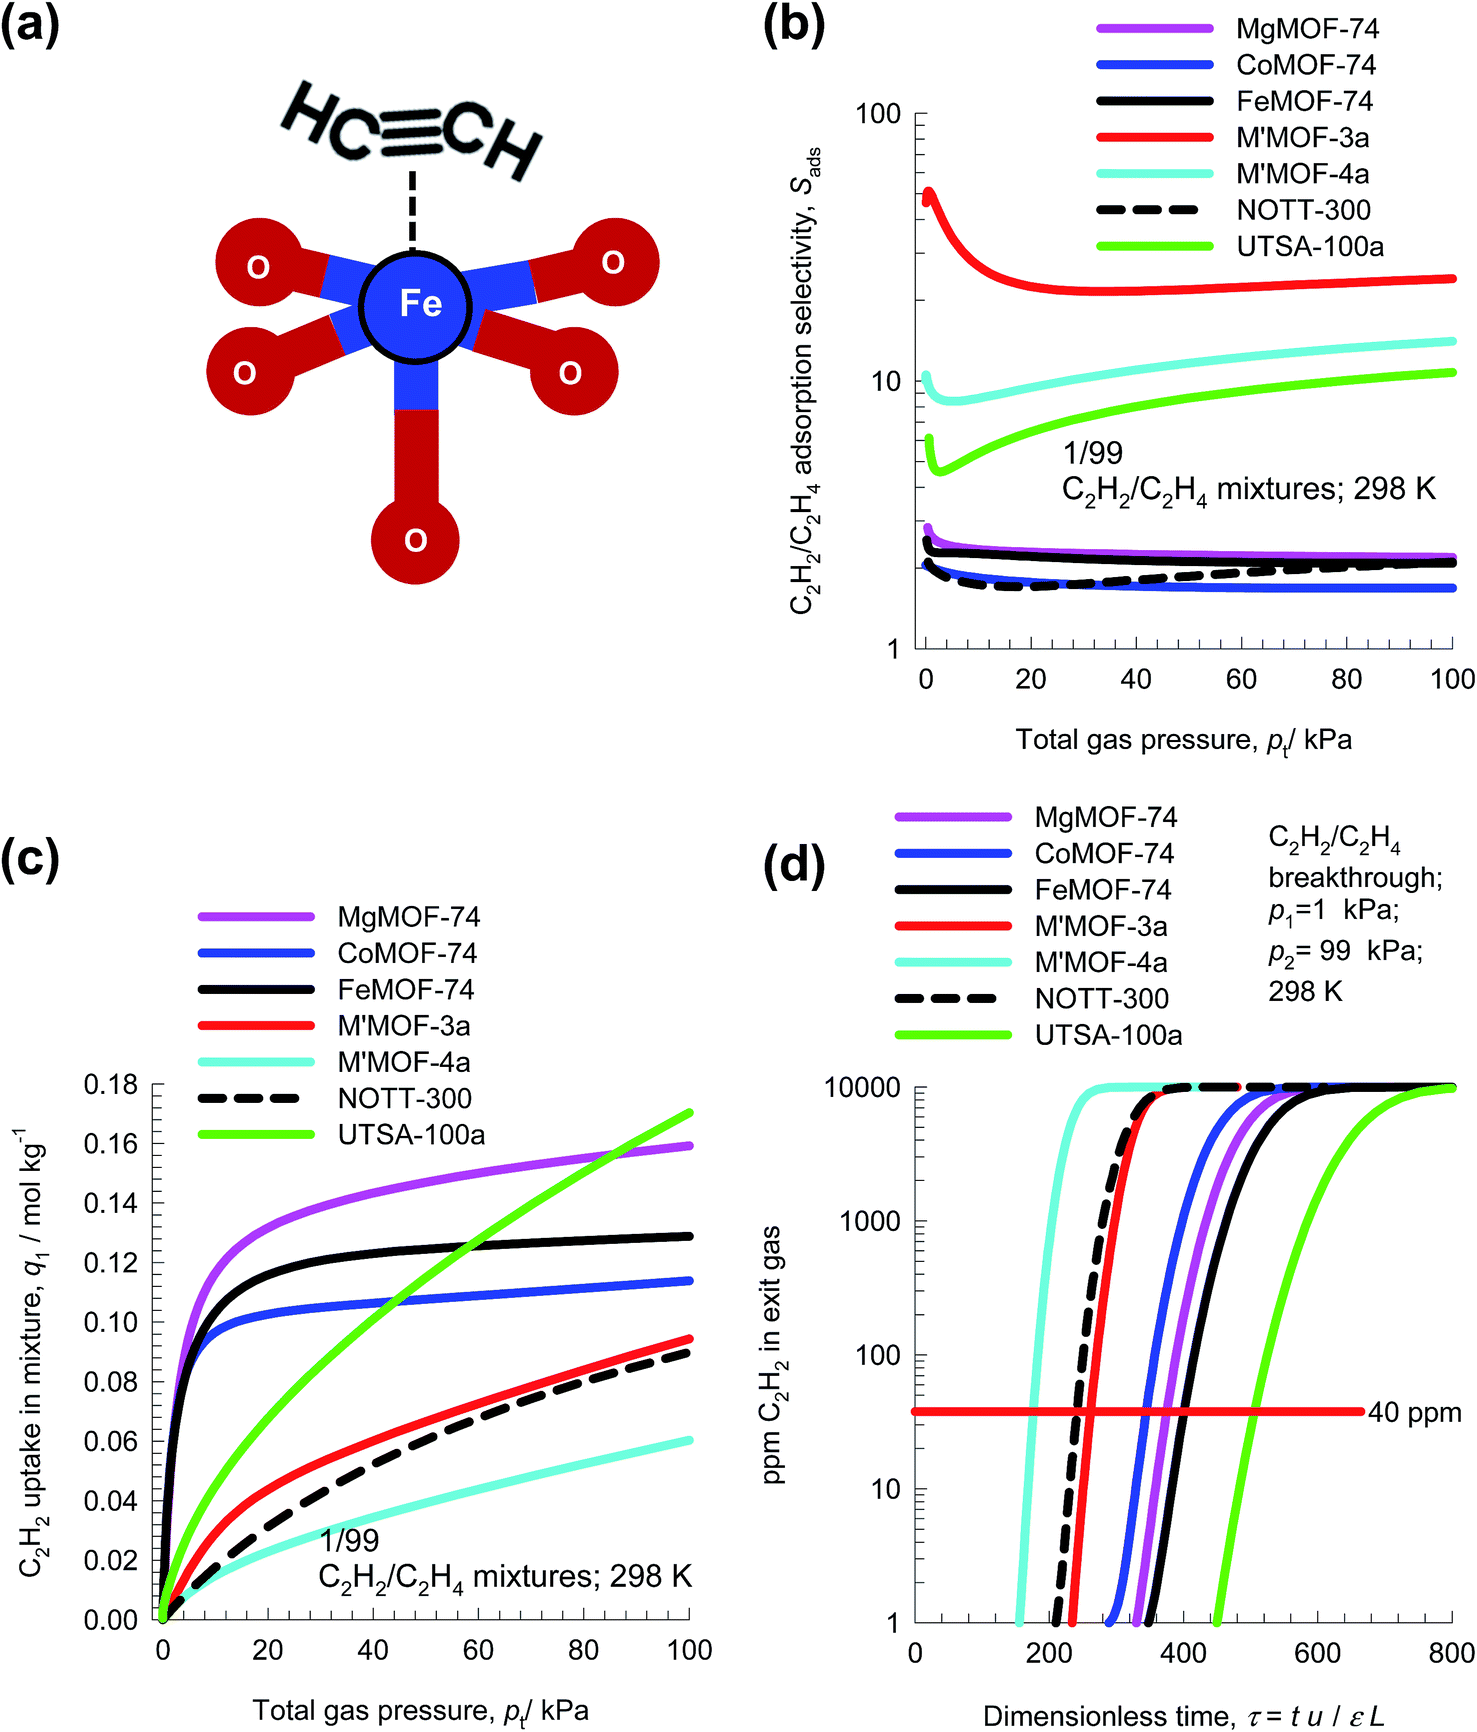 | ||
| Fig. 17 (a) Side-on attachment of C2H2 with Fe2+ atoms of FeMOF-74. (b) IAST calculations of the adsorption selectivity, Sads, of 1/99 C2H2/C2H4 mixtures using seven different MOFs. (c) C2H2 uptake capacity of 1/99 C2H2/C2H4 mixtures. (d) Comparison of % C2H2 in the exit gas from adsorber beds. | ||
Fig. 17b compares the C2H2/C2H4 selectivities of seven different adsorbents. The adsorbents M′MOF-3a, and M′MOF-4a,61 with a combination of metallo-ligands and organic ligands, have the highest selectivities. However, the C2H2 uptake capacity of M′MOF-3a, and M′MOF-4a is significantly lower than that of M-MOF-74 and UTSA-100a;62 see Fig. 17c. Due to capacity limitations, the breakthroughs with M′MOF-3a, and M′MOF-4a occurs earlier than with other adsorbents; see Fig. 17d. Delayed breakthroughs are desirable because increased amounts of C2H2 can be captured, and UTSA-100a62 has the longest breakthrough time primarily because of its significantly higher C2H2 uptake capacity and selectivity.
Let us arbitrarily define the breakthrough time, τbreak, as the time at which the exit gas contains <40 ppm C2H2. The amount of C2H2 captured during the time interval 0 − τbreak can be determined from a material balance. These amounts, expressed as mol C2H2 captured per L of framework material are plotted against τbreak in Fig. 18a. We note that the amount captured, is linearly dependent on τbreak. The C2H2 capture capacity is lowest for M′MOF-3a, despite the fact that it has the highest selectivity; the reason for its poor separation in the adsorber is its low uptake capacity.
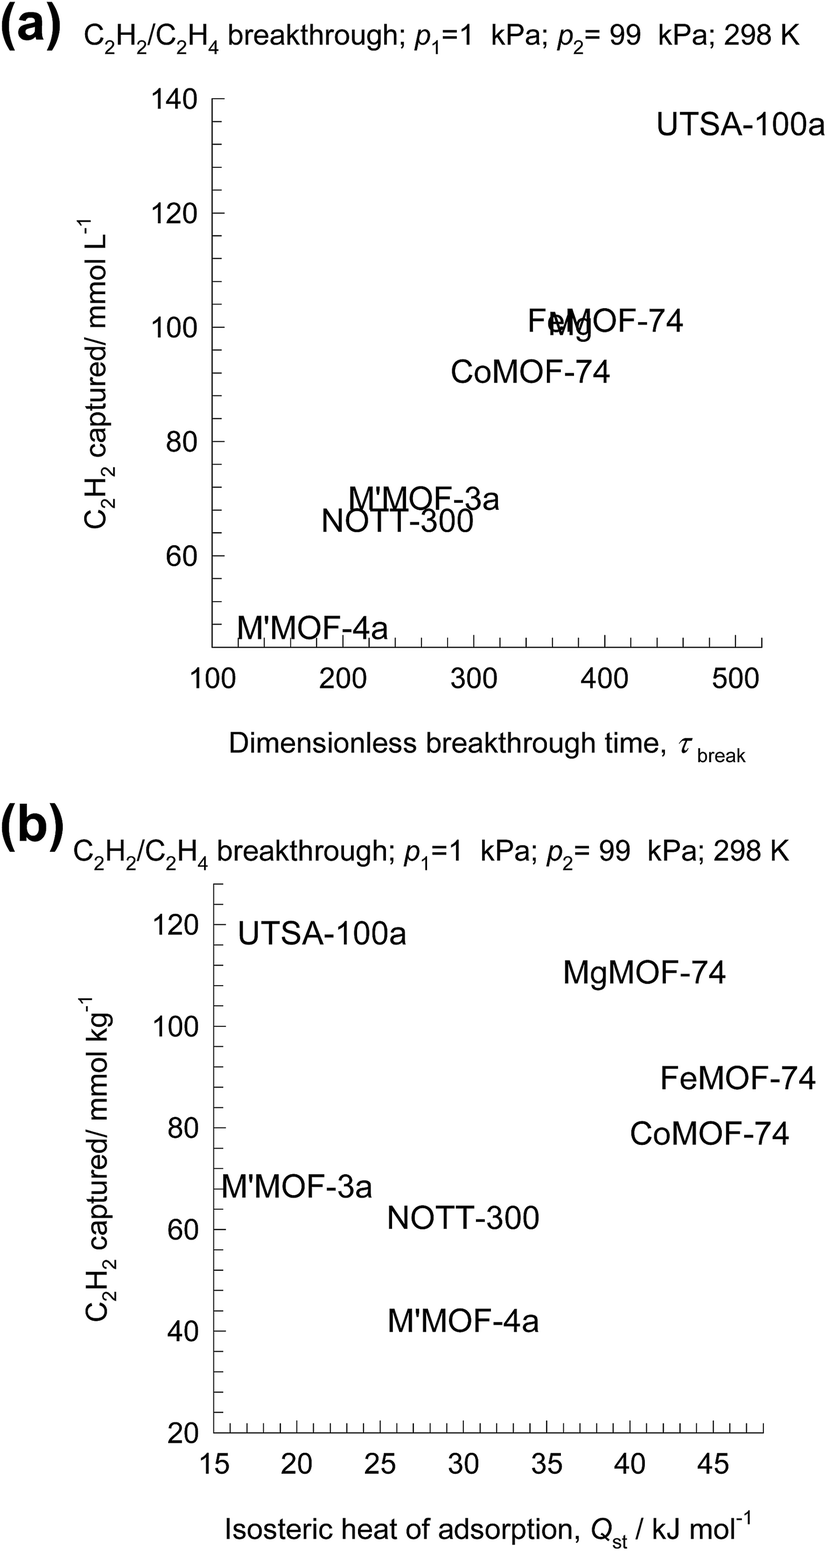 | ||
| Fig. 18 (a) Plot of the amount of C2H2 captured per L of material during the time interval 0 − τbreak as function of the dimensionless breakthrough time, τbreak. (b) Plot of the amount of C2H2 captured per L of material during the time interval 0 − τbreak versus the isosteric heat of adsorption. | ||
Let us turn to regeneration energy requirements. The isosteric heat of adsorption, Qst, can be considered to be indicative of regeneration energy required per mol of captured C2H2. Fig. 18a plots the C2H2 captured against Qst. Remarkably, UTSA-100a has the highest capture capacity combined with the lowest value of Qst. This is a desirable combination that makes UTSA-100a a good choice of adsorbent material.62
8 Alkene/alkane separations
Ethene is an important chemical used as feedstock in manufacture of polymers such as polyethene, polyvinyl chloride, polyester, polystyrene as well as other organic chemicals. Propene is an important chemical used as feedstock in manufacture of polymers such as polypropene. Key processing steps in preparing feedstocks for polymer production are the separations of ethene/ethane, and propene/propane mixtures. The boiling points are below ambient temperatures: ethane (184.5 K), ethene (169.4 K), propane (225.4 K), propene (225.4 K). Due to the small differences in the boiling points, the separations of ethene/ethane, and propene/propane mixtures have low relative volatilities, in the range of 1.1–1.2. These separations are traditionally carried out by distillation columns that operate at high pressures and low temperatures. The purity requirement of the alkenes as feedstocks to polymerization reactors is 99.95%, and consequently the distillation columns are some of the largest and tallest distillation columns used in the petrochemical industries. Several MOFs offer potential for separation of ethene/ethane and propene/propane mixtures, as alternatives to distillation.59,63–68Let us now compare the performance of seven different MOFs for separation of 50/50 C2H4/C2H6 mixtures. The highest Sads values are realized with the three recently reported MOFs: PAF-1-SO3Ag,67 MIL-101-Cr-SO3Ag,66 and NOTT-300;68 see Fig. 19a. The π-complexation of the alkenes with Ag(I) ions of PAF-1-SO3Ag, and MIL-101-Cr-SO3Ag account for their high alkane/alkane selectivities. For FeMOF-74, Bloch et al.59 have established that each alkene molecule attaches side-on to an Fe(II) atom in the FeMOF-74 framework. The volumetric uptake capacities for C2H4 of PAF-1-SO3Ag, MIL-101-Cr-SO3Ag, and NOTT-300 are, however, the lowest among the seven MOFs investigated; see Fig. 19b. The highest volumetric uptakes are obtained with FeMOF-74, and CoMOF-74. The separation performance in fixed bed adsorbers are best compared by plotting the % C2H4 in the exit gas from adsorber beds (Fig. 19c). Let us arbitrarily define the breakthrough time, τbreak, as the dimensionless time at which the % C2H4 in the exit gas is 1%. The breakthrough times, τbreak, are shortest with PAF-1-SO3Ag, MIL-101-Cr-SO3Ag, and NOTT-300; the longest breakthrough times are with FeMOF-74, and CoMOF-74 primarily because of their higher volumetric uptake capacities. Indeed, the hierarchy of breakthrough times is coincidental with the hierarchy of volumetric uptake capacities.
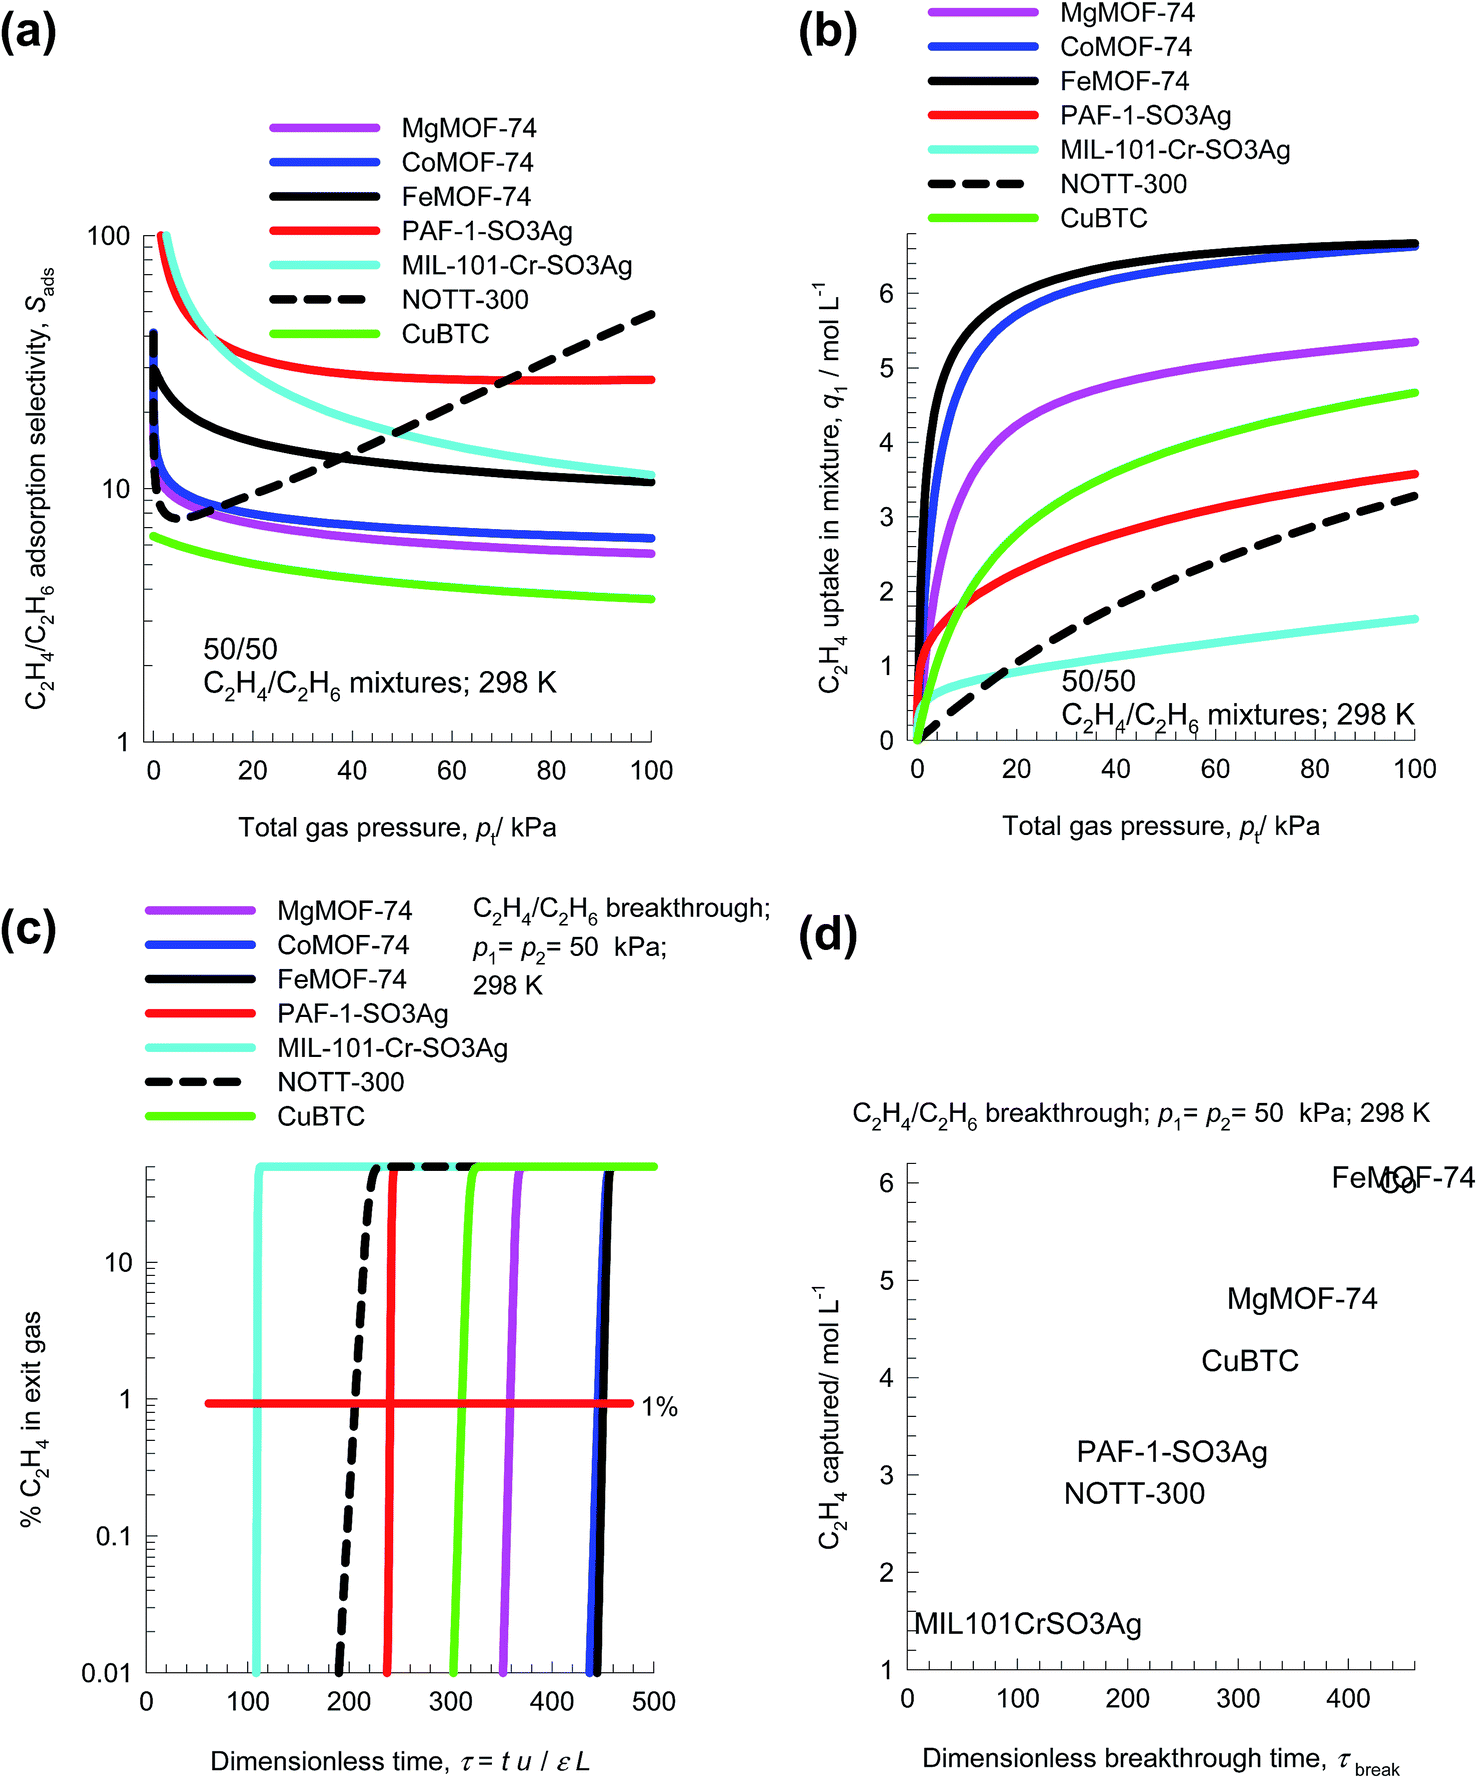 | ||
| Fig. 19 (a and b) IAST calculations of (a) adsorption selectivity, Sads, and (b) C2H4 uptake capacity in 50/50 C2H4/C2H6 mixtures at 298 K using seven different MOFs. (c) Comparison of % C2H4 in the exit gas from adsorber beds. (d) Plot of the amount of C2H4 captured per L of material during the time interval 0 − τbreak as function of the dimensionless breakthrough time, τbreak. | ||
The amount of C2H4 captured during the time interval 0 − τbreak can be determined from a material balance. These amounts, expressed as mol C2H4 captured per L of framework material are plotted against τbreak in Fig. 19d. The highest capture capacities are with FeMOF-74, and CoMOF-74; this is followed closely by MgMOF-74. The lowest C2H4 capture capacities are with PAF-1-SO3Ag, MIL-101-Cr-SO3Ag, and NOTT-300; the high C2H4/C2H6 selectivities realized with these three MOFs are not able to compensate for their low uptake capacities.
The comparative evaluation of MOFs for C3H6/C3H8 separations59,63–65 proceeds along similar lines; details are available in the ESI.† An important disadvantage of the alkane/alkene separations with the seven MOFs considered above is that the desired alkene product, required for production of polymer grade polyethene and polypropene, can only be recovered in the desorption phase. It becomes necessary to operate with multiple beds involving five different steps; the alkene product of the desired purity is recovered in the final step by counter-current vacuum blowdown.69,70
It is preferable to have use adsorbents that are selective to the saturated alkanes, so that the desired alkenes are recoverable in the adsorption cycle.71 The preferential adsorption of alkanes is only possible if separations are based on van der Waals interactions alone. However, the adsorption selectivities cannot be expected to be high. Indeed, computational screening of 300![[thin space (1/6-em)]](https://www.rsc.org/images/entities/char_2009.gif) 000 all-silica zeolite structures by Kim et al.72 results in the discovery of SOF zeolite, that has a C2H6/C2H4 selectivity of only 2.9. This selectivity value of 2.9 can be matched by ZIF-7,25,71 and ZIF-8.73
000 all-silica zeolite structures by Kim et al.72 results in the discovery of SOF zeolite, that has a C2H6/C2H4 selectivity of only 2.9. This selectivity value of 2.9 can be matched by ZIF-7,25,71 and ZIF-8.73
The separation of C4 hydrocarbon streams to recover the valuable 1,3-butadiene, 1-butene, and iso-butene by distillation is difficult and energy intensive.30 There are potential savings to be realized by using adsorption technology with MOFs. Remarkably, however, this topic has not yet attracted the attention of MOF experimentalists.
9 N2/O2 separations
The separation of air to produce N2 and O2 of high purities is one of the most important industrial processes that uses pressure swing adsorption technology.1,74 The process technologies are geared to either production of purified O2 or purified N2. Cryogenic distillation has been the common technologies for this separation, but adsorptive separations offer energy-efficient alternatives. Purified O2 is required for a wide variety of applications that include portable adsorption units for medical applications and in space vehicles. Nitrogen is required in applications where it is desired or necessary to exclude oxygen. Typical industrial applications include laser cutting, food packaging, and nitrogen blanketing. N2 is required for use in laboratory analytical equipment, and in glove boxes.Let us consider N2/O2 separations using LTA zeolite for which the all-silica form has a window size of approximately 4 Å. Fig. 20a and b present snapshots showing the location of cations in the industrially important LTA-5A (96Si, 96Al, 32Na+, 32Ca++, Si/Al = 1), and LTA-4A (96Si, 96Al, 96Na+, Si/Al = 1) zeolites. In LTA-4A, some of the Na+ cations partially block the window regions,2,33 thereby effectively reducing the aperture size that is available for inter-cage hopping of molecules. The Na+ and Ca++ cations in LTA-5A, on the other hand, do not locate near the window regions and there is no blocking of the windows. This implies that diffusional influences are much stronger in LTA-4A than in LTA-5A zeolite.
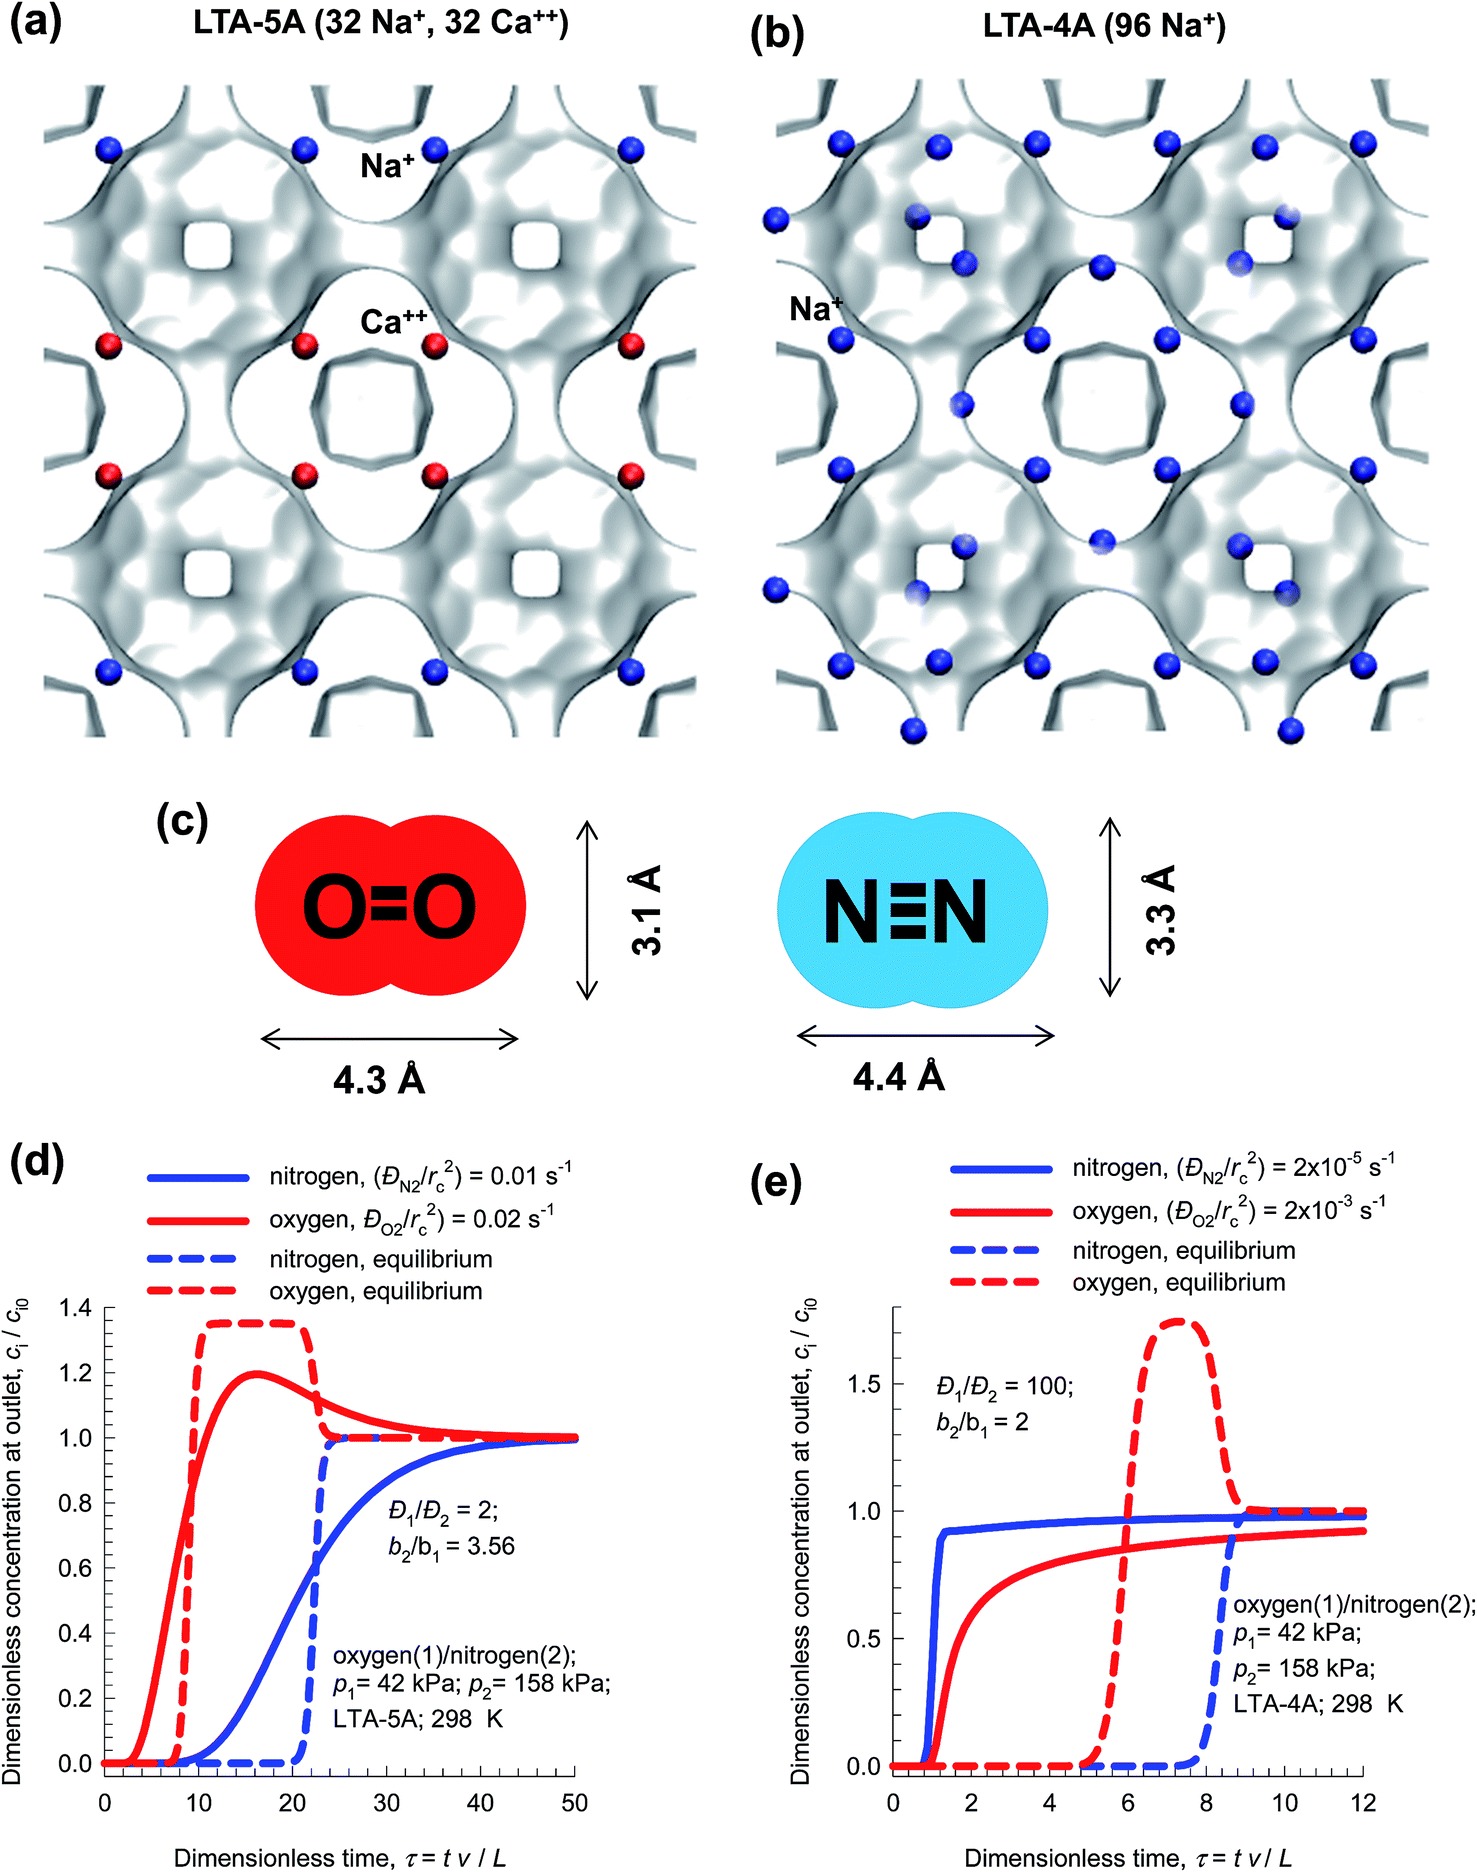 | ||
| Fig. 20 (a and b) Snapshots showing the location of cations in (a) LTA-5A, and (b) LTA-4A. (c) Molecular dimensions of N2 and O2. (d) Influence of diffusional limitations on the breakthrough characteristics of O2/N2 mixture in a fixed bed adsorber packed with LTA-5A. (e) Influence of diffusional limitations on the breakthrough characteristics of O2/N2 mixture in a fixed bed adsorber packed with LTA-4A. | ||
Both O2, and N2 have similar polarizabilities and magnetic susceptibilities. However, the quadrupole moment of N2 is about four times that of O2. For both LTA-4A, and LTA-5A the adsorption selectivity is in favor of N2. The diffusivity of N2 is significantly lower than that of O2 because of its larger cross-sectional dimension of 3.3 Å, compared to 3.1 Å for O2; see Fig. 20c.
In LTA-5A zeolite, the ratio of the diffusivity of O2 to that of N2 is 2.21 In a fixed bed adsorber with LTA-5A, O2 breaks through earlier than N2 because the separation is governed by thermodynamic equilibrium that overrides the diffusional effects; see Fig. 20d. Purified O2 is the product emerging from the adsorption cycle of a fixed bed packed with LTA-5A.
Due to the reduced window aperture of LTA-4A, the ratio of the diffusivity of O2 to that of N2 is about 100. A fixed bed adsorber packed with LTA-4A produces pure N2 in the adsorption phase of PSA operations; i.e. the separation is diffusion-selective; see Fig. 20e.
A better strategy for production of purified N2, is to use an adsorption selective process in which the selective binding of O2 to the Fe2+ of FeMOF-74 because of the greater electron affinity of O2 than N2 (see Fig. 21a).75 Transient breakthroughs for 21/79 O2/N2 mixtures (cf. Fig. 21b) demonstrate that this MOF would be better suited of pure N2 than LTA-4A;21,75 absence of diffusion limitations in FeMOF-74 results in increased productivities of purified N2.
 | ||
| Fig. 21 (a) Selective binding of oxygen with Fe atoms of FeMOF-74; schematic adapted from Bloch et al.75 (b) Simulations of the breakthrough characteristics of O2(1)/N2(2) mixture in a fixed bed adsorber packed with FeMOF-74 and operating at a total pressure of 200 kPa and 211 K. The partial pressures of the components in the bulk gas phase at the inlet are p1 = 42 kPa, p2 = 158 kPa. | ||
10 N2/CH4 separations
The separation of N2/CH4 mixtures is important in the context of natural gas upgrading. For transportation purposes, the pipeline specifications usually demand that the amount of N2 in natural gas is less than about 3%, because the presence of N2 reduces the heating value. For purification of natural gas streams, it is desirable to use adsorbents in PSA units that are selective to N2. For most known adsorbents, the adsorption selectivity favors CH4; see Li et al.49 One practical solution to this separation problem is to rely on diffusion selectivities by use of microporous LTA-4A zeolite (see Fig. 20b), that consists of cages of about 11 Å size, that are connected by 4 Å window apertures. Nitrogen is a “pencil-like” molecule (4.4 Å × 3.3 Å; see Fig. 22a) that can hop length-wise across the narrow windows; the “spherical” CH4 (3.7 Å) is much more severely constrained and has a diffusivity that is 22 times lower than that of N2.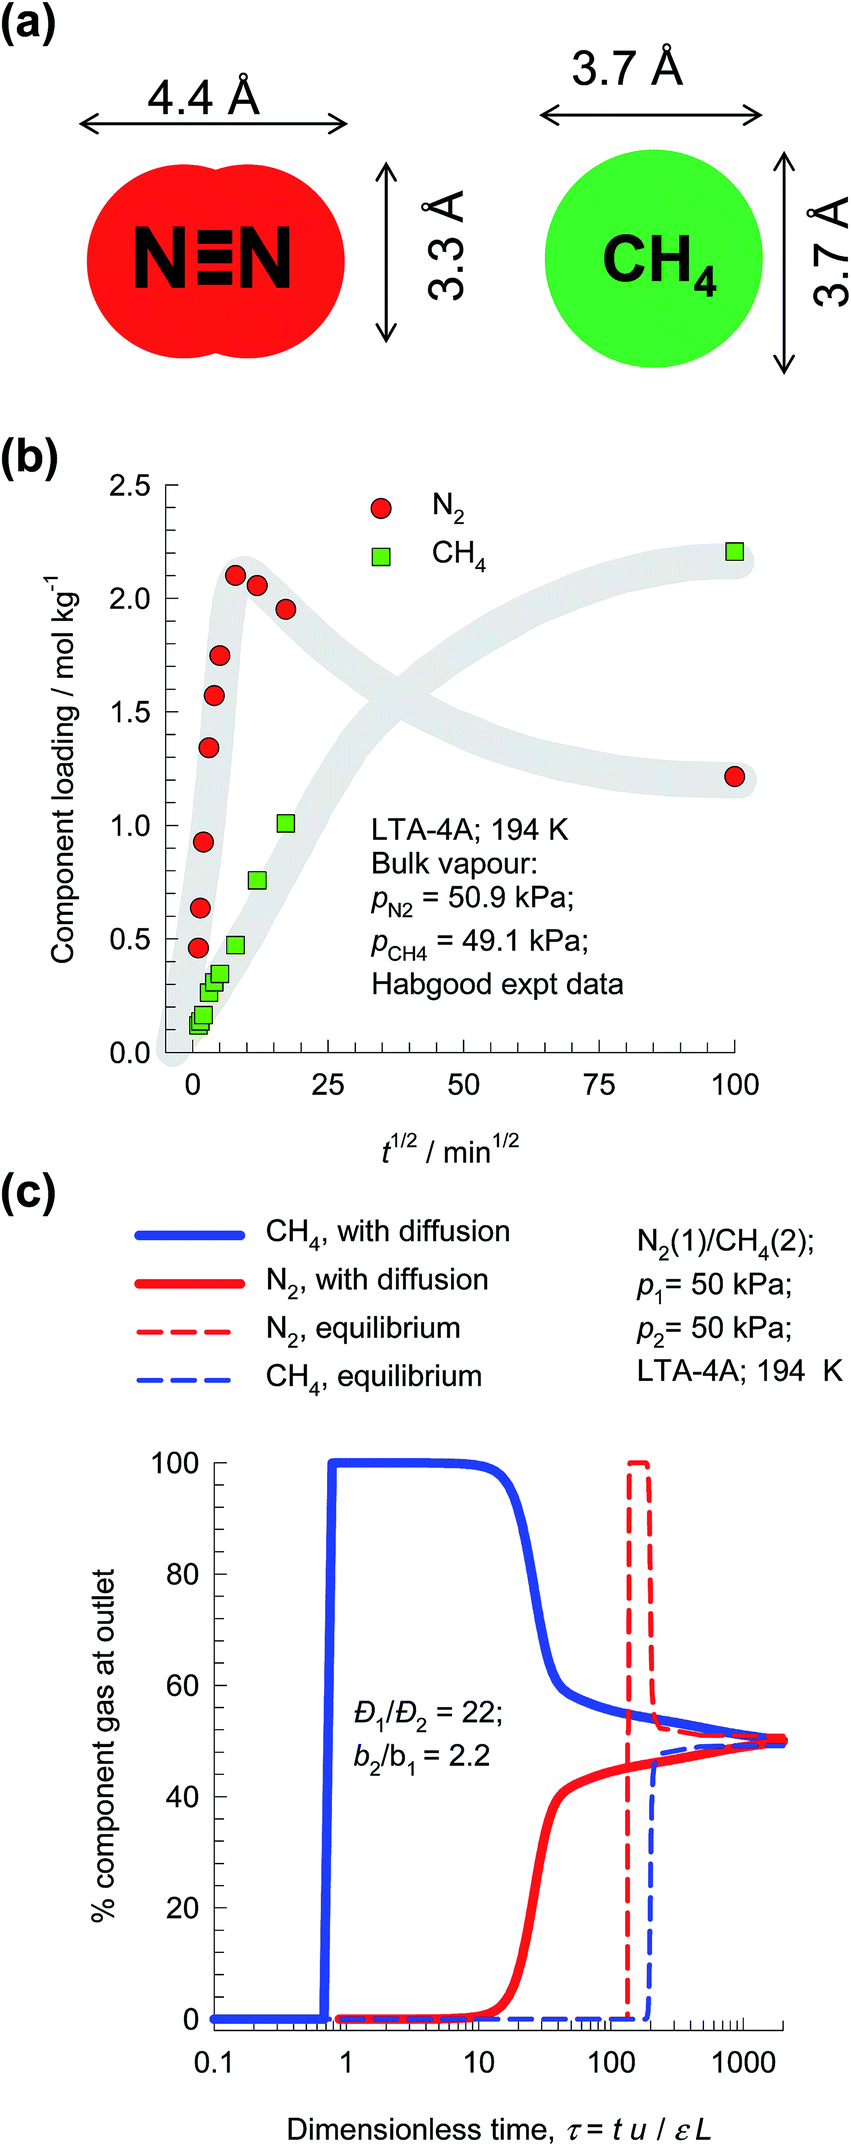 | ||
| Fig. 22 (a) Molecular dimensions of N2 and CH4. (b) Transient uptake of N2/CH4 mixture in LTA-4A.76 (c) PSA process for separation of 50/50 N2/CH4 mixture in a fixed bed adsorber packed with LTA-4A operating at a total pressure of 100 kPa and 194 K. | ||
The earliest study demonstrating the possibility of exploiting diffusion selectivities for separating N2/CH4 mixtures is due to Habgood,76 who presents experimental data on transient mixture uptake within LTA-4A (cf. Fig. 22b). During the initial stages of the transient uptake, the pores of LTA-4A are predominantly richer in the more mobile N2, but this is displaced by the more strongly-adsorbed-but-tardier CH4 molecules at longer times. This results in an overshoot in the N2 loading within the crystals during the early stages of transience. Note that the maximum loading of N2 is about a factor 2.5 times that of the final equilibrated uptake. Put another way, supra-equilibrium loadings are attained for N2 during a short time interval; we infer the occurrence of uphill diffusion.77 Based on his experimental results, Habgood filed a patent claiming that natural gas could be upgraded by selectively adsorbing the faster diffusing nitrogen in a diffusion-selective PSA process employing LTA-4A zeolite.
In order to demonstrate the possibility of purifying natural gas by exploiting diffusion selectivity principles, Fig. 22c presents the transient breakthroughs of a 50/50 N2/CH4 mixture in a fixed bed adsorber packed with LTA-4A operating at a total pressure of 100 kPa and 194 K. We note that the more strongly adsorbed CH4 is rejected in nearly pure form during the earlier stages of the transient breakthrough. If we were to ignore intra-crystalline diffusion limitations (these simulations are indicated by dashed lines), CH4 is selectively adsorbed and it is not possible to meet the objectives of purifying natural gas.
Nitrogen-selective separation of N2/CH4 mixtures is also be achieved by choosing the pore size to be small enough to exclude CH4; this is the operative separation principle with BaETS-4.78
11 Separation of hexane isomers
The separation of hexane isomers, n-hexane (nC6), 2-methylpentane (2MP), 3-methylpentane (3MP), 2,2-dimethylbutane (22DMB), and 2,3-dimethylbutane (23DMB) is required for production of high-octane gasoline. The values of the Research Octane Number (RON) increases with the degree of branching; the RON values are: nC6 = 30, 2MP = 74.5, 3MP = 75.5, 22DMB = 94, 23DMB = 105. Therefore, di-branched isomers are preferred products for incorporation into the high-octane gasoline pool.21,79,80 Currently, the separation of hexane isomers is performed using LTA-5A zeolite that operates on the principle of molecular sieving; see Fig. 23a. Linear nC6 can hop from one cage to the adjacent cage through the 4 Å windows of LTA-5A, but branched alkanes are largely excluded. An improved separation scheme, pictured in Fig. 23b, would require an adsorbent that would separate the di-branched isomers 22DMB and 23DMB from the nC6, 2MP, and 3MP; this would allow the low-RON components to be recycled back to the isomerization reactor. The separation of 22DMB and 23DMB from the remaining isomers is a difficult task because it requires distinguishing molecules on the degree of branching; such a separation is not feasible with the currently used LTA-5A. Typically, in such a processing scheme the aim would be to produce a product stream from the separation step with RON value of 92. This requirement of 92+ RON implies that the product stream will contain predominantly the di-branched isomers 22DMB and 23DMB, while allowing a small proportion of 2MP and 3MP to be incorporated into the product stream. Sharp separations between mono- and di-branched isomers is not a strict requirement.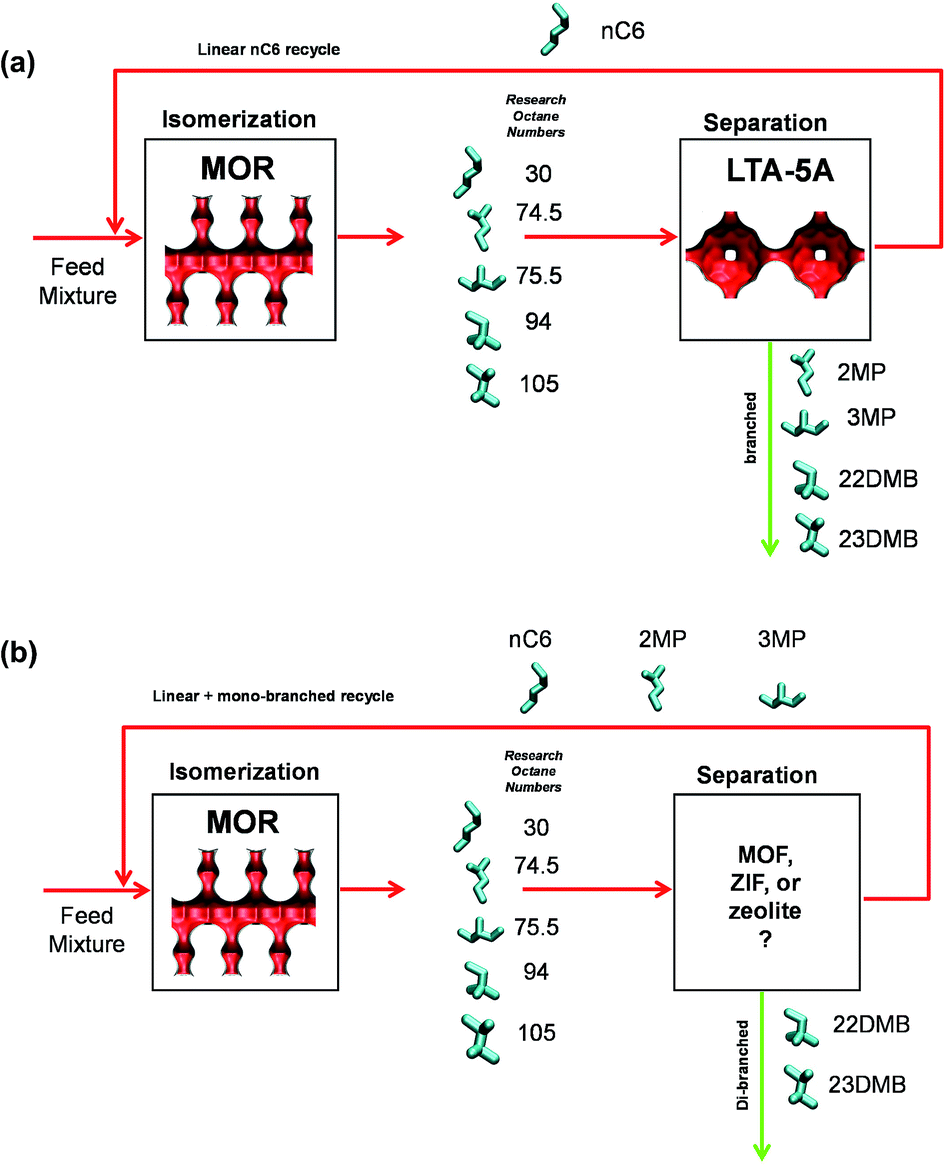 | ||
| Fig. 23 (a) Currently employed processing scheme for nC6 isomerization and subsequent separation step using LTA-4A. (b) Improved processing scheme for the nC6 isomerization process. | ||
Herm et al.7 report the synthesis of Fe2(BDP)3 [BDP2− = benzenedipyrazolate] that has 1D channels which are triangular in shape and a pore size of 4.9 Å (see Fig. 24a). Molecular simulations provide insights into the workings of Fe2(BDP)3. The linear nC6 can align optimally along the V-shaped gutters, and exert the best van der Waals interaction with the framework. The interactions of the mono- and di-branched isomers are less effective, resulting in considerably lower adsorption strengths.
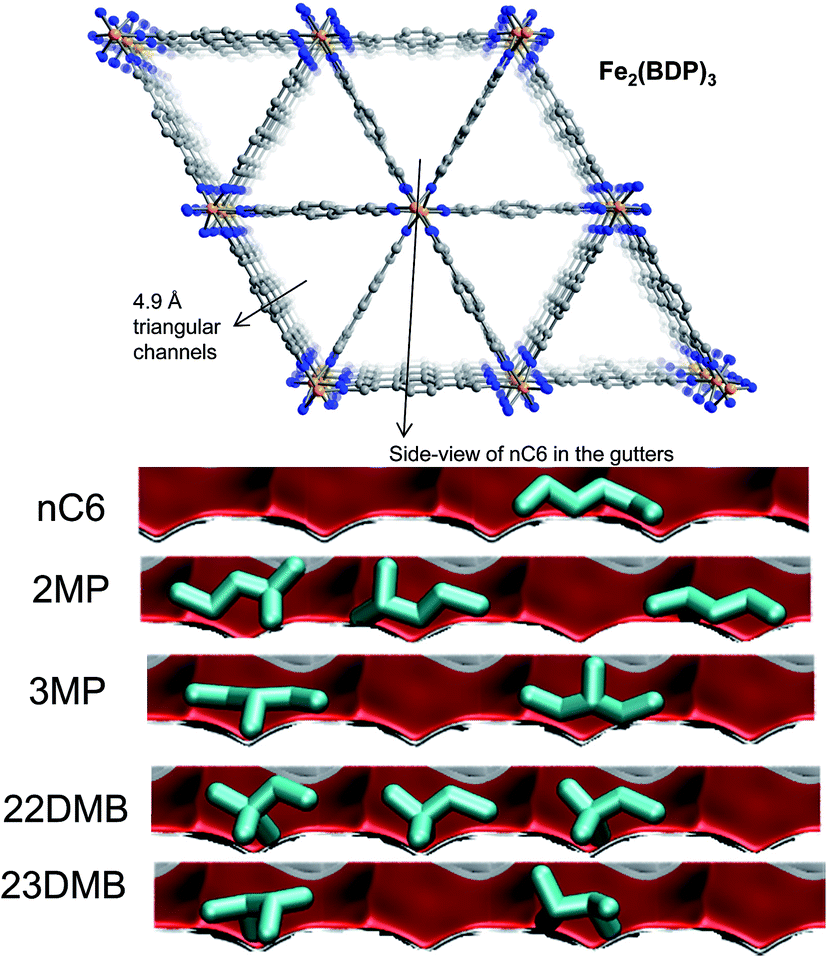 | ||
| Fig. 24 The triangular channel topology of Fe2(BDP)3.7 Also shown are computational snapshots (side-on view) of the conformations of nC6, 2MP, 3MP, 22DMB, and 23DMB within the triangular channels. | ||
The hierarchy of breakthroughs reported in the transient experiments of Herm7 is 22DMB, 23DMB, 3MP, 2MP, and nC6 (cf. Fig. 25a); this hierarchy is dictated by a combination of adsorption strengths (nC6 ≫ 2MP ≈ 3MP ≫ 22DMB ≈ 23DMB) and diffusivities (nC6 > 2MP ≈ 3MP > 22DMB ≈ 23DMB). The di-branched isomers 22DMB and 23DMB can be recovered in the early stages of the transient breakthrough in fixed bed adsorbers. The experimentally determined breakthroughs in fixed bed adsorbers displays distended characteristics that is indicative of strong intra-crystalline diffusional limitations within the 4.9 Å channels. Taking proper account of intra-crystalline diffusion limitations, the experimental breakthroughs can be properly reproduced by transient breakthrough simulations.7,21
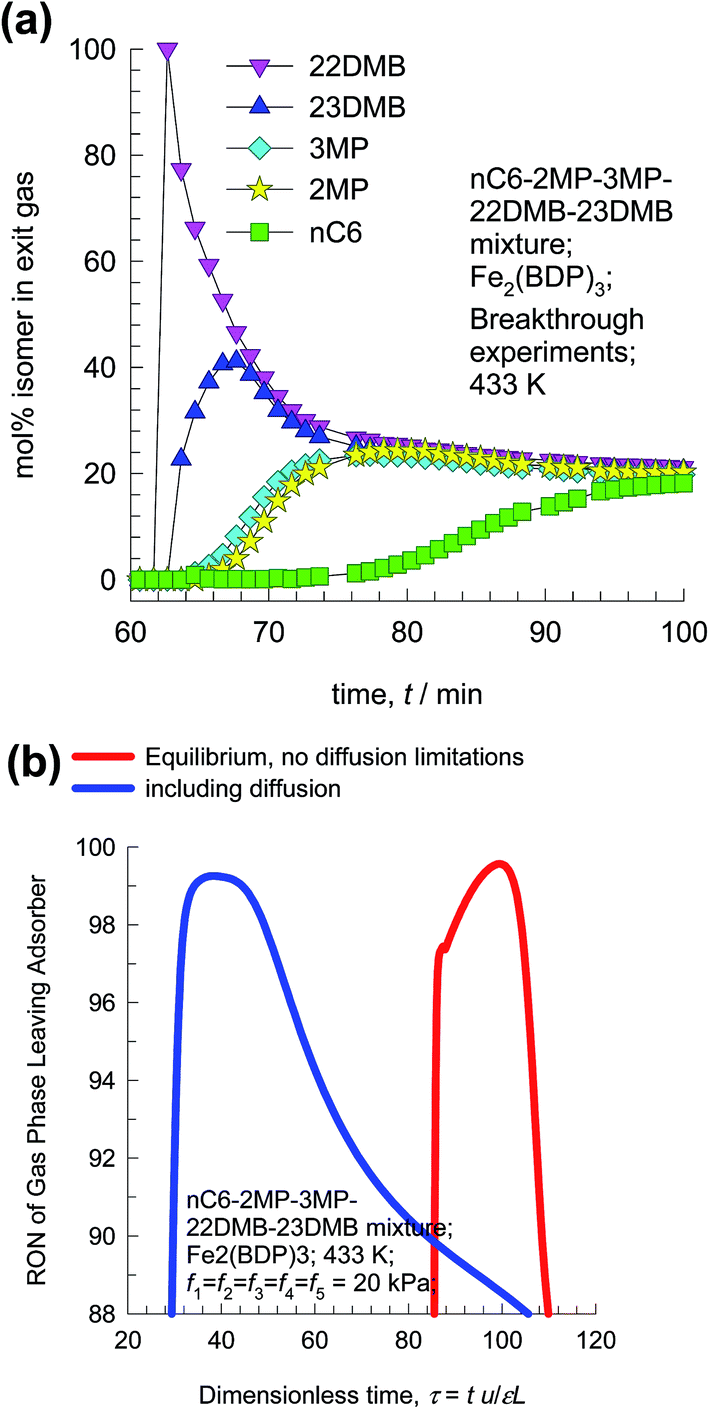 | ||
| Fig. 25 (a) Experimental data on transient breakthrough of hexane isomers in a fixed bed packed with Fe2(BDP)3.7 (b) Influence of diffusional limitations on the RON of product gas exiting fixed bed adsorber packed with Fe2(BDP)3. | ||
From the compositions exiting the adsorber we can determine the RON value of mixture as a function of time. Fig. 25b presents the RON values for Fe2(BDP)3, calculated using two different scenarios: (1) ignoring intra-crystalline diffusion and assuming thermodynamic equilibrium between a crystal and its surrounding gas at any time t, and position z in the adsorber, and (2) including intra-crystalline diffusion influences. Intra-crystalline diffusion influences leads to earlier breakthroughs and distended RON vs. τ characteristics. From a material balance we can determine the mol of product having the desired target value of 92+ RON value. In the scenario of equilibrium adsorption, the 92+ RON productivity is 0.77 mol L−1. Inclusion of diffusion limitations results in a lowering of the productivity to 0.54 mol L−1.
Using MFI zeolite, the separation of hexane isomers is achieved by exploiting subtle configurational differences.21,79,81 The linear nC6 can locate comfortably along the channels (see Fig. 26a). The mono-branched and di-branched isomers locate preferentially at the channel intersections that offer more “leg-room” for these bulkier, more-compact, branched isomers. But the number of intersections are limited to 4 per unit cell; this limits the saturation capacities of branched isomers. Under pore saturation conditions typical of industrial operations, molecular packing effects within the MFI channels ensure the sorption hierarchy nC6 ≫ 2MP ≈ 3MP ≫ 22DMB ≈ 23DMB, with virtual exclusion of the branched isomers at equilibrium. The presence of branched isomers at the channel intersections is tantatmount to “intersection blocking”; this influences molecular traffic and diffusion.
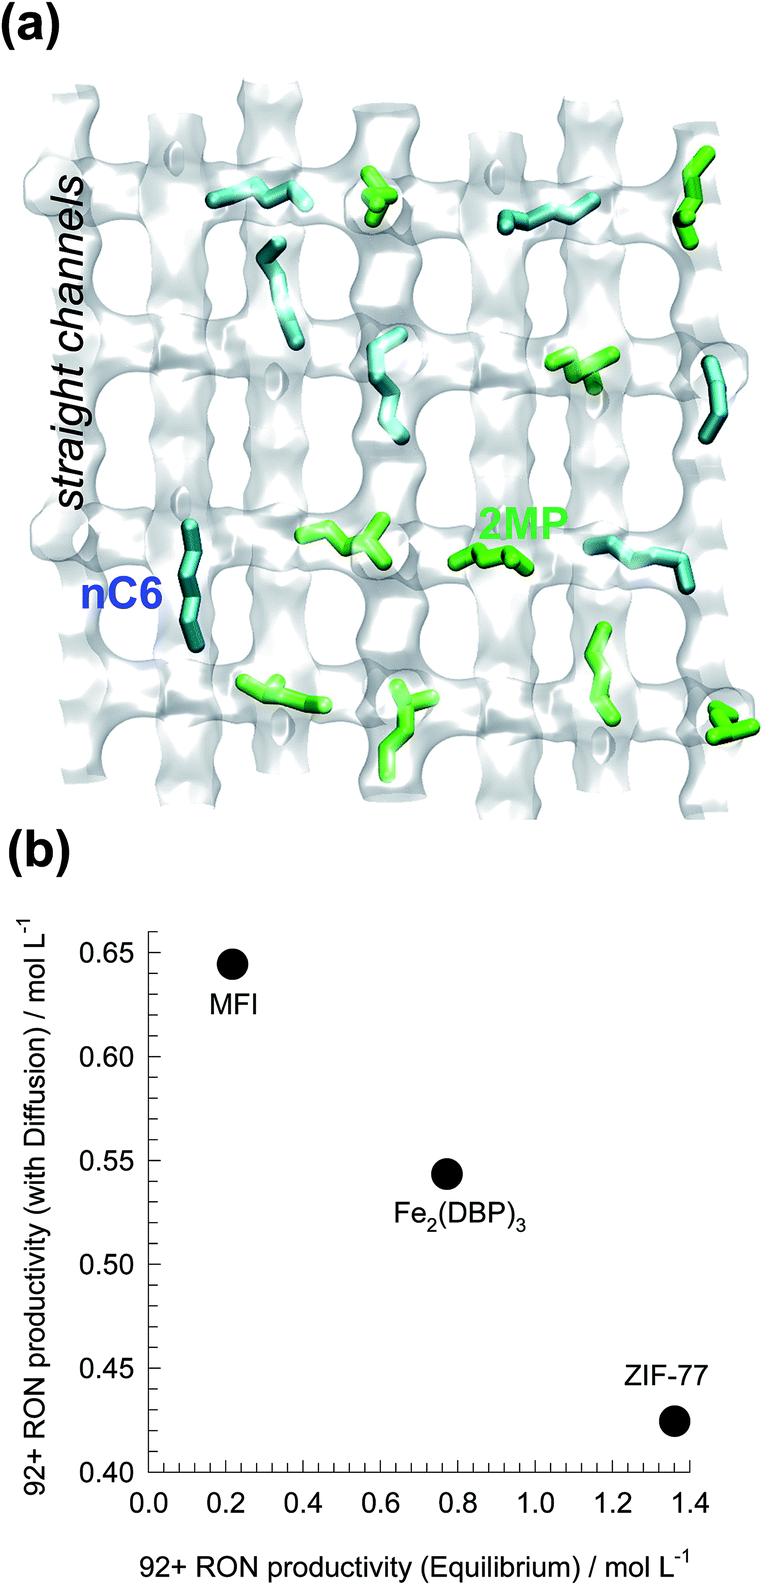 | ||
| Fig. 26 (a) Snapshots showing the location of nC6, and 2MP within the channel network of MFI zeolite. (b) Comparison of 92+ RON productivities of ZIF-77, Fe2(BDP)3, and MFI for separation of hexane isomers. The productivity values plotted on the x-axis are obtained from breakthrough simulations with assumption of thermodynamic equilibrium. The productivity values on the y-axis are obtained from breakthrough simulations taking intra-crystalline diffusion into account. Further details are provided in ESI.† | ||
Intra-crystalline diffusional influences in MFI zeolite have a unique character, as underscored in the recent experimental work of Titze et al.82 With increasing pore occupancy, θt, the branched isomers are increasingly excluded. As a consequence, the degree of intersection blocking is reduced and the diffusivity of the linear nC6 increases with increasing value of θt. The unique synergy between adsorption and diffusion has a beneficial influence on separations. With proper quantification of the synergistic effect of adsorption and diffusion, the 92+ RON productivity achieved with MFI zeolite is 0.64 mol L−1, about a factor 3 higher than that achieved with the scenario in which diffusional effects are considered to be negligible. Diffusional influences enhance the hexanes separation performance of MFI zeolite.
Fig. 26b presents a comparison of 92+ RON productivities of Fe2(BDP)3, MFI, and ZIF-77 for separation of hexane isomers. The productivity values on the y-axis are obtained from breakthrough simulations taking intra-crystalline diffusion into account. The productivity values plotted on the x-axis are obtained from breakthrough simulations with assumption of thermodynamic equilibrium. We note that thermodynamic equilibrium prevails, then the best choice of adsorbent is ZIF-77; indeed, this MOF emerged as the best adsorbent for hexanes isomer separation in the computational screening exercise undertaken by Dubbeldam et al.,80 that did not take diffusional effects into consideration. ZIF-77 has a characteristic pore dimension of 4.5 Å, and intra-crystalline diffusion limitations have a drastic negative influence on the 92+ RON productivity, which is below that of Fe2(BDP)3. Taking proper account of the synergy between adsorption and diffusion, MFI zeolite emerges as the best adsorbent for separation of hexane isomers.
Pulse chromatographic experiments have been used to demonstrate the potential of ZIF-8 for separations at of alkane isomers;83 the separation is primarily based on differences in intra-crystalline diffusivities.21
12 Separation of xylene isomers
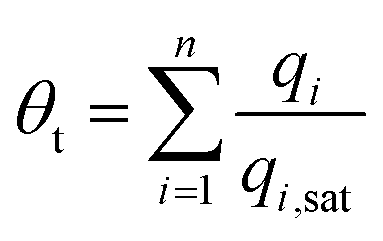
Para-xylene is a valuable petrochemical feedstock; the largest use of p-xylene is in its oxidation to make terephthalic acid, that is used in turn to make polymers such as polyethylene terephthalate (PET) and polybutylene terephthalate (PBT). PET is one of the largest volume polymers in the world, and is used to produce fibers, resins, films, and blown beverage bottles.In a commonly used separation scheme (cf. Fig. 27a), the xylenes rich stream from the bottom of the reformer splitter is routed to a xylenes splitter. Here, the heavier aromatics (C9+) are removed from the bottom of the column. The overhead stream from the xylenes splitter, typically containing 19% ethylbenzene, 44% m-xylene, 20% o-xylene, and 17% p-xylene, needs to be separated for recovery of p-xylene. In current technology this mixture is separated in a Simulated Moving Bed (SMB) adsorption separation unit. The adsorbent used is BaX zeolite, that selectively adsorbs p-xylene. Since the adsorbent particles are in contact with a mixture in the liquid phase, the pores of the adsorbent material are practically saturated with guest molecules.30 For mixture adsorption, let us define the fractional occupancy within the pores, θt
 | (2) |
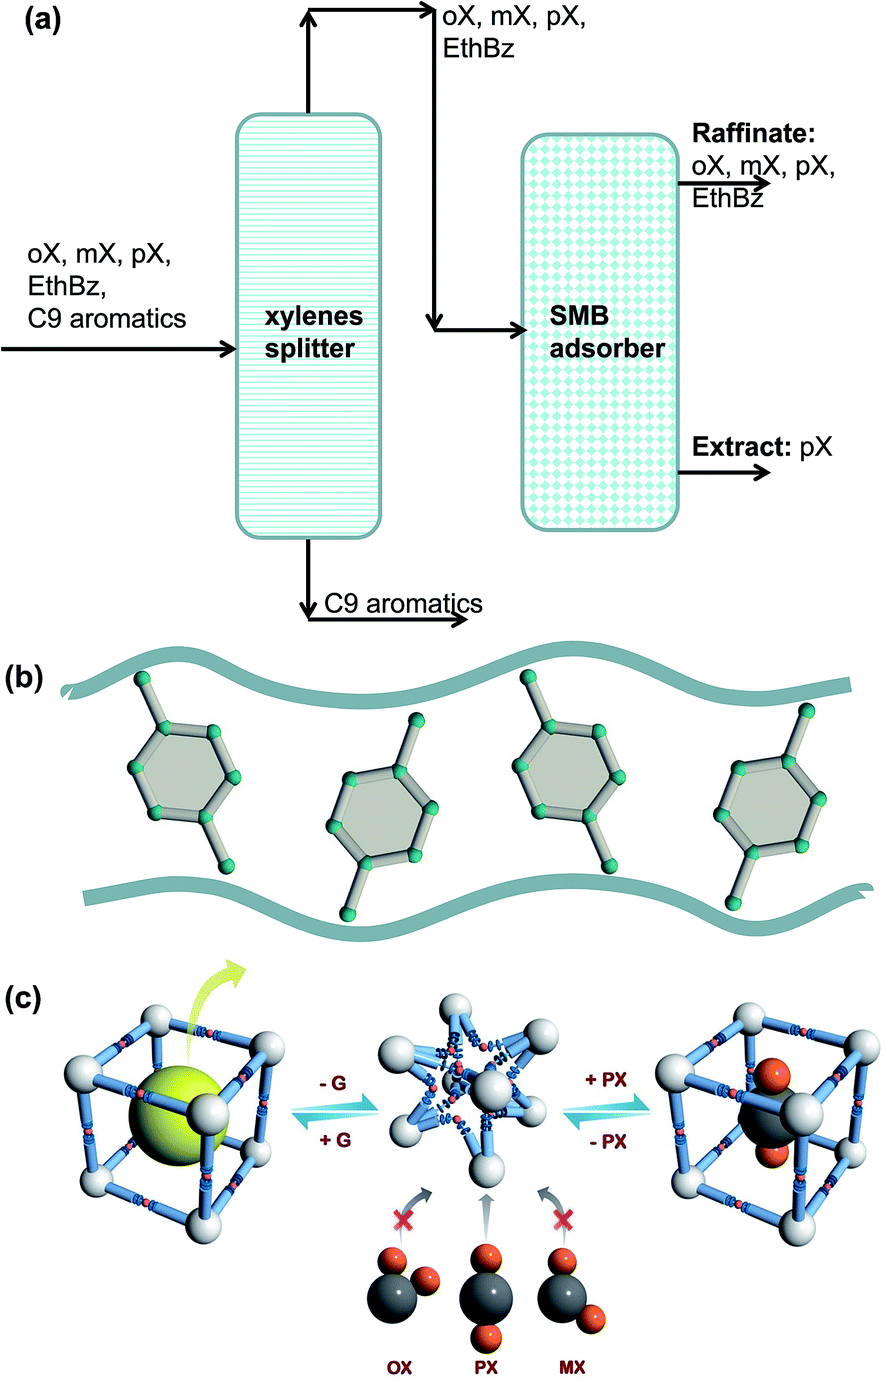 | ||
| Fig. 27 (a) Schematic showing the separations of the oX/mX/pX/EthBz mixtures in a Simulated Moving Bed (SMB) unit. (b) Stacking of p-xylene within 10 Å channels of MAF-X8.84 (c) Schematic representation of the framework flexibility of DynaMOF-100 with selective accommodation of p-xylene from xylenes mixture.4 | ||
Let us compare the separation performance of BaX with MOFs that have been shown recently to be applicable to this task. Torres-Knoop et al.84 have adopted a conceptual approach, using CBMC simulations for selecting MOFs that selectively adsorb p-xylene. Within the one-dimensional 10 Å channels of MAF-X8, we have commensurate stacking of p-xylene; see Fig. 27b.84 Commensurate stacking within 1D channels of MAF-X8, results in strong selectivity in the favor of the p-xylene as θt → 1. More recently, Mukherjee et al.4 report the synthesis of a Zn(II)-based dynamic coordination framework, [Zn4O(L)3], also dubbed DynaMOF-100.5 The framework gets transformed in such a manner as to allow optimal packing of p-xylene within the cavities; see Fig. 27c.
For separation of 4-component equimolar o-xylene(1)/m-xylene(2)/p-xylene(3)/ethylbenzene(4) mixtures we adopt the following definition of selectivity that was used in the recent paper of Torres-Knoop et al.84
 | (3) |
For a fair comparison of adsorbents, we compare the values of the selectivity as function of the fractional occupancy within the pores, θt. Fig. 28a shows that the Sads value for DynaMOF-100 (at 298 K) is about one to two orders of magnitude higher than that of MAF-X8 (at 433 K),84 Mg-CUK-1 (at 323 K),85 and BaX zeolite (at 393 K, and 453 K).86,87
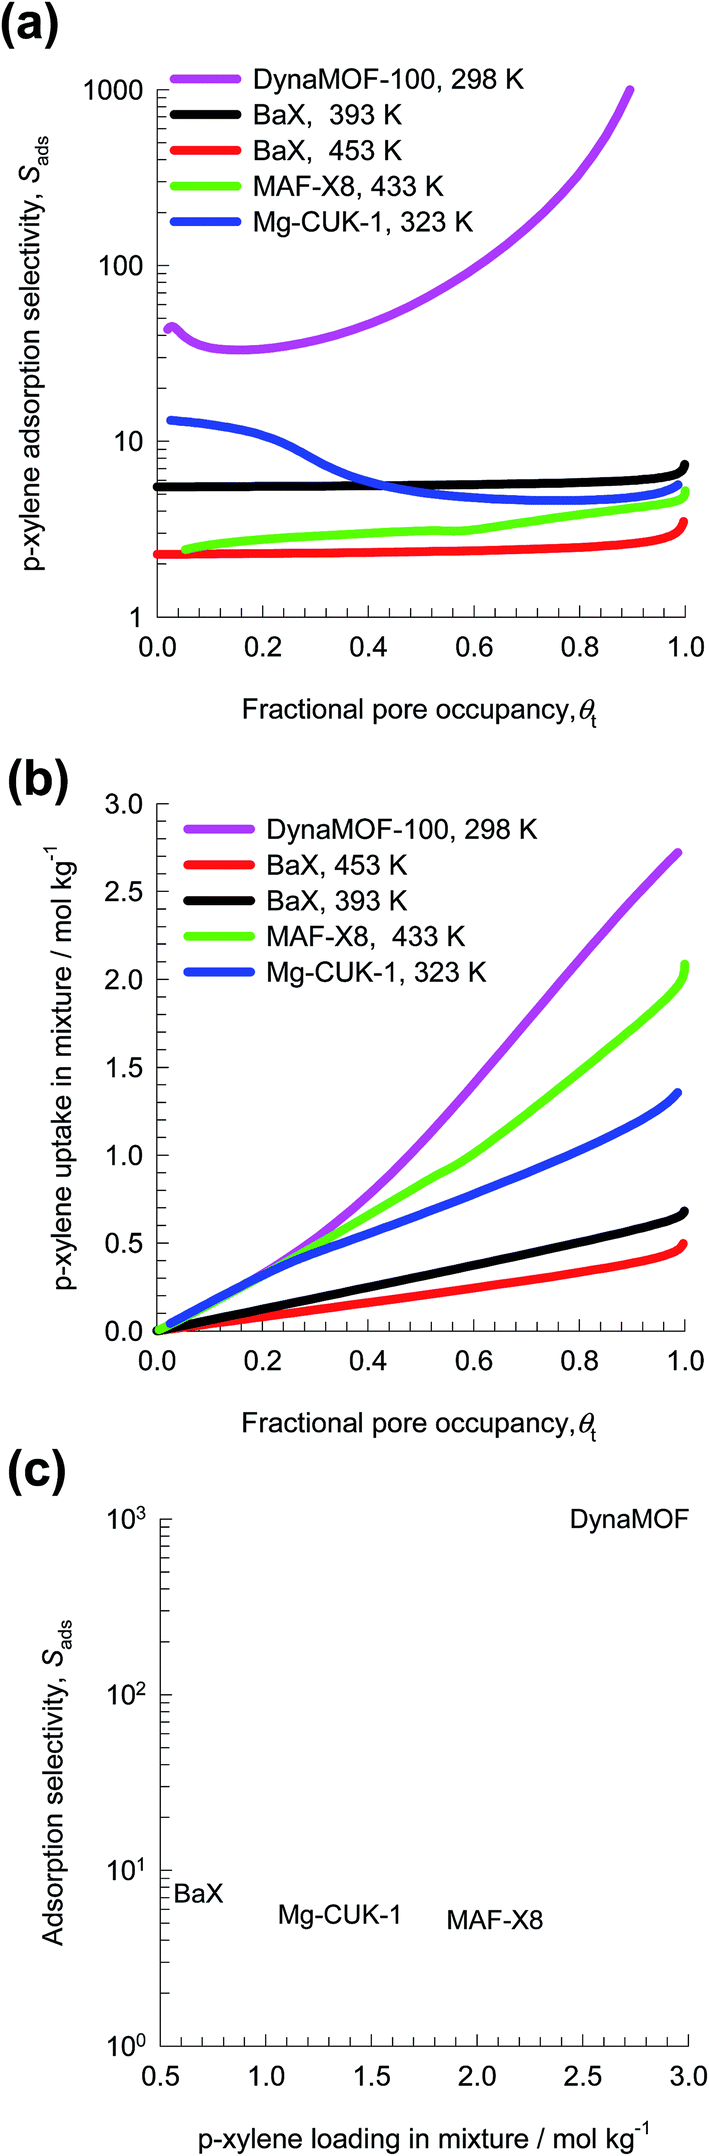 | ||
| Fig. 28 (a) IAST calculations for p-xylene adsorption selectivity for 4-component o-xylene/m-xylene/p-xylene/ethylbenzene mixture in MAF-X8 (at 433 K), BaX zeolite (at 393 K, and 453 K), Mg-CUK-1 (at 323 K), and DynaMOF-100 (at 298 K). The x-axis is fractional occupancy, θt, within the pores of the MOFs. (b) IAST calculations for p-xylene uptake capacity in mixture. (c) Plot of selectivity vs. uptake capacity at θt ≈ 1. | ||
Besides Sads, the separation performance is also dictated by the uptake capacity for p-xylene. Fig. 28b compares the p-xylene uptake capacity of MAF-X8, Mg-CUK-1, and BaX with that of DynaMOF-100. Fig. 28c presents a plot of selectivity vs. uptake capacity at θt ≈ 1. The combination of high selectivities and high uptake capacities indicates that DynaMOF-100 is the best choice of adsorbent; further experimentation is required to establish this expectation.
13 Styrene/ethylbenzene separations
Alkylation of benzene with ethene produces ethyl benzene (cf. Fig. 29a), which is dehydrogenated to styrene, a monomer used in the manufacture of many commercial polymers and co-polymers. The conversion of ethylbenzene to styrene is only partial, and the reactor product contains a large fraction, in the range of 20–40%, of unreacted ethylbenzene. Due to the small, 9 K, difference in their boiling points, the distillation separation of styrene and ethylbenzene has to be carried out in tall vacuum towers that have high energy demands; adsorptive separations using microporous metal–organic frameworks offer energy-efficient alternatives.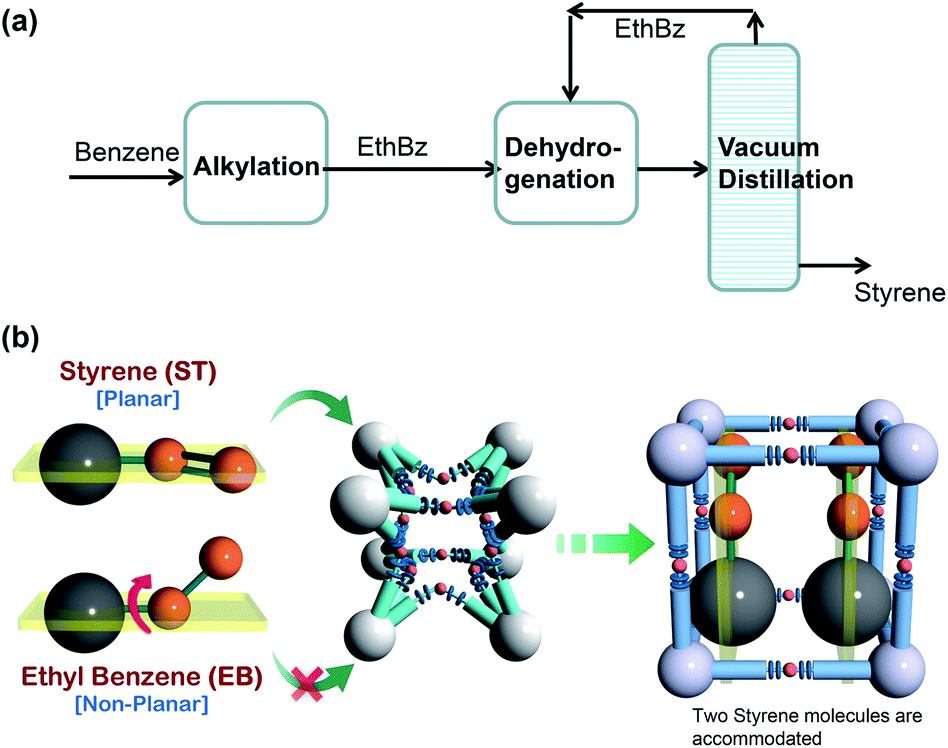 | ||
| Fig. 29 (a) Current processing scheme for styrene production by vacuum fractionation of styrene/ethylbenzene mixtures. (b) Schematic representation of the framework flexibility of DynaMOF-100 with selective accommodation of styrene from mixtures with ethylbenzene.5 | ||
In the recent screening study of Torres-Knoop et al.,88 MIL-47(V)89 and MIL-53(Al)89 emerged as the best adsorbents for separation of styrene/ethylbenzene mixtures. Let us now compare the performance of MIL-47(V) and MIL-53(Al) with DynaMOF-100 that undergoes guest-induced structural changes to selectively encapsulate styrene (cf. Fig. 29b).
Fig. 30a presents the IAST calculations in which the x-axis is fractional occupancy, θt, within the pores of the MOFs. We note that the value of Sads for DynaMOF-100 is about one to two orders of magnitude higher than that of MIL-47(V) and MIL-53(Al). Fig. 30b compares IAST calculations for styrene uptake capacity in the three MOFs; the uptake capacity of DynaMOF-100 is higher than that of the other two MOFs. Fig. 30c presents a plot of selectivity vs. uptake capacity at pore saturation, θt ≈ 1. Due to the significantly higher adsorption selectivity, and higher styrene uptake capacity, we should expect separations with DynaMOF-100 to be significantly superior to those realized with either MIL-47(V) or MIL-53(Al); this anticipated superiority of DynaMOF-100 needs to be established in experiments.
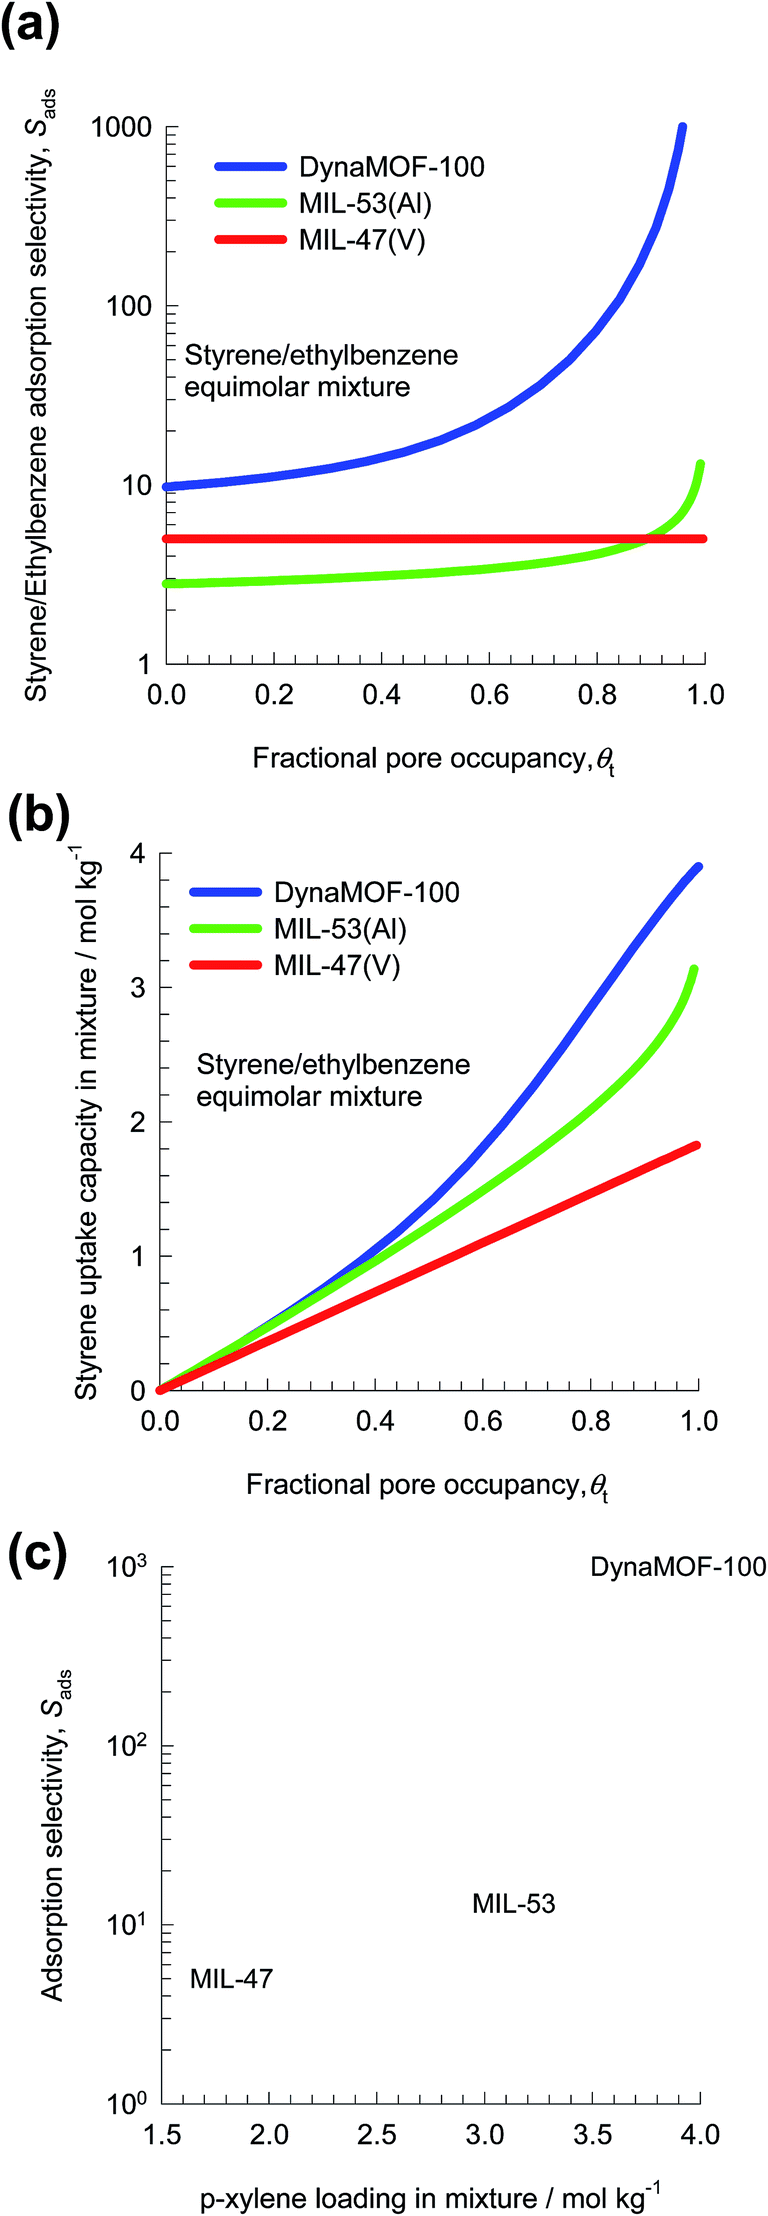 | ||
| Fig. 30 (c and d) IAST calculations for (a) adsorption selectivity, and (b) uptake capacity of equimolar styrene/ethylbenzene mixtures in MIL-47(V), MIL-53(Al), and DynaMOF-100. The x-axis is fractional occupancy, θt, within the pores of the MOFs. (c) Plot of selectivity vs. uptake capacity at θt ≈ 1. | ||
14 Stability and other issues that influence the selection of MOFs
The selection methodologies considered in the foregoing sections were based on a number of important simplifying assumptions: (a) trace impurities, such as water vapor, that may be present in the mixtures have been ignored, (b) no account has been taken of the influence of the presence of impurities on the separation performance, and (c) the analysis of every separation is based on isotherm data that have been determined on defect-free as-synthesized crystals. In practice, one or more of the afore-mentioned assumptions may not hold.Often, the presence of water vapor in industrial flue gas or natural gas streams cannot be ignored when examining adsorbents for CO2 capture. In their comprehensive review article, Burtch et al.27 demonstrate that stability of an adsorbent in humid environments is a critical property that needs to be included as part of the MOF selection methodology. Of the 20000 MOF structures reported to data, very few of them retain their structural integrity after exposure to moisture of chemical treatment.28,90–92 Kizzie et al.90 have shown that MgMOF-74 is particularly sensitive to the presence of water impurities in the feed mixture, whereas CoMOF-74 and NiMOF-74 are less sensitive in this regard. Liu et al.92 found that NiMOF-74 maintains its CO2 uptake capacity after steam conditioning and long-term storage, whereas MgMOF-74 does not.
MIL-53(Cr) has a unit cell volume of 1486 Å3 in the as-synthesized “large pore” form (-lp). At a water loading of 2 molecules per unit cell, the unit cell volume shrinks to 1013 Å3, the “narrow pore” (-np) form.93,94 The -np structure is virtually inaccessible to guest molecules. On heating and removal of adsorbed water, the -lp form is regained.
For use in fixed bed adsorbers, the MOFs are most commonly used in the form of pellets or extrudates. As illustration, in the investigation of H2 separation from steam-methane reformer off-gas as reported by Agueda et al.,57 UTSA-16 crystals were first synthesized according to the method reported in the literature.58 The crystals were then agglomerated in the form of extrudates using polyvinylalcohol as binder. The CO2 uptakes measured for the extrudates are found to be about 15% lower than the corresponding data for pristine UTSA-16 crystals. This lowering can be attributed to the binder content in the extrudate, and blocking of the entry into the embedded MOF crystals introduced by the binder.95
In the study of Chen et al.,24 CO2/CH4 and C3H6/C3H8 separations with NiMOF-74 in pelletized form are reported. The pellets are formed by compaction of crushed MOF crystals. A careful comparison of the reported unary isotherm data for NiMOF-74 pellets with those obtained for pristine NiMOF-74 crystals,41,65 show lower uptake values for pellets. This lowering is most likely caused by reduction in the available pore volume, and surface area as a result of the structural transformations accompanying the compaction process.
The implication is that for process development studies with the selected MOFs, the isotherm data need to be re-measured using pellets or extrudates as appropriate.
Fixed bed adsorbers are normally operated in a cyclical manner, with adsorption and desorption cycles. The ability of the selected MOF to retain its separation capability during a large number of adsorption/desorption cycles needs to be ascertained. For C3H6/C3H8 separations, with FeMOF-74, Bloch et al.59 find that the separation performance is retained after about 40 adsorption/desorption cycles. However, for process development, about a million cycles carried out over a period of a few weeks, need to be tested before possible usage in industrial units.
15 Conclusions
The following major conclusions can be drawn on the basis of the several case studies considered in the foregoing sections.(1) Separations in PSA units are governed by a combination of adsorption selectivity, uptake capacity, and intra-crystalline diffusion limitations. Selecting MOFs on the basis of adsorption selectivity alone may lead to sub-optimal choice of adsorbent materials. Often, high uptake capacities can over-ride the influence of low selectivities. Conversely, low uptake capacities diminish the separation performance of MOFs with high selectivities.
(2) Transient breakthrough experiments, backed by transient breakthrough simulations, afford a proper evaluation of the separation performance of fixed bed adsorbers.
(3) Strong intra-crystalline diffusional influences lead to distended breakthroughs, resulting in reduced capture capacities and productivities.
(4) Hydrogen production from steam reforming of natural gas involves separations of H2/CO2/CO/CH4/N2 mixtures. The N2/H2, CO/H2, CH4/H2 adsorption selectivities are far more relevant than the CO2/H2 selectivity. Transient breakthroughs are the only consistent procedure of judging separation performances.
(5) For CO2/N2/SO2 separations, SO2 is often more strongly adsorbed than CO2 in most MOFs. The purity of N2 will be dictated by CO2/N2 separations; there is no point is searching for MOFs with increased SO2/N2 selectivities. For CO2/CH4/H2S separations, H2S is often more strongly adsorbed than CO2 on the open metal sites of MOFs. The purity of CH4 will be dictated by CO2/CH4 separations; the H2S/CH4 selectivities do not influence the purities of CH4.
(6) For N2/CH4 mixture separations with LTA-4A zeolite, the higher diffusivity of N2 can be used to reverse the selectivity in its favor; this strategy is useful for meeting the pipeline specifications of natural gas.
(7) A unique scenario holds for hexane isomer separations using MFI zeolite. In this case, adsorption and diffusion proceeds synergistically and enhances separations.
(8) Industrial separations of mixtures of aromatics, are invariably carried out under pore saturation conditions. In these cases, the separations need to be compared at fractional occupancies, θt ≈ 1.
Notation
| ci | Molar concentration of species i in gas mixture, mol m−3 |
| ci0 | Molar concentration of species i in gas mixture at inlet to adsorber, mol m−3 |
| Đi | Maxwell–Stefan diffusivity, m2 s−1 |
| L | Length of packed bed adsorber, m |
| n | Number of components in the mixture, dimensionless |
| pi | Partial pressure of species i in mixture, Pa |
| pt | Total system pressure, Pa |
| qi | Component molar loading of species i, mol kg−1 |
| qt | Total molar loading for mixture adsorption, mol kg−1 |
| qi,sat | Molar loading of species i at saturation, mol kg−1 |
| Qst | Isosteric heat of adsorption, J mol−1 |
| rc | Radius of crystallite, m |
| Sads | Adsorption selectivity, dimensionless |
| t | Time, s |
| T | Absolute temperature, K |
| u | Superficial gas velocity in packed bed, m s−1 |
Greek letters
| α | Polarizability, cm3 |
| ε | Voidage of packed bed, dimensionless |
| θt | Fractional occupancy for mixture adsorption, dimensionless |
| τ | Time, dimensionless |
Subscripts
| i | referring to component i |
| t | referring to total mixture |
References
- D. M. Ruthven, S. Farooq and K. S. Knaebel, Pressure swing adsorption, VCH Publishers, New York, 1994 Search PubMed.
- R. Krishna and J. M. van Baten, Microporous Mesoporous Mater., 2011, 137, 83–91 CrossRef CAS PubMed.
- Y. Lee, J. A. Hriljac, T. Vogt, J. B. Parise, M. J. Edmondson, P. A. Anderson, D. R. Corbin and T. Nagai, J. Am. Chem. Soc., 2001, 123, 8418–8419 CrossRef CAS.
- S. Mukherjee, B. Joarder, B. Manna, A. V. Desai, A. K. Chaudhari and S. K. Ghosh, Sci. Rep., 2014, 4, 5761, DOI:10.1038/srep05761.
- S. Mukherjee, B. Joarder, A. V. Desai, B. Manna, R. Krishna and S. K. Ghosh, Inorg. Chem., 2015, 54, 4403–4408 CrossRef CAS PubMed.
- V. Guillerm, F. Ragon, M. Dan-Hardi, T. Devic, M. Vishnuvarthan, B. Campo, A. Vimont, G. Clet, Q. Yang, G. Maurin, G. Férey, A. Vittadini, S. Gross and C. Serre, Angew. Chem., Int. Ed., 2012, 51, 9267–9271 CrossRef CAS PubMed.
- Z. R. Herm, B. M. Wiers, J. M. Van Baten, M. R. Hudson, P. Zajdel, C. M. Brown, N. Maschiocchi, R. Krishna and J. R. Long, Science, 2013, 340, 960–964 CrossRef CAS PubMed.
- A. Torres-Knoop, S. R. G. Balestra, R. Krishna, S. Calero and D. Dubbeldam, ChemPhysChem, 2015, 16, 532–535 CrossRef CAS PubMed.
- R. Matsuda, R. Kitaura, S. Kitagawa, Y. Kubota, R. V. Belosludov, T. C. Kobayashi, H. Sakamoto, T. Chiba, M. Takata, Y. Kawazoe and Y. Mita, Nature, 2005, 436, 238–241 CrossRef CAS PubMed.
- M. Fischer, F. Hoffmann and M. Fröba, ChemPhysChem, 2010, 11, 2220–2229 CrossRef CAS PubMed.
- P. Li, Y. He, Y. Zhao, L. Weng, H. Wang, R. Krishna, H. Wu, W. Zhou, M. O'Keeffe, Y. Han and B. Chen, Angew. Chem., Int. Ed., 2015, 54, 574–577 CAS.
- X. Duan, Q. Zhang, J. Cai, Y. Yang, Y. Cui, Y. He, C. Wu, R. Krishna, B. Chen and G. Qian, J. Mater. Chem. A, 2014, 2, 2628–2633 CAS.
- J. Duan, W. Jin and R. Krishna, Inorg. Chem., 2015, 54, 4279–4284 CrossRef CAS PubMed.
- A. L. Myers and J. M. Prausnitz, AIChE J., 1965, 11, 121–130 CrossRef CAS PubMed.
- R. Krishna and J. M. van Baten, Chem. Phys. Lett., 2007, 446, 344–349 CrossRef CAS PubMed.
- R. Krishna and J. M. van Baten, Sep. Purif. Technol., 2008, 61, 414–423 CrossRef CAS PubMed.
- R. Krishna and J. M. van Baten, Chem. Eng. Sci., 2008, 63, 3120–3140 CrossRef CAS PubMed.
- R. Krishna and J. M. van Baten, Chem. Eng. J., 2008, 140, 614–620 CrossRef CAS PubMed.
- J. J. Gutierrez-Sevillano, S. Calero and R. Krishna, J. Phys. Chem. C, 2015, 119, 3658–3666 CAS.
- R. Krishna and J. R. Long, J. Phys. Chem. C, 2011, 115, 12941–12950 CAS.
- R. Krishna, Microporous Mesoporous Mater., 2014, 185, 30–50 CrossRef CAS PubMed.
- H. Wu, K. Yao, Y. Zhu, B. Li, Z. Shi, R. Krishna and J. Li, J. Phys. Chem. C, 2012, 116, 16609–16618 CAS.
- D.-L. Chen, N. Wang, F.-F. Wang, J. Xie, Y. Zhong, W. Zhu, J. K. Johnson and R. Krishna, J. Phys. Chem. C, 2014, 118, 17831–17838 CAS.
- D.-L. Chen, H. Shang, W. Zhu and R. Krishna, Chem. Eng. Sci., 2014, 117, 407–415 CrossRef CAS PubMed.
- D.-L. Chen, N. Wang, C. Xu, G. Tu, W. Zhu and R. Krishna, Microporous Mesoporous Mater., 2015, 208, 55–65 CrossRef CAS PubMed.
- H. Yu, X. Wang, C. Xu, D.-L. Chen, W. Zhu and R. Krishna, Chem. Eng. J., 2015, 269, 135–147 CrossRef CAS PubMed.
- N. C. Burtch, H. Jasuja and K. S. Walton, Chem. Rev., 2014, 114, 10575–10612 CrossRef CAS PubMed.
- J. B. DeCoste, G. W. Peterson, B. J. Schindler, K. L. Killops, M. A. Browe and J. J. Mahle, J. Mater. Chem. A, 2013, 1, 11922–11932 CAS.
- D. Banerjee, A. J. Cairns, J. Liu, R. Krishna, P. K. Thallapally and D. M. Strachan, Acc. Chem. Res., 2015, 48, 211–219 CrossRef CAS PubMed.
- R. Krishna, Phys. Chem. Chem. Phys., 2015, 17, 39–59 RSC.
- Z.-Y. Gu, C.-X. Yang, N. Chang and X.-P. Yan, Acc. Chem. Res., 2012, 45, 734–745 CrossRef CAS PubMed.
- H. Wang, K. Yao, Z. Zhang, J. Jagiello, Q. Gong, Y. Han and J. Li, Chem. Sci., 2014, 5, 620–624 RSC.
- R. Krishna, J. Phys. Chem. C, 2009, 113, 19756–19781 CAS.
- R. Krishna and J. M. van Baten, Mol. Simul., 2009, 35, 1098–1104 CrossRef CAS PubMed.
- X. Chen, A. M. Plonka, D. Banerjee, R. Krishna, H. T. Schaef, D. Ghose, P. K. Thallapally and J. B. Parise, J. Am. Chem. Soc., 2015 DOI:10.1021/jacs.5b02556.
- J. Liu, P. K. Thallapally and D. Strachan, Langmuir, 2012, 28, 11584–11589 CrossRef CAS PubMed.
- J. Liu, D. M. Strachan and P. K. Thallapally, Chem. Commun., 2014, 50, 466–468 RSC.
- Y. Gurdal and S. Keskin, Ind. Eng. Chem. Res., 2012, 51, 7373–8382 CrossRef CAS.
- J. A. Mason, K. Sumida, Z. R. Herm, R. Krishna and J. R. Long, Energy Environ. Sci., 2011, 4, 3030–3040 CAS.
- H. Wu, J. M. Simmons, G. Srinivas, W. Zhou and T. Yildrim, J. Phys. Chem. Lett., 2010, 1, 1946–1951 CrossRef CAS.
- P. D. C. Dietzel, V. Besikiotis and R. Blom, J. Mater. Chem., 2009, 19, 7362–7370 RSC.
- Y. Belmabkhout, G. Pirngruber, E. Jolimaitre and A. Methivier, Adsorption, 2007, 13, 341–349 CrossRef CAS PubMed.
- M. R. Hudson, L. Murray, J. A. Mason, D. W. Fickel, R. F. Lobo, W. L. Queen and C. M. Brown, J. Am. Chem. Soc., 2012, 134, 1970–1973 CrossRef CAS PubMed.
- S. Li, J. L. Falconer, R. D. Noble and R. Krishna, J. Phys. Chem. C, 2007, 111, 5075–5082 CAS.
- R. Krishna and J. M. van Baten, J. Membr. Sci., 2013, 430, 113–128 CrossRef CAS PubMed.
- S. Yang, J. Sun, A. J. Ramirez-Cuesta, S. K. Callear, W. I. F. David, D. P. Anderson, R. Newby, A. J. Blake, J. E. Parker, C. C. Tang and M. Schröder, Nat. Chem., 2012, 4, 887–894 CrossRef CAS PubMed.
- Z. R. Herm, J. A. Swisher, B. Smit, R. Krishna and J. R. Long, J. Am. Chem. Soc., 2011, 133, 5664–5667 CrossRef CAS PubMed.
- G. T. Rochelle, Science, 2009, 325, 1652–1654 CrossRef CAS PubMed.
- L. Li, J. Yang, J. Li, Y. Chen and J. Li, Microporous Mesoporous Mater., 2014, 198, 236–246 CrossRef CAS PubMed.
- S. Chavan, F. Bonino, L. Valenzano, B. Civalleri, C. Lamberti, N. Acerbi, J. H. Cavka, M. Leistner and S. Bordiga, J. Phys. Chem. C, 2013, 117, 15615–15622 CAS.
- S. Vaesen, V. Guillerm, Q. Yang, A. D. Wiersum, B. Marszalek, B. Gil, A. Vimont, M. Daturi, T. Devic, P. L. Llewellyn, C. Serre, G. Maurin and G. De Weireld, Chem. Commun., 2013, 49, 10082–10084 RSC.
- S. Sircar and T. C. Golden, Sep. Sci. Technol., 2000, 35, 667–687 CrossRef CAS.
- A. M. Ribeiro, C. A. Grande, F. V. S. Lopes, J. M. Loureiro and A. E. Rodrigues, Chem. Eng. Sci., 2008, 63, 5258–5273 CrossRef CAS PubMed.
- A. M. Banu, D. Friedrich, S. Brandani and T. Düren, Ind. Eng. Chem. Res., 2013, 52, 9946–9957 CrossRef CAS.
- E. H. Majlan, W. R. W. Daud, S. E. Iyuke, A. B. Mohamad, A. H. Kadhum, A. W. Mohammad, M. S. Takriff and N. Bahaman, Int. J. Hydrogen Energy, 2009, 34, 2771–2777 CrossRef CAS PubMed.
- Z. R. Herm, R. Krishna and J. R. Long, Microporous Mesoporous Mater., 2012, 151, 481–487 CrossRef CAS PubMed.
- V. I. Agueda, J. A. Delgado, M. A. Uguina, P. Brea, A. I. Spjelkavik, R. Blom and C. Grande, Chem. Eng. Sci., 2015, 124, 159–169 CrossRef CAS PubMed.
- S. C. Xiang, Y. He, Z. Zhang, H. Wu, W. Zhou, R. Krishna and B. Chen, Nat. Commun., 2012, 3, 954, DOI:10.1038/ncomms1956.
- E. D. Bloch, W. L. Queen, R. Krishna, J. M. Zadrozny, C. M. Brown and J. R. Long, Science, 2012, 335, 1606–1610 CrossRef CAS PubMed.
- S. M. Chavan, G. C. Shearer, E. D. Bloch and S. Bordiga, ChemPhysChem, 2012, 13, 445–448 CrossRef CAS PubMed.
- M. C. Das, Q. Guo, Y. He, J. Kim, C. G. Zhao, K. Hong, S. Xiang, Z. Zhang, K. M. Thomas, R. Krishna and B. Chen, J. Am. Chem. Soc., 2012, 134, 8703–8710 CrossRef CAS PubMed.
- T.-L. Hu, H. Wang, B. Li, R. Krishna, H. Wu, W. Zhou, Y. Zhao, Y. Han, X. Wang, W. Zhu, Z. Yao, S. C. Xiang and B. Chen, Nat. Commun., 2015, 6, 7328, DOI:10.1038/ncomms8328.
- Y.-S. Bae, C. Y. Lee, K. C. Kim, O. K. Farha, P. Nickias, J. T. Hupp, S. T. Nguyen and R. Q. Snurr, Angew. Chem., Int. Ed., 2012, 51, 1857–1860 CrossRef CAS PubMed.
- Z. Bao, S. Alnemrat, I. Vasiliev, Q. Ren, L. Yu, X. Lu and S. Deng, Langmuir, 2011, 27, 13554–13562 CrossRef CAS PubMed.
- S. J. Geier, J. A. Mason, E. D. Bloch, W. L. Queen, M. R. Hudson, C. M. Brown and J. R. Long, Chem. Sci., 2013, 4, 2054–2061 RSC.
- Y. Zhang, B. Li, R. Krishna, Z. Wu, D. Ma, Z. Shi, T. Pham, K. Forrest, B. Space and S. Ma, Chem. Commun., 2015, 51, 2714–2717 RSC.
- B. Li, Y. Zhang, R. Krishna, K. Yao, Y. Han, Z. Wu, D. Ma, Z. Shi, T. Pham, B. Space, J. Liu, P. K. Thallapally, J. Liu, M. Chrzanowski and S. Ma, J. Am. Chem. Soc., 2014, 136, 8654–8660 CrossRef CAS PubMed.
- S. Yang, A. J. Ramirez-Cuesta, R. Newby, V. Garcia-Sakai, P. Manuel, S. K. Callear, S. I. Campbell, C. C. Tang and M. Schröder, Nat. Chem., 2014, 7, 121–129 CrossRef PubMed.
- F. A. Da Silva and A. E. Rodrigues, AIChE J., 2001, 47, 341–357 CrossRef CAS PubMed.
- C. A. Grande, F. Poplow and A. E. Rodrigues, Sep. Sci. Technol., 2010, 45, 1252–1259 CrossRef CAS PubMed.
- C. Gücüyener, J. van den Bergh, J. Gascon and F. Kapteijn, J. Am. Chem. Soc., 2010, 132, 17704–17706 CrossRef PubMed.
- J. Kim, L.-C. Lin, R. L. Martin, J. A. Swisher, M. Haranczyk and B. Smit, Langmuir, 2012, 28, 11914–11919 CrossRef CAS PubMed.
- U. Böhme, B. Barth, C. Paula, A. Kuhnt, W. Schwieger, A. Alexander Mundstock, J. Caro and M. Hartmann, Langmuir, 2013, 29, 8592–8600 CrossRef PubMed.
- S. Farooq, D. M. Ruthven and H. A. Boniface, Chem. Eng. Sci., 1989, 44, 2809–2816 CrossRef CAS.
- E. D. Bloch, L. Murray, W. L. Queen, S. M. Chavan, S. N. Maximoff, J. P. Bigi, R. Krishna, V. K. Peterson, F. Grandjean, G. J. Long, B. Smit, S. Bordiga, C. M. Brown and J. R. Long, J. Am. Chem. Soc., 2011, 133, 14814–14822 CrossRef CAS PubMed.
- H. W. Habgood, Can. J. Chem., 1958, 36, 1384–1397 CrossRef CAS.
- R. Krishna, Chem. Soc. Rev., 2015, 44, 2812–2836 RSC.
- B. Majumdar, S. J. Bhadra, R. P. Marathe and S. Farooq, Ind. Eng. Chem. Res., 2011, 50, 3021–3034 CrossRef CAS.
- R. Krishna and J. M. van Baten, Sep. Purif. Technol., 2007, 55, 246–255 CrossRef CAS PubMed.
- D. Dubbeldam, R. Krishna, S. Calero and A. Ö. Yazaydın, Angew. Chem., Int. Ed., 2012, 51, 11867–11871 CrossRef CAS PubMed.
- R. Krishna, Chem. Eng. Res. Des., 2001, 79, 182–194 CrossRef CAS.
- T. Titze, C. Chmelik, J. Kärger, J. M. van Baten and R. Krishna, J. Phys. Chem. C, 2014, 118, 2660–2665 CAS.
- N. Chang, Z.-Y. Gu and X.-P. Yan, J. Am. Chem. Soc., 2010, 132, 13645–13647 CrossRef CAS PubMed.
- A. Torres-Knoop, R. Krishna and D. Dubbeldam, Angew. Chem., Int. Ed., 2014, 53, 7774–7778 CrossRef CAS PubMed.
- B. Saccoccia, A. M. Bohnsack, N. W. Waggoner, K. H. Cho, J. S. Lee, D.-Y. Hong, V. M. Lynch, J.-S. Chang and S. M. Humphrey, Angew. Chem., Int. Ed., 2015, 54, 5394–5398 CrossRef CAS PubMed.
- M. Minceva and A. E. Rodrigues, AIChE J., 2007, 53, 138–149 CrossRef CAS PubMed.
- M. Minceva and A. E. Rodrigues, Chem. Eng. Res. Des., 2004, 82, 667–681 CrossRef CAS.
- A. Torres-Knoop, J. Heinen, R. Krishna and D. Dubbeldam, Langmuir, 2015, 31, 3771–3778 CrossRef CAS PubMed.
- M. Maes, F. Vermoortele, L. Alaerts, S. Couck, C. E. A. Kirschhock, J. F. M. Denayer and D. E. De Vos, J. Am. Chem. Soc., 2010, 132, 15277–15285 CrossRef CAS PubMed.
- A. C. Kizzie, A. G. Wong-Foy and A. J. Matzger, Langmuir, 2011, 27, 6368–6373 CrossRef CAS PubMed.
- J. Liu, J. Tian, P. K. Thallapally and B. P. McGrail, J. Phys. Chem. C, 2012, 116, 9575–9581 CAS.
- J. Liu, A. I. Benin, A. M. B. Furtado, P. Jakubczak, R. R. Willis and M. D. LeVan, Langmuir, 2011, 27, 11451–11456 CrossRef CAS PubMed.
- C. Serre, F. Millange, C. Thouvenot, M. Nouguès, G. Marsolier, D. Louër and G. Férey, J. Am. Chem. Soc., 2002, 124, 13519–13526 CrossRef CAS PubMed.
- D. Dubbeldam, R. Krishna and R. Q. Snurr, J. Phys. Chem. C, 2009, 113, 19317–19327 CAS.
- V. Finsy, L. Ma, L. Alaerts, D. E. de Vos, G. V. Baron and J. F. M. Denayer, Microporous Mesoporous Mater., 2009, 120, 221–227 CrossRef CAS PubMed.
Footnote |
| † Electronic supplementary information (ESI) available: This material provides salient structural details of all the adsorbent materials that are evaluated for any specific separation application, along with references to data sources for unary isotherms. Also included as ESI are video animations for transient breakthroughs for every mixture investigated. See DOI: 10.1039/c5ra07830j |
| This journal is © The Royal Society of Chemistry 2015 |