Computer simulations of fibronectin adsorption on hydroxyapatite surfaces†
Chenyi Liaoa,
Yun Xieb and
Jian Zhou*a
aSchool of Chemistry and Chemical Engineering, Guangdong Provincial Key Lab for Green Chemical Product Technology, South China University of Technology, Guangzhou, 510640, P. R. China. E-mail: jianzhou@scut.edu.cn; Fax: +86 20 87114069; Tel: +86 20 87114069
bSchool of Chemistry and Chemical Engineering, Guangdong Pharmaceutical University, Guangzhou, 510006, P. R. China
First published on 19th March 2014
Abstract
The orientation and adsorption mechanism of the 10th and 7–10th type III modules of fibronectin (FN-III10, FN-III7–10) on hydroxyapatite surfaces were investigated by a combination of parallel tempering Monte Carlo (PTMC) and molecular dynamics (MD) methods. The PTMC results show a positively charged surface at low ionic strength is beneficial for FN-III10 and FN-III7–10 adsorption with RGD accessible in solution, i.e., FN-III10 adsorbs with “side-on” orientation while FN-III7–10 adsorbs with “lying” orientation. During the adsorption, FN-III10 adsorbs on the hydroxyapatite (HAP) surface first driven by Coulombic interactions at the pre-adsorption stage. At the post-adsorption stage, the driving force changes from Coulombic interactions to VDW interactions. Accordingly, slow translation of FN-III10 on the HAP surface was found due to the mismatching of charged groups of protein on the alternative charged surface. The conformational changes of adsorbed FN-III10 mainly take place at its coil/loop parts. FN-III7–10 experiences two stages from weak adsorption to strong adsorption when Coulombic interactions become the dominant driving force. The transition is determined by the anchoring of the basic residues in the Ca2+ vacancies by significant complementary electrostatic interactions and hydrogen bonds formed between the guanidine group and the surrounding phosphate groups. The module III10 of FN-III7–10 exhibits the largest conformational change and contributes to the adsorption most. The affinity of the guanidine group binding suggests that vacancies on biomaterials have the capacity to trap specific residues.
1. Introduction
Enhancing the bone regeneration is essential for healing large bone defects, which remains a major clinical orthopedic challenge. Over the past 35 years, hydroxyapatite (Ca10(PO4)6(OH)2, HAP) has been regarded as one of the most widely used bone substitutes and coatings.1,2 As the primary mineral component of human bones and teeth enamel, HAP can bond to bone and enhance bone tissue formation.1 One major issue of using bioactive HAP is that the close proximity to the host bone is necessary to allow osteoblasts to spread and generate new bone growth (i.e. osteoconduction), and stimulate osteoprogenitor cells to differentiate into osteoblasts which then begin new bone formation (i.e. osteoinduction). By loading osteoinductive proteins and/or osteogenic cells on HAP scaffolds, it allows to develop tissue-engineering scaffolds with both osteoconductivity and osteoinductivity.1The hydrophilic HAP surfaces are in close association with the component of biological fluids in biosystems. Protein/peptide regulates HAP crystal morphologies by strong binding on HAP planes. Collagen, for example, is known to be an active scaffold for bone formation, and interacts with HAP platelets along the (100) surface. Researches were carried out to study the effects of HAP thickness and density on the mechanical properties of collagen–HAP interfaces,3,4 directional deformation response of collagen along HAP faces,5 and adsorption of collagen-mimic tri-peptides on HAP faces.6 Salivary statherin, a biomineralization protein, possesses high affinity for HAP by its highly anionic N-terminus. By NMR technique and simulation tools, the adsorbed groups of statherin and motif recognition on HAP surfaces were investigated.7,8 In addition, amino acids were found to greatly influence the morphology and properties of HAP crystals.9,10 The amino acid-functionalised HAP had small crystal size and higher protein adsorptive capacity than unmodified HAP.10 The adsorption and binding sites of glycine and glutamic acid on HAP faces were studied with different amino acid coverage; glutamic acid preferred to adsorb strongly on HAP (001) face.9 HAP coated with extracellular matrix proteins such as cell adhesion proteins and growth factors have great potential in clinical applications as a third generation biomaterial. Besides collagen, fibronectin and bone morphogenetic proteins (BMP-2, BMP-7) are used to promote proliferation and differentiation of osteogenic cells.11,12 The adsorption mechanism of BMP-2, BMP-713,14 and fibronectin domain15 with different initial orientations on HAP surfaces were investigated by simulation tools. The study of BMP-7 on different HAP surface textures showed that positively charged HAP (100) face induced the largest conformational change than other faces, leading to protein denaturation.13 The efficiency of protein and cell immobilisation on HAP was closely related to the protein property,16 the surface charge,17 and surface texture.18,19
Fibronectin (FN) is known to regulate cell adhesion, growth, differentiation or survival of osteoblasts and support osteogenic cell responses in vitro. It plays an important role in the osteoconduction stage of osseointegration.20 Modules III9-10 of FN correspond to the cell-binding domain. Module III10 contains the RGD (Arg-Gly-Asp) sequence that is known for preferentially binding with integrins on cytomembrane. Module III9 includes the synergy site, PHSRN sequence, which greatly enhances the binding of certain integrins to the neighboring RGD sequence. Immobilisation of FN or RGD-containing domains on scaffolds is expected to enhance the osteoblast adhesions through integrin-mediated mechanisms.20,21 Thus, one key issue is to regulate the orientation of adsorbed protein with the RGD motif exposed to solvent without denaturing the protein.21,22 Related studies showed that the orientation of FN modules is greatly affected by the electrostatic properties of surface.23–25
The surface studied here is the (001) face of HAP with calcium vacancies. The (001) face is much more stable than the (100) face proven by simulation calculations.26,27 Related study showed that the hierarchical micro-nanohybrid surfaces of HAP, which have the (001) face as the dominant plane, showed significant promotion for protein adsorption and cell proliferation in comparison with the traditional flat and dense sample.26 Adsorption of FN module III10 on smooth HAP (001) faces were studied by molecular simulations.15 However, little attention has been paid to the effect of defective HAP surface on the adsorption of FN modules, which would be important because the surface topology may modify the biological activity of protein related to subsequent cell adhesion.27,28 Experimentally, vacancies of cationic sites are found in HAP deficient in calcium. The calcium vacancies were studied with metal sorption and substitution.29,30 From an atomic scale, the cationic vacancies of defective HAP surfaces showed the capacity to hold charged group of protein/amino acid and support certain motif recognition.8,9
In present study, the adsorption and orientation of the 10th and 7–10th type III modules of fibronectin (FN-III10, FN-III7–10) on defective HAP (001) surfaces are investigated, respectively. The simulation hypothesis is given as follows. When a protein adsorbs onto a surface, it is widely accepted that conformational change induced by surface is much slower than orientation change on surface,31,32 suggesting that protein initially translates and rotates to adsorb with preferred orientation before the following conformational change to occur. Therefore, in simulations of protein adsorption, it is proposed to firstly determine most probable orientation of adsorbed proteins on surfaces before subsequent molecular dynamics (MD) simulations are carried out to investigate in detail the adsorption-induced conformational change of proteins.33–37 In our previous works, the preferred orientations of proteins, each with a dipole moment, were successfully studied based on a residue-based protein–surface interaction potential model by Monte Carlo (MC) and parallel tempering Monte Carlo (PTMC) simulations.38–41 Protein adsorption is quite computationally challenging because of its complexity and rugged energy landscape. The PTMC algorithm with united-residue model,38 can greatly reduce the degree of freedom of the protein–surface system and help rapidly search for the preferred orientation of adsorbed proteins through configuration space sampling techniques.42
Here, the adsorption mechanism of FN-III10 and FN-III7–10 on defective HAP (001) surfaces are investigated with a combination of PTMC and MD methods. The PTMC algorithm is used to fast identify the most probable orientation of an adsorbed protein with a dipole moment, and a residue-based protein–surface interaction potential model has been developed. With the preferred orientation obtained, the adsorption mechanisms of proteins on HAP surface are investigated by all-atom explicit-water MD simulations. The adsorption energy, distance, orientation and conformation terms, and adsorption affinities including the adsorption groups on Ca-deficient HAP surface were analysed in detail. Our study carried out a helpful methodology to predict the protein orientation on charged biomaterials and provide insights on fibronectin adsorption on defective HAP surfaces with different binding affinities.
2. Methods
2.1 Proteins
The crystal structures of FN-III10 and FN-III7–10 are taken from the Protein Data Bank. The physiological condition was selected to determine the protonation state of each amino acid. The protein PDB code, number of residues, molecular weight, dipole moment, and net charge of each protein are listed in Table 12.2 HAP surface
The hexagonal HAP crystal unit cell was generated by using Material Studio 4.4 (Accelrys, Inc.), which features the following lattice parameters: a = b = 0.9423 nm, c = 0.6883 nm, α = 90°, β = 90° and γ = 120°.43 The defective HAP (001) surface is cut with half the Ca(1) ions presented in the upper and lower interface17 (see Fig. S1a in ESI†). Non-bonded parameters for HAP were derived from Hauptmann's model,44 which is fitted into Lennard-Jones potential45 and used here. The VDW potential is expressed in Lennard-Jones function with the combination rule for different atom types:
 | (1-1) |
 | (1-2) |
The HAP force field parameters and evaluation are presented in ESI (S1†).
2.3 Lennard-Jones potential fitting and PTMC method
The PTMC method is used to fast determine the most probable orientation of the adsorbed proteins and provide initial preferred orientation for MD simulations. For proteins, a united-residue model38 has been adopted, where each amino acid is reduced to an interaction site centered at the α-carbon atom of the residue, so that the essential structure information of a protein is well kept. The protein structure is assumed rigid, since we assume the orientation change before adsorption is much faster than conformational change induced by surfaces. HAP surface is treated as a reduced model represented by electrostatic and VDW interactions.To obtain short-range VDW interactions between each amino acid residue and HAP surface, we first perform all-atom MD simulations of 20 amino acids on HAP (001) surface in vacuum. The simulations were performed with GROMACS 4.5.3 software46 using OPLS force field.47 The HAP slab contains 3 × 4 × 2 HAP crystal units. The residue was put initially 0.9 nm above the surface in a periodic box of 2.83 × 3.26 × 5.0 nm3. LINCS algorithm48 is used for bond constraint. Particle Mesh Ewald (PME) method was employed to calculate the long-range electrostatic interactions.49 Cutoff distance of 1.1 nm is adopted for short-range non-bonded forces. The simulations were carried out with a time step of 1 fs in NVT ensemble. Modified Berendsen thermostat (V-rescale)50 was used for temperature coupling. After energy minimisation, 4 ns MD was carried out for equilibration. After the residue reaches an adsorption equilibrium state, each residue was moved away from or toward the surface from its optimal position with the optimal orientation fixed and the VDW interaction between each residue and the surface was calculated at each distance (see Fig. 1). Thus, the VDW energy–distance curve was obtained and fitted with the empirical equation38 below,
 | (2) |
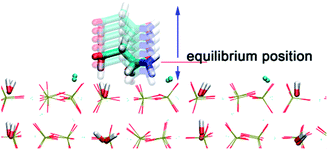 | ||
| Fig. 1 Illustration of a series of aspartic acid configurations above and below the equilibrium position on HAP (001). | ||
| Residue | ε/(kJ mol−1) | σ/Å | δ/Å |
|---|---|---|---|
| Ala | 35.3 | 3.91 | 1.56 |
| Arg | 58.9 | 4.24 | 2.32 |
| Asn | 58.5 | 4.35 | 2.18 |
| Asp | 59.2 | 3.91 | 2.22 |
| Cys | 37.5 | 4.46 | 2.14 |
| Gln | 52.3 | 3.82 | 1.97 |
| Glu | 69.8 | 3.99 | 1.45 |
| Gly | 33.9 | 4.09 | 1.97 |
| His | 69.3 | 4.30 | 2.38 |
| Ile | 33.8 | 4.44 | 2.61 |
| Leu | 60.6 | 4.22 | 2.29 |
| Lys | 64.3 | 4.36 | 2.08 |
| Met | 60.1 | 4.16 | 2.85 |
| Phe | 70.2 | 4.15 | 2.25 |
| Pro | 43.4 | 4.21 | 2.23 |
| Ser | 43.7 | 4.37 | 2.46 |
| Thr | 40.7 | 4.18 | 1.82 |
| Trp | 80.6 | 4.50 | 3.13 |
| Tyr | 72.8 | 4.18 | 1.69 |
| Val | 54.0 | 4.43 | 2.86 |
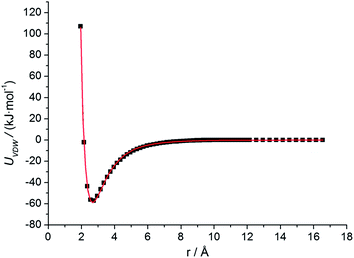 | ||
| Fig. 2 Residue–surface VDW interaction potential for arginine on HAP (001). Results calculated from all-atom MD simulation are represented by dots, while the fitting empirical equation (eqn (1)) is represented by curve. | ||
Implicit solvent was applied to the coarse-grained system. The solvent is represented as a continuous medium instead of individual “explicit” solvent molecules. The effect of solvent is accounted by a distance-dependant dielectric function:51
 | (3) |
![[thin space (1/6-em)]](https://www.rsc.org/images/entities/char_2009.gif) :
:![[thin space (1/6-em)]](https://www.rsc.org/images/entities/char_2009.gif) 1 salt, I is the ionic strength; ε0 is the permittivity of free space and εr is the relative permittivity which is assumed to be distance-dependant: εr = r.51
1 salt, I is the ionic strength; ε0 is the permittivity of free space and εr is the relative permittivity which is assumed to be distance-dependant: εr = r.51
The PTMC method was developed in our previous work.40 The general idea of PTMC is to simulate N replicas of the same system at a set of different temperatures and randomly exchange the complete configuration of two adjacent replicas at regular interval with the probability:
| p(Ei, Ti → Ei+1, Ti+1) = min(1, exp(ΔβΔE)). | (4) |
 is the difference between the inverse temperatures of neighboring replicas, and ΔE = Ei+1 − Ei is the energy difference of neighboring replicas.
In each replica, regular MC simulations in canonical ensemble were carried out in a box of 10 × 10 × 10 nm3 for FNIII10 system and 30 × 30 × 30 nm3 for FNIII7–10 system. Protein was initially put in the center of the simulation box with random orientation. During simulations, the protein was translated and rotated around its center of mass. For each system, we used five replicas. 310 K is the temperature of interest. Replicas of neighboring temperatures attempt exchange every 500 steps. The temperature distribution is adjusted to ensure sufficient energy overlap between neighboring replicas. Generally, an acceptance of 0.5 for configuration swaps is reasonable. The overlap of energy distribution and the repeatability of PTMC method are shown in ESI (S2†). 40![[thin space (1/6-em)]](https://www.rsc.org/images/entities/char_2009.gif) 000
000![[thin space (1/6-em)]](https://www.rsc.org/images/entities/char_2009.gif) 000 MC cycles were carried out with 20
000 MC cycles were carried out with 20![[thin space (1/6-em)]](https://www.rsc.org/images/entities/char_2009.gif) 000
000![[thin space (1/6-em)]](https://www.rsc.org/images/entities/char_2009.gif) 000 cycles for equilibration and another 20
000 cycles for equilibration and another 20![[thin space (1/6-em)]](https://www.rsc.org/images/entities/char_2009.gif) 000
000![[thin space (1/6-em)]](https://www.rsc.org/images/entities/char_2009.gif) 000 cycles for production. According to the HAP charge densities obtained in experiments52–55 and explored in simulations,6,13,15,17,56 the preferred orientations of proteins on different charged surfaces (−0.025, −0.005, 0.025, and 0.008 C m−2) under different ionic strengths (IS = 0.005, 0.02, 0.154, and 0.3 M) were explored.
000 cycles for production. According to the HAP charge densities obtained in experiments52–55 and explored in simulations,6,13,15,17,56 the preferred orientations of proteins on different charged surfaces (−0.025, −0.005, 0.025, and 0.008 C m−2) under different ionic strengths (IS = 0.005, 0.02, 0.154, and 0.3 M) were explored.
2.4 MD simulation details
MD simulations were performed with GROMACS 4.5.3 software46 using OPLS force field.47 The HAP slab size is 6.60 × 6.52 × 2.06 nm3 for FN-III10 and 8.48 × 16.32 × 2.06 nm3 for FN-III7–10. A periodic box was solvated with explicit SPC/E water.57 Fourteen Na+ ions were added as counterions to neutralize the FN-III7–10 system. The FN-III10 system contains 28![[thin space (1/6-em)]](https://www.rsc.org/images/entities/char_2009.gif) 501 atoms and 6569 water molecules. The FN-III7–10 system contains 107
501 atoms and 6569 water molecules. The FN-III7–10 system contains 107![[thin space (1/6-em)]](https://www.rsc.org/images/entities/char_2009.gif) 203 atoms and 25
203 atoms and 25![[thin space (1/6-em)]](https://www.rsc.org/images/entities/char_2009.gif) 951 water molecules. LINCS algorithm48 is used for bond constraint. Particle Mesh Ewald (PME) method was employed to calculate the long-range electrostatic interactions.49 Cutoff distance of 1.1 nm is adopted for short-range non-bonded forces. The initial adsorption orientation was chosen from the preferred orientation on weakly positively charged surface obtained by PTMC method.40 The simulations were carried out with a time step of 1 fs in NVT ensemble. Modified Berendsen thermostat (V-rescale)50 was used for temperature coupling. After energy minimisation (steepest descent algorithm), and 500 ps pre-equilibration with protein position restrained in NVT ensemble, 100 ns and 50 ns MD were carried out to collect data for FN-III10 and FN-III7–10 systems, respectively.
951 water molecules. LINCS algorithm48 is used for bond constraint. Particle Mesh Ewald (PME) method was employed to calculate the long-range electrostatic interactions.49 Cutoff distance of 1.1 nm is adopted for short-range non-bonded forces. The initial adsorption orientation was chosen from the preferred orientation on weakly positively charged surface obtained by PTMC method.40 The simulations were carried out with a time step of 1 fs in NVT ensemble. Modified Berendsen thermostat (V-rescale)50 was used for temperature coupling. After energy minimisation (steepest descent algorithm), and 500 ps pre-equilibration with protein position restrained in NVT ensemble, 100 ns and 50 ns MD were carried out to collect data for FN-III10 and FN-III7–10 systems, respectively.
3. Results and discussion
3.1 Initial orientation exploration
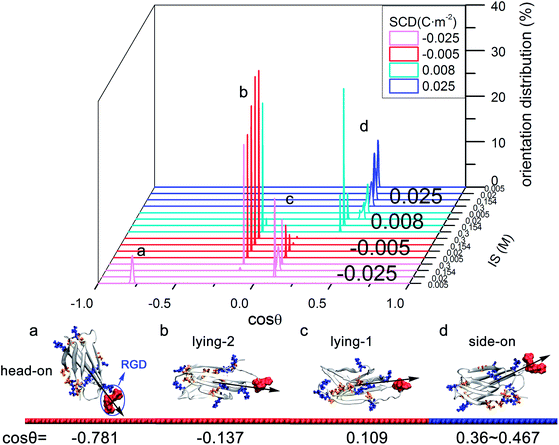
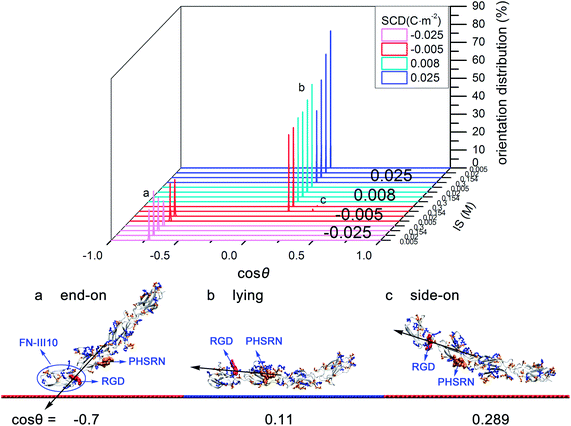
The initial orientations of FN-III10 and FN-III7–10 with dipole moments on charged surfaces are explored at different ionic strengths. Orientation angle (θ) is used to quantitatively characterize the orientation of adsorbed proteins on surfaces. It is defined as the angle between the unit normal vector to the surface and the unit vector along the dipole of a protein.38,40,41 cos![[thin space (1/6-em)]](https://www.rsc.org/images/entities/char_2009.gif) θ is calculated for each possible orientation. The preferred orientations of adsorbed proteins on different charged surfaces are shown in Fig. 1 and 2. To provide a detailed picture of protein adsorption, we converted coarse-grained models back to fine-grained representations by Gromacs.41,46 The energy terms and detailed information for those orientations are listed in ESI (S3†).
θ is calculated for each possible orientation. The preferred orientations of adsorbed proteins on different charged surfaces are shown in Fig. 1 and 2. To provide a detailed picture of protein adsorption, we converted coarse-grained models back to fine-grained representations by Gromacs.41,46 The energy terms and detailed information for those orientations are listed in ESI (S3†).
On moderately negatively charged surface, driven by dominant electrostatic interactions (see Table S3 in ESI†), FN-III10 tends to adsorb with “head-on” orientation (cos![[thin space (1/6-em)]](https://www.rsc.org/images/entities/char_2009.gif) θ = −0.781), which has the RGD sequence head on HAP. As IS rises, owing to the screening effect of ions from solution, the protein–surface electrostatic interactions decrease and contribute less to the adsorption (see Table S3 in ESI†). As a result, the favorable orientations change to “lying-1” (cos
θ = −0.781), which has the RGD sequence head on HAP. As IS rises, owing to the screening effect of ions from solution, the protein–surface electrostatic interactions decrease and contribute less to the adsorption (see Table S3 in ESI†). As a result, the favorable orientations change to “lying-1” (cos![[thin space (1/6-em)]](https://www.rsc.org/images/entities/char_2009.gif) θ = 0.109) and “lying-2” (cos
θ = 0.109) and “lying-2” (cos![[thin space (1/6-em)]](https://www.rsc.org/images/entities/char_2009.gif) θ = −0.137). These two orientations have upside-down configurations with the RGD more accessible. When on weakly negatively charged surfaces, the “lying-1” (cos
θ = −0.137). These two orientations have upside-down configurations with the RGD more accessible. When on weakly negatively charged surfaces, the “lying-1” (cos![[thin space (1/6-em)]](https://www.rsc.org/images/entities/char_2009.gif) θ = 0.109) and “lying-2” (cos
θ = 0.109) and “lying-2” (cos![[thin space (1/6-em)]](https://www.rsc.org/images/entities/char_2009.gif) θ = −0.137) orientations are still favorable.
θ = −0.137) orientations are still favorable.
On moderately positively charged surface, driven by dominant electrostatic interactions, FN-III10 prefers to adsorb with “side-on” orientation (cos![[thin space (1/6-em)]](https://www.rsc.org/images/entities/char_2009.gif) θ = 0.436), which has the RGD sequence exposed to solution. As IS becomes higher, the screening effect on electrostatic interactions is more obvious (see Table S3 in ESI†), the preferred “side-on” orientation tilts slightly with cos
θ = 0.436), which has the RGD sequence exposed to solution. As IS becomes higher, the screening effect on electrostatic interactions is more obvious (see Table S3 in ESI†), the preferred “side-on” orientation tilts slightly with cos![[thin space (1/6-em)]](https://www.rsc.org/images/entities/char_2009.gif) θ from 0.436 to 0.467. Similarly, on the weakly positively charged surface, higher IS brings in the increasing screening effect to the protein–surface electrostatic interactions. As a result, the preferred “side-on” orientation adjusts slightly with cos
θ from 0.436 to 0.467. Similarly, on the weakly positively charged surface, higher IS brings in the increasing screening effect to the protein–surface electrostatic interactions. As a result, the preferred “side-on” orientation adjusts slightly with cos![[thin space (1/6-em)]](https://www.rsc.org/images/entities/char_2009.gif) θ from 0.467 to 0.36 (see Fig. S6 in ESI†), then changes to “lying-2” (cos
θ from 0.467 to 0.36 (see Fig. S6 in ESI†), then changes to “lying-2” (cos![[thin space (1/6-em)]](https://www.rsc.org/images/entities/char_2009.gif) θ = −0.137).
θ = −0.137).
In the initial orientation exploration of FN-III10, positively charged HAP surfaces are found to be beneficial for FN-III10 to adsorb with “side-on” orientation (cos![[thin space (1/6-em)]](https://www.rsc.org/images/entities/char_2009.gif) θ = 0.436), which is well suited for cell binding site availability. High IS could change the orientation. The RGD motif of FN-III10 is more accessible on weakly negatively charged surfaces than it on stronger negatively charged surfaces. Findings by Ting25 suggest a positively charged implant surface with a FN coating will enhance the strength of the cutaneous seal around percutaneous devices.
θ = 0.436), which is well suited for cell binding site availability. High IS could change the orientation. The RGD motif of FN-III10 is more accessible on weakly negatively charged surfaces than it on stronger negatively charged surfaces. Findings by Ting25 suggest a positively charged implant surface with a FN coating will enhance the strength of the cutaneous seal around percutaneous devices.
On moderately negatively charged surface, driven by VDW interactions and attractive electrostatic interactions (see Table S4 in ESI†), it tends to adsorb with “end-on” orientation (cos![[thin space (1/6-em)]](https://www.rsc.org/images/entities/char_2009.gif) θ = −0.701). FN-III10, the end of FN-III7–10, acts as the contact domain with the RGD motif hard to access (see Fig. 4a). On weakly negatively charged surface, as IS increases from low to high, VDW interactions play the dominant role and weak electrostatic interactions alter from attractive to repulsive (see Table S4 in ESI†). Accordingly, preferred orientation changes to “lying” orientation (cos
θ = −0.701). FN-III10, the end of FN-III7–10, acts as the contact domain with the RGD motif hard to access (see Fig. 4a). On weakly negatively charged surface, as IS increases from low to high, VDW interactions play the dominant role and weak electrostatic interactions alter from attractive to repulsive (see Table S4 in ESI†). Accordingly, preferred orientation changes to “lying” orientation (cos![[thin space (1/6-em)]](https://www.rsc.org/images/entities/char_2009.gif) θ = 0.11) and a small percentage of “side-on” orientation (cos
θ = 0.11) and a small percentage of “side-on” orientation (cos![[thin space (1/6-em)]](https://www.rsc.org/images/entities/char_2009.gif) θ = 0.289). With “lying” orientation, FN-III7–10 may have the “synergy site”, PHSRN sequence, more accessible than with “side-on” orientation (see Fig. 4c).
θ = 0.289). With “lying” orientation, FN-III7–10 may have the “synergy site”, PHSRN sequence, more accessible than with “side-on” orientation (see Fig. 4c).
On positively charged surfaces, driven by attractive electrostatic and VDW interactions (see Table S4 in ESI†), FN-III7–10 tends to adsorb with “lying” orientation (cos![[thin space (1/6-em)]](https://www.rsc.org/images/entities/char_2009.gif) θ = 0.11), which has the RGD motif exposed to the solution and PHSRN site accessible. Increasing IS weakens the electrostatic interactions, but does not change the favorable orientation.
θ = 0.11), which has the RGD motif exposed to the solution and PHSRN site accessible. Increasing IS weakens the electrostatic interactions, but does not change the favorable orientation.
From the exploration of FN-III7–10 initial orientations, positively charged HAP surfaces are found helpful for FN-III7–10 to adsorb with “lying” orientation (cos![[thin space (1/6-em)]](https://www.rsc.org/images/entities/char_2009.gif) θ = 0.11), which exposes the RGD motif in the solution and has the PHSRN site accessible. However, negatively charged surfaces are not so favorable, except for weakly charged surfaces under high IS. In other relevant studies, orientations of FN-III7–10 on different charged self-assembled monolayers (SAMs) was investigated by Wilson et al.23 In their work, FN-III7–10 adsorbed with RGD upwards to solvent on both positively charged NH3+–SAM and neutral hydrophobic CH3–SAM surface while with RGD inaccessible on negatively COO−–SAM, which agree well with the results in this work. Also, FN-III7–10 orientations on NH2/COOH–SAM were studied by surface plasma resonance (SPR).24 Wang et al. found that adsorbed FN-III7–10 on positively NH2–SAM had an orientation with more cell-binding domains accessible than on negatively COOH–SAM.24 It is worth noting that the PTMC method saves a lot of computational efforts in finding the optimised initial orientation than the conventional MD method.
θ = 0.11), which exposes the RGD motif in the solution and has the PHSRN site accessible. However, negatively charged surfaces are not so favorable, except for weakly charged surfaces under high IS. In other relevant studies, orientations of FN-III7–10 on different charged self-assembled monolayers (SAMs) was investigated by Wilson et al.23 In their work, FN-III7–10 adsorbed with RGD upwards to solvent on both positively charged NH3+–SAM and neutral hydrophobic CH3–SAM surface while with RGD inaccessible on negatively COO−–SAM, which agree well with the results in this work. Also, FN-III7–10 orientations on NH2/COOH–SAM were studied by surface plasma resonance (SPR).24 Wang et al. found that adsorbed FN-III7–10 on positively NH2–SAM had an orientation with more cell-binding domains accessible than on negatively COOH–SAM.24 It is worth noting that the PTMC method saves a lot of computational efforts in finding the optimised initial orientation than the conventional MD method.
3.2 Adsorption process
The “side-on” orientation (Fig. 3d) for FN-III10 and “lying” orientation (Fig. 4b) for FN-III7–10 serve as the initial orientations in MD simulations. In addition, other initial orientation (as in Fig. 3b) has been tested to verify the validity of our PTMC method. In 5 ns MD, FN-III10 with improper initial orientation rotates significantly with RGD sequence from downward to upward (see Fig. S7 in ESI†). The adsorption process of FN-III10 and FN-III7–10 were investigated by all-atom MD simulations with explicit water model. The adsorption energy, distance, orientation and conformation terms, and adsorption affinities including the adsorption groups were analysed in detail. The energy terms are used to describe the interactions between proteins and surface, or residues and surface. Backbone root mean-square deviation (RMSD) is used to characterize the conformational changes of adsorbed protein with the crystal structure as the reference structure. Orientation of adsorbed proteins on surfaces is quantitatively characterised by cos![[thin space (1/6-em)]](https://www.rsc.org/images/entities/char_2009.gif) θ described in PTMC.38,40,41 Distance terms also are taken into account to study the adsorption behavior. The distance between the center of mass (COM) position of protein and HAP along z-axis direction or the minimum protein–HAP distance indicates the protein–surface closeness and reflects adsorption strength. Furthermore, residues close to HAP surface are labeled. Since FN-III10 and FN-III7–10 are quite different in size and structure (FN-III10 has one domain, while FN-III7–10 consists of four domains), the discussion for two proteins was carried out respectively with different emphases.
θ described in PTMC.38,40,41 Distance terms also are taken into account to study the adsorption behavior. The distance between the center of mass (COM) position of protein and HAP along z-axis direction or the minimum protein–HAP distance indicates the protein–surface closeness and reflects adsorption strength. Furthermore, residues close to HAP surface are labeled. Since FN-III10 and FN-III7–10 are quite different in size and structure (FN-III10 has one domain, while FN-III7–10 consists of four domains), the discussion for two proteins was carried out respectively with different emphases.
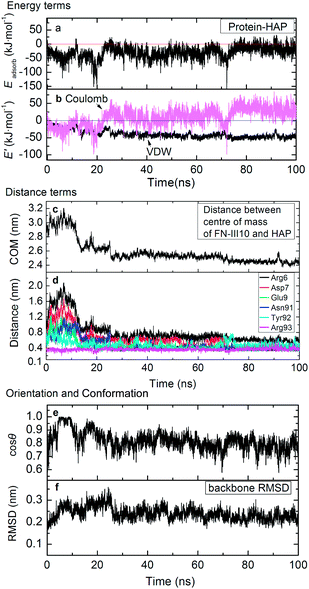
Pre-adsorption. Pre-adsorption starts from the beginning to around 20 ns. During this stage, it goes through steps from the initial state (Fig. 5a) to the steering step (Fig. 5b), then to the adsorbed state (Fig. 5c). As shown in Fig. 6a and b, the adsorption of FN-III10 on HAP surface was first driven by Coulombic interactions. From the MD trajectory, FN-III10 gets close to the HAP surface first by residue Arg93. The Coulombic attraction between the positively charged Arg93 and the negatively charged triad of three phosphate groups (Ca(1) vacancy) on HAP surface drive FN-III10 to get near to the surface (see Fig. 5b). When the Coulombic interactions reach about −90 kJ mol−1, Arg93–HAP distance was as small as 0.2 nm. At around 20 ns, the protein–surface interactions reach the minimum of −151 kJ mol−1 (see Fig. 6a). Gradually, other residues adsorb on the surface (see Fig. 5c).
Post-adsorption. As other residues adsorb on HAP surface, FN-III10 goes to the post-adsorption stage, which experiences from around 20 ns (see Fig. 5c) to 100 ns (see Fig. 5d). At the post-adsorption, the Coulombic interactions between FN-III10 and HAP decline and exhibit repulsion effect. The repulsion effect of Coulombic interactions is due to the mismatching of the polar groups of FN-III10 on the alternative positively and negatively charged regions of HAP surface. After FN-III10 adsorbs on HAP surface, we found that it keeps making slight translation on HAP surface during the adsorption. The VDW interactions keep increasing slowly and become the dominant driving force. Compared with the pre-adsorption stage, the post-adsorption stage is characterised by diminished protein–HAP interactions as a result of dominant VDW interactions plus Coulombic repulsion. The simulation time is extended to 100 ns to confirm the adsorption stability.58 The water effect and surface electrostatic effect are supplemented and shown in Fig. S8 and S9 in ESI.† Experimentally, to improve the protein tethering on surface, FN-III9-10 is immobilised onto the bioscaffold by means of affinity binding between osteocalcin and HAP.59
Distance terms between protein and surface are shown in Fig. 6c and d. The distance between COM of FN-III10 and HAP keeps descending then remains at a low position. Accordingly, the repulsion effects of Coulombic interactions become more obvious. The residues close to HAP surface within 0.6 nm are labeled in Fig. 5d, i.e., Arg6, Asp7, Glu9, Asn91, Tyr92, and Arg93. As shown in Fig. 6d, these residues tend to get closer and more compact to HAP surface during adsorption. Arg93 gets the advantage to be close to surface or sometimes even closer during the adsorption. The average lowest residue position locates about 0.35 nm above the surface.
Orientation and conformation. When FN-III10 experiences the pre-adsorption and post-adsorption stages, the orientation and structure of FN-III10 exhibit different features. When driven by Coulombic interactions at pre-adsorption stage, FN-III10 tilts upward so that the orientation angle (θ) is sharply reduced and cos
![[thin space (1/6-em)]](https://www.rsc.org/images/entities/char_2009.gif) θ rises to 1.0 (see Fig. 3b and 4e). As the other residues gradually adsorb on the surface, cos
θ rises to 1.0 (see Fig. 3b and 4e). As the other residues gradually adsorb on the surface, cos![[thin space (1/6-em)]](https://www.rsc.org/images/entities/char_2009.gif) θ falls back and stay at around 0.8 during the post-adsorption stage (see Fig. 6e). The RGD sequence of FN-III10 stays exposed to solvent during the adsorption process (see Fig. 5d). Greatly affected by the local residue–HAP interactions at the pre-adsorption stage, FN-III10 undergoes continuous conformational change and the backbone RMSD exceeds 0.30 nm (see Fig. 6f). At post-adsorption stage, under diminished protein–HAP interactions, FN-III10 goes through smaller conformational changes and RMSD stays around 0.22 nm (see Fig. 6f). The conformational change (RMSD: 0.22 nm) is presented through the superposition of the adsorbed structure on the crystal structure in Fig. 5e. The structural change of an adsorbed protein depends not only on the surrounding factors (surface and solvent), but also on the internal protein stability (soft or hard protein).60 The studied HAP surface is charged and hydrophilic. The structural change of FN-III10 mainly happens at its coil parts (or loops). The beta-sheets formed in ordered hydrogen bonding pattern are stable and regular; while the random coil (or loops) regions are highly dynamic with no specific shape.60 The RGD sequence is located at the head of a flexible loop. In a study of fibronectin type I module on a hydrophobic graphite surface, rearrangements of the strands took place at the contact surface so as to maximize the surface coverage.61 Study of FN-III10 adsorbed on perfect and three defective rutile TiO2 (110) surfaces showed that bonding strength and the loss of protein secondary structure depended on the topology of the substrate surface.27
θ falls back and stay at around 0.8 during the post-adsorption stage (see Fig. 6e). The RGD sequence of FN-III10 stays exposed to solvent during the adsorption process (see Fig. 5d). Greatly affected by the local residue–HAP interactions at the pre-adsorption stage, FN-III10 undergoes continuous conformational change and the backbone RMSD exceeds 0.30 nm (see Fig. 6f). At post-adsorption stage, under diminished protein–HAP interactions, FN-III10 goes through smaller conformational changes and RMSD stays around 0.22 nm (see Fig. 6f). The conformational change (RMSD: 0.22 nm) is presented through the superposition of the adsorbed structure on the crystal structure in Fig. 5e. The structural change of an adsorbed protein depends not only on the surrounding factors (surface and solvent), but also on the internal protein stability (soft or hard protein).60 The studied HAP surface is charged and hydrophilic. The structural change of FN-III10 mainly happens at its coil parts (or loops). The beta-sheets formed in ordered hydrogen bonding pattern are stable and regular; while the random coil (or loops) regions are highly dynamic with no specific shape.60 The RGD sequence is located at the head of a flexible loop. In a study of fibronectin type I module on a hydrophobic graphite surface, rearrangements of the strands took place at the contact surface so as to maximize the surface coverage.61 Study of FN-III10 adsorbed on perfect and three defective rutile TiO2 (110) surfaces showed that bonding strength and the loss of protein secondary structure depended on the topology of the substrate surface.27The adsorption of FN-III10 was first driven by Coulombic interactions at the pre-adsorption stage. At post-adsorption stage, the driving force alters from Coulombic to VDW interactions due to the mismatching of the polar groups of FN-III10 on the alternative charged HAP surface. The conformational changes of adsorbed FN-III10 mainly take place at its coil/loop parts.
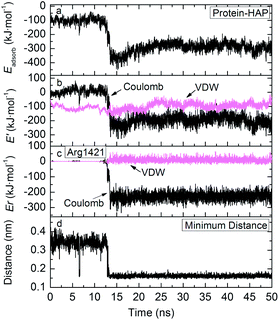 | ||
| Fig. 8 Time evolution of adsorption energy, electrostatic and VDW potential energies, residue–surface interactions of Arg1421 residue, minimum protein–HAP distance. | ||
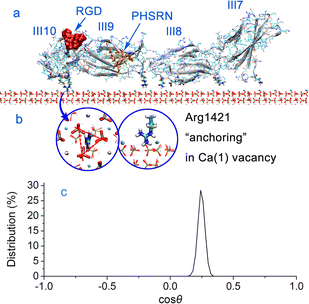
Contributions to adsorption. According to the energy curves in Fig. 8a and b, FN-III7–10 undergoes two stages from weak adsorption to strong adsorption. In the first 12 ns, FN-III7–10 adsorbs and translates on HAP surface with average adsorption energy of −100 kJ mol−1. At this stage, the adsorption is driven by VDW interactions. After 12 ns, the Coulombic interactions alter from repulsion to strong attraction and become the dominant driving force, leading to strong FN-III7–10 adsorption. This transition is due to the trapping of basic residue, Arg1421, into the Ca(1) vacancy (Fig. 7b). In experimental studies, the Ca vacancy is associated with substitution of charge-compensating metal ions.29,30 The cationic groups is “highly complementary” to the anionic Ca(1) vacancy in HAP (001) plane. Once adsorbed into the vacancy, Arg1421 forms hydrogen bonds with surrounding phosphate groups; 1–2 hydrogen bonds are formed with minimum distance ∼0.16 nm. Time evolution of hydrogen bonds formed between FN-III7–10 and HAP surface is shown in Fig. S10 in ESI.† The guanidine group of arginine acts like an anchor that breaks through surrounding waters and sticks firmly into the HAP surface. The anchor-like interactions contribute greatly to the adsorption of FN-III7–10.
Adsorbed groups and distance. The residues of FN-III7–10 close to HAP surface are mainly residues Gly1184, Gln1186, Asp1279, Asn1296, Glu1312, Gln1313, Arg1421, Asp1422, and Glu1424 etc. During the adsorption, some residues may approach the surface and some move away. The most firmly adsorbed residue is Arg1421. As shown in Fig. 8c, residue Arg1421 exhibits significantly dominant electrostatic contributions, over −250 kJ mol−1. The minimum FN-III7–10–HAP distance in Fig. 8d show that FN-III7–10 stays 0.35 nm above HAP surface when VDW interactions make the main contribution to adsorption. After Coulombic interactions take charge of the adsorption, FN-III7–10 stays 0.16 nm away from the surrounding phosphate groups on HAP surface.
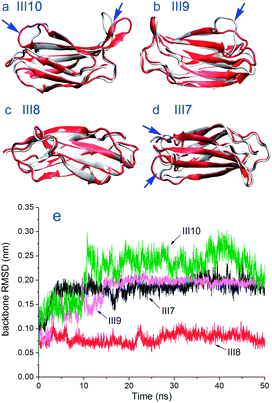
Conformation of modules. During the adsorption, different modules of FN-III7–10 undergo different conformational changes. The conformational changes for modules III7–10 are presented through the superposition of the adsorbed structure on the crystal structure in Fig. 9a–d. Time evolutions of backbone RMSD for modules III7–10 are shown in Fig. 9e. Module III10 which contains the integrin binding sequence experiences the largest conformational change (see Fig. 9e). When VDW interactions make the main contribution, it undergoes small RMSD of around 0.14 nm. After Coulombic interactions become the dominant driving force, the backbone RMSD of module III10 increases to an average value around 0.24 nm. The main structural change take place at the loop parts exposed to solvent including where RGD sequence locates instead of the parts near surface (see Fig. 9a). Next to module III10, module III9 makes smaller change than module III10. Conformational change takes place and reaches an average RMSD value around 0.20 nm. The superposition of module III9 on crystal structure in Fig. 9b shows that except the loops near module III10 side (right side), the rest part including the beta-sheets are well kept. Adjacent to module III9, module III8 exhibits the smallest structural change all through the simulation, with RMSD around 0.08 nm, more stable than the other modules. As shown in Fig. 9c, most of module III8 structure, both beta-sheets and loops, remain well. The backbone RMSD of module III7 reaches an average value of 0.19 nm sooner than the other modules. The loops of module III7 near module III8 and surface side (left side) exhibit higher structural change (Fig. 9d). The adsorption-induced conformational changes in FN-III7–10 on CH3–, OH–, NH2–, and COOH–SAMs were studied by Garcia and coworkers.62 They found the adsorption-induced changes in protein structure are not simply modulated by the hydrophobicity of the surface.
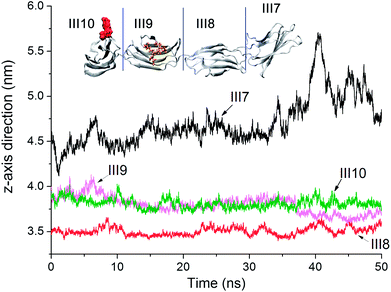
Center of mass movements. Time evolutions of the distance between COM of modules and HAP along z-axis direction for modules III7–10 are shown in Fig. 10. Modules III7–10 are shown on upper Fig. 10. Since these modules are linked by single residues, the head and end modules like III7 and III10 may move under the tethering by neighboring modules. Module III7 which has the COM at the highest location at the beginning is affected most greatly by surrounding water molecules. Under weak interactions from HAP surface, module III7 involves in the competition with water for adsorption on HAP surface (see Fig. S11 in ESI†). As a result, the COM along z-axis direction for modules III7 lifts up gradually then falls, which becomes the most unstable factor against FN-III7–10 adsorption. Moreover, module III7 has the amide residues like Asn1183, Gln1185 as the contact residues on the HAP surface, which are not easy to lead to strong residue–HAP adsorption. The COM of modules III9 and 10 are quite similar. Module III8, as the closest domain to HAP surface, keeps the lowest center of mass and remains stable.
4. Conclusions
In this study, the orientation and adsorption mechanism of FN-III10 and FN-III7–10 on defective HAP (001) surface were studied by a combination of PTMC and MD methods. The PTMC algorithm with coarse-grained model is used to fast identify the most probable orientation of adsorbed proteins on charged surfaces. With the preferred orientation obtained, the atomistic adsorption mechanisms of proteins on HAP surface are further investigated by MD simulations. The PTMC results show that positively charged surface at low IS is beneficial for FN-III10 and FN-III7–10 to adsorb with RGD accessible in solution, i.e., FN-III10 adsorbs with “side-on” orientation and FN-III7–10 adsorbs with “lying” orientation.In the adsorption process, both FN-III10 and FN-III7–10 adsorb on HAP surface. The adsorption of FN-III10 was first driven by Coulombic interactions at pre-adsorption stage. At post-adsorption stage, the driving force alters from Coulombic to VDW interactions. FN-III10 gets closer to HAP surface, and undergoes smaller conformational change than it at pre-adsorption stage. The structural change of adsorbed FN-III10 mainly happens at its coil parts (or loops), while the seven beta-strands arranged in two sheets are well kept. The repulsion effect of Coulombic interactions is due to the mismatching of the polar groups of protein on the alternative charged surface, which causes FN-III10 to translate on surface. The charged region mismatching plays a negative effect on FN-III10 adsorption.
FN-III7–10 undergoes two stages from weak adsorption to strong adsorption when the Coulombic interactions become the dominant driving force. The transition is greatly determined by the anchoring of basic residue in the Ca(1) vacancy, the significant complementary electrostatic interactions and hydrogen bonds formed between the guanidine group and the surrounding phosphate groups. During the adsorption process, different modules of FN-III7–10 undergo different conformational changes and center of mass movements. Module III10 exhibits largest conformational change and contributes to the adsorption most. Module III7 which has the COM at the highest location is affected most greatly by surrounding water molecules. With the anchor-like interactions, FN-III7–10 is tethered on defective HAP surface. The affinity of guanidine group binding suggests that vacancies on biomaterials get the capacity to trap specific residues.
Acknowledgements
This work is supported by the National Key Basic Research Program of China (no. 2013CB733500), National Natural Science Foundation of China (nos 21376089, 91334202), State Key Laboratory of Materials-Oriented Chemical Engineering (KL12-05), the Fundamental Research Funds for the Central Universities (SCUT-2013ZM0073) and the Doctoral Fund for Promoting Scientific Research from Guangdong Pharmaceutical University (no. 52104109). The computational resources for this project are provided by SCUTGrid at South China University of Technology.References
- A. El-Ghannam, Expert Rev. Med. Devices, 2005, 2, 87–101 CrossRef PubMed.
- A. Kodama, S. Bauer, A. Komatsu, H. Asoh, S. Ono and P. Schmuki, Acta Biomater., 2009, 5, 2322–2330 CrossRef CAS PubMed.
- Z. Qin, A. Gautieri, A. Nair, H. Inbar and M. J. Buehler, Langmuir, 2012, 28, 1982–1992 CrossRef CAS PubMed.
- A. K. Nair, A. Gautieri, S.-W. Chang and M. J. Buehler, Nat. Commun., 2013, 4, 1724 CrossRef PubMed.
- D. R. Katti, S. M. Pradhan and K. S. Katti, J. Biomech., 2010, 43, 1723–1730 CrossRef PubMed.
- N. Almora-Barrios and N. H. de Leeuw, Langmuir, 2010, 26, 14535–14542 CrossRef CAS PubMed.
- J. M. Gibson, J. M. Popham, V. Raghunathan, P. S. Stayton and G. P. Drobny, J. Am. Chem. Soc., 2006, 128, 5364–5370 CrossRef CAS PubMed.
- D. L. Masica and J. J. Gray, Biophys. J., 2009, 96, 3082–3091 CrossRef CAS PubMed.
- H. Pan, J. Tao, X. Xu and R. Tang, Langmuir, 2007, 23, 8972–8981 CrossRef CAS PubMed.
- W. H. Lee, C. Y. Loo, A. V. Zavgorodniy and R. Rohanizadeh, J. Biomed. Mater. Res., Part A, 2013, 101, 873–883 CrossRef PubMed.
- S. Samavedi, A. R. Whittington and A. S. Goldstein, Acta Biomater., 2013, 9, 8037–8045 CrossRef CAS PubMed.
- W. Xiao, H. Fu, M. N. Rahaman, Y. Liu and B. S. Bal, Acta Biomater., 2013, 9, 8374–8383 CrossRef CAS PubMed.
- X.-L. Dong, H.-L. Zhou, T. Wu and Q. Wang, J. Phys. Chem. B, 2008, 112, 4751–4759 CrossRef CAS PubMed.
- X. L. Dong, W. Qi, W. Tao, L. Y. Ma and C. X. Fu, Mol. Simul., 2011, 37, 1097–1104 CrossRef CAS.
- J. W. Shen, T. Wu, Q. Wang and H. H. Pan, Biomaterials, 2008, 29, 513–532 CrossRef CAS PubMed.
- A. Oyane, T. Ootsuka, K. Hayama, Y. Sogo and A. Ito, Acta Biomater., 2011, 7, 2969–2976 CrossRef CAS PubMed.
- D. Zahn and O. Hochrein, Phys. Chem. Chem. Phys., 2003, 5, 4004–4007 RSC.
- N. Eliaz, S. Shmueli, I. Shur, D. Benayahu, D. Aronov and G. Rosenman, Acta Biomater., 2009, 5, 3178–3191 CrossRef CAS PubMed.
- M. Corno, A. Rimola, V. Bolis and P. Ugliengo, Phys. Chem. Chem. Phys., 2010, 12, 6309–6329 RSC.
- T. A. Petrie, C. D. Reyes, K. L. Burns and A. J. Garcia, J. Cell. Mol. Med., 2009, 13, 2602–2612 CrossRef PubMed.
- L. Liu, C. Qin, W. T. Butler, B. D. Ratner and S. Jiang, J. Biomed. Mater. Res., Part A, 2007, 80, 102–110 CrossRef PubMed.
- A. J. Zhang, Y. Xie and J. Zhou, Prog. Chem., 2009, 21, 1408–1417 CAS.
- K. Wilson, S. J. Stuart, A. Garcia and R. A. Latour, Jr, J. Biomed. Mater. Res., Part A, 2004, 69, 686–698 CrossRef PubMed.
- H. Wang, Y. He, B. D. Ratner and S. Y. Jiang, J. Biomed. Mater. Res., Part A, 2006, 77, 672–678 CrossRef PubMed.
- C. M. Ting, Master's thesis, Worcester Polytechnic Institute, 2011.
- K. Lin, L. Xia, J. Gan, Z. Zhang, H. Chen, X. Jiang and J. Chang, ACS Appl. Mater. Interfaces, 2013, 5, 8008–8017 CAS.
- C. Y. Wu, M. J. Chen and C. Xing, Langmuir, 2010, 26, 15972–15981 CrossRef CAS PubMed.
- K. Vallières, P. Chevallier, C. Sarra-Bournet, S. Turgeon and G. Laroche, Langmuir, 2007, 23, 9745–9751 CrossRef PubMed.
- K. Matsunaga, H. Murata, T. Mizoguchi and A. Nakahira, Acta Biomater., 2010, 6, 2289–2293 CrossRef CAS PubMed.
- J. Jeanjean, S. McGrellis, J. C. Rouchaud, M. Fedoroff, A. Rondeau, S. Perocheau and A. Dubis, J. Solid State Chem., 1996, 126, 195–201 CrossRef CAS.
- M. Agashe, V. Raut, S. J. Stuart and R. A. Latour, Langmuir, 2005, 21, 1103–1117 CrossRef CAS PubMed.
- J. J. Gray, Curr. Opin. Struct. Biol., 2004, 14, 110–115 CrossRef CAS PubMed.
- X. Yu, Q. Wang, Y. Lin, J. Zhao, C. Zhao and J. Zheng, Langmuir, 2012, 28, 6595–6605 CrossRef CAS PubMed.
- Y. Sun, W. J. Welsh and R. A. Latour, Langmuir, 2005, 21, 5616–5626 CrossRef CAS PubMed.
- J. Zhou, J. Zheng and S. Y. Jiang, J. Phys. Chem. B, 2004, 108, 17418–17424 CrossRef CAS.
- Y. Xie, M. Liu and J. Zhou, Appl. Surf. Sci., 2012, 258, 8153–8159 CrossRef CAS.
- Y. Xie, C. Liao and J. Zhou, Biophys. Chem., 2013, 179, 26–34 CrossRef CAS PubMed.
- J. Zhou, S. Chen and S. Jiang, Langmuir, 2003, 19, 3472–3478 CrossRef CAS.
- J. Zhou, H. K. Tsao, Y. J. Sheng and S. Y. Jiang, J. Chem. Phys., 2004, 121, 1050–1057 CrossRef CAS PubMed.
- Y. Xie, J. Zhou and S. Y. Jiang, J. Chem. Phys., 2010, 132, 065101 CrossRef PubMed.
- J. Liu, C. Liao and J. Zhou, Langmuir, 2013, 29, 11366–11374 CrossRef CAS PubMed.
- D. J. Earl and M. W. Deem, Phys. Chem. Chem. Phys., 2005, 7, 3910–3916 RSC.
- R. M. Wilson, J. C. Elliott and S. E. P. Dowker, Am. Mineral., 1999, 84, 1406–1414 CAS.
- S. Hauptmann, H. Dufner, J. Brickmann, S. M. Kast and R. S. Berry, Phys. Chem. Chem. Phys., 2003, 5, 635–639 RSC.
- R. Bhowmik, K. S. Katti and D. Katti, Polymer, 2007, 48, 664–674 CrossRef CAS.
- D. van der Spoel, E. Lindahl, B. Hess, A. R. van Buuren, E. Apol, P. J. Meulenhoff, D. P. Tieleman, A. L. T. M. Sijbers, K. A. Feenstra, R. van Drunen and H. J. C. Berendsen, Gromacs User Manual version 4.5, 2010, E-mail: http://www.gromacs.org Search PubMed.
- G. A. Kaminski, R. A. Friesner, J. Tirado-Rives and W. L. Jorgensen, J. Phys. Chem. B, 2001, 105, 6474–6487 CrossRef CAS.
- B. Hess, H. Bekker, H. J. C. Berendsen and J. G. E. M. Fraaije, J. Comput. Chem., 1997, 18, 1463–1472 CrossRef CAS.
- T. Darden, D. York and L. Pedersen, J. Chem. Phys., 1993, 98, 10089 CrossRef CAS.
- G. Bussi, D. Donadio and M. Parrinello, J. Chem. Phys., 2007, 126, 014101 CrossRef PubMed.
- H.-K. Tsao, J. Colloid Interface Sci., 1998, 202, 527–540 CrossRef CAS.
- J. Vandiver, D. Dean, N. Patel, W. Bonfield and C. Ortiz, Biomaterials, 2005, 26, 271–283 CrossRef CAS PubMed.
- S. Itoh, S. Nakamura, T. Kobayashi, K. Shinomiya and K. Yamashita, Calcified Tissue Int., 2006, 78, 133–142 CrossRef CAS PubMed.
- S. Nakamura, H. Takeda and K. Yamashita, J. Appl. Phys., 2001, 89, 5386–5392 CrossRef CAS.
- D. Aronov, A. Karlov and G. Rosenman, J. Eur. Ceram. Soc., 2007, 27, 4181–4186 CrossRef CAS.
- M. R. T. Filgueiras, D. Mkhonto and N. H. de Leeuw, J. Cryst. Growth, 2006, 294, 60–68 CrossRef CAS.
- H. J. C. Berendsen, J. R. Grigera and T. P. Straatsma, J. Phys. Chem., 1987, 91, 6269–6271 CrossRef CAS.
- T. Wei, M. A. Carignano and I. Szleifer, Langmuir, 2011, 27, 12074–12081 CrossRef CAS PubMed.
- J. H. Lee, J.-H. Park, Y.-R. Yun, J.-H. Jang, E.-J. Lee, W. Chrzanowski, I. B. Wall and H.-W. Kim, J. Mater. Chem. B, 2013, 1, 2731–2741 RSC.
- M. Malmsten, J. Colloid Interface Sci., 1998, 207, 186–199 CrossRef CAS PubMed.
- G. Raffaini and F. Ganazzoli, Langmuir, 2004, 20, 3371–3378 CrossRef CAS PubMed.
- K. E. Michael, V. N. Vernekar, B. G. Keselowsky, J. C. Meredith, R. A. Latour and A. J. Garcia, Langmuir, 2003, 19, 8033–8040 CrossRef CAS.
Footnote |
| † Electronic supplementary information (ESI) available. See DOI: 10.1039/c3ra47381c |
| This journal is © The Royal Society of Chemistry 2014 |

