Experimental design and optimisation (4): Plackett–Burman designs
Analytical Methods Committee, AMCTB No 55
First published on 11th March 2013
Abstract
Good experimental design is important in many studies of analytical and other chemical processes. Complete factorial designs, which study all the factors (experimental variables) affecting the system response, using at least two levels (values) for each factor, can give rise to an unacceptably large number of trial experiments. This is because even apparently simple processes may be affected by a large number of factors. Moreover these factors may affect the system response interactively, i.e. the effect of one factor may depend on the levels of others. Any interactions must also be distinguished from random measurement errors. So it is more common to use partial factorial designs in which some information, especially about interactions, may be sacrificed in the interests of a manageable number of experiments.
Plackett–Burman fundamentals
A popular and economical approach that gives information only on the effects of single factors, but not on interactions, is the Plackett–Burman (PB) method, introduced in 1946 when the authors were working for the British Ministry of Supply. This method is well suited to ruggedness testing, i.e. establishing whether the outcome of an analytical procedure is affected by changes in each relevant factor. The most important feature of PB designs is that they all involve 4n experiments, where n = 1, 2, 3… In each case the maximum number of factors that can be studied is 4n − 1, so an 8-experiment PB design can study no more than 7 factors, a 12-experiment design will handle up to 11 factors, and so on. This may seem to be inconvenient, but it turns out to be a valuable feature of the method.Suppose we wish to study four factors. Four experiments will be then insufficient, so we shall have to use eight experiments in a PB design, and have seven factors. This means that three of the latter will be dummy factors; they will have no chemical meaning at all. However it turns out that the apparent effects of these dummy factors can be used to estimate the random measurement errors (see below). The more dummy factors there are, the better the estimate of such errors, so it is not uncommon for experimenters to use a larger PB design than is strictly necessary, thus getting higher quality information on the significance of each “real” factor.

PB designs utilise two levels for each factor, the higher level being denoted “+” and the lower “−” as usual. A further feature of the PB method is that the + and − signs for the individual trial experiments are assigned in a cyclical manner. If we utilise eight experiments with seven factors labelled A–G, the levels for the first experiment might be:
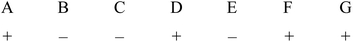
Such sequences of + and − signs are provided by generating vectors and are widely available in the literature and in software packages. The levels for the second experiment, again with four + and three − signs, are then obtained by moving the last sign for the first experiment to the beginning of the line, giving:
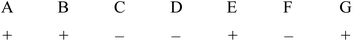
This cyclical process is repeated for the first seven experiments. For the eighth experiment all the factors are set at the low (−) level, giving an overall design in which there are 28 + signs and 28 − signs, each factor having been studied four times at the higher level and four times at the lower. The effect of each factor is then readily determined from the expression:
| 2[∑(y+) − ∑(y−)]/N |
where N is the total number of experiments, eight in this case. The (y+) terms are the responses when a given factor is at its high level, and the (y−) terms reflect the responses for that factor set to its low level. It can be shown that the effects for the main factors determined in this way are not confounded with each other (see AMCTB 36).
An example
In this example the experimental output y is the fluorescence intensity (arbitrary units) of a single sample material, measured using four different spectrometer excitation and emission spectral bandwidths and wavelengths, factors A–D. We need an 8-experiment PB design, so there are three dummy factors, labelled d1, d2, and d3, included alternately in Table 1.| EXPERIMENT | FACTORS | Result y | ||||||
|---|---|---|---|---|---|---|---|---|
| A | d1 | B | d2 | C | d3 | D | ||
| 1 | + | − | − | + | − | + | + | 10 |
| 2 | + | + | − | − | + | − | + | 9 |
| 3 | + | + | + | − | − | + | − | 10 |
| 4 | − | + | + | + | − | − | + | 9 |
| 5 | + | − | + | + | + | − | − | 8 |
| 6 | − | + | − | + | + | + | − | 7 |
| 7 | − | − | + | − | + | + | + | 7 |
| 8 | − | − | − | − | − | − | − | 7 |
![[thin space (1/6-em)]](https://www.rsc.org/images/entities/char_2009.gif) |
||||||||
| Effect | +1.75 | +0.75 | +0.25 | +0.25 | −1.25 | +0.25 | +0.75 | * |
| SS | 6.125 | 1.125 | 0.125 | 0.125 | 3.125 | 0.125 | 1.125 | * |
| F-value | 13.4 | * | 0.3 | * | 6.8 | * | 2.5 | * |
From these results we can see that, for example, the effect of factor A is 0.25(10 + 9 + 10 + 8 − 9 − 7 − 7 − 7) = +1.75. Similarly it can be shown that the effects of B, C, and D are +0.25, −1.25 and +0.75 respectively. Clearly a negative effect, as obtained here with factor C, means that moving that factor from a high to low value increases the system response (fluorescence intensity in this case) rather than decreasing it. The effects of the dummy factors d1, d2 and d3, are found by the same method to be +0.75, +0.25, and +0.25 respectively.
How significant is each factor?
Simple ANOVA-related calculations will enable us to assess the significance of the “real” factors. For each factor the sum of squares (SS) in a two-level design is given by:| SS = N × (estimated effect)2/4 |
The sums of squares for A, B, C, and D are thus 6.125, 0.125, 3.125, and 1.125 respectively. Each of these sums of squares has just one degree of freedom, so their mean square values (i.e., variances) are the same as the SS ones. The sums of squares for the dummy factors d1, d2, and d3 are similarly found to be 1.125, 0.125, and 0.125 respectively. The mean sum of squares for these estimates of the random measurement errors is thus 0.458: this has three degrees of freedom as there are three dummy variables. Each of the individual factors A–D can now be compared with this estimated random error using a one-tailed F-test at the p = 0.05 significance level. So for factor A the value of F is 6.125/0.458 = 13.37. The critical value of F1,3 at p = 0.05 is 10.13, so we can conclude that the effect of changing the level of factor A is significant. The same approach shows that factors B, C and D seem to have no significant effect. Such calculations are in practice performed using suitable software such as Minitab®, so once the trial experiments are complete the conclusions can be drawn at once.
Plackett–Burman in action
PB designs have been used in an enormous variety of chemical and biochemical studies, synthetic as well as analytical. Spectroscopy, electrochemistry and chromatography have all proved to be fertile fields for their application in measurement science. In practice, designs with 12 and 20 runs seem to have been most popular. This may be because PB designs where 4n is a power of 2 [i.e. n = 2, 4, 8 etc.] are exactly equivalent to some other fractional factorial designs, so PB methods confer no advantage. Moreover performing (for example) 12 experiments rather than 8 will provide extra dummy factors, hence better estimates of the measurement error and of the possible significance of the real factors. The potential for further applications of PB designs is clear, especially in the development of new or improved analytical methods. Evolutionary methods such as simplex optimisation can be used to find the best combination of factor levels, but when an optimum set of conditions has been found in this way we still need to know whether the analytical results are unduly sensitive to small changes in any of the factors.However, the popularity of PB methods comes with a significant health warning. PB designs are ideal for screening purposes in systems where it is desired to identify a few main factors affecting the outcome, and where interactions are not significant. Theory shows that while the main factors in a PB design are not confounded, there is strong confounding between the main factors and any two-factor interactions that may arise. So if there are significant interactions, PB methods could provide misleading results. In recent years much attention has been given to diagnostic approaches for revealing interactions in PB designs. These are beyond the scope of this paper; but it is worth noting that if dummy factors seem to have unexpectedly high effect values, this might be a sign that interactions are indeed present.
This Technical Brief, drafted by J.N. Miller, was prepared for the Analytical Methods Committee by the Statistical Subcommittee.

| This journal is © The Royal Society of Chemistry 2013 |