
A separation-free paper-based hydrogel device for one-step reactive oxygen species determination by a smartphone†
Jie
Chu‡
bc,
Yiyi
Zhang‡
a,
Jingwen
Li‡
bc,
Jun
Hong
 a,
Lin
Sun
*a and
Jianshe
Wei
*bc
a,
Lin
Sun
*a and
Jianshe
Wei
*bc
aHenan Key Laboratory of Polyoxometalate Chemistry, College of Chemistry and Molecular Sciences, Henan University, Kaifeng, Henan 475004, China. E-mail: sunlin@vip.henu.edu.cn
bSchool of Life Sciences, Henan University, Kaifeng, Henan 475004, China. E-mail: jswei@henu.edu.cn
cSchool of Physical Education and Sport, Henan University, Kaifeng, Henan 475004, China
First published on 17th June 2024
Abstract
Paper-based analytical devices (PADs) are very convenient for determining biomarkers in point-of-care (POC) diagnosis while requiring sample pre-treatment or impurity separation. This study reports a novel hydrogel-coupled, paper-based analytical device (PAD) for separation-free H2O2 colorimetric detection in both aqueous solution and cell lysis with sample-to-answer analysis by directly loading into the sample test zone. By encapsulating an inorganic mimic enzyme and chromogenic substrate into the sodium alginate (SA) hydrogel, amplification of the color signal after catalyzing the substrate could be achieved. Taking advantage of the nanoscale porous structure of the hydrogel and the lateral flow channel of the PAD, large interference fragments or bio-macromolecules are prevented from diffusing into the chromogenic reaction, whereas the small target molecules enter the sensing region to trigger the catalytic reaction. This method demonstrated a rapid and accurate analysis with a limit of detection as low as 0.06 mM and detection selectivity. Our proposed device requires no enzyme and is separation-free, portable, easy-to-fabricate, and low-cost, and may offer a platform for quantitative or qualitative analysis of other analytes in body fluids for POC applications.
 Lin Sun | Dr Lin Sun joined Henan University as an Associate Professor in the College of Chemistry and Molecular Sciences in 2018. Dr Sun finished her PhD degree at Northwest University. Dr Sun is interested in developing novel nanomaterials (coordination complexes and nanocomposites) to treat wastewater and for biomolecule recognition. Her research areas include the construction of functional materials, antibacterial assessment and biosensors. She has published more than 40 SCI papers in Chemical Engineering Journal, Journal of Colloid and Interface Science, Journal of Materials Chemistry C, Inorganic Chemistry, etc. She has approved 6 natural science funds. |
1 Introduction
For scenarios that need immediate diagnostic results, point-of-care (POC) testing plays an important role in the rapid diagnosis of diseases or the target analyte concentration determination.1–3 According to the signal readout model, different detection methods have been reported such as colorimetric, fluorescence-based, electrochemical, and surface-enhanced Raman spectroscopy-based methods.4–7 Wang's group developed a Fenton-like reactiontriggered chemical redox-cycling signal amplification fluorescence strategy for ultrasensitive determination.8–10 Zhang's group developed a hand-drawing paper-based bipolar electrode (BPE) electrochemiluminescence (ECL) platform for detection via employing a highly active electrocatalytic material as an ECL co-reaction accelerator and pencil-drawing graphite electric circuits as wires and electrodes.11 And an efficient lab-on-paper dual-signal platform was designed for detection in body fluids.12 The widely utilized methods exhibit considerable analytical performance in the POC research field. Among them, colorimetric assays display results by changing the color intensity or chrominance that could offer a visual indication for the target analyte, including its concentration and species.13,14 By integrating with other analytical devices such as microfluidics, test strips, and paper-based microfluidics, its easy handling and simple quantitative analysis procedure was intensified for rapid diagnosis with user-friendly signal readout devices such as smartphones.15–20 However, analytes used for POC testing are taken from human tissues, because the oral cavity or nasal cavity, or food samples with bulk segments would strongly interfere with the chromogenic reaction and cover up the result display.21–25 Prior separation of samples by using a centrifuge or magnetic adsorption separation in professional diagnostic labs is generally required, which would limit the efficiency of POC sensing with rapid features. Thus, developing POC test sensors that combine separation functions to overcome these challenges is in high demand, especially during a pandemic.Colorimetric paper-based analytical devices (PADs) show potential properties such as easy fabrication, operability, low cost, portability, and disposability, and have been widely used as universal and robust diagnostic tools in various fields.26,27 Because of the paper substance with diameters <20 μm, it can filter almost all shed tissue fragments, coagula, or agglomerates in biological samples.28 However, this method is not capable of avoiding impurity interference with smaller sizes, such as red blood cells, hemoglobin, leukocytes, and other biological molecules.29,30 Much effort has been made to facilitate the efficient separation process by integrating a filtration module onto the paper-based analytical device (PAD), such as filter membranes, cell aggregation, or external fields (electric or magnetic fields) to avoid interference in PADs.31–33
However, complex operation processes, low separation efficiency, and low filtration throughout the multistep separation process may hamper the simplicity and low cost of PADs. Accordingly, PADs coupled with hydrogel matrixes were developed to make the separation process more efficient.34–36 Taking advantage of its “molecular sieves” functions and optical transparency property, the formed hydrogel allows small analyte molecules to pass through freely to trigger a chromogenic reaction in the test zone and prevents large-size molecules or cells of complex components from entering.37 However, most reported hydrogel-coupled PADs employ a bio-enzyme as the catalyst, which causes a complex fabrication process of PADs, and the assay performance of PADs severely depends on the stability of the enzyme.38–40 Thus, it is highly necessary to develop no-enzyme-used, portable, low-cost, and user-friendly PADs for disease-related biomarkers in biological samples or whole blood.
Herein, we introduce a simple hydrogel-coupled PAD-based sensor that can directly determine small-molecule targets in liquid suspension samples without any additional separation process. Considering the fact that a sample usually includes tissue fragments, biological macromolecules, and smaller targets,41 we introduced a step-by-step filtration method that uses the size-sieving effect of an alginate hydrogel to prevent interfering substances from entering the sensing region. This work combined the chromatography effect and molecular sieve of the hydrogel, featuring the property of being separation-free for complex biological samples. Specifically, the proposed PADs contained three layers: the cover layer was made of polyvinyl chloride (PVC) with single-sided adhesive tape, and two circular hole disks were punched on. The sample layer was composed of fiberglass and adsorbent paper, which provided support for hydrogel loading and primary filtration. The supporting layer was the same as the cover layer without a circular hole disk. An alginate hydrogel containing an inorganic enzyme and chromogenic substance reagent matrix was cast onto the hole disk and assembled on the sample pad to construct a detection device. To verify the detection performance, the oxidative stress signal small-molecule H2O2 was selected to demonstrate its feasibility. The color signal generated in the test zone in the PADs was recorded by a smartphone, which showed the rapid sample-to-answer feature of the proposed method (Scheme 1). The use of hydrogel-coupled PADs for H2O2 detection in complex samples showed portability, high sensitivity, stability, and reproducibility. Moreover, the proposed hydrogel PAD not only has potential applicability for broad application in POCT in biological samples but also shows value for rapid testing in food and environmental fields.
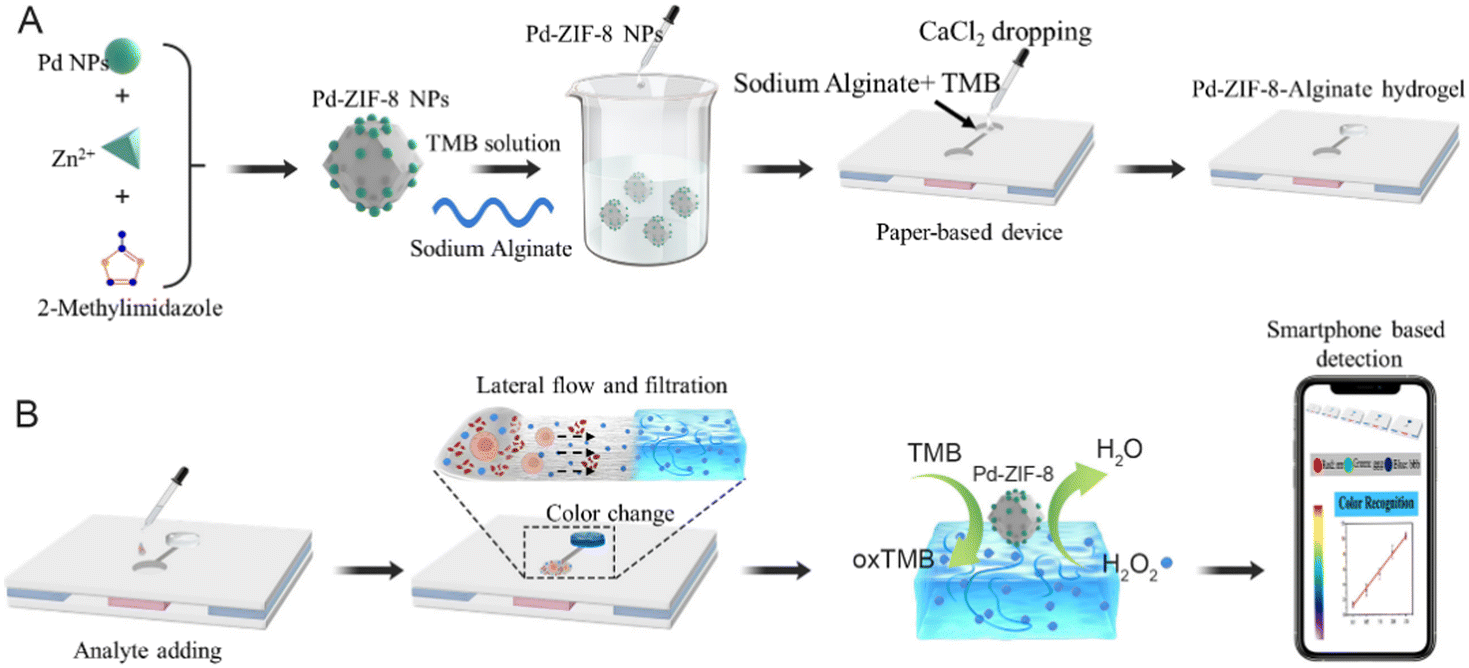 | ||
| Scheme 1 Schematic illustration of PAD hydrogel-based separation-free device for H2O2 detection by a smartphone. | ||
2 Experimental
2.1 Reagents
Zinc acetate dihydrate (Zn(AC)2·2H2O), 3,3′,5,5′-tetramethylbenzidine (TMB), NaCl, KCl, Na2SO4, CaCl2, AgNO3, KBr, CaCO3, and other salts were obtained from Aladdin Reagent Co. Ltd (Shanghai, China). Sodium alginate (SA), methanol, and 2-methylimidazole were purchased from TCI Shanghai. Polyvinylpyrrolidone PVP (Mw = 58![[thin space (1/6-em)]](https://www.rsc.org/images/entities/char_2009.gif) 000), K2PdCl4, and HCl were purchased from Sigma Aldrich (Shanghai, China). Stock solutions of HCl (2 M) were prepared in deionized water. All reagents were used as received without any further purification. All solutions were prepared using ultrapure water generated using a Millipore Milli-Q water purification system with an electric resistance of ≥18.2 MΩ.
000), K2PdCl4, and HCl were purchased from Sigma Aldrich (Shanghai, China). Stock solutions of HCl (2 M) were prepared in deionized water. All reagents were used as received without any further purification. All solutions were prepared using ultrapure water generated using a Millipore Milli-Q water purification system with an electric resistance of ≥18.2 MΩ.
2.2 Instruments
The UV-Vis spectrum of prepared materials was recorded on a Shimadzu-1700 spectrophotometer (Shimadzu, Japan). Infrared spectra were measured using infrared (IR) spectrometry (FTIR spectrometer, V70 & Hyperion1000). The morphology was characterized using a scanning electron microscope (ZEISS G500, Germany) and a transmission electron microscope (FEI T20). The size and zeta potential were measured using a laser particle size and zeta potential analyzer (Nano ZS90, Malvern).2.3 Synthesis of ZIF-8, Pd NPs and Pd-ZIF-8 NPs
The synthesis of ZIF-8 was synthesized according to the previously reported work with minimal modification.42 The 20 mL methanol solutions of 0.55 g of Zn(Ac)2·2H2O and 0.72 g of 2-methylimidazole were prepared separately. The Zn(Ac)2·2H2O methanol solution was slowly added to the 2-methylimidazole methanol solution, and the mixture was magnetically stirred at 700 rpm. The solution was maintained for at least 3 h and it turned into a stationary state with a milky appearance. The resulting solution was then centrifuged for 5 min at 5000 rpm, which resulted in the precipitation of ZIF-8 nanoparticles (ZIF-8 NPs). The upper clear solution was poured and discarded, whereas the precipitate was re-dissolved in methanol and centrifuged. These steps were repeated more than twice. The obtained ZIF-8 NPs were then dissolved in water, and the above centrifugation procedure was repeated. Finally, the solid product was dried overnight in the vacuum drying oven at 30 °C.Pd NPs were prepared according to the previously reported method.43 Typically, 105 mg of PVP (Mw = 58000) was dissolved in 8 mL of pure water following the addition of AA (60 mg), KBr (5 mg), and KCl (185 mg). The mixture was magnetically stirred at room temperature for approximately 5 min. Then, 1.5 mL of K2PdCl4 aqueous solution with a concentration of 10 mM was added to the mixture. The mixture turned black brown after the solution was maintained at 80 °C for three hours. The resulting Pd NPs were collected by centrifugation at 10000 rpm by adding excess acetone. The obtained Pd NPs were dispersed in deionized water for future use.
To prepare Pd-ZIF-8 NPs, 1.0 mL Pd NPs were firstly added to a 2-methyl imidazole methanol solution under magnetic stirring for 5 min, followed by dropwise addition of methanol solution of Zn(AC)2·2H2O. The mixed solution was maintained at room temperature for 3 h. Finally, the obtained Pd-ZIF-8 NPs were purified by centrifugation at 5000 rpm and washed thrice with water and methanol.
2.4 Preparation of the Pd-ZIF-8 loaded alginate hydrogel
Pd-ZIF-8 NP alginate hydrogel was prepared as follows: 0.1 mL Pd-ZIF-8 NP dispersion solution (0.5 mg mL−1) was mixed with 0.15 mL 1.5 wt% SA aqueous solution. Next, 50 μL of a TMB (10 mM) aqueous solution was added and mixed evenly. 0.05 mL of CaCl2 aqueous solution (20 mM) was quickly injected into the above mixture system. Free Ca2+ triggers SA hydrogelation resulting in a hydrogel morphology. After incubation for 5 min, excess aqueous solution was removed and the obtained hydrogel was washed with deionized water three times. The blank control preparation method was similar to that described above, and it was prepared without adding 0.1 mL Pd-ZIF-8 NP dispersion solution.The process of preparing hydrogels in 96-well plates is similar to that described above. 0.1 mL Pd NP-ZIF-8 dispersion solution (0.5 mg mL−1) was mixed with 0.15 mL 1.5 wt% SA aqueous solution. Next, 50 μL TMB (10 mM) aqueous solution was added to it and mixed evenly. Next, 10 μL of the mixture was added to 96-well plates. Finally, 25 μL CaCl2 solution (20 mM) was quickly injected into the mixture in one well. After incubation for 5 min, the excess aqueous solution was removed, and the obtained hydrogel was washed with deionized water thrice.
2.5 Design and fabrication of PADs
The design procedure for the PAD is illustrated in Fig. S11 (ESI†). The proposed PAD contained three layers of components: first, a single-sided rubber substrate of the PVC material (2.0 cm × 2.5 cm) with the rubber side up. In the second step, the absorption pad (filter paper) (0.5 cm × 2.0 cm) was pasted horizontally onto the PVC single-sided rubber bottom plate. Then, the glass fiber paper (0.5 cm × 2.0 cm) was vertically pasted to the middle of the PVC single-sided rubber base plate. The third step was to paste two absorption pads (filter paper) (0.4 cm × 2.0 cm) on both sides of the fiberglass paper. In the fourth step, a piece of PVC material single-sided rubber substrate was taken, and two holes were punched in it. The diameter of the hole was 0.6 cm, and the center distance between the two holes was about 1.0 cm. Finally, the perforated single-sided adhesive substrate and assembled single-sided adhesive substrate were bonded together to form the preliminary shape of the PAD for the subsequent loading of the hydrogels.2.6 Preparation of hydrogel coupled PADs
SA mixed aqueous solution was prepared according to the procedure described in Section 2.4. The hydrogel-coupled PAD was prepared by in situ gelation of a hole in the designed paper device. Typically, 80 μL of the above mixture was dripped into one of the holes. Subsequently, the SA solution overspreads to all zones of the hole and forms a teardrop-shaped drop. Then, 50 μL of CaCl2 solution with a concentration of 100 mM was carefully dropped onto the viscous SA solution. After gelation for 2 min, the excess CaCl2 solution was removed to avoid infiltration of the sample pad.2.7 Colorimetric analysis for H2O2 in aqueous solution
The hydrogels loaded in 96 wells prepared by the process described in Section 2.4 were added to 50 μL (0, 0.125, 0.15, 0.35, 0.55, 0.75, 0.95, and 1.15 mM) H2O2, respectively for colorimetric analysis. After incubation for 30 min, the OD value was continuously acquired using a Tecan Infinite M1000 PRO reader. The intensities were calculated from a region of interest and plotted as a function of time.In addition to using PAD coupled with a good hydrogel to detect H2O2 content in aqueous solution, we tried different volumes of H2O2 aqueous solution (same concentration), namely, 50, 80, 100, 150, and 200 μL. Subsequently, H2O2 drops were added to the PAD analysis hole to select a more appropriate volume. Next, 100 μL of H2O2 (0, 0.1, 0.5, 1.5, 2.0, and 2.5 mM) was added to the sample zone, and the H2O2 aqueous solution was passed through the sample pad under capillary force and finally reached the hydrogel spot. After incubation for 30 min, the color change of the hydrogel spot in the test zone was recorded using a smartphone. (When taking photos, the hole plate was placed in the LED photographic lightbox to prevent errors in the results caused by different lights.) The smartphone used was an iPhone, and the Colorimeter App was downloaded from the App Store (https://apps.apple.com/fr/app/colorimeter-app/id1542365656). This software can convert the depth of the color to RGB number size, and the color is calculated using the formula (green channel + blue channel)/2 (red channel).
2.8 Measurements of H2O2 in cell lysis
The colorimetric response of the PAD for H2O2 analysis in cancer cell lysis was carried out as follows: HeLa cells at different numbers were seeded in 60 mm plates and incubated in a 5% CO2 environment at 37 °C. The cells were then digested with pancreatin and washed three times with PBS. Cells were ultrasonically broken at 100 W using a cell crusher. Subsequently, 200 μL of cell-crushing liquid was added to the centrifuge tube, and H2O2 aqueous solutions with different concentrations were added to the centrifuge tube. When the concentrations of H2O2 became 0.08 mM, 0.158 mM, 0.37 mM, 0.65 mM, and 1.3 mM, a cell-crushing solution (100 μL) was added to the PAD detection hole and incubated for 30 min. The chromogenic intensity of the hydrogel spot in the test zone was recorded using a smartphone.In addition, we selected several common disruptors in biological samples to evaluate the selectivity of the PAD for H2O2 detection, including glucose, sucrose, bovine albumin (BSA), human serum albumin (HSA), NaCl, vitamin C, trypsin, and glycine. A certain concentration of the above disturbance was added to the detection hole of the PAD, and the detection scheme was the same as that used for detecting H2O2. Similarly, a smartphone was used to record the color changes in the analysis area.
Subsequently, we used CaCO3 to simulate impurities in biological samples to evaluate the anti-interference ability of the PADs on solid bulk impurities. A 50 μg mL−1 CaCO3 aqueous solution was placed in a centrifuge tube, and a certain volume of H2O2 solution was added so that the final concentration of H2O2 was 0.1 mM. Then, 100 μL of the CaCO3 mixed solution was added to the analysis hole of the PAD and incubated for 30 min. The chromogenic intensity of the hydrogel spot on the test zone was recorded using a smartphone. This experiment was repeated six times to evaluate the stability of the PAD test.
2.9 Long-term stability inspection
Long-term detection stability is very important for PAD, which is related to its detection stability and long-term preservation and transportation. This has strong practical application significance. First, the prepared PAD was placed in a refrigerator at 4 °C to maintain a certain humidity and was stored for different days. Then, a certain concentration of H2O2 solution was injected into the PAD analysis hole and incubated for 30 min. The color changes in the hydrogel spots in the test area were recorded using a smartphone. Finally, the test results are evaluated according to the scheme established above.3 Results and discussion
3.1 Characterization of the prepared ZIF-8, Pd NPs, and Pd NP loaded ZIF-8
ZIF-8 was synthesized according to the previously reported method42 by using Zn2+ and imidazolate precursors. Compared with the ZIF-8 nanoparticles prepared in aqueous solution, the morphology of the prepared Co-MOF in methanol was more regular. The coordination of Zn2+ with nitrogen atoms in the imidazole rings can form a rhombic dodecahedron shape of ZIF (Fig. 1a, inset shows the TEM image of ZIF-8). Pd NPs were prepared using PVP as the stable ligand with good uniformity (Fig. 1b). The Pd NPs loaded with ZIF-8 nanoparticles were easily prepared by simply adding prefabricated Pd NPs in the coordination process (SEM image shown in Fig. 1c). The rhombic dodecahedral shape of the Pd NPs loaded with ZIF-8 indicated a size distribution range of 150–250 nm (Fig. 1d). Moreover, the TEM image indicated that the Pd NPs were well embedded into the ZIF structure, indicating that the functional NP loading had less influence on the morphology change. On the other hand, the size distribution of the prepared nanomaterials was also characterized and is shown in Fig. S1 (ESI†). FTIR spectra of the as-synthesized ZIF-8, Pd-ZIF-8 NPs, and Pd NPs were measured as the proof for the identification of the surface functional groups as well as coordination by the monomer. In particular, the band peak at 2920 cm−1 is ascribed to the aliphatic C–H stretching vibration, while the band peak at 584 cm−1 is assigned to the C![[double bond, length as m-dash]](https://www.rsc.org/images/entities/char_e001.gif) N stretching vibration. These results indicated the formation of ZIF with the monomer 2-methylimidazole by coordination and the dominating ligand in these formed ZIF (Fig. 1e). Moreover, it also demonstrated that the linker 2-methylimidazole remained unchanged during the coordination transformation. The elemental compositions of the prepared Pd-ZIF-8 NPs were confirmed by energy-dispersive X-ray spectroscopy (EDX) (Fig. S2, ESI†). The results are presented in Table S1 and Fig. S3 (ESI†). The elemental composition of the Pd NP loaded ZIF-8 is as follows: C, 16.99%; N, 11.99%; Zn, 3.54%; Pd, 0.19%. The Zn/N weight ratio of the prepared Zn/N is 0.295. Fig. 1f compares the XRD profiles of ZIF-8, Pd NPs, and Pd NP loaded ZIF-8, and remarkable diffraction signals attributed to the dodecahedral-crystal of ZIF-8 were observed. These results demonstrate the successful preparation of Pd NP loaded ZIF-8.
N stretching vibration. These results indicated the formation of ZIF with the monomer 2-methylimidazole by coordination and the dominating ligand in these formed ZIF (Fig. 1e). Moreover, it also demonstrated that the linker 2-methylimidazole remained unchanged during the coordination transformation. The elemental compositions of the prepared Pd-ZIF-8 NPs were confirmed by energy-dispersive X-ray spectroscopy (EDX) (Fig. S2, ESI†). The results are presented in Table S1 and Fig. S3 (ESI†). The elemental composition of the Pd NP loaded ZIF-8 is as follows: C, 16.99%; N, 11.99%; Zn, 3.54%; Pd, 0.19%. The Zn/N weight ratio of the prepared Zn/N is 0.295. Fig. 1f compares the XRD profiles of ZIF-8, Pd NPs, and Pd NP loaded ZIF-8, and remarkable diffraction signals attributed to the dodecahedral-crystal of ZIF-8 were observed. These results demonstrate the successful preparation of Pd NP loaded ZIF-8.
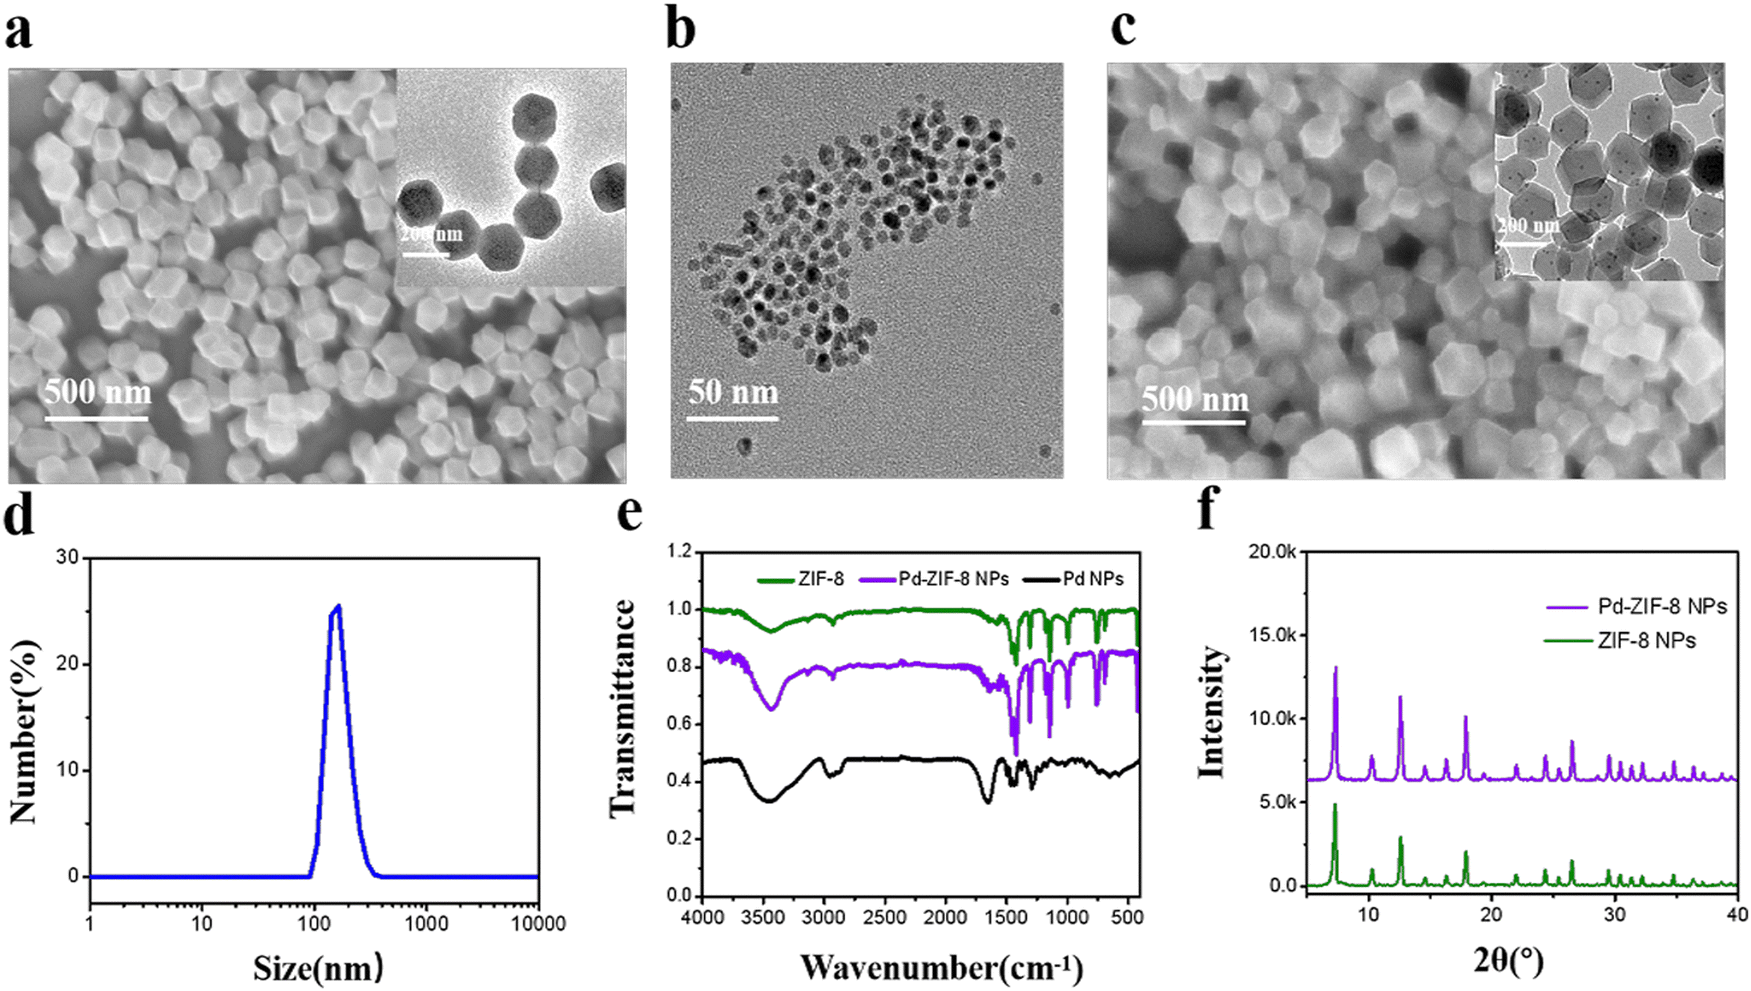 | ||
| Fig. 1 (a) SEM of prepared ZIF-8 nanoparticles (inset is the TEM image). (b) TEM of Pd NPs. (c) SEM of Pd NP-loaded ZIF-8 nanoparticles. (d) Size distribution of the prepared Pd NP loaded ZIF-8 nanoparticles. (e) IR spectrum of prepared NPs. (f) Powder-XRD profiles of the prepared NPs. | ||
3.2 Catalytic performance of the prepared nano-enzyme
To verify the catalytic performance of the prepared nanoenzyme, a colorimetric reaction using TMB as a chromogenic substrate was carried out. As shown in Fig. 2a, no color change was observed when only TMB was mixed with Pd-ZIF-8 NPs or H2O2 solution. In contrast, the color of the reaction solution turned light blue when ZIF-8, TMB, and H2O2 were mixed. Moreover, the color of the solution changed to deep blue when Pd-ZIF-8 NPs were used as the catalyst. The corresponding absorbance changes were recorded, as shown in Fig. 2b. A characteristic absorption peak at 652 nm in the presence of H2O2 was observed, owing to the oxidation of TMB to TMB cations catalyzed by nano-enzymes. However, this catalytic performance was influenced by reaction conditions, such as reaction time, pH value, temperature, and catalysis state. To obtain better catalytic outcomes, various parameters that affect the reaction performance were considered. Detailed optimization results are presented in the ESI† (Fig. S4–S6). To further investigate the kinetics, the kinetic data of the nanoenzyme were acquired based on enzyme kinetics theory according to the previously reported procedure.43 Typical Michaelis–Menten curves were recorded under the same conditions by varying the concentrations of H2O2 or TMB (Fig. S7, ESI†). The constant of maximum initial velocity (Vmax) and Michaelis–Menten constant (Km) were also calculated and summarized. Based on these results, colorimetric determination of H2O2 was developed in an aqueous buffer solution. As shown in Fig. 2c, the absorption spectra of the TMB-nanoenzyme (652 nm) increased with the concentration of H2O2, with a corresponding gradual color alteration (Fig. S8, ESI†). A good linearly proportional change with the concentration of H2O2 is obtained, with a linear range of 0.2–2.6 mM (y = 0.00857 + 0.06396x) (Fig. 2d).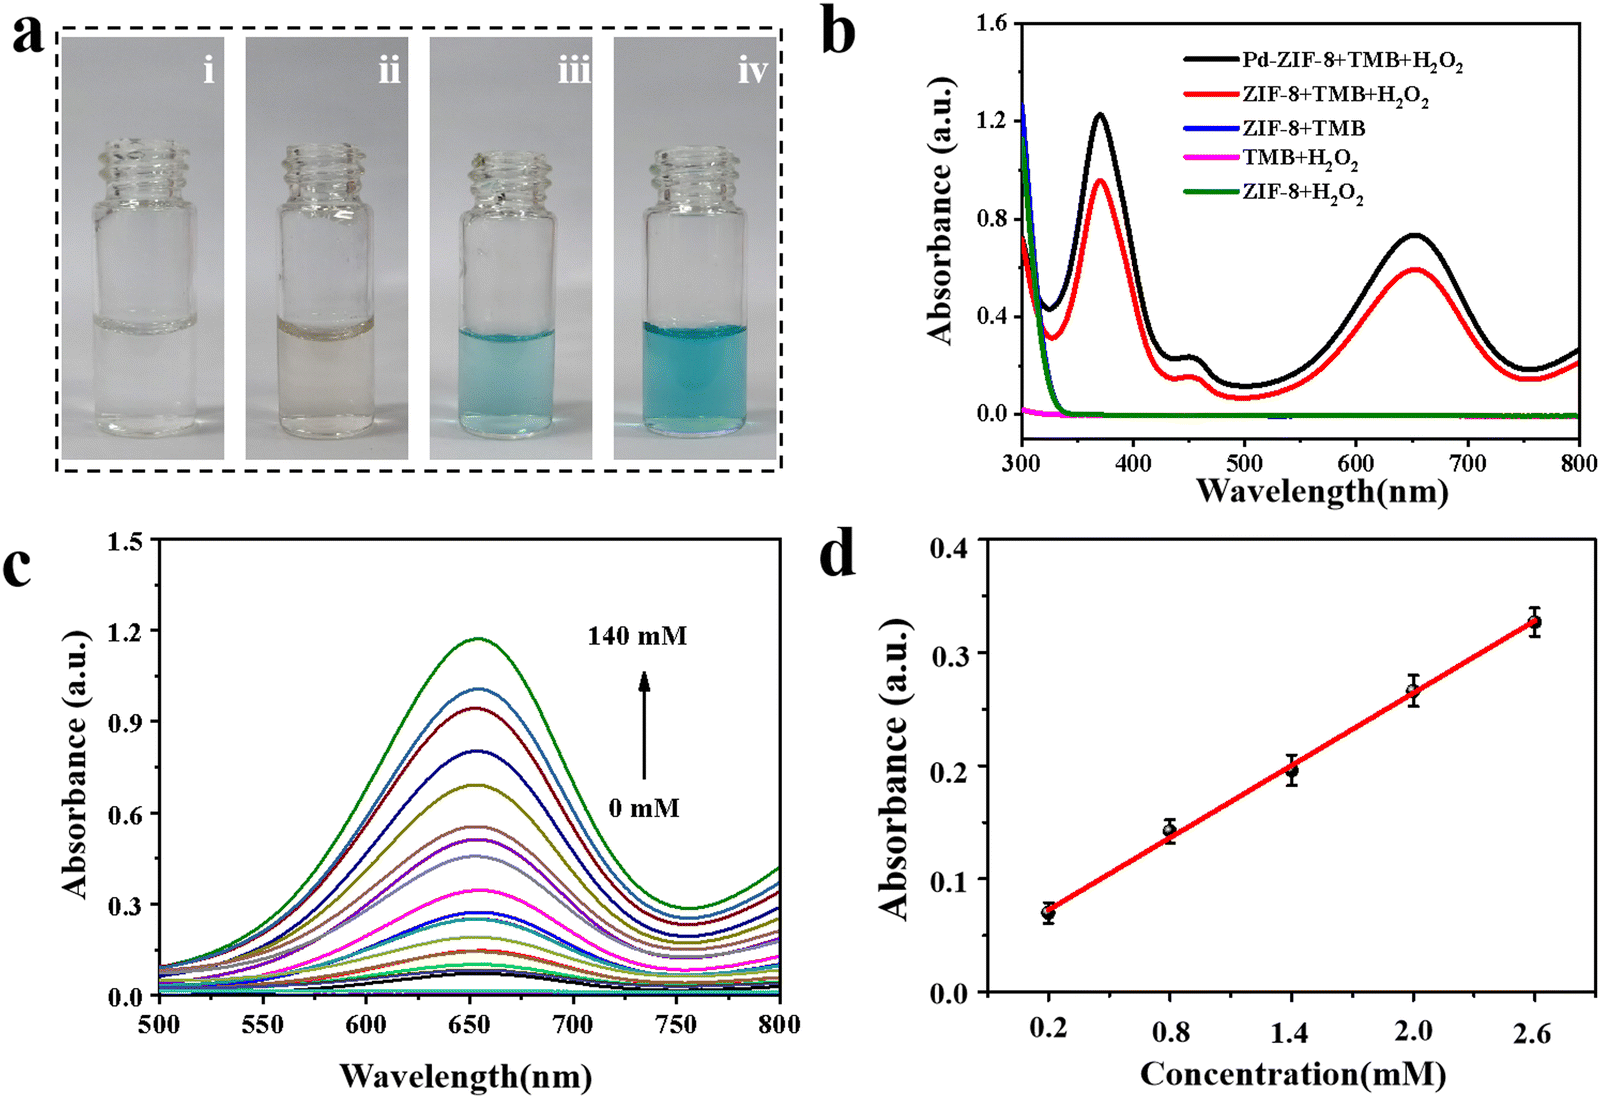 | ||
| Fig. 2 (a) Images of chromogenic reaction system by using TMB (i, TMB + H2O2, ii, Pd-ZIF-8 + TMB, iii, ZIF-8 + TMB + H2O2, and iv, Pd-ZIF-8 + TMB + H2O2). (b) Corresponding spectrum change of the TMB–H2O2 system with different combinations. Experimental conditions: 0.1 M pH 4 HAc–NaAc buffer; TMB: 0.2 mM; H2O2: 0.2 mM. (c) The UV-Vis absorbance changes of the chromogenic reaction system with increments in the H2O2 concentration (2.5, 5, 8, 10, 20, 40, 60, 80, 100, 200 and 300 mM). (d) Linear calibration plots for H2O2 detection in the range from 0.05 to 0.6 mM. Experimental conditions: 0.1 M pH = 4, HAc–NaAc buffer; TMB: 0.5 mM; nanoenzyme: 0.06 mg mL−1. Reaction time: 10 min. | ||
3.3 Design and fabrication of hybrid hydrogel-coupled assay method in a 96-well plate
SA hydrogelation triggered by Ca2+ is a common method for the preparation of alginate hydrogels.34 When mixed with the prepared Pd-ZIF-8 NPs, a hybrid hydrogel was formed and loaded into the 96-well plate for high-throughput assays. This is for the evaluation catalysis reaction in the hydrogel mixture in the 96-well plate before being applied in paper-based devices. An alginate hydrogel was selected as the scaffold that possesses functions such as supporting the chromogenic substance and nanoenzyme and a size-sieving effect due to the nanometer-scale pores. Fig. 3a shows the working principle of a hydrogel-coupled colorimetric sensor, in which the small molecule was allowed to diffuse through the 3D porous matrix to trigger the chromogenic reaction. The feasibility of the chromogenic reaction in alginate hydrogel was demonstrated by adding a 0.5 mM H2O2 aqueous solution; a slightly blue color can be observed (Fig. 3b). Molecular diffusion through a hydrogel is dependent on the height of the hydrogel layer and its porosity. Two crucial factors that need to be optimized are the viscosity of the hydrogel precursor and the total volume loaded into the plate hole. To quantify the diffusion effect of small molecules, hydrogels prepared using several alginate precursors were seeded at 0.2 wt%, 0.5 wt%, 0.8 wt%, 1.0 wt%, and 1.5 wt%. The OD intensity was recorded after 0.5 mM H2O2 aqueous solution was added to the hybrid hydrogel. As shown in Fig. S9 (ESI†), the highest OD signal was recorded when the alginate precursor concentration was 0.8%; thus, this concentration was chosen as the optical precursor concentration for the following experiment. The SEM images of the prepared alginate hydrogel network after freezing-drying are shown in Fig. 3c. Pd-ZIF-8 NP loaded hydrogels (0.8 wt%) exhibited an average pore size of 50 mM, which featured the size-sieving effect of the alginate hydrogel. For hydrogel layer optimization, various mixture solutions were added to the holes of 96-well plates with layer heights of 0.4 cm, 0.6 cm, 0.8 cm, and 1.0 cm, respectively. The result shown in Fig. S10 (ESI†) indicates that the OD intensity slightly decreased with the thickness of the hydrogel layer. This may be ascribed to the longer diffusion path of small molecules within the internal hydrogel body. The reproducibility of the hydrogel-based assay was further evaluated in a 96-well plate under optimal experimental conditions. The color change of the hydrogel in the plate was recorded and is shown in Fig. 3d for various concentrations of H2O2. Under the optimized conditions (reaction time: 10 min; pH value: 4.5; temperature: RT), the analytical performance was first evaluated using the standard H2O2 solution in a concentration range of 0 to 2.5 mM (Fig. 3e). In Fig. 3f, a good linear relationship between the CL signals and the substance concentration was obtained in the range of 0.125–0.75 mM (y = 0.02923x − 0.00731, R2 = 0.993). The detection of limit (LOD) is determined to be as low as 0.082 mM. All H2O2 detections were evaluated by performing three parallel assays under the same experimental conditions, which also indicated good reproducibility, with an RSD of only 2.56%. Moreover, this hybrid hydrogel-based assay system is sensitive to H2O2, which may lay the foundation for future applications.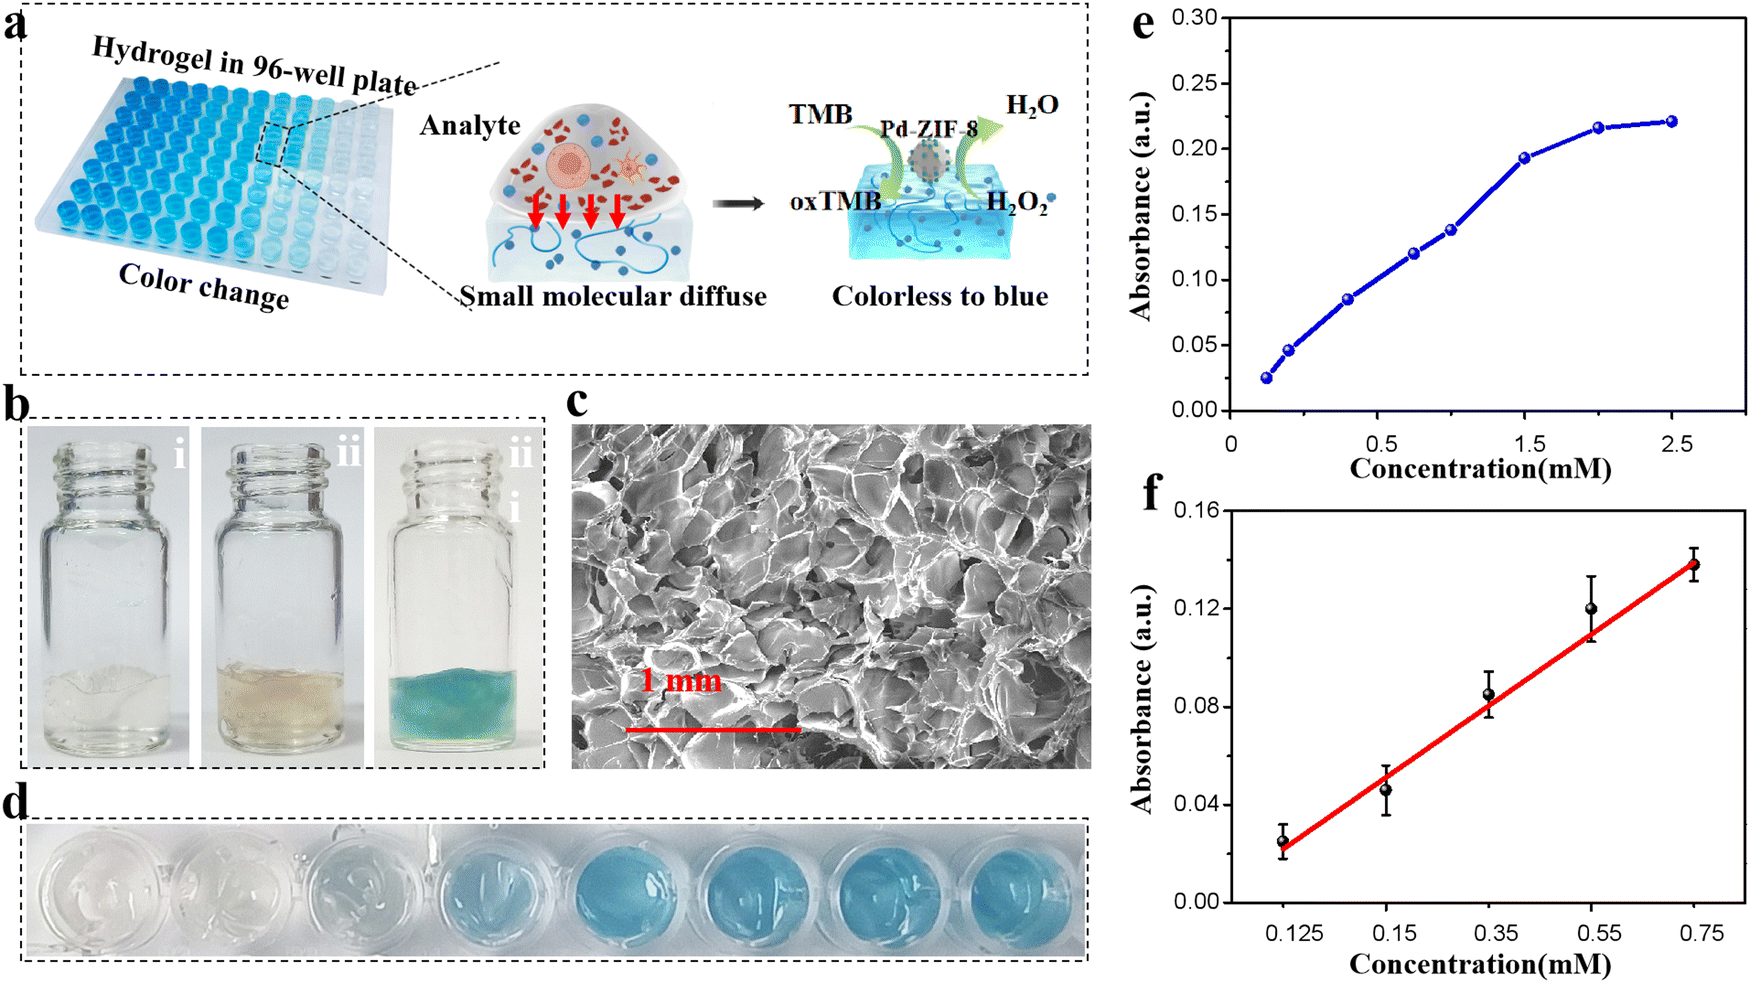 | ||
| Fig. 3 (a) Schematic illustration of the working principle for H2O2 detection in a hydrogel matrix. (b) Images of feasibility study of the chromogenic reaction in the hydrogel matrix. (From left to right: i, pure alginate hydrogel, ii, alginate hydrogel + Pd-ZIF-8 NPs + TMB, and iii, alginate hydrogel + Pd-ZIF-8 NPs + TMB + H2O2.) (c) SEM images of the dehydrated gel prepared at 0.8 wt% precursor concentrations. (d) Images of hydrogel color change by adding various concentrations of H2O2 in 96-plate wells (0, 0.125, 0.15, 0.35, 0.55, 0.75, 0.95, and 1.15 mM). (e) Correlation between H2O2 concentration and colorimetric assay readout signals. (f) Linear curve of color intensity versus the concentration of H2O2 in a hydrogel matrix. | ||
3.4 H2O2 detection by PADs
The good performance of H2O2 detection by hydrogel-based colorimetric sensors inspired us to propose a hydrogel-coupled colorimetric PAD that combines the advantages of hydrogel-based sensors and POC diagnosis. The fabrication of the hydrogel-coupled PAD is schematically illustrated in Fig. 4a, with the assembly process shown in Fig. S11 (ESI†). The proposed PADs contain three layers with a rectangular shape (2.0 × 2.5 cm). The three layers are, a PVC sheet with a single-sided adhesive tape employed as the upper layer, and two 6 mm circular disc cutouts punched onto it with a center distance of 1.0 cm. In the middle layer, two types of paper were used for assembly: an adsorption pad (0.5 × 2.0 cm) made of filter paper and a sample pad (0.5 × 2.0 cm) made of fiberglass paper. The third layer was made of the same material as the top layer, which functioned as a supporting pad. The adsorption and sample pads were first mounted together on the supporting pad, and the PAD was fabricated by covering the upper layer on it. Fifty microliters of SA aqueous solution with a concentration of 0.8 wt% was carefully dropped into one circular disc cutout, and 20 μL of CaCl2 solution (100 mM) was added after the alginate completely diffused. Finally, the excess volume of the CaCl2 solution was removed and further incubated for 30 min to dehydrate. Fig. 4b shows photographs of the prepared PAD, where the side and top views indicate that a hybrid hydrogel spot was immobilized onto the test zone (marked by a red circle in Fig. 4b and Fig. S12, ESI†). It is worth mentioning that the alginate hydrogel was embedded into glass fiber owing to this specific design, which functioned as a fixation for the hydrogel during sample flow. Before testing the detection performance, the reaction time and sample volume that needed to be dropped onto the sample pad were optimized (Fig. S13 and S14, ESI†). For the colorimetric detection of H2O2, the color change of the test zone was captured using a smartphone (iPhone 12, Apple) with a digital camera. As the color capturing process will be strongly influenced by the surroundings, which may reduce the sensitivity and stability of the system, a mini-LED photographic light box was used during the image capturing process (Fig. S15, ESI†). The resulting color images were processed using image analysis software (ImageJ), which can transform colorimetric images into RGB values (Fig. 4c). The color change from light blue to dark blue in the test zone was recorded using a color recognizer with the addition of H2O2, and the color intensity was then transferred to the RGB value mode (Fig. 4d). A linear response for H2O2 concentration and signal intensity was established in the range of 0.1–2.5 mM using the linear equation DG = 2.2497x − 0.97867 (x represents H2O2 concentration, R2 = 0.9972) and a LOD of 0.06 mM.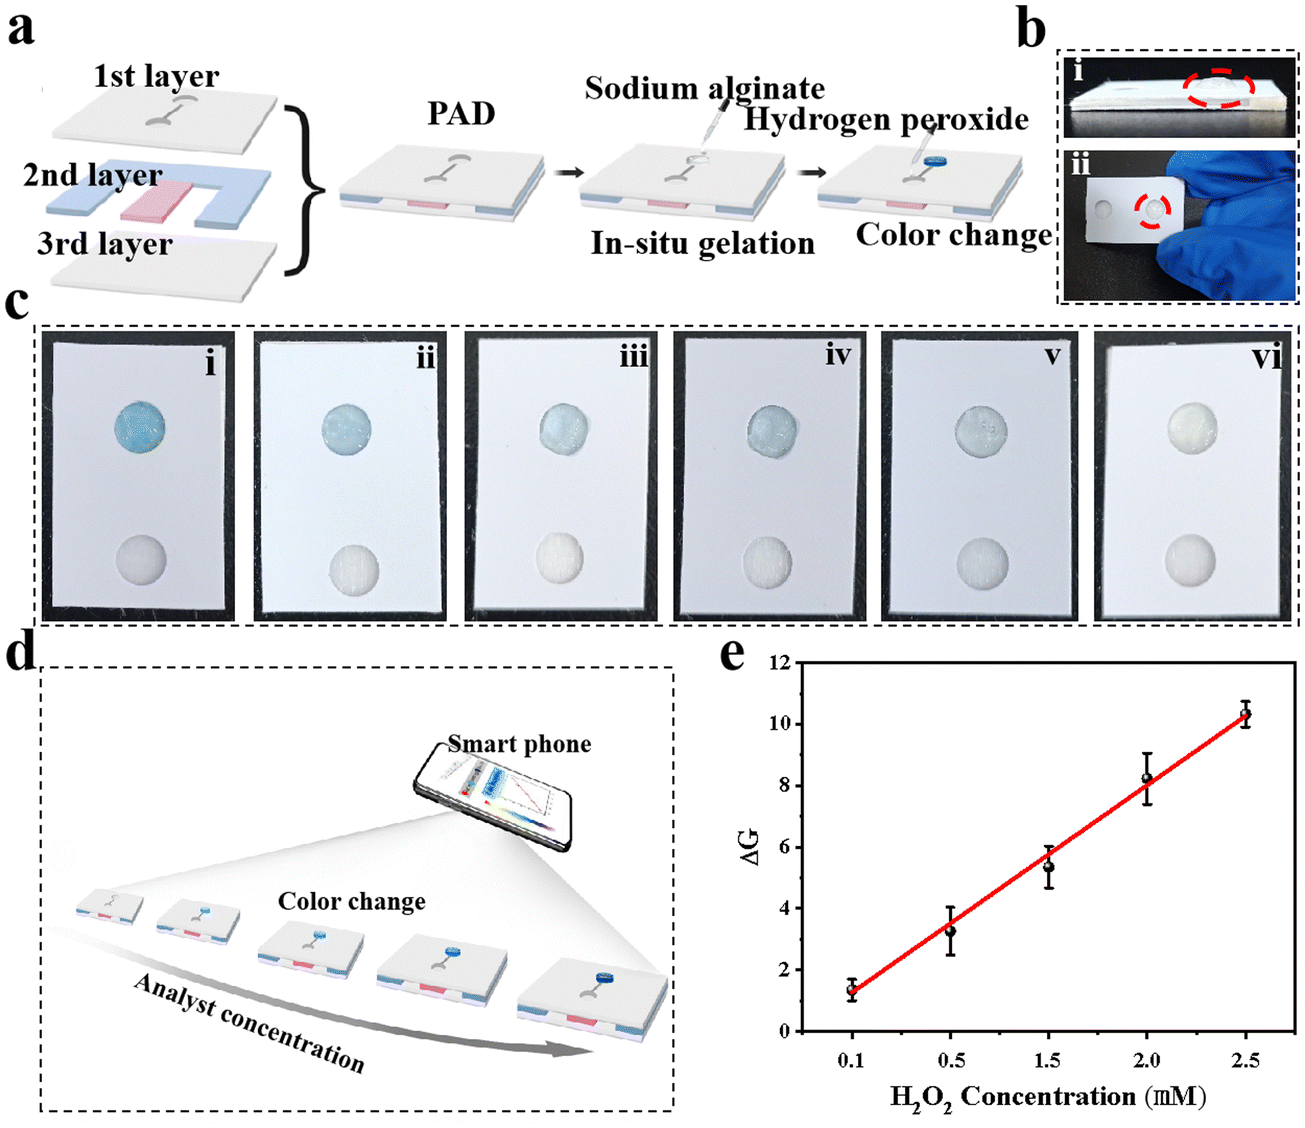 | ||
| Fig. 4 (a) Schematic illustration of fabrication of hydrogel-coupled PAD. (b) The layout of hydrogel-coupled PAD with side view and top view. (c) Colorimetric images of the PAD test zone with the addition of H2O2 from 0 to 2.5 mM in aqueous solution. (d) Schematic demonstration of colorimetric detection of H2O2 with a smartphone as a color recognizer. (e) Corresponding calibration graph for the detection of H2O2 at various concentrations (0.1, 0.5, 1.5, 2.0, and 2.5 mM). | ||
3.5 Colorimetric detection of H2O2 in cell lysis and selectivity
To test the applicability of our proposed sensing system, one type of biological sample cell lysis was selected owing to its complex components, such as cell membrane fragments, proteins, glucose, amino acids, and small molecules. The reliability of this PAD in biological samples was demonstrated by spiking the samples with various concentrations of H2O2. As shown in Fig. 5a, the color intensity of the test zone increased with increasing analyte concentration, and the corresponding calibration linear relationship is shown in Fig. 5b. The proposed PAD system exhibited a dynamic range of 0.08–1.3 mM with a regression coefficient (R2) of 0.990, which indicated the high reliability and simplicity of our PAD for POC or household testing without professional and bulky assay equipment. The selectivity of the proposed hydrogel-based PAD assay was investigated in the presence of interfering substances, such as BSA, amino acids, trypsin, glucose, sugars, vitamins, and metal ions, which may affect H2O2 detection. As shown in Fig. 5c, compared to the strong response to H2O2, the presence of interfering substances showed negligible colorimetric signal enhancement in the test region, indicating that the proposed hydrogel-based PAD assay has good anti-interference ability. However, it is noteworthy that our proposed method would not be suitable for testing colored analytes directly, because the inherent trait of colorimetric-based sensors is that they can severely interfere with colored substances, such as whole blood, red blood cells, hemoglobin, food samples with coloring matter, or environmental samples; this problem can be avoided by pro-filtration using commercial separation filters. We then studied its anti-interference capacity using bulk particles (CaCO3 bulk particles) as an interference substance. It is expected that the sample pad, which is made of glass fiber and hydrogel in the test zone, works together to avoid bulk interference diffusing to the test zone. Images of the CaCO3 bulk particle aqueous suspension liquid with a H2O2 concentration of 100 mM and H2O2 solution at the same concentration are shown in Fig. 5d. A comparison of the test results was based on a six-time parallel test under the same experimental conditions. The results shown in Fig. 5e indicate a good correlation between the two types of analytes with a correlation coefficient of 0.98, and the confidence interval of the mean was 95%, which showed no significant difference for the two types of analytes. Thus, our proposed hydrogel-based PAD has good stability, robustness, and anti-interference capacity, which is beneficial for applications in real samples. We then tested the shelf life of this paper-based sensor by storing it in a dry environment at 4 °C for 0 days, 1 day, 2 days, 4 days, 7 days, and 10 days. The stored PADs were used for H2O2 detection at four different concentrations (0.37, 0.65, and 1.3 mM). The results shown in Fig. S16 (ESI†) indicate that the proposed assay performance showed no obvious degradation for 7 days for all concentrations tested, indicating that the proposed PAD holds great stability and promise for further applications. The lifetime of this PAD is shorter compared with a commercial paper-based device. This may be ascribed to the drying out of hydrogel in the test zone and the inactivity of inorganic enzyme. Potential strategies like slowing down the drying process, or extending the enzyme catalysis activity should be considered to improve the “expiration time” of this PAD.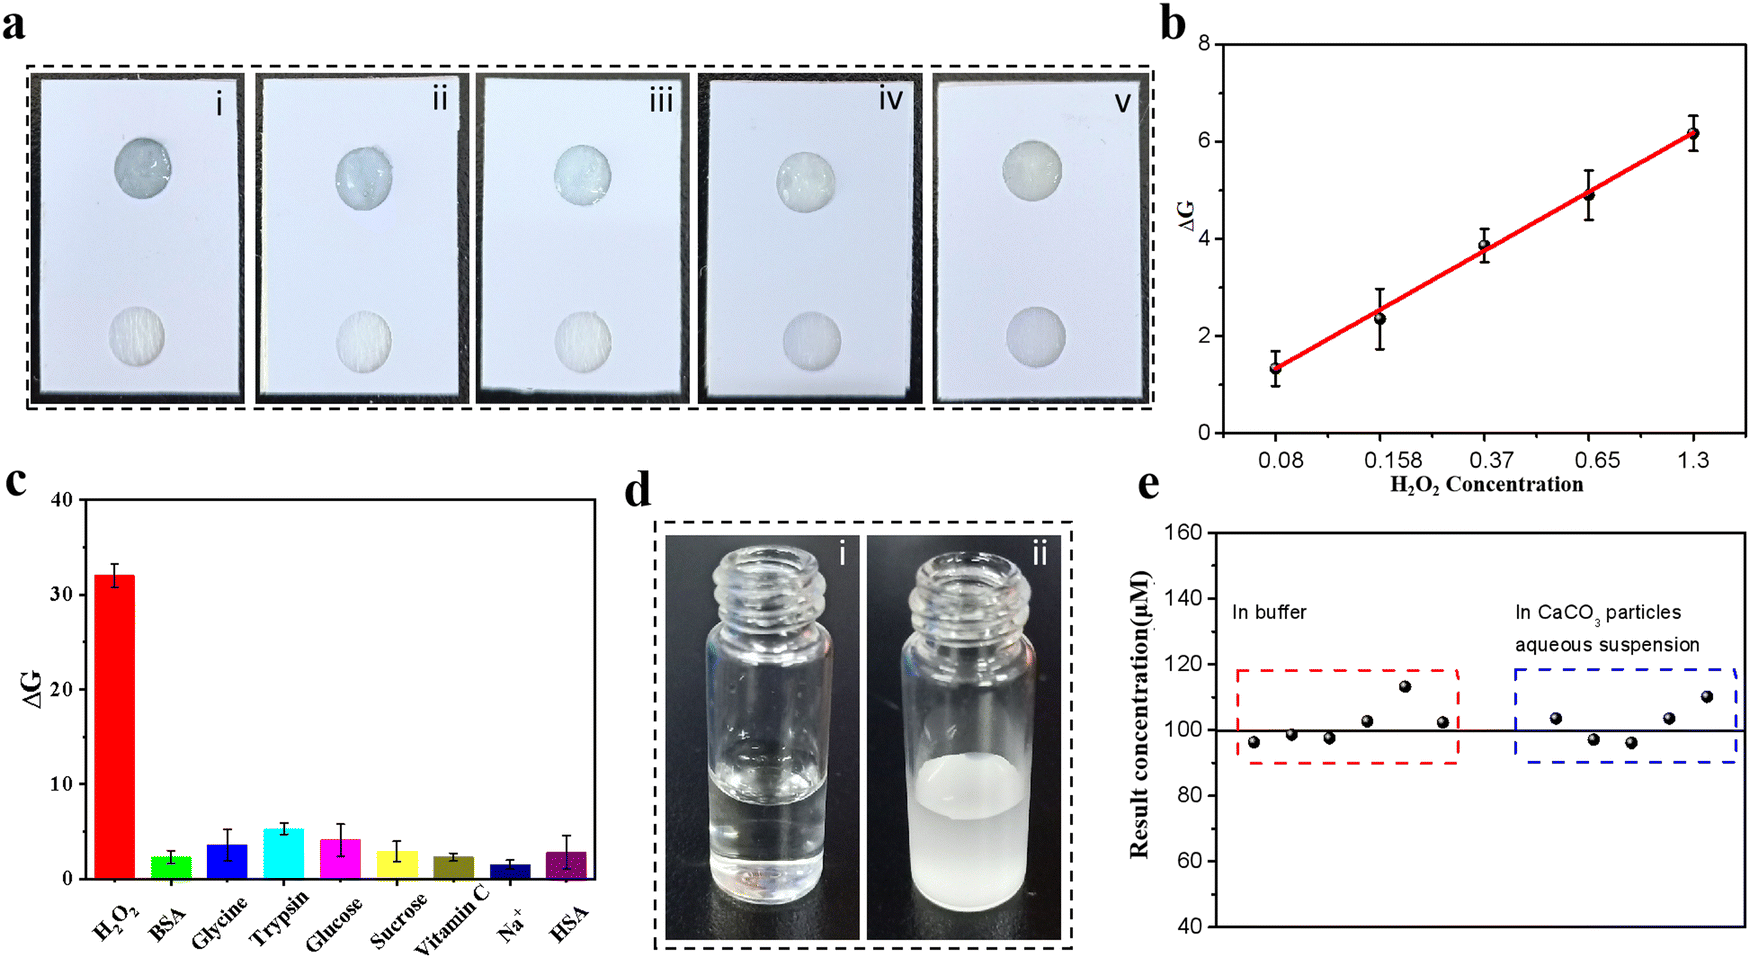 | ||
| Fig. 5 (a) Colorimetric images of the PAD test zone with the addition of various concentrations of H2O2 (i, 1.3 mM, ii, 0.65 mM, iii, 0.37 mM, iv, 0.158 mM, v, 0.08 mM) in cell lysis. (b) Plot of the color intensity with H2O2 concentration. (c) Selectivity study of the assay for H2O2 detection compared with other matrix substances. (d) Images of buffer solution and CaCO3 particle suspension with the same concentration spiked. (e) Comparison of results in two kinds of solutions by using the proposed PAD method (n = 6). | ||
4 Conclusions
In conclusion, a hydrogel-coupled paper-based colorimetric and visual quantitative device was fabricated for the detection of hydrogen oxide in aqueous solutions and cell lysis. By encapsulating the nanoenzyme and chromogenic substrate into the gel disk, this hydrogen-coupled colorimetric sensor was configured into a customized paper-based assay device with an underlying lateral flow channel. The lateral flow channel and nanoporous structure of the hydrogel spots work together to clog impurities, including block fragments, biomacromolecules, or whole cells entering and diffusing into the colorimetric sensor, while allowing small molecules such as hydrogen oxide to diffuse into the gel disk. The hydrogel-coupled detection approach was successfully applied to quantify hydrogen oxide with a relevant range of 0.1–2.5 mM, with an LOD of 0.06 mM, which is sufficiently low for clinical applications. Taking advantage of the hydrogel and lateral flow principle, the proposed μPAD-based sensing does not require any extra sample processing or impurity separation process. The proposed hydrogel-coupled mPAD is easy to manufacture, portable, enzyme-free, low cost and easy to use. In addition, the proposed separation-free POCT device is expected to be the first step in the quantitative or qualitative analysis of other analytes in body fluids for POC applications.Data availability
All relevant data are within the manuscript and its additional files.Conflicts of interest
There are no conflicts to declare.Acknowledgements
The authors gratefully acknowledge financial support from the National Natural Science Foundation of China (22203027), the Henan Province Science and Technology Attack Plan Project (242102230020), the Major Project of Science and Technology, Education Department of Henan Province (22A150006) and the Kaifeng Science and Technology Attack Plan Project (2303014).References
- J. S. Sun, Y. L. Xianyu and X. Y. Jiang, Chem. Soc. Rev., 2014, 43, 6239–6253 RSC.
- S. Feng, R. Caire, B. Cortazar, M. Turan, A. Wong and A. Ozcan, ACS Nano., 2014, 8, 3069–3079 CrossRef CAS PubMed.
- M. M. Gong and D. Sinton, Chem. Rev., 2017, 117, 8447–8480 CrossRef CAS PubMed.
- S. W. Hu, S. Qiao, B. Y. Xu, X. Peng, J. J. Xu and H. Y. Chen, Anal. Chem., 2017, 89, 2131–2137 CrossRef CAS PubMed.
- Y. Y. Yao, W. S. Guo, J. Zhang, Y. D. Wu, W. H. Fu, T. T. Liu, X. L. Wu, H. J. Wang, X. Q. Gong, X. J. Liang and J. Chang, ACS Appl. Mater. Interfaces., 2016, 8, 22963–22970 CrossRef CAS PubMed.
- Y. L. Zhang, P. Zuo and B. C. Ye, Biosens. Bioelectron., 2015, 68, 14–19 CrossRef CAS PubMed.
- L. Wu, X. F. Liu, S. F. Zong, Z. Y. Wang and Y. P. Cui, Biosensors, 2023, 13, 611 CrossRef CAS PubMed.
- H. B. Wang, C. Ying, L. Na and Y. M. Liu, Microchim. Acta, 2017, 184, 515–523 CrossRef CAS.
- L. G. Chen, L. Sun, N. N. Wu, B. B. Tao and H. B. Wang, Anal. Chim. Acta, 2023, 1279, 341843 CrossRef CAS PubMed.
- L. Sun, L. G. Chen and H. B. Wang, Analyst, 2024, 149, 546–552 RSC.
- L. Zhu, X. Lv, H. Yu, X. Tan, Y. Rong, W. Feng, L. Zhang, J. Yu and Y. Zhang, Anal. Chem., 2022, 94, 8327–8334 CrossRef CAS PubMed.
- L. Li, H. Yang, L. Li, X. Tan, S. Ge, L. Zhang, J. Yu and Y. Zhang, ACS Sens., 2022, 7, 2429–2437 CrossRef CAS PubMed.
- C. N. Loynachan, M. R. Thomas, E. R. Gray, D. A. Richards, J. Kim, B. S. Miller, J. C. Brookes, S. Agarwal, V. Chudasama, R. A. McKendry and M. M. Stevens, ACS Nano., 2018, 12, 279–288 CrossRef CAS PubMed.
- D. W. Bradbury, M. Azimi, A. J. Diaz, A. A. Pan, C. H. Falktoft, B. M. Wu and D. T. Kamei, Anal. Chem., 2019, 91, 12046–12054 CrossRef CAS PubMed.
- H. M. Zhang, Y. Y. Yang, X. R. Li, Y. Z. Shi, B. Hu, Y. An, Z. Zhu, G. L. Hong and C. J. Yang, Lab Chip, 2018, 18, 2749–2756 RSC.
- N. Cheng, Y. Song, Q. R. Shi, D. Du, D. Liu, Y. B. Luo, W. T. Xu and Y. H. Lin, Anal. Chem., 2019, 91, 13986–13993 CrossRef CAS PubMed.
- Y. L. Song, Y. Z. Shi, M. J. Huang, W. Wang, Y. Wang, J. Cheng, Z. C. Lei, Z. Zhu and C. Y. Yang, Angew. Chem., Int. Ed., 2019, 58, 2236–2240 CrossRef CAS PubMed.
- M. F. Abate, S. Jia, M. G. Ahmed, X. Li, L. Lin, X. Q. Chen, Z. Zhu and C. Y. Yang, Small, 2019, 15, 1804890 CrossRef PubMed.
- C. M. Song, C. Liu, S. Y. Wu, H. L. Li, H. Q. Guo, B. Yang, S. Qiu, J. W. Li, L. Liu, H. J. Zeng, X. Z. Zhai and Q. Liu, Food Control, 2016, 59, 345–351 CrossRef CAS.
- J. H. Yi, Z. X. Wang, J. Hu, T. Yu, Y. D. Wang, P. F. Ge and Y. L. Xianyu, ACS Appl. Mater. Interfaces, 2023, 15, 29789–29800 CrossRef CAS PubMed.
- S. Armenta, M. de la Guardia, M. Alcalà and M. Blanco, Anal. Chem., 2013, 85, 11382–11390 CrossRef CAS PubMed.
- E. Morales-Narváez, T. Naghdi, E. Zor and A. Merkoçi, Anal. Chem., 2015, 87, 8573–8577 CrossRef PubMed.
- M. D. Catten, A. H. Murr, J. A. Goldstein, A. N. Mhatre and A. K. Lalwani, The Laryngoscope., 2001, 111, 399–403 CrossRef CAS PubMed.
- T. Hyötyläinen, Anal. Bioanal. Chem., 2009, 394, 743–758 CrossRef PubMed.
- L. Huang, Y. Zhou, Y. X. Zhu, H. Y. Su, S. Z. Yang, L. Feng, L. Zhao, S. R. Liu and K. Qian, Biosens. Bioelectron., 2022, 210, 114254 CrossRef CAS PubMed.
- X. Zhao, Z. H. Ding, H. Q. Chen, Y. X. Xiao, J. S. Hou, L. Huang, J. J. Wu and N. J. Hao, Anal. Chem., 2023, 96, 496–504 CrossRef PubMed.
- L. Zhan, S. Z. Guo, F. Song, Y. Gong, F. Xu, D. R. Boulware, M. C. McAlpine, W. C. W. Chan and J. C. Bischof, Nano Lett., 2017, 17, 7207–7212 CrossRef CAS PubMed.
- E. Morales-Narváez, T. Naghdi, E. Zor and A. Merkoçi, Anal. Chem., 2015, 87, 8573–8577 CrossRef PubMed.
- U. Goreke, A. Bode, S. Yaman, U. A. Gurkan and N. G. Durmus, Lab Chip, 2022, 22, 683–696 RSC.
- X. F. Gao, J. Boryczka, S. Kasani and N. Q. Wu, Anal. Chem., 2021, 93, 1326–1332 CrossRef CAS PubMed.
- X. H. Yan, B. Ji, F. Fang, X. L. Guo, S. Zhao and Z. Y. Wu, Talanta, 2024, 270, 125515 CrossRef CAS PubMed.
- W. J. Guo, J. Hansson and W. van der Wijngaart, Anal. Chem., 2020, 92, 6194–6199 CrossRef CAS PubMed.
- D. Quesada-González and A. Merkoçi, Biosens. Bioelectron., 2015, 73, 47–63 CrossRef PubMed.
- R. R. Niedl and C. Beta, Lab Chip, 2015, 15, 2452–2459 RSC.
- X. F. Wei, T. Tian, S. S. Jia, Z. Zhu, Y. L. Ma, J. J. Sun, Z. Y. Lin and C. J. Yang, Anal. Chem., 2016, 88, 2345–2352 CrossRef CAS PubMed.
- J. T. Ping, W. L. Wu, L. B. Qi, J. Liu, J. P. Liu, B. L. Zhao, Q. B. Wang, L. Yu, J. M. Lin and Q. Z. Hu, Biosens. Bioelectron., 2021, 192, 113548 CrossRef CAS PubMed.
- X. F. Wei, T. Tian, S. S. Jia, Z. Zhu, Y. L. Ma, J. J. Sun, Z. Y. Lin and C. J. Yang, Anal. Chem., 2015, 87, 4275–4282 CrossRef CAS PubMed.
- J. Dai, H. Zhang, C. Huang, Z. Y. Chen and A. Han, Anal. Chem., 2020, 92, 16122–16129 CrossRef CAS PubMed.
- J. Xu, H. Khan and L. Yang, Anal. Chem., 2021, 93, 14755–14763 CrossRef CAS PubMed.
- W. Liu, Y. Yuan, Q. Liu, M. Chen and X. Q. Chen, Sens. Actuators, B, 2022, 355, 131296 CrossRef CAS.
- J. H. Wang, L. Cheng, C. H. Wang, W. S. Ling, S. W. Wang and G. B. Lee, Biosens. Bioelectron., 2013, 41, 484–491 CrossRef CAS PubMed.
- X. M. Lin, G. M. Gao, L. Y. Zheng, Y. W. Chi and G. N. Chen, Anal. Chem., 2014, 86, 1223–1228 CrossRef CAS PubMed.
- H. C. Ma, J. L. Kan, G. J. Chen, C. X. Chen and Y. B. Dong, Chem. Mater., 2017, 29, 6518–6524 CrossRef CAS.
Footnotes |
| † Electronic supplementary information (ESI) available: General experimental study, nanometer size distribution diagram, EDX analysis of Pd-ZIF-8 NPs, elemental diagram of nanoparticles, steady-state kinetic analysis and catalytic mechanism. PAD production process and reaction phenomenon. Optimization of reaction conditions and additional diagrams. See DOI: https://doi.org/10.1039/d4tb00715h |
| ‡ These authors have equal contribution to this work. |
| This journal is © The Royal Society of Chemistry 2024 |