 Open Access Article
CoTeO4 – a wide-bandgap material adopting the dirutile structure type†
Matthias
Weil
 *a,
Prativa
Pramanik
b,
Pierfrancesco
Maltoni
 b,
Rebecca
Clulow
 c,
Andreas
Rydh
 d,
Manfred
Wildner
 e,
Peter
Blaha
 f,
Graham
King
 g,
Sergey A.
Ivanov
b,
Roland
Mathieu
 b and
Harishchandra
Singh
 h
h
aInstitute for Chemical Technologies and Analytics, Division of Structural Chemistry, TU Wien, Getreidemarkt 9/E164-05-1, A-1060 Vienna, Austria. E-mail: matthias.weil@tuwien.ac.at
bDepartment of Materials Science and Engineering, Uppsala University, Box 35, SE-751 03 Uppsala, Sweden
cDepartment of Chemistry, Ångström Laboratory, Uppsala University, 751 21 Uppsala, Sweden
dDepartment of Physics, Stockholm University, 106 91 Stockholm, Sweden
eInstitut für Mineralogie und Kristallographie, Universität Wien, Josef-Holaubek-Platz 2, A-1090 Vienna, Austria
fInstitute for Materials Chemistry, Division Theoretical Chemistry, TU Wien, Getreidemarkt 9/E165-03, A-1060 Vienna, Austria
gCanadian Light Source, 44 Innovation Blvd., Saskatoon, Saskatchewan S7N 2V3, Canada
hNano and Molecular Systems Research Unit, University of Oulu, Oulu FIN-90014, Finland
First published on 28th February 2024
Abstract
High-quality crystals of CoTeO4 were grown by application of chemical vapor transport reactions in closed silica ampoules, starting from polycrystalline material in a temperature gradient 640 °C → 580 °C with TeCl4 as transport agent. Crystal structure analysis of CoTeO4 from single crystal X-ray data revealed a dirutile-type structure with CoII and TeVI atoms at crystallographically distinct sites, each with point group symmetry ![[1 with combining macron]](https://www.rsc.org/images/entities/char_0031_0304.gif) . The statistical significance and accuracy of the previously reported structural model based on powder data with the ordered arrangement of Co and Te cations was noticeably improved. CoTeO4 does not undergo a structural phase transition upon heating, but decomposes stepwise (Co2Te3O8 as intermediate phase) to Co3TeO6 as the only crystalline phase stable above 770 °C. Temperature-dependent magnetic susceptibility and dielectric measurements suggest antiferromagnetic ordering at ∼50 K. Optical absorption spectroscopy and computational studies reveal wide-band semiconductive behavior for CoTeO4. The experimentally determined band gap of ∼2.42 eV is also found for CdS, which is frequently used in photovoltaic systems but is hazardous to the environment. Hence, CoTeO4 might be a possible candidate to replace CdS in this regard.
. The statistical significance and accuracy of the previously reported structural model based on powder data with the ordered arrangement of Co and Te cations was noticeably improved. CoTeO4 does not undergo a structural phase transition upon heating, but decomposes stepwise (Co2Te3O8 as intermediate phase) to Co3TeO6 as the only crystalline phase stable above 770 °C. Temperature-dependent magnetic susceptibility and dielectric measurements suggest antiferromagnetic ordering at ∼50 K. Optical absorption spectroscopy and computational studies reveal wide-band semiconductive behavior for CoTeO4. The experimentally determined band gap of ∼2.42 eV is also found for CdS, which is frequently used in photovoltaic systems but is hazardous to the environment. Hence, CoTeO4 might be a possible candidate to replace CdS in this regard.
Introduction
Complex Te-based metal oxides represent an attractive class of multifunctional materials based on a rich versatility with respect to their crystal structures and composition diagrams. This includes the capability to exist in two stable oxidation states in an oxidic environment, i.e. in form of TeIV (resulting compounds are named oxidotellurates(IV)) and TeVI (oxidotellurates(VI)).1 For instance, some of these Te-based oxides have interesting physical properties due to their low dielectric losses in the microwave range and show potential applications in the field of low-temperature co-fired ceramic technology.2 The renewed interest in transition metal oxidotellurates(VI) with formula type A3TeO6 (A is a divalent transition metal) is related to their interesting optical3,4 and low-temperature magnetic properties,5–8 including magnetic field induced spontaneous electric polarization in Co3TeO6.9–14 Stimulated by these properties, Co3TeO6 has also been investigated in the high-pressure regime.15,16For synthesis of polycrystalline Co3TeO6 in its ambient-pressure form, solid-state reactions between suitable precursor materials are usually applied. In this regard, the growth reaction mechanism of Co3TeO6 has been studied in detail,17 revealing that CoTeO4 is an intermediate product during the ceramic route for preparation of Co3TeO6. Although CoTeO4 has been reported more than forty years ago,18 its structural and physical properties were not investigated in much detail. The first structure report was based on powder X-ray data and revealed a crystal structure derived from rutile (TiO2).19 However, the original structure model was subsequently corrected on basis of high-resolution synchrotron X-ray data from nanocrystalline material.20
We became interested in CoTeO4 due to the interesting physical properties associated with inorganic materials adopting the rutile structure type or MM′′O4 and MM2′′O6 derivatives thereof.21 For example, rutile-type compounds have been widely investigated for photocatalytic activities.22,23 TiO2 is also known for its incipient ferroelectric property because of its large static dielectric permittivity that shows strong frequency dependence associated with a soft (A2u) mode behavior.24 Moreover, rutile-type FeTiNbO6 was reported to be a multiferroic material.25 In the context of structure–property relationships, it is of paramount importance to have available both a reliable crystal structure model for computational studies and highly crystalline material for measurement/determination of physical properties related to long-range order and correlated phenomena. However, the reported crystal structure model of CoTeO4 is not very accurate – which lies in the nature of structure refinements from powder data. Thus, improving the crystal structure model of CoTeO4 is highly desirable, preferably on basis of single-crystal X-ray diffraction data. The same is true for the few reported findings regarding physical properties of CoTeO4, which were determined from products with poor crystallinity.19,20 Hence, advancements and complementary results are also expected in this area. Considered from this point of view, single crystal growth of CoTeO4 with subsequent structure analysis as well as preparation of material with high crystallinity for determination of physical properties were the main reasons for a reinvestigation.
We report here the results of crystal growth studies, crystal structure elucidation, physical properties and theoretical calculations of CoTeO4.
Experimental
Preparation of polycrystalline material
Stoichiometric amounts of Te(OH)6 (5.500 g, 24 mmol) and Co(NO3)2(H2O)6 (6.970 g, 24 mmol) were thoroughly mixed and ground in an agate mortar. The mixture was heated in a porcelain crucible within three hours from room temperature to 300 °C and left at this temperature for twelve hours to expel water and oxides of nitrogen. The resulting black solid was ground again and heated within three hours to 550 °C, and left with another intermediate grinding step for two days. Powder X-ray diffraction of the light-brown solid revealed a single-phase product, however with poor crystallinity (Fig. 1). The crystallinity was significantly increased by heating the as-obtained powder in an evacuated and sealed silica ampoule at 600 °C for further 20 days (Fig. 1), resulting in an amber-colored polycrystalline material.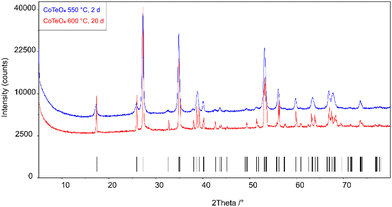 | ||
| Fig. 1 X-ray powder diffraction patterns of single-phase CoTeO4 tempered for 2 days at 550 °C and for 20 days at 600 °C. Tick marks represent the position of Bragg reflections. | ||
Crystal growth
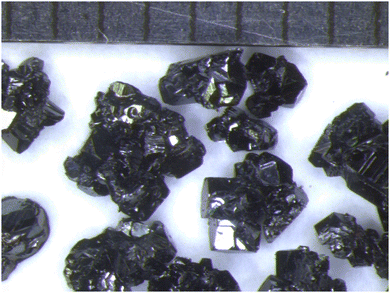
Crystals were grown by using chemical vapor transport reactions.26 In a typical batch, 500 mg of polycrystalline CoTeO4 and 50 mg TeCl4 as transport agent were loaded in a silica ampoule (diameter 1 cm, length 12 cm) that was subsequently evacuated and sealed with an oxyhydrogen torch. The ampoule was placed in a horizontal two-zone furnace, applying a temperature gradient of 640 °C (source region) → 580 °C (sink region), and heated for 20 days. The grown crystals aggregated into intergrown species up to 3 mm in length with a nearly black color (Fig. 2). The streak of the crystals is dark-brown; the powder obtained by grinding the crystals is red-brown.Single crystal diffraction
The large crystal aggregates were broken into small amber-coloured pieces. Specimen of good optical quality were pre-selected under a polarizing microscope, embedded in perfluorinated polyether and mounted on MiTeGen MicroLoops®. X-ray diffraction data were recorded on a Bruker APEX-II diffractometer, equipped with monochromatized Mo-Kα radiation, using ω- and φ-scans. The collection strategy was chosen (APEX3)27 to comprise the complete reciprocal sphere up to high angles and with high redundancy. After integration of the intensity data, a semi-empirical absorption correction (SADABS)28 was performed. The crystal structure was solved by using SHELXT29 and refined by using SHELXL.30 The monoclinic unit-cell in space group P21/c was chosen with unique axis b and cell choice 1.31 Atomic coordinates were adapted to demonstrate the symmetry-relationship to the rutile aristotype in a concise way.32 The CoTeO4 crystal under investigation showed a small contribution (8.7%) of a second domain that was correspondingly processed for the final data reduction (TWINABS).27 The final refinement is based on a HKLF5-type file containing reflections from the first domain and overlapping reflections.Numerical details of the data collection and structure refinement are compiled in Table 1. Selected bond lengths are given in Table 2, together with results of bond valence sum (BVS) calculations33 using the parameters of Brese and O’Keeffe.34 Further details of the crystal structure investigations may be obtained from the joint CCDC/FIZ Karlsruhe online deposition service: https://www.ccdc.cam.ac.uk/structures/by by quoting the deposition number specified at the end of Table 1.
| Formula | CoTeO4 |
| M r | 250.53 |
| Temp./°C | 25 |
| Crystal dimension/mm3 | 0.10 × 0.10 × 0.012 |
| Crystal color | Brown |
| Crystal form | Plate |
| Space group, no. | P21/c, 15 |
| Formula units Z | 2 |
| a/Å | 5.5635(12) |
| b/Å | 4.6675(10) |
| c/Å | 5.5424(12) |
| β/° | 112.321(6) |
| V/Å3 | 133.14(5) |
| μ/mm−1 | 16.975 |
| X-ray density/g cm−3 | 6.25 |
| θ min–θmax/° | 3.960–46.631 |
| h | −11 to 10 |
| k | 0 to 9 |
| l | 0 to 11 |
| Independent reflections | 1243 |
| Observed reflections (I > 2σ(I)) | 1073 |
| T min; Tmax | 0.4871; 0.7492 |
| No. of parameters | 33 |
| R1 (F2 > 2σ(F2)) | 0.0168 |
| wR2(F2 all) | 0.0450 |
| GOF | 1.082 |
| CSD number | 2265144 |
| Bond lengths | Current SC study | Synchrotron powder study | ||
|---|---|---|---|---|
| Co1– | O2 | 2× | 2.0619(11) | 1.967 |
| O2 | 2× | 2.0812(11) | 1.984 | |
| O1 | 2× | 2.1163(11) | 2.188 | |
| Average | 〈2.087〉 | 〈2.046〉 | ||
| Te1– | O2 | 2× | 1.8619(11) | 1.939 |
| O1 | 2× | 1.9625(10) | 2.101 | |
| O1 | 2× | 1.9667(10) | 1.963 | |
| Average | 〈1.930〉 | 〈1.992〉 | ||
| BVS | ||||
| Co1 | 2.07 | 2.38 | ||
| Te1 | 5.85 | 4.87 | ||
| O1 | 2.02 | 1.52 | ||
| O2 | 1.88 | 2.09 | ||
| Polyhedral volume/Å3 | [CoO6] | 11.641 | 10.997 | |
| [TeO6] | 9.493 | 10.519 | ||
| Quadratic elongation | [CoO6] | 1.027 | 1.029 | |
| [TeO6] | 1.007 | 1.012 | ||
| Angle variance/°2 | [CoO6] | 92.95 | 86.83 | |
| [TeO6] | 19.99 | 31.81 | ||
Laboratory powder X-ray diffraction (PXRD)
PXRD measurements were performed on a PANalytical X’Pert II Pro type PW 3040/60 diffractometer (Cu-Kα radiation, Bragg–Brentano geometry, X’Celerator detector) or on a Bruker D8 Advance diffractometer (Cu-Kα radiation, Bragg–Brentano geometry, LynxEye detector). Analyses of the powder diffraction data were carried out with the Highscore+ software suite35 or the DIFFRACT plus software.36 Results of the Rietveld analyses are given in the electronic ESI† (Tables S1–S3 and Fig. S1).Synchrotron powder X-ray diffraction (SPXRD)
The in situ synchrotron powder X-ray diffraction (SPXRD) measurements were carried out at the Brockhouse High Energy Wiggler Beamline, Canadian Light Source (CLS), Canada. The experimental heating apparatus consisted of a flow-cell furnace37 composed of a quartz capillary cell, capable of holding the sample in vacuum/inert gases atmosphere and surrounded by a helical coil connected to a source of electric current for controllable heating rate and natural convection cooling on the beam path. A thermocouple inserted into the capillary was used to monitor the temperature of the sample. A 2D PerkinElmer detector, 200 × 200 μm2 pixel size and 40 × 40 cm2 in area, was placed downstream of the powders in Kapton capillary, allowing data acquisition in a Debye–Scherrer/transmission mode. SPXRD patterns were acquired using a monochromatic focused beam of 30 keV. The calibrated X-ray wavelength and sample-to-detector distance from an Ni calibrant was λ = 0.4087 Å and 481.29 mm, respectively. An exposure time of 0.2 s was used and a total of 150 snapshots were acquired to ensure good data statistics. Obtained raw 2D diffraction patterns were integrated along each ring by the GSAS-II software.38 Then, the resulting 1D HE-SXRD profiles were analyzed using Rietveld refinement analysis39 in the 2θ range from 2 to 30°.Simultaneous thermal analysis (STA)
Complementary STA measurements made use of thermogravimetry/differential thermal analysis (TG/DTA) coupled with mass spectrometry (MS). STA measurements were performed with a ∼50 mg sample on a NETZSCH STA 449 C Jupiter system in the temperature range 30 → 900 °C (corundum crucibles, flowing argon atmosphere (40 ml min−1), heating rate 10 °C min−1) coupled with a quadrupol mass analyzer (QMS) Aeolos by using a silica capillary kept at 250 °C. The measured mass signals were 2 (H2), 12 (C), 14 (N), 15 (CH3), 16 (CH4, O), 17 (OH), 18 (H2O), 28 (N2, CO), 32 (O2), 44 (CO2) and 40 (Ar). A base line correction of the TG curve was carried out by measuring the empty crucible prior to the measurement.Chemical composition analysis
The Co:Te cationic ratio in the CoTeO4 single-crystals was determined from energy-dispersive X-ray spectroscopy (EDS) data, obtained using a ZEISS Leo 1550 field emission scanning electron microscope (SEM) equipped with an Aztec energy dispersive X-ray detector for spectroscopic analysis. Two single crystals were mounted onto conducting carbon tape, and EDS point analysis was performed using 20 kV on 11 spots per crystal. The oxidation states of the ions in CoTeO4 was determined using X-ray photoelectron spectroscopy (XPS), conducted using an Ulvac-Phi Quantera II spectrometer with monochromatic Al-Kα radiation (1486.7 eV). Samples were mounted electrically floating, and measured under constant charge neutralisation using low energy electrons and Ar+.40 The binding energy scale was referenced using the O 1s peak at 530.0 eV.Measurements of physical properties
Selected crystal aggregates of CoTeO4 (as grown by chemical transport reactions) were used for measurements of physical properties.The heat capacity data of a crystal aggregate was recorded as a function of temperature and magnetic fields using a Bluefors dilution refrigerator equipped with a superconducting magnet and a differential membrane-based nanocalorimeter.41 The dc- and ac-magnetic properties of a crystal aggregate were measured using a superconducting quantum interference device (SQUID) magnetometer from Quantum Design Inc. The magnetization M of the sample was recorded both as a function of temperature T at a fixed applied magnetic field, and as a function of magnetic field H at fixed temperature.
The dielectric properties of the sample were characterized using an Agilent E4980A Precision LCR Meter. The two-electrode configuration was achieved by applying silver paint on the opposite surfaces of a chosen crystal aggregate and attaching copper wires to each surface. The sample was mounted on a custom-made probe in a Physical Property Measurement System (PPMS) from Quantum Design Inc. The capacitance of the sample was measured as a function of temperature and magnetic field for various frequencies (100 Hz to 2 MHz).
Optical absorption spectroscopy
Unpolarized optical absorption spectra of CoTeO4 were recorded in the near ultraviolet (UV), visible (Vis), and near-infrared (NIR) spectral ranges between 32![[thin space (1/6-em)]](https://www.rsc.org/images/entities/char_2009.gif) 000 and 5500 cm−1 (3.97 to 0.68 eV) at a measuring spot of 50 μm in diameter, using a Bruker Hyperion 1000 microscope attached to a Bruker Vertex 80 FTIR spectrometer. To account for the strongly different absorption intensities in the NIR compared to the Vis and UV ranges, two crystal fragments with thicknesses of 30 and 5 μm, respectively, were investigated, using appropriate combinations of light sources (tungsten or xenon lamp), beam splitters (CaF2-NIR or CaF2-ViS/UV), and detectors (InGaAs-, Si- or GaP-diodes) to cover the desired spectral range. Hence, the full spectrum is combined from three partial spectra (32
000 and 5500 cm−1 (3.97 to 0.68 eV) at a measuring spot of 50 μm in diameter, using a Bruker Hyperion 1000 microscope attached to a Bruker Vertex 80 FTIR spectrometer. To account for the strongly different absorption intensities in the NIR compared to the Vis and UV ranges, two crystal fragments with thicknesses of 30 and 5 μm, respectively, were investigated, using appropriate combinations of light sources (tungsten or xenon lamp), beam splitters (CaF2-NIR or CaF2-ViS/UV), and detectors (InGaAs-, Si- or GaP-diodes) to cover the desired spectral range. Hence, the full spectrum is combined from three partial spectra (32![[thin space (1/6-em)]](https://www.rsc.org/images/entities/char_2009.gif) 000 to 18
000 to 18![[thin space (1/6-em)]](https://www.rsc.org/images/entities/char_2009.gif) 000 cm−1: spectral resolution 40 cm−1, averaged from 512 scans; 18
000 cm−1: spectral resolution 40 cm−1, averaged from 512 scans; 18![[thin space (1/6-em)]](https://www.rsc.org/images/entities/char_2009.gif) 000 to 10
000 to 10![[thin space (1/6-em)]](https://www.rsc.org/images/entities/char_2009.gif) 000 cm−1: resolution 20 cm−1, 256 scans; 10
000 cm−1: resolution 20 cm−1, 256 scans; 10![[thin space (1/6-em)]](https://www.rsc.org/images/entities/char_2009.gif) 000 to 5500 cm−1: resolution 10 cm−1, 128 scans), which were aligned in absorbance for perfect match, if necessary, and calculated to linear absorption coefficient α (cm−1).
000 to 5500 cm−1: resolution 10 cm−1, 128 scans), which were aligned in absorbance for perfect match, if necessary, and calculated to linear absorption coefficient α (cm−1).
Computational investigations
Density functional theory (DFT) calculations on CoTeO4 were performed with the Wien2k code,42 which is based on the all electron full-potential Augmented-Plane-Wave (APW) method. Starting with the experimentally determined single-crystal structural data, the free positions of the O atoms were optimized (ESI,† Table S2) both at the level of generalized gradient approximation (PBE-GGA)43 and also PBE+U (with U = 4.08 or 5.44 eV for Co 3d states).44 We adopted an antiferromagnetic order, splitting the two symmetry-related Co atoms in the unit cell into spin-up and spin-down. The electronic structure, the band gap and the absorption spectra were calculated with different functionals (PBE+U, TB-mBJ,45 TB-mBJ+U46 and a YS-PBE0 hybrid functional,47 which is closely related to the well-known HSE-functional).48 The calculations were initialized with “-prec 2”, resulting into atomic spheres of 2.04, 1.84 and 1.58 Bohr for Co, Te and O, respectively, a plane wave cutoff parameter RKmax = 7.5 and a 15 × 16 × 15 k-mesh. Besides the usual valence states, also Co-3s,3p and Te-4p,4d states were treated as band states using local orbitals.The optical properties have been calculated using the OPTIC module49 of WIEN2k. The imaginary part of the dielectric function ε2 has been obtained from the direct transitions including the corresponding dipole matrix elements, and via a Kramers–Kronik transformation the real part of ε is calculated. Once these quantities are known, the other optical properties (e.g. the absorption) follow from well-known relations.
Results and discussion
The crystal structure of CoTeO4 has previously been determined from laboratory PXRD data in space group P21/n.‡ In the corresponding model,19 the Co and Te atoms equally occupy the same general site (4 e), and the two oxygen atoms likewise are situated on a general site each. Due to the mixed (Co,Te) occupancy, the resulting M–O bond lengths spread largely from 1.792(5) to 2.209(2) Å for the resulting [MO6] octahedron, which is too short for a typical CoII–O bond (mean 2.108 Å for coordination number (CN) = 6)50 and too long for a typical TeVI–O bond (mean 1.923 Å for CN = 6).51 In general, it appears unlikely that a divalent cation (for CoII the ionic radius is 0.745 Å for high-spin configuration)52 shares the same site with a highly charged TeVI atom (0.56 Å).52![[thin space (1/6-em)]](https://www.rsc.org/images/entities/char_2009.gif) §
§
The current crystal structure refinement of CoTeO4 based on single-crystal X-ray data clearly revealed that the previous model19 is incorrect. In fact, Co and Te are situated on two distinct sites, 2 a and 2 d, respectively, each with site symmetry ![[1 with combining macron]](https://www.rsc.org/images/entities/char_0031_0304.gif) . The resulting bond lengths (Table 2) are in the characteristic ranges and comply with the expected mean bond lengths given above.
. The resulting bond lengths (Table 2) are in the characteristic ranges and comply with the expected mean bond lengths given above.
A recent structure determination of CoTeO4 based on high-resolution synchrotron radiation from nanocrystalline material20 likewise revealed the inaccuracy of the original structure model,19 and two distinct Co and Te positions were refined, similar to our model based on single-crystal data. However, the Co and Te atoms are swapped on respective Wyckoff positions, i.e. 2 b for Co and 2 c for Te, which corresponds to a shift of 1/2 0 0 in the unit cell. In comparison with the model derived from synchrotron data, our current redetermination reveals more satisfactory bond valence sums (close to the expected values of 2, 6 and 2 for Co, Te and O atoms), all atoms with anisotropic displacement parameters, standard uncertainties for the atomic coordinates, and shows considerable improvement in terms of higher precision and accuracy regarding bond lengths and angles (Table 2; ESI,† Tables S1–S3).
CoTeO4 crystallizes in a dirutile-type structure and is isotypic with LiCoIIIF4,54 LiMnIIIF455 and CuIIUVIO4.56 Baur has described the relation of these cation-ordered dirutile structures (abbreviated as CUU) to the rutile structure (RUT) in detail.21 The symmetry-relationship32 between the rutile aristotype and the CUU hettotype of CoTeO4 is graphically represented in Fig. 3 in form of a Bärnighausen tree.57 In a first step, a translationengleiche (t2) symmetry reduction takes place from the rutile structure58 to the CaCl2 structure,59 followed by a subsequent t2 symmetry reduction to the CuF2 structure.60 In the last step, an isomorphe (i2) symmetry reduction with a doubling of the unit cell occurs due to the cation ordering of CoII and TeVI in the CoTeO4 structure.
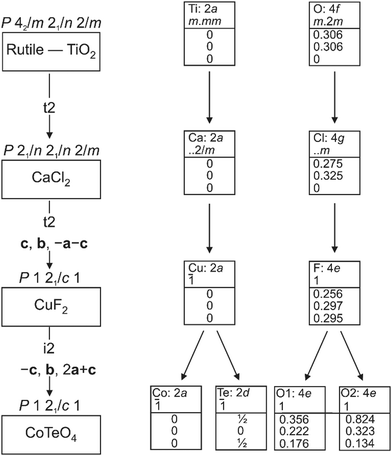 | ||
| Fig. 3 Bärnighausen tree showing the symmetry relationship between the rutile aristotype and the CoTeO4 hettotype. | ||
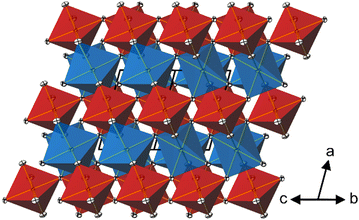
In the crystal structure of CoTeO4, [CoO6] octahedra share common corners, forming 1∝[CoO2/2O4/1] chains running along [011]. The Co–O bond lengths are similar (Table 2), leading to a far smaller octahedral distortion61 (Table 2) than in the isotypic congeners.21 Adjacent 1∝[CoO2/2O4/1] chains are joint at the same height (at x = 0) through additional corner-sharing, resulting in a cobalt(II) oxide layer 2∝[CoO4/2O2/2] extending parallel to (100). The same kind of connection occurs for the [TeO6] octahedra to form a 2∝[TeO4/2O2/2] tellurium oxide layer (at x = 1/2). Common corners and edges link the two alternating layers into the tri-periodic structure. Edge-sharing occurs between alternating [CoO6] and [TeO6] octahedra in rows parallel to [101] (Fig. 4). Like in the rutile aristotype, the oxygen atoms coordinate to three positively charged atoms, viz. O1 to two Te and one Co, and O2 to two Co and one Te.
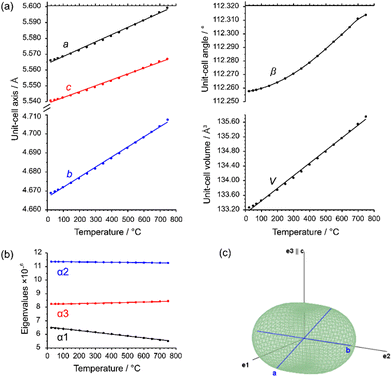
The shortest distances between the cations (CoII⋯TeVI; CoII⋯CoII; TeVI⋯TeVI) are all greater than 3.0 Å (CoII⋯TeVI ∼ 3.09 Å; CoII⋯CoII ∼3.62 Å; TeVI⋯TeVI ∼3.62 Å), precluding any bonding interactions between them as observed for rutile-type VO2 and its monoclinic polymorph where V⋯V separations of 2.85 Å and alternating short (2.62 Å) and long (3.17 A) separations, respectively, are observed.62 In CoTeO4, interatomic Co⋯Te distances monotonically increase with heating in the region of existence of this phase (Fig. 5–7(a)).
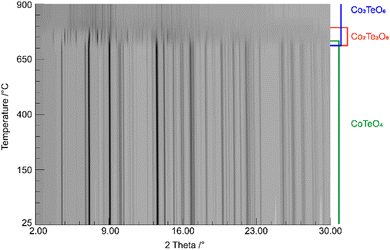 | ||
| Fig. 5 Temperature-dependent SPXRD in situ study of CoTeO4 using a wavelength of 0.4087 Å. The existence range of present phases is indicated on the right. | ||
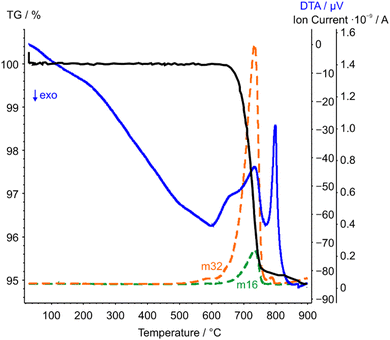 | ||
| Fig. 6 STA-MS measurement curves of CoTeO4 (TG curve black, DTA curve blue). Only the mass signals (dashed lines) with significant intensities with respect to the ion current are displayed. | ||
Thermal behavior
CoTeO4 shows no temperature-induced structural phase transition from room-temperature to the end of its stability range at ∼700 °C. According to Singh et al.,17 intermediately formed CoTeO4 (starting from Co3O4/TeO2 mixtures) becomes unstable above 700 °C and successively transforms to Co3TeO6. In contrast to this ex situ study, our current temperature-dependent in situ SPXRD study is based on single-phase CoTeO4 (Fig. 5). Although under atmospheric conditions the final product at 900 °C is likewise single-phase Co3TeO6, the temperature-dependent SPXRD study clearly revealed spiroffite-type Co2Te3O863 as an intermediate phase that is present between the decomposition of CoTeO4 at ∼700 °C and the formation of Co3TeO664 at ∼770 °C (Fig. 5).Hence, the overall decomposition can be formulated by eqn (1):
 | (1) |
Above 700 °C, TeO2 suggested as a decomposition product, shows no reflections, because it either forms as an amorphous phase or is already molten (melting point 733 °C).65
The complementary STA-MS measurement (Fig. 6) reveals an onset for the CoTeO4 decomposition at 665 °C in the TG curve (end point 747 °C), with an overall mass loss of 4.8% (theory according to eqn (1): 4.3%). The observed masses of the released gases (m = 16, 32) correspond solely to oxygen, underpinning the decomposition reaction formulated in eqn (1). The two endothermic effects in the DTA signal with onsets and peak maxima at 677/733 °C and 782/799 °C indicate the decomposition of CoTeO4 under formation of Co2Te3O8, and the subsequent decomposition of Co2Te3O8 under formation of Co3TeO6, respectively. The decomposition/formation temperatures determined from temperature-dependent SPXRD and STA-MS data differ due to different placements of thermocouples for temperature control, and different heating rates and atmospheres applied in the two measurement procedures (slow heating and holding times, atmospheric conditions for PXRD versus fast heating times, Ar atmosphere for STA-MS).
The evolution of unit-cell parameters with temperature of dirutile-type CoTeO4 is depicted in Fig. 7(a) and shows a linear increase of the unit-cell volume from room temperature up to the end of its stability region. On basis of the formalism in the infinitesimal temperature limit introduced by Paufler and Weber,66 the TEV software67 has been used for calculation of the components of the thermal expansion tensor αij. For the definition of the second rank tensor within the TEV program, the following orthogonalized coordinate system was used: e3 is parallel to c, e2 is parallel to b* and e1 = e2 × e3. The resulting symmetrical tensor has six independent components (α11, α22, α33, α12, α13, α23). Owing to the symmetry restrictions of the monoclinic crystal system with unique axis b, the components α12 and α23 are zero. The regression curves for description of unit-cell parameters and the temperature-dependent numerical values for the four tensor components of CoTeO4 are compiled in Table S4 in the ESI.† After transformation to principal axes, the tensor can be simplified and is described by only three independent components (α1, α2, α3). The dependence on temperature of these eigenvalues is shown in Fig. 7(b). Whereas each individual expansion coefficient shows only subtle changes with temperature, the expansion coefficient α2 has about twice the absolute value of the smallest eigenvalue α1, making the thermal expansion in CoTeO4 anisotropic. The representation of the tensor and its anisotropy in form of a surface in three-dimensional space is exemplified in Fig. 7(c) for the 500 °C data. It can be seen that the strongest expansion is along the b axis that exactly coincides with eigenvalue α2 and the corresponding eigenvector. The lowest expansion is perpendicular to this direction.
Chemical composition
The elemental composition as determined by EDS is in very good agreement with the nominal one, yielding the chemical formula of Co1.01(1)Te0.99(1)O4 (ESI;† Table S5 and Fig. S2).For pristine crystals, a significant surface contamination by carbon was revealed by XPS measurements (see ESI,† Fig. S3), most probably caused by immersing the crystals in acetone for selection. The surface contamination significantly decreased after temperature annealing (500 °C for two hours) in air. The XPS spectra suggest that cobalt and tellurium are solely present as CoII and TeVI, respectively. The high-resolution core-level binding energy revealed well-resolved chemical states corresponding to Co 2p, Te 3d, O 1s (and C 1s) levels (ESI,† Fig. S3). The core level XPS spectrum of Co 2p consist of a large peak at 780.3 eV and a broad satellite approximately 6 eV from the main peak, as expected for CoII but not for CoIII.68 The Te 3d core level spectrum consist of two major peaks located at 576.0 and 586.4 eV, consistent with TeVI.69
Caloric properties
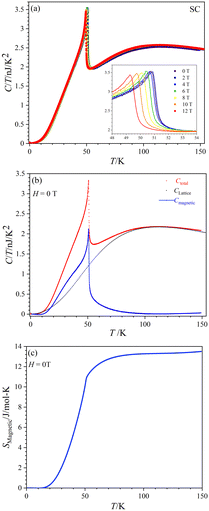
Fig. 8(a) displays the total specific heat (C) divided by temperature (T) of a CoTeO4 crystal measured in different magnetic fields (0 ≤ H ≤ 12 T) over a broad temperature range from 0.1 to 151 K. The position of the sharp peak is shifted from 50.9 K to 49.2 K by an increase of the applied magnetic field from 0 to 12 T (see inset), however without significant changing in the C/T value. This behavior suggests that the system undergoes an antiferromagnetic (AFM) phase transition.
Fig. 8(b) shows the calculated magnetic specific heat (Cmagnetic, blue color) of CoTeO4 at zero magnetic field, after subtracting from the total specific heat (Ctotal, red color) the high temperature lattice contributions (Clattice, black color) estimated from a Debye model. Moreover, the magnetic entropy (Smagnetic) was calculated from Cmagnetic using the following equation,  , as shown in Fig. 8(c), which reveals a sharp release of the magnetic entropy near the transition temperature.
A gradual increase of the magnetic entropy is observed in the high temperature region, with the magnitude (13 J mol−1 K−1) being higher than the spin-only value of 11.51 J mol−1 K−1 (R![[thin space (1/6-em)]](https://www.rsc.org/images/entities/char_2009.gif) ln(2S + 1)) of CoII (3d7, S = 3/2). Such discrepancy might have an intrinsic origin, related to the orbital component of the CoII moments. However, we cannot exclude that it could also originate from the determination of Clattice, as well as uncertainties on the volume of the investigated crystal.
ln(2S + 1)) of CoII (3d7, S = 3/2). Such discrepancy might have an intrinsic origin, related to the orbital component of the CoII moments. However, we cannot exclude that it could also originate from the determination of Clattice, as well as uncertainties on the volume of the investigated crystal.
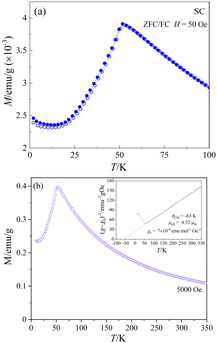
Magnetic susceptibilities
Fig. 9(a) shows the temperature-dependent dc-magnetization measured as a function of temperature under zero-field-cooled (ZFC) and field-cooled (FC) conditions in an external dc-magnetic field, H = 50 Oe. Both ZFC and FC curves show a peak maximum around 51.6 K and no divergence in the entire temperature region, indicating the onset of AFM long-range ordering, in agreement with the sharp peak observed near 50.9 K in the heat capacity data (Fig. 8). The linear M(H) curves measured at different temperatures below the magnetic transition provides further evidence of typical AFM behavior (see ESI,† Fig. S4) at low temperatures. Fig. 9(b) shows the M(T) data measured at 5 kOe under ZFC condition. The inset of Fig. 9(b) shows the temperature dependence of the corresponding inverse of the susceptibility (χ − χ0)−1 where χ = M/H and χ0 is a background contribution. The high temperature susceptibility data from 70 K to 300 K was fitted to the Curie–Weiss (CW) law, χ = C/(T − θCW) + χ0, where C and θCW represents the Curie constant and Curie–Weiss temperature, respectively.The straight-line fitting of the inverse susceptibility vs. temperature data yields C = 2.47 emu K mol−1 Oe− and θCW = −63 K. The negative sign and the value of θCW indicates AFM interactions and relatively weak frustration effects.70 The effective paramagnetic moment μeff calculated from C (= NAμeff2/3kB) is 4.52 μB per Co. This value is considerably greater than the spin-only value of μspin = 3.87 μB for high-spin CoII cations (3d7, S = 3/2), indicating an unquenched orbital moment, e.g. stemming from an unevenly occupied degenerate t2g-state of the central CoII cation in the coordination polyhedron. Similar values of μeff for CoII in an oxidic environment were also observed in various system such as Co3TeO6 (4.70 μB),11 Sr2CoWO6 (5.2 μB),71 or Ba2CoO2Cu2S2 (4.45 μB).72
Dielectric properties
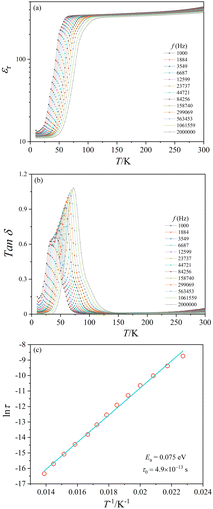
The present crystal aggregates have relatively small sizes. Nonetheless, dielectric measurements were attempted. The temperature dependence of the relative dielectric constant (εr) and the dielectric loss (Tan![[thin space (1/6-em)]](https://www.rsc.org/images/entities/char_2009.gif) δ) of CoTeO4 at variable frequencies (1 kHz ≤ H ≤ 2 MHz) and in zero magnetic field is shown in Fig. 10. ESI,† Fig. S5 shows εr(T) and Tan
δ) of CoTeO4 at variable frequencies (1 kHz ≤ H ≤ 2 MHz) and in zero magnetic field is shown in Fig. 10. ESI,† Fig. S5 shows εr(T) and Tan![[thin space (1/6-em)]](https://www.rsc.org/images/entities/char_2009.gif) δ(T) for 1.06 MHz at 0 and 10 kOe magnetic fields, and ESI,† Fig. S6 displays εrvs. f and Tan
δ(T) for 1.06 MHz at 0 and 10 kOe magnetic fields, and ESI,† Fig. S6 displays εrvs. f and Tan![[thin space (1/6-em)]](https://www.rsc.org/images/entities/char_2009.gif) δ vs. f plots of CoTeO4 crystals at different temperatures.
δ vs. f plots of CoTeO4 crystals at different temperatures.
The value of the dielectric constant reveals a relatively weak temperature (T) and frequency (f) dependence while decreasing the sample temperature from room temperature down to 100 K, followed by a sharp decrease of approximately 90% until the temperature decreases to 50 K. Below 50 K, the εr value is almost constant. The shift of the εr value to higher temperature with increasing frequency in the temperature range of 50 K < T < 100 K indicates a relaxor-like behavior. The sharp increase of the dielectric loss peak around 55 K (Fig. 10(b)) is consistent with the decrease of the dielectric constant. Fig. 10(b) shows also that the Tan![[thin space (1/6-em)]](https://www.rsc.org/images/entities/char_2009.gif) δ peak shifts to higher temperature with increasing frequency, which corresponds to a thermally activated relaxation process. The peak maxima of the Tan
δ peak shifts to higher temperature with increasing frequency, which corresponds to a thermally activated relaxation process. The peak maxima of the Tan![[thin space (1/6-em)]](https://www.rsc.org/images/entities/char_2009.gif) δ curve can be plotted using an Arrhenius equation: τ = τ0 exp(Ea/kBT), where τ = 1/2πf and kB is the Boltzmann constant (Fig. 10(c)). The straight-line fitting gives the activation energy, Ea ≈ 0.07 eV, and the relaxation time, τ0 ≈ 4.9 × 10⁻¹³+/−1 s.
δ curve can be plotted using an Arrhenius equation: τ = τ0 exp(Ea/kBT), where τ = 1/2πf and kB is the Boltzmann constant (Fig. 10(c)). The straight-line fitting gives the activation energy, Ea ≈ 0.07 eV, and the relaxation time, τ0 ≈ 4.9 × 10⁻¹³+/−1 s.
DFT calculations and electronic structure
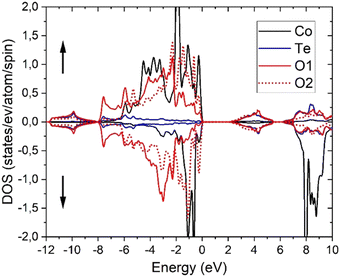
As generally accepted and therefore expected,44,46 PBE calculations are not suitable for the correlated Co-3d electrons as can be seen from the fact that it would lead to a metallic state and rather short Co–O and large Te–O equilibrium distances (ESI,† Table S3). Therefore, the atomic positions of oxygen were also relaxed using PBE+U and, as evident from Tables S2 and S3 (ESI†), a much better agreement with the experimental single crystal results is obtained from the latter calculations. Using the relaxed PBE+U (4.08) structure, PBE+U, TB-mBJ, TB-mBJ+U and YS-PBE0 hybrid-DFT calculations yield a material with semiconductive behavior with direct band gaps at Γ of 0.61, 1.31, 2.14 and 1.60 eV, respectively. Similarly, the obtained spin magnetic moments vary with the DFT approximation as 2.70, 2.76, 2.82 and 2.70 μB, while plain PBE would get a significantly smaller moment of 2.50 μB. These values are similar as in CoO (2.72 μB with TB-mBJ)73 and indicative for CoII ions with significant covalent interactions with oxygen atoms. On the other hand, the orbital moment remains smaller (0.15 μB with PBE+U) than in CoO.74 The density of states (DOS) comprises basically four parts (Fig. 11 for TB-mBJ+U calculations). The lowest one, between −12 and −8 eV consists mainly of bonding Te-s–O-sp states, followed by the main valence band of predominantly Co-3d and O-2p states together with a small Te-6p contribution. The Co-3d states are spin-splitted, leading to a CoII high-spin state with fully occupied majority (spin-up) states but only partially occupied spin-down bands. The O-2p states of the two different oxygen atoms in the structure are strongly shifted in energy with O2 being less ionic (see also the BVS values in Table 2) due to two Co and only one Te nearest neighbors (nn), while the O1 site has two Te and only one Co nn. This correlates with an about 1 eV XPS core level shift of the O-1s states with O2 states at larger binding energies. The first conduction band states are mainly derived from antibonding Te-6p–O-2p states followed by the Co-3d spin-down bands. The detailed bandwidth and the possible separation of those four band regions depend crucially on the specific choice of the DFT approximation.Optical spectroscopy and computational investigation
The brownish color of CoTeO4 is rather unusual for CoII-containing oxidic compounds, which usually appear with a pinkish color (in octahedral coordination) or bluish color (in tetrahedral coordination).75Fig. 12 shows the unpolarized optical absorption spectrum of CoTeO4. It is characterized on the one hand by comparatively weak absorption features within the NIR spectral region, on the other hand by an absorption edge strongly ascending within the visible spectral range towards the UV region.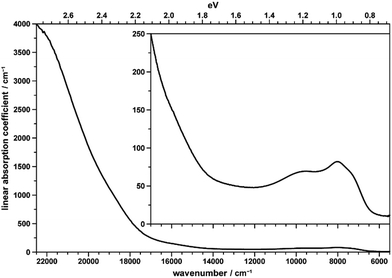 | ||
| Fig. 12 Unpolarized absorption spectrum of a thin CoTeO4 crystal. The inset shows the data on the smaller y-range. | ||
The NIR absorption bands (inset in Fig. 12) correspond to the first spin-allowed crystal field transition of high-spin CoII in octahedral coordination, i.e.4T1g(F) → 4T2g(F), split by the distortion of the [CoO6] polyhedron from ideal cubic symmetry, with components located around 7200 (shoulder), 7970, and 9750 cm−1. The second spin-allowed, but – as two-electron jump in the strong field limit – electronically forbidden and thus weak 4T1g(F) → 4A2g(F) transition, might be spotted roughly around 15![[thin space (1/6-em)]](https://www.rsc.org/images/entities/char_2009.gif) 900 cm−1, within the onset of the absorption edge (see inset in Fig. 12). Finally, the third and usually most intense 4T1g(F) → 4T1g(P) crystal field transition is located around 18
900 cm−1, within the onset of the absorption edge (see inset in Fig. 12). Finally, the third and usually most intense 4T1g(F) → 4T1g(P) crystal field transition is located around 18![[thin space (1/6-em)]](https://www.rsc.org/images/entities/char_2009.gif) 750 cm−1 within the ascent of the absorption edge, thus slightly reducing its slope up to ∼20
750 cm−1 within the ascent of the absorption edge, thus slightly reducing its slope up to ∼20![[thin space (1/6-em)]](https://www.rsc.org/images/entities/char_2009.gif) 000 cm−1; quite evidently, for 4T1g(P) no low-symmetry band splitting could be extracted. The observed approximate crystal field transition energies correspond to a comparatively high crystal field strength parameter of ∼875 cm−1,76 in agreement with the rather small average Co–O distance of 2.087 Å in CoTeO4; the interelectronic repulsion parameter Racah B is ∼800 cm−1.
000 cm−1; quite evidently, for 4T1g(P) no low-symmetry band splitting could be extracted. The observed approximate crystal field transition energies correspond to a comparatively high crystal field strength parameter of ∼875 cm−1,76 in agreement with the rather small average Co–O distance of 2.087 Å in CoTeO4; the interelectronic repulsion parameter Racah B is ∼800 cm−1.
The strong increase of the absorption edge towards higher energies, roughly setting in around 17![[thin space (1/6-em)]](https://www.rsc.org/images/entities/char_2009.gif) 500 cm−1, is responsible for the brownish color of CoTeO4.
500 cm−1, is responsible for the brownish color of CoTeO4.
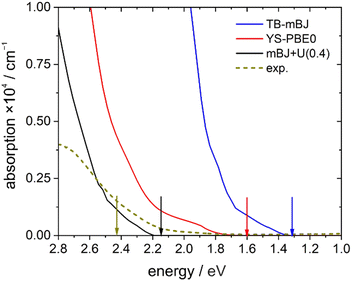
A direct comparison between the experimental absorption spectrum and the different DFT calculations revealed that the TB-mBJ+U (4.08 eV) functional fits best to the onset and slope of the experimental absorption curve, followed by hybrid functional (YS-PBE0) calculations (Fig. 13). From such a comparison one would estimate that the TB-mBJ+U calculation results in a slightly too large band gap, while the YS-PBE0 gap is too small. This is in contrast to the band gaps derived directly from the DFT calculations and the experimental Tauc-plot, see below.
Assuming a direct bandgap (as found in the DFT calculations), a Tauc plot77 applied to the linearly increasing absorption above ∼20![[thin space (1/6-em)]](https://www.rsc.org/images/entities/char_2009.gif) 000 cm−1 (i.e. the region not affected by the 4T1g(P) crystal field band) reveals an experimental band gap of 2.42 eV (Fig. 14), a value also found for CdS,78 which is one of the most promising photovoltaic materials available for low-cost high-efficiency solar cells.79 In that regard, CoTeO4 might replace the environmentally hazardous CdS in photovoltaic devices.
000 cm−1 (i.e. the region not affected by the 4T1g(P) crystal field band) reveals an experimental band gap of 2.42 eV (Fig. 14), a value also found for CdS,78 which is one of the most promising photovoltaic materials available for low-cost high-efficiency solar cells.79 In that regard, CoTeO4 might replace the environmentally hazardous CdS in photovoltaic devices.
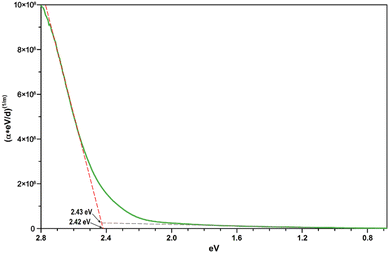 | ||
| Fig. 14 Direct bandgap Tauc plot derived from the unpolarized transmission spectrum of CoTeO4 using a crystal plate with a thickness of ∼5 μm. | ||
The experimentally found band gap (2.42 eV) from the Tauc-plot (Fig. 14) is slightly larger than the TB-mBJ+U gap (2.14 eV), while the YS-PBE0 hybrid-DFT gap (1.60 eV) and in particular TB-mBJ or PBE+U calculations yield significantly smaller gaps (Fig. 13). This is not unreasonable since it is well documented that both TB-mBJ and hybrid-DFT functionals yield reasonable band gaps for sp semiconductors,80–82 but their effect on transition metal 3d states might be too small.46,83 On the other hand, a Hubbard-U correction for the 3d states yield the desired splitting between occupied and unoccupied 3d bands, but since the sp states of the main group elements are not affected, the resulting band gap might still be too small and only a combination of TB-mBJ+U yields reasonable band gaps in transition metal oxides.
Conclusions
Chemical vapor transport reactions with TeCl4 as transport were employed to grow CoTeO4 crystals in the millimeter range. High-quality crystals grown this way were used for the determination of the chemical composition, for crystal structure refinement and measurement of physical properties. The current single-crystal X-ray data clearly showed that the originally reported structure model for dirutile-type CoTeO419 is incorrect. The refined crystal structure model in the centrosymmetric space group P21/c excludes the prospect of using this material as a polar dielectric. Thermal analysis and temperature-dependent synchrotron diffraction studies revealed that CoTeO4 does not undergo a temperature-dependent structural phase transition in the stability field from room temperature up to 700 °C, and current pressure-dependent Raman spectroscopy studies84 likewise showed no structural phase transition of CoTeO4 up to pressures of ∼10 GPa. Heat capacity and magnetic susceptibility measurements indicated an antiferromagnetic ordering of CoTeO4 at ∼50 K, in the vicinity of which dielectric relaxation is observed. Neutron diffraction measurement for determination of the magnetic structure of CoTeO4 are planned in near future. Optical absorption spectroscopy on a thin single-crystal plate was used to experimentally determine the band gap. Complementary computational studies on the basis of different DFT models showed that the TB-mBJ+U functional resulted in a band gap of 2.14 eV that matches best the experimentally found value of 2.42 eV, whereas the experimental absorption spectrum edge is in the middle of the TB-mBJ+U and the YS-PBE0 hybrid calculations.Author contributions
Matthias Weil: conceptualization, investigation, data curation, project administration, resources, supervision, validation, writing – original draft, writing – review and editing; Prativa Pramanik: investigation, data curation; Pierfrancesco Maltoni: investigation; Rebecca Clulow: investigation; Andreas Rydh: investigation; Manfred Wildner: investigation, data curation; Peter Blaha: investigation, data curation, writing – original draft; Graham King: investigation, data curation; Sergey A. Ivanov: conceptualization, writing – original draft; Roland Mathieu: investigation, data curation, project administration, resources, supervision, writing – original draft, writing – review and editing; Harishchandra Singh: investigation, data curation.Conflicts of interest
There are no conflicts to declare.Acknowledgements
We thank Erik Lewin for his help with the XPS measurements and analyses. We also thank Christian Gierl-Mayer for his help for the STA measurements. R. C. acknowledges the SSF contract number EM-16-0039 and Åforsk contract 22-92. We acknowledge Myfab Uppsala for providing facilities and experimental support. Myfab is funded by the Swedish Research Council (2019-00207) as a national research infrastructure. The authors acknowledge the X-ray centre of TU Wien for providing free access to single crystal and powder X-ray diffraction instruments, and TU Wien Bibliothek for financial support through its Open Access Funding Program. P. P. and R. M. thank Stiftelsen Olle Engkvist Byggmästare (grant no. 207-0427) for financial support. R. C. acknowledges the SSF contract number EM-16-0039. Research conducted by S. A. I. was carried out with the financial support of the RSF (grant 22-13-00122). Part of the research described in this work was performed at the Canadian Light Source, a national research facility of the University of Saskatchewan, which is supported by the Canada Foundation for Innovation (CFI), the Natural Sciences and Engineering Research Council (NSERC), the National Research Council (NRC), the Canadian Institutes of Health Research (CIHR), the Government of Saskatchewan, and the University of Saskatchewan. EU/Interreg Aurora/Sustainable Hydrogen project is also acknowledged for financial support.Notes and references
- A. G. Christy, S. J. Mills and A. R. Kampf, A review of the structural architecture of tellurium oxycompounds, Mineral. Mag., 2018, 80, 415–545 CrossRef.
- M. T. Sebastian, H. Wang and H. Jantunen, Low temperature co-fired ceramics with ultra-low sintering temperature: a review, Curr. Opin. Solid State Mater. Sci., 2016, 20, 151–170 CrossRef CAS.
- A. Bhim, J. Gopalakrishnan and S. Natarajan, Exploring the Corundum Structure as a Host for Colored Compounds – Synthesis, Structures, and Optical Studies of (MM′)3TeO6 (M = Mg, Mn, Co, Ni, Zn; M′ = Mg, Mn, Co, Ni, Cu), Eur. J. Inorg. Chem., 2018, 2277–2284 CrossRef CAS.
- D. Reichartzeder, M. Wildner, M. Weil, S. A. Ivanov, A. Stash and Y. S. Chen, Crystal chemistry, optical spectroscopy and crystal field calculations of Co3TeO6 and solid solutions Co3−xZnxTeO6, Eur. J. Inorg. Chem., 2018, 4221–4233 CrossRef CAS.
- N. V. Golubko, V. Yu Proidakova, G. M. Kaleva, S. A. Ivanov, A. V. Mosunov, S. Yu Stefanovich, N. V. Sadovskaya, E. D. Politova and P. Nordblad, Synthesizing and investigating the structure and phase transitions in A3TeO6 (A—Mn, Co, Ni) oxides, Bull. Russ. Acad. Sci.: Phys., 2010, 74, 724–726 Search PubMed.
- I. Živković, K. Prša, O. Zaharko and H. Berger, Ni3TeO6—a collinear antiferromagnet with ferromagnetic honeycomb planes, J. Phys.: Condens. Matter, 2010, 22, 056002 CrossRef PubMed.
- S. A. Ivanov, P. Nordblad, R. Mathieu, R. Tellgren, C. Ritter, N. V. Golubko, E. D. Politiva and M. Weil, New type of incommensurate magnetic ordering in Mn3TeO6, Mater. Res. Bull., 2011, 46, 1870–1877 CrossRef CAS.
- R. Mathieu, S. A. Ivanov, P. Nordblad and M. Weil, Enhancement of antiferromagnetic interaction and transition temperature in M3TeO6 systems (M = Mn, Co, Ni, Cu), Eur. Phys. J., 2013, B 86, 361 CrossRef.
- J. Fernández-Catalá, H. Singh, S. Wang, H. Huhtinen, P. Paturi, Y. Bai and W. Cao, Hydrothermal Synthesis of Ni3TeO6 and Cu3TeO6 Nanostructures for Magnetic and Photoconductivity Applications, ACS Appl. Nano Mater., 2023, 6, 4887–4897 CrossRef PubMed.
- S. A. Ivanov, R. Tellgren, C. Ritter, P. Nordblad, R. Mathieu, G. André, N. V. Golubko, E. D. Politova and M. Weil, Temperature-dependent multi-k magnetic structure in multiferroic Co3TeO6, Mater. Res. Bull., 2012, 47, 63–72 CrossRef CAS.
- M. Hudl, R. Mathieu, S. V. Ivanov, M. Weil, V. Carolus, T. Lottermoser, M. Fiebig, Y. Tokunaga, Y. Taguchi, T. Tokura and P. Nordblad, Complex magnetism and magnetic-field-driven electrical polarization of Co3TeO6, Phys. Rev. B: Condens. Matter Mater. Phys., 2011, 84, 180404 CrossRef.
- W.-H. Li, C.-W. Wang, D. Hsu, C.-H. Lee, C.-M. Wu, C.-C. Chou, H.-D. Yang, Y. Zhao, S. Chang, J. W. Lynn and H. Berger, Interplay between the magnetic and electric degrees of freedom in multiferroic Co3TeO6, Phys. Rev. B: Condens. Matter Mater. Phys., 2012, 85, 094431 CrossRef.
- C.-H. Lee, E. Batsaikhan, M.-H. Ma, W.-H. Li, C.-W. Wang, C.-M. Wu, H.-D. Yang, J. W. Lynn and H. Berger, Charge transfer enhanced magnetic correlations in type-II multiferroic Co3TeO6, J. Chin. Chem. Soc., 2021, 68, 395–402 CrossRef CAS.
- H. Singh, H. Ghosh, T. V. Chandrasekhar Rao, G. Sharma, J. Saha and S. Patnaik, Short range ferromagnetic, magneto-electric, and magneto-dielectric effect in ceramic Co3TeO6, J. Appl. Phys., 2016, 119, 044104 CrossRef.
- E. Solana-Madruga, C. Aguilar-Maldonado, C. Ritter, M. Huvé, O. Mentré, J. P. Attfield and Á. M. Arévalo-López, Complex magnetism in Ni3TeO6-type Co3TeO6 and high-pressure polymorphs of Mn3−xCoxTeO6 solid solutions, Chem. Commun., 2021, 57, 2511–2514 RSC.
- E. Selb, T. Buttlar, O. Janka, M. Tribus, S. G. Ebbinghaus and G. Heymann, Multianvil high-pressure/high-temperature synthesis and characterization of magnetoelectric HP-Co3TeO6, J. Mater. Chem. C, 2021, 9, 5486–5496 RSC.
- H. Singh, A. K. Sinha, S. M. Gupta, M. N. Singh and H. Ghosh, Insight into the Growth Reaction Mechanism of Ceramic Co3TeO6: Synchrotron Structural and Thermal Analysis., J. Am. Ceram. Soc., 2016, 99, 3443–3448 CrossRef CAS.
- J. Sikač and L. Jenšovský, The preparation and properties of cobalt(II) tellurates, Collect. Czech. Chem. Commun., 1980, 45, 2489–2498 CrossRef.
- J. Isasi, New MM’O4 oxides derived from the rutile type: synthesis, structure and study of magnetic and electronic properties, J. Alloys Compd., 2001, 322, 89–96 CrossRef CAS.
- A. K. Patel, M. R. Panda, E. Rani, H. Singh, S. S. Samatham, A. Nagendra, S. N. Jha, D. Bhattacharyya, K. G. Suresh and S. Mitra, Unique Structure-Induced Magnetic and Electrochemical Activity in Nanostructured Transition Metal Tellurates Co1–xNixTeO4 (x = 0, 0.5, and 1), ACS Appl. Energy Mater., 2020, 3, 9436–9448 CrossRef CAS.
- W. H. Baur, The rutile type and its derivatives, Crystallogr. Rev., 2007, 13, 65–113 CrossRef CAS.
- A. Fujishima and K. Honda, Electrochemical photolysis of water at a semiconductor electrode, Nature, 1972, 238, 37–38 CrossRef CAS PubMed.
- N. Kumada, N. Koike, K. Nakanome, S. Yanagida, T. Takei, A. Miura, E. Magome, C. Moriyoshi and Y. Kuroiwa, Synthesis of rutile-type solid solution Ni1−xCoxTi(Nb1−yTay)2O8 (0 ≤ x ≤ 1, 0 ≤ y ≤ 1) and its optical property, J. Aust. Ceram. Soc., 2017, 5, 284–289 CrossRef.
- C. Lee, P. Ghosez and X. Gonze, Lattice dynamics and dielectric properties of incipient ferroelectric rutile, Phys. Rev. B: Condens. Matter Mater. Phys., 1994, 50, 13379–13387 CrossRef CAS.
- S. Wang, Y.-D. Hou, M.-P. Zheng, H.-Y. Ge, M.-K. Zhu and H. Yan, Room-temperature dielectric relaxation and magnetic properties in rutile-type FeTiNbO6, Mater. Res. Bull., 2013, 48, 3098–3102 CrossRef CAS.
- M. Binnewies, R. Glaum, M. Schmidt and P. Schmidt. Chemical Vapour Transport Reactions. De Gruyter, Berlin, Germany, 2012 Search PubMed.
- APEX3, SAINT and TWINABS, Bruker AXS Inc., Madison, Wisconsin, USA, 2016 Search PubMed.
- L. Krause, R. Herbst-Irmer, G. M. Sheldrick and D. Stalke, Comparison of silver and molybdenum microfocus X-ray sources for single-crystal structure determination, J. Appl. Crystallogr., 2015, 48, 3–10 CrossRef CAS.
- G. M. Sheldrick, SHELXT-Integrated space-group and crystal-structure determination, Acta Crystallogr., 2015, A71, 3–8 CrossRef PubMed.
- G. M. Sheldrick, Crystal structure refinement with SHELXL, Acta Crystallogr., 2015, C71, 3–8 CrossRef PubMed.
- International Tables for Crystallography, Space-group symmetry, ed. M. I. Aroyo, Wiley, 2016, vol. A Search PubMed.
- U. Müller. Symmetry Relationships between Crystal Structures, Oxford University Press, Okford, United Kingdom, 2013 Search PubMed.
- I. D. Brown, The Chemical Bond in Inorganic Chemistry: The Bond Valence Model, Oxford University Press, Oxford, United Kingdom, 2002 Search PubMed.
- N. E. Brese and M. O’Keeffe, Bond-valence parameters for solids, Acta Crystallogr., 1991, B47, 192–197 CAS.
- T. Degen, M. Sadki, E. Bron, U. König and G. Nénert, The HighScore suite, Powder Diffract., 2014, 29, S13–S18 CrossRef CAS.
- Diffract-Plus, Bruker AXS, Karlsruhe, Germany, 2020 Search PubMed.
- P. J. Chupas, K. W. Chapman, C. Kurtz, J. C. Hanson, P. L. Lee and C. P. Grey, A versatile sample-environment cell for non-ambient X-ray scattering experiments, J. Appl. Crystallogr., 2008, 41, 822–824 CrossRef CAS.
- B. H. Toby and R. B. Von Dreele, GSAS-II: the genesis of a modern open-source all purpose crystallography software package, J. Appl. Crystallogr., 2013, 46, 544–549 CrossRef CAS.
- H. M. Rietveld, A profile refinement method for nuclear and magnetic structures, J. Appl. Crystallogr., 1969, 2, 65–71 CrossRef CAS.
- P. E. Larson and M. Kelly, A. Surface charge neutralization of insulating samples in X-ray photoemission spectroscopy, J. Vac. Sci. Technol., A, 1998, 16, 3483–3489 CrossRef CAS.
- S. Tagliati, V. M. Krasnov and A. Rydh, Differential Membrane-Based Nanocalorimeter for High-Resolution Measurements of Low-Temperature Specific Heat, Rev. Sci. Instrum., 2012, 83, 055107 CrossRef CAS PubMed.
- P. Blaha, K. Schwarz, F. Tran, R. Laskowski, G. K. H. Madsen and L. D. Marks, WIEN2k: An APW + lo program for calculating the properties of solids, J. Chem. Phys., 2020, 152, 074101 CrossRef CAS.
- J. P. Perdew, K. Burke and M. Ernzerhof, Generalized Gradient Approximation Made Simple, Phys. Rev. Lett., 1996, 77, 3865–3868 CrossRef CAS PubMed.
- V. I. Anisimov, I. V. Solovyev, M. A. Korotin, M. T. Czyżyk and G. A. Sawatzky, Density-functional theory and NiO photoemission spectra, Phys. Rev. B: Condens. Matter Mater. Phys., 1993, 48, 16929–16934 CrossRef CAS PubMed.
- F. Tran and P. Blaha, Accurate band gaps of semiconductors and insulators with a semilocal exchange-correlation potential, Phys. Rev. Lett., 2009, 102, 226401 CrossRef.
- H. Jiang, Band gaps from the Tran-Blaha modified Becke-Johnson approach: A systematic investigation, J. Chem. Phys., 2013, 138, 134115 CrossRef.
- F. Tran and P. Blaha, Implementation of screened hybrid functionals based on the Yukawa potential within the LAPW basis set, Phys. Rev. B: Condens. Matter Mater. Phys., 2011, 83, 235118 CrossRef.
- A. V. Krukau, O. A. Vydrov, A. F. Izmaylov and G. E. Scuseria, Influence of the exchange screening parameter on the performance of screened hybrid functionals, J. Chem. Phys., 2006, 125, 224106 CrossRef PubMed.
- C. Ambrosch-Draxl and J. Sofo, Linear optical properties of solids within the full-potential linearized augmented planewave method, Comput. Phys. Commun., 2006, 175, 1–14 CrossRef CAS.
- O. C. Gagné and F. C. Hawthorne, Bond-length distributions for ions bonded to oxygen: results for the transition metals and quantification of the factors underlying bond-length variation in inorganic solids, IUCrJ, 2020, 7, 581–629 CrossRef.
- O. C. Gagné and F. C. Hawthorne, Bond-length distributions for ions bonded to oxygen: results for the non-metals and discussion of lone-pair stereoactivity and the polymerization of PO4, Acta Crystallogr., 2018, B74, 79–96 Search PubMed.
- R. D. Shannon, Revised Effective Ionic Radii and Systematic Studies of Interatomic Distances in Halides and Chalcogenides, Acta Crystallogr., 1976, A32, 751–767 CrossRef CAS.
- M. Weil, M. Shirkhanlou and T. Stürzer, Phase formation studies of lead(II) copper(II) oxotellurates: the crystal structures of dimorphic PbCuTeO5, PbCuTe2O6, and [Pb2Cu2(Te4O11)](NO3)2. 2019, Z. Anorg. Allg. Chem., 2018, 645, 347–353 CrossRef.
- P. Lacorre, J. Pannetier, F. Averdunk, R. Hoppe and G. Ferey, Crystal and magnetic structures of LiCoF4: The first compound with a dirutile structure, J. Solid State Chem., 1989, 79, 1–11 CrossRef CAS.
- K.-H. Wandner and R. Hoppe, Der erste Di-Rutil-Vertreter: LiMnF4. (Mit einer Bemerkung über LiCoF4), Z. Anorg. Allg. Chem., 1987, 546, 113–121 CrossRef CAS.
- S. Siegeland and H. R. Hoekstra, The crystal structure of copper uranium tetroxide, Acta Crystallogr., 1968, B24, 967–970 CrossRef.
- H. Bärnighausen, Group-Subgroup Relations between Space Groups: A useful Tool in Crystal Chemistry, Math. Commun., 1989, 9, 139–175 Search PubMed.
- W. H. Baur and A. A. Khan, Rutile-type compounds. IV. SiO2, GeO2 and a comparison with other rutile-type structures, Acta Crystallogr., 1971, B27, 2133–2139 CrossRef.
- A. K. van Bever and W. Nieuwenkamp, Die Kristallstruktur von Calciumchlorid, CaCl2, Z. Kristallogr., 1935, 90, 374–376 CAS.
- P. Fischer, W. Hälg, D. Schwarzenbach and H. Gamsjäger, Magnetic and crystal structure of copper(II) fluoride, J. Phys. Chem. Solids, 1974, 35, 1683–1689 CrossRef CAS.
- K. Robinson, G. V. Gibbs and P. H. Ribbe, Quadratic elongation: a quantitative measure of distortion in coordination polyhedra, Science, 1971, 172, 567–570 CrossRef CAS PubMed.
- D. B. Rogers, R. D. Shannon, A. W. Sleight and J. L. Gillson, Crystal Chemistry of Metal Dioxides with Rutile-Related Structures, Inorg. Chem., 1969, 8, 841–849 CrossRef CAS.
- C. R. Feger, G. L. Schimek and J. W. Kolis, Hydrothermal Synthesis and Characterization of M2Te3O8 (M = Mn, Co, Ni, Cu, Zn): A Series of Compounds with the Spiroffite Structure., J. Solid State Chem., 1999, 143, 246–253 CrossRef CAS.
- R. Becker, M. Johnsson and H. Berger, A new synthetic cobalt tellurate: Co3TeO6, Acta Crystallogr., 2006, C62, i67–i69 CAS.
- Handbook of Chemistry and Physics, ed. R. C. Weast, 63rd edn, CRC Press, Boca Raton, Florida, USA, 1982, B-155 Search PubMed.
- P. Paufler and Z. Weber, On the determination of linear thermal expansion coefficients of triclinic crystals using X-ray diffraction, Eur. J. Mineral., 1999, 11, 721–730 CrossRef CAS.
- T. Langreiter and V. Kahlenberg, TEV—A Program for the Determination of the Thermal Expansion Tensor from Diffraction Data, Crystals, 2015, 5, 143–153 CrossRef.
- M. C. Biesinger, B. P. Payne, A. P. Grosvenor, L. W. M. Lau, A. R. Gerson and R. St. C. Smart, Resolving surface chemical states in XPS analysis of first row transition metals, oxides and hydroxides: Cr, Mn, Fe, Co and Ni, Appl. Surf. Sci., 2011, 257, 2717–2730 CrossRef CAS.
- T. Sarkar, S. V. Ivanov, M. Weil, R. Clulow, E. Lewin and R. Mathieu, Compositional Dependence of the Magnetic State of Co3−xZnxTeO6 Solid Solutions, J. Alloys Compd., 2021, 884, 161111 CrossRef CAS.
- A. P. Ramirez, Strongly Geometrically Frustrated Magnets, Annu. Rev. Mater. Sci., 1994, 24, 453–480 CrossRef CAS.
- M. C. Viola, M. J. Martínez-Lope, J. A. Alonso, J. L. Martínez, J. M. De Paoli, S. Pagola, J. C. Pedregosa, M. T. Fernández-Díaz and R. E. Carbonio, Structure and Magnetic Properties of Sr2CoWO6: An Ordered Double Perovskite Containing Co2+ (HS) with Unquenched Orbital Magnetic Moment, Chem. Mater., 2003, 15, 1655–1663 CrossRef CAS.
- C. F. Smura, D. R. Parker, M. Zbiri, M. R. Johnson, Z. A. Gál and S. J. Clarke, High-Spin Cobalt(II) Ions in Square Planar Coordination: Structures and Magnetism of the Oxysulfides Sr2CoO2Cu2S2 and Ba2CoO2Cu2S2 and Their Solid Solution, J. Am. Chem. Soc., 2011, 133, 2691–2705 CrossRef CAS PubMed.
- F. Tran, G. Baudesson, J. Carrete, G. K. H. Madsen, P. Blaha, K. Schwarz and D. J. Singh, Shortcomings of meta-GGA functionals when describing magnetism, Phys. Rev. B, 2020, 102, 024407 CrossRef CAS.
- F. Tran, P. Blaha, K. Schwarz and P. Novák, Hybrid exchange-correlation energy functionals for strongly correlated electrons: Applications to transition-metal monoxides, Phys. Rev. B: Condens. Matter Mater. Phys., 2006, 74, 155108 CrossRef.
- K. Nassau, The Physics and Chemistry of Color, Wiley Interscience Publication, 2nd edn, 1983, p.454 Search PubMed.
- M. Wildner, M. Andrut and C. Z. Rudowicz, Optical absorption spectroscopy in geosciences. Part I: Basic concepts of crystal field theory, in Spectroscopic methods in mineralogy. EMU Notes in Mineralogy, ed. A. Beran and E. Libowitzky, 2004, vol. 6, pp.93–143 Search PubMed.
- J. Tauc, R. Grigorovici and A. Vancu, Optical Properties and Electronic Structure of Amorphous Germanium, Phys. Status Solidi B, 1966, 15, 627–637 CrossRef CAS.
- S. M. Sze, Physics of Semiconductor Device, Wiley Interscience Publication, 1981, pp.848–849 Search PubMed.
- J. Wang and M. Isshiki, II–IV Semiconductors for Optoelectronics: CdS, CdSe, CdTe, in Springer Handbook of Electronic and Photonic Materials. Springer Handbooks, ed. S. Kasap and P. Capper, Springer, Boston, MA, 2006 Search PubMed.
- F. Tran, J. Doumont, L. Kalantari, A. W. Huran, M. A. L. Marques and P. Blaha, Semilocal exchange-correlation potentials for solid-state calculations: Current status and future directions, J. Appl. Phys., 2019, 126, 110902 CrossRef.
- F. Tran, S. Ehsan and P. Blaha, Assessment of the GLLB-SC potential for solid-state properties and attempts for improvement, Phys. Rev. Mater., 2018, 2, 023802 CrossRef CAS.
- F. Tran and P. Blaha, Importance of the Kinetic Energy Density for Band Gap Calculations in Solids with Density Functional Theory, J. Phys. Chem. A, 2017, 121, 3318–3325 CrossRef CAS PubMed.
- Q. Wang, H. Ma, B. Ni, Y. Li, S. Huang, W. Lin and Y. Zhang, Validation of Density Functional Theory Methods for Predicting the Optical Properties of Cu-Based Multinary Chalcogenide Semiconductors, J. Phys. Chem. C, 2022, 126, 4684–4697 CrossRef CAS.
- P. Pramanik, F. Eder, M. Weil, S. A. Ivanov, P. Maltoni, R. Miletich, T. Edvinsson and R. Mathieu. Vibrational properties of monoclinic CoTeO4. In preparation.
Footnotes |
| † Electronic Supplementary Information (ESI) available: X-ray diffraction measurements and Rietveld refinements of CoTeO4, optimized atomic coordinates from DFT calculations, bond lengths and angles for different experimental studies and DFT optimization, numerical data of regression curves and coefficients of the thermal expansion tensor, energy dispersive spectroscopy measurements, surface images of selected CoTeO4 aggregates, X-ray photoemission spectra, magnetic measurements (M vs. H), temperature-dependence of dielectric properties. CCDC 2265144. For ESI and crystallographic data in CIF or other electronic format see DOI: https://doi.org/10.1039/d3ma01106b |
‡ The given cell19 in space group setting P21/n transforms to the current cell in P21/c by the matrix [001, 010, ![[1 with combining macron]](https://www.rsc.org/images/entities/char_0031_0304.gif) 0 0![[1 with combining macron]](https://www.rsc.org/images/entities/char_0031_0304.gif) ]. ]. |
| § There are few exceptions, such as the monoclinic polymorph of PbCuTeO5,53 where CuII and TeVI are occupationally disordered at the same site. |
| This journal is © The Royal Society of Chemistry 2024 |

