 Open Access Article
Creative Commons Attribution 3.0 Unported Licence
Upconversion as a spear carrier for tuning photovoltaic efficiency
Nikita
Chaudhary
,
Mansi
Pahuja
and
Kaushik
Ghosh
 *
*
Institute of Nano Science & Technology, Knowledge City, Sector-81, SAS Nagar, Manauli P.O.-140306, Mohali, Punjab, India. E-mail: kaushik@inst.ac.in
First published on 14th February 2024
Abstract
Solar energy constitutes a major share of the total renewable energy produced all over the world. Different types of photovoltaics, including silicon, perovskite, and dye-sensitized solar cells, are being explored to increase the energy-harvesting capability to generate maximum energy from the total solar spectrum. However, the current photovoltaic technology does not utilize a large part of the solar spectrum, mainly the infrared region. The unutilized IR radiation is detrimental to solar-cell performance and gradually degrades the lifespan of the devices due to the severe heating effect. In this aspect, upconversion presents a feasible route for harvesting the unutilized part of solar energy; it converts sub-bandgap photons into photons of higher energy. Upconversion nanoparticles include a host matrix and lanthanides as dopant materials, where the constituents can be tuned to obtain the desired range of upconverted wavelengths. This review discusses the various possibilities of utilizing the upconversion matrix to gain the technological know-how to improve the efficiency of existing solar technologies. The major emphasis is on increasing the efficiency of silicon-based photovoltaic technology.
1. Introduction
The ever-growing pressure on non-renewable sources of energy like coal and their fast depletion rates is continuously increasing the need to switch to a sustainable solution for high energy demand.1 When it comes to renewable sources, the sun or solar energy is one of the most used sources for electricity generation across the world. Only 1.8 × 10¹⁴ kW of energy falls on earth out of the total energy emitted by the sun at the rate of 3.8 × 10²³ kW per second. Even if only 0.1% of this total solar energy is harvested with only 10% average power conversion efficiency, it would be equivalent to four times the total generating capacity of the world, i.e., about 3000 GW.2 Solar energy has come a long way since the 7th century B.C. when people started using sunlight to light fires using a magnifying glass, to the discovery of the photovoltaic effect by Edmond Becquerel in 1839,3 and now the global solar energy market is projected to reach $223.3 billion by 2026.4 Also, solar power amounts to 3% of the global energy generation making it the third largest renewable energy source for electricity generation after hydropower and wind energy.5 Owing to this large market share and the growing demand for the renewable energy sector, it is inevitable to tune the efficiency of solar devices to satisfy the needs of the coming generation and its sustainable future.The most promising technology in the PV industry is crystalline silicon (c-Si) solar cells. The abundance of silicon in the earth's crust (28%), its non-toxic nature, and its relative cost-effectiveness make it a fundamental component in the electronic industry. The very first silicon solar cell was developed by Daryl M. Chapin, Gerald L. Pearson, and Calvin S. Fuller at Bell Laboratories in 1954, having an efficiency of 6%.6 This technology has reached such spectacular heights that could be realized from the fact that more than 125 GW of c-Si modules were installed in 2020 and a total of 700 GW have been installed to date. A humongous share of 95% of the market is ruled by c-Si solar cells.7 However, the photovoltaics are bound by the Shockley–Quisser limit (or SQ limit) that gives an upper limit of 32% (theoretically) to the power conversion efficiency due to factors like process-induced interfacial defects as well as limited broadband absorption. The interfacial defects lead to nonradiative recombinations8,9 and, experimentally, the maximum efficiency has been reported to be 26.81%.10
Apart from defect states, another limiting factor that comes into the picture is the overall percentage of the solar spectrum that is being absorbed by the solar cell. The higher energy photons, typically in the UV region, cause thermalization losses whereas photons having energy less than the band gap of silicon are not absorbed by the device, which leads to transmission losses (almost 50% of the overall spectrum).11–13 Similar issues are also present in the third generation of solar cells including perovskite solar cells and dye-sensitized solar cells (DSSCs). The narrow band gap (approx. 1.8 eV) of the commonly used dyes in DSSCs including N749 and N719 could only harvest sunlight from 300 to 800 nm, skipping a large part of the solar spectrum, mainly the infrared and near-infrared region.14 The most promising perovskite materials also face similar issues that impact their power conversion efficiency. Many perovskite materials, including tin and lead-based perovskites, have a typical band gap range, from 1.2 eV to 1.4 eV leading to narrow solar spectrum absorption.15 Therefore, a large part of the solar spectrum goes unutilized in most solar cell technology markets.
The losses due to sub-bandgap photons could be reduced using the concept of upconversion (UC), where two or more low-energy photons (IR region) are converted into a single photon having higher energy (visible region) (shown in Fig. 1) via a long-lived intermediate state through anti-Stokes emission.16 The concept of upconversion was first introduced by Dutch-American physicist Nicolas Bloembergen in 1959.17 In theory, it was predicted that with the help of an ideal upconverter, the standard Air Mass 1.5 global (AM 1.5G) spectrum power conversion efficiency can be tuned up to 50.7% from the basic limit of 32%.12 This phenomenon finds its applications in various fields, including photovoltaics, bio-imaging, sensors, OLEDs, biomedicines, etc. This UC concept is similar to the impurity-photovoltaic-effect or IPV, where impurities are introduced in the bulk material, which behave as upconverting materials and provide intermediate energy levels for upconversion.18 A similar approach is used in an upconversion matrix where rare earth elements with rich 4f energy levels are commonly used to transform lower energy light into visible light and promote solar cell efficiency. This review highlights the various mechanisms of upconversion and how different dopants could render different luminescence spectra. Applications in different types of solar cells, including silicon solar cells, dye-sensitized solar cells, and perovskite solar cells, have also been discussed in detail, along with the UCNPs integration strategies.
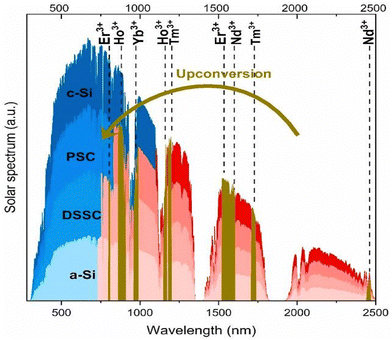 | ||
| Fig. 1 Parts of the solar spectra of different solar cell types, utilized (in blue) and lost (in red), and the absorption ranges (in brown) of the upconverting Ln3+ ions.11 | ||
2. Upconversion mechanisms and materials
2.1. Mechanisms
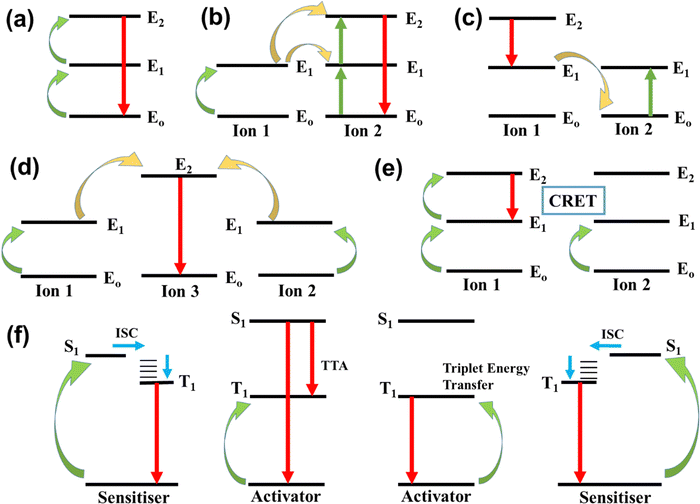
The basic mechanisms of upconversion in nanocrystals are excited state absorption (ESA), energy transfer upconversion (ETU), photon avalanche (PA), cooperative sensitization upconversion (CSU), and cross-relaxation (CR), depicted in Fig. 2. In organic molecules, the mechanism of upconversion is triplet–triplet annihilation (TTA).19–222.2. Materials
Upconversion nanocrystals include an inorganic host material and lanthanide dopant ions. Different combinations of hosts and dopants along with different dopant concentrations help to achieve the tunability of different photophysical properties, including emission wavelength and intensity. The following section of this review will focus on the different components of UC nanocrystals.Host matrices with low phonon energies are considered ideal for UC nanocrystals. Different halides, including chlorides, bromides, and iodides, have low phonon energies (<300 cm−1) but their hygroscopic nature restricts their applications. On the other hand, fluorides are highly stable and exhibit phonon energy of around 500 cm−1.30 Hexagonal (β phase) NaYF4 is one of the most efficient and most studied host matrices for green and blue emission due to its narrow crystal field splitting.21,31 Along with these properties, this matrix is safer to grow due to the high solubility of NaF in water as compared to other rare earth fluorides, like LiYF4, which require hazardous ammonium fluoride precursors.32 Zhou et al. synthesized the nanowire morphology of β-NaYF4 that could be optically trapped and refrigerated using a near-IR laser having potential applications in localized optoelectronic device cooling and laser refrigeration.33 Some of the other synthesized fluoride matrices include NaGdF4, KGdF4, GdF3, NaEuF4,34 CaF2,35 BaF2,36 Na3Li3Sc3F12,37etc. Host matrices having cations with radii similar to lanthanide dopants reduce the formation of crystal defects. Therefore, Na+, Ca2+, and Y3+ are superior host cations for UC materials.38 Another class of commonly used host matrices is oxides, which have good thermal conductivity, isotropic optical properties, and chemical stability even at high temperatures and in corrosive environments. However, their phonon energy is generally higher than 500 cm−1. Various ceramic-based oxides like Y2O3, La2O3, GdO3, etc., with low phonon energy, are known to be transparent to visible light and have low interaction with doped emitter ions similar to the fluoride hosts.39 A number of oxide materials, including Al2O3,40 TiO2,41 Yb3Al5O12,42 Yb2Ti2O7,43 CaMoO4,44 PbMoO4,45 NaLa(MoO4)2,46etc., have been explored. Molybdenum oxides provide additional emission intensity due to their relatively low phonon energy.47
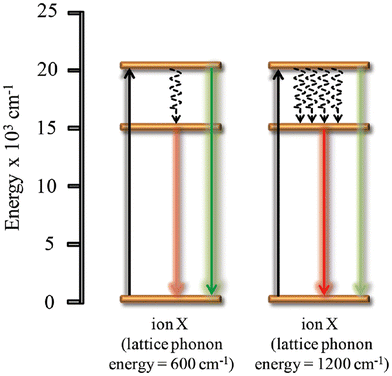 | ||
| Fig. 3 The effect of lattice phonon energy on the luminescence properties of an ion. Reprinted with permission from Wiley.48 | ||
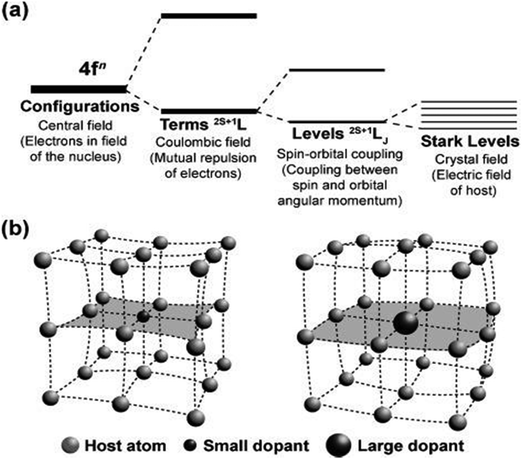 | ||
| Fig. 4 (a) A simplified representation of the effect of the coulombic field, spin–orbit coupling, and crystal-field interaction on the [Xe]4fn configuration. (b) Crystal lattice contraction (left) and expansion (right) as a result of the substitution of a host atom with dopants of varied sizes. Reprinted with permission from Wiley.53 | ||
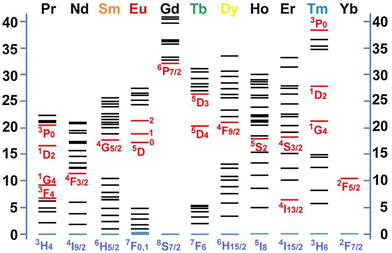 | ||
| Fig. 5 Partial energy diagrams for the lanthanide aqua ions; the values of the energy levels are given as 1000 cm−1. The red and blue lines indicate the main luminescence and the fundamental levels, respectively. Reprinted with permission from Elsevier.57 | ||
Among the lanthanides, La3+, Y3+ and Lu3+ do not have unpaired 4f electrons and are, therefore, suitable for host materials, and not as luminescent centres. Also, Gd3+ has fewer intermediate states and transitions results in the UV region, making it less suitable as a luminescent centre. However, Sm3+ (4f5), Eu3+ (4f6), Tb3+ (4f8), Dy3+ (4f9) and Ho3+ (4f10) have adequate energy gaps for emissions in the visible region. In contrast, Nd3+ (4f3), Er3+ (4f11) and Tm3+ (4f12) emit in the near-infrared region.23
Both the emitter and sensitizer need to be chosen carefully to obtain the required wavelength of emission. The role of a sensitizer is to absorb the incoming radiation and transfer it to the emitter ions. Therefore, ions having a larger cross-section area for absorption are ideal candidates for sensitizer ions. Further criteria that come into the picture is that the excited state of the sensitizer ions should be closer to the emitter ions making energy transfer efficient and easy. Thus, Yb3+, having a cross-section area of 9.11 × 10⁻²¹ cm−2 at a wavelength of 980 nm and having only one excited state (2F5/2) matching with the f–f transitions of several emitter centres, makes an ideal sensitizer material. For example, the 4I11/2 state of Er3+ overlaps with the 2F5/2 state of Yb3+ and allows energy transfer from Er to Yb.55,56 The role of the emitter is to convert the photons with low energy into higher-energy photons. Therefore, sensitizer atoms having f–f transitions among different energy levels that could provide the required emission wavelength have to be chosen accordingly. For example, erbium dopants can convert incident radiation of 1.5 μm into the UV-Visible-NIR regions. Various combinations of lanthanides have been explored to achieve different wavelengths in the visible region as listed in Table 1.
| UCNP | Excitation (nm) | Emission (nm) | Ref. |
|---|---|---|---|
| YbF3/Ho3+ | 980 | 545, 750 | 58 |
| NaGdF4:Yb,Er | 980 | 517–532, 532–551, 635–670 | 59 |
| Y2O3/Yb3+,Ho3+ | 980 | 545, 650, 779 | 60 |
| CeO2/Er3+,Yb3+ | 980 | 520–560, 640–680 | 61 |
| BiYO3/Er3+,Yb3+ | 980 | 520–570, 640–700 | 62 |
| NaYF4:Yb,Er@NaGdF4:Nd@SiO2 | 980 | 410, 520, 540, 655 | 63 |
| NaYF4:Er3+,Yb3+@SiO2 | 980 | 545, 655 | 64 |
| NaYF4:Yb3+,Er3+@NaYF4:Nd3+ core | 980 | 408, 525/540, 660 | 65 |
| LiYF4:Er3+,Yb3+ | 980 | 546, 556, 674 | 66 |
| TiO2 nanorods: Er3+ | 980 | 512–527, 536–560, 650–680 | 67 |
| LiGdF4:Yb3+,Er3+ | 980 | 520, 540, 650 | 68 |
| NaYbF4:Ho3+ | 980 | 540, 644, 750 | 69 |
| NaGdF4:Er3+/Yb3+ | 980 | 522, 540, 653 | 70 |
| SiO2/NaYF4:Yb3+,Er3+@SiO2 core–shell | 980 | 522, 540, 654 | 71 |
| NaYF4:Yb3+,Tm3+ | 980 | 290, 345, 362, 451, 475 | 72 |
| NaCsWO3@NaYF4@NaYF4:Yb3+,Er3+ | 980 | 540, 654 | 73 |
| NaYF4:Yb3+,Er3+@NaYF4:Yb3+,Nd3+ core–shell | 980 | 414, 526, 546, 660 | 74 |
| Fluoroindate glass/Er3+,Yb3+ | 1480 | 545, 650, 975 | 75 |
| NaYF4:Er3+ | 980/1540 | 550/660 | 76 |
| SiO2:YF3:Er3+,Yb3+ | 1550 | 559, 653, 669, 803, 926, 970 | 77 |
| SiO2/Al2O3:Er3+,Yb3+ | 1550 | 630–650 | 78 |
| CeO2:Yb3+,Er3+ | 980/1540 | 550/665 | 79 |
| NaYF4:Yb/Er/Gd | 980 | 524, 540, 660 | 80 |
3. Applications of upconversion materials in different kinds of solar cells
This upcoming section focuses on the application of upconversion nanomaterials in different kinds of solar cells and the enhancement in the power conversion efficiency along with integration strategies that have been adopted.3.1. DSSC
Dye-sensitized solar cells (DSSCs) are potential candidates for replacing traditional silicon solar cells because of their low cost, high efficiency, and easy fabrication. They are considered green technology and they were first designed by O’Regan and Grätzel.81 A typical DSSC is fabricated using a nanocrystalline TiO2 semiconductor film on a transparent conductive oxide glass (TCO), a platinum-coated transparent conducting oxide glass as a counter electrode, and an electrolyte solution containing an I−/I3− redox couple.82 However, the light-harvesting capability of DSSC is a major limiting factor for the overall performance of the device.83 The wavelength range for absorption (300–800 nm) largely remains the same even for different organic sensitizers like N3, N719, N749, etc. (shown in Fig. 6), due to higher charge recombination rates and poor charge injection efficiency.84 Thus, a large part of the solar spectrum, including infrared and near-infrared light, is not utilized. The majority of the NIR component of the incident sunlight is lost as thermal heat and non-absorption photons, leading to a decrease in the ability of DSSCs to utilize this part of the spectrum. Therefore, upconversion finds its application in DSSCs to broaden the absorption spectrum and utilize the sub-band gap photons. Also, for a solar cell with a 1.7 eV band gap (similar to DSSC), it has been shown that the SQ efficiency limit can be improved using upconverters from 28.2% to 43.6%.85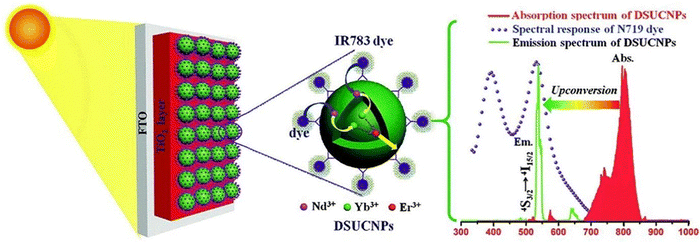 | ||
| Fig. 6 Broadband near-infrared sunlight harvesting and spectral conversion into the visible range to activate the N719 dye for the improvement of a DSSC device. Reprinted with permission from Elsevier.84 | ||
UCNPs were combined with DSSCs for the first time by Shan and Demopoulos. They reported a TiO2-UCNP (Yb3+, Er3+ co-doped LaF3) nanocomposite working electrode to improve NIR light-harvesting in dye-sensitized solar cells.86 Thereafter, a large number of UCNPs have been explored in the field of DSSCs. Yu et al. synthesized nano-heterostructures of YbF3–Ho/TiO2 for use as new photoelectrode materials. They combined the upconversion properties with the semi-conductive properties of TiO2, which enhanced the overall absorption by utilizing the near-infrared light, as well as improved the photoinduced charge separation by increasing the lifetime of excited electrons. An enhancement of 19% was achieved in the photocurrent and the overall power conversion was enhanced by 23%, reaching 8%.58
Another group of researchers, Ramaswamy et al., investigated the synergistic effects of UCNP β-NaGdF4:Yb,Er,Fe with light-reflecting silver nanoparticles (150 nm). They observed a bright green emission under a 980 nm laser, also visible to the naked eye. The first green emission is in the range of 517 to 532 nm, corresponding to 2H11/2 → 4I15/2 transition and the other is in the range from 532 to 551 nm, corresponding to 4S3/2 → 4I15/2 transition. A red emission from 635 to 670 nm was also observed, attributed to the 4F9/2 → 4I15/2 transition. The resonance frequency of silver nanoparticles overlaps with the green and red emissions of the UCNPs. Through the effective coupling of these effects, they achieved an efficiency enhancement of 21.3% with the application of a silver rear reflector combined with upconversion nanoparticles, and the overall efficiency increased from 5.08% to 7.04%.59 To solve the toxicity and chemical stability issues of fluorides, many oxide UCNPs have been explored. Tadge et al. explored the colour tunability of the tri-doped Y2O3 matrix. The Ho3+/Yb3+ doped matrix gives weak red and intense green emission, whereas Tm3+/Yb3+ emits NIR and blue emission with a 976 nm excitation wavelength. However, the tri-doped Y2O3:Tm3+/Ho3+/Yb3+ UCNP emits intense green light at 976 nm. They also investigated changes in emission with different doping concentrations of Yb3+, proving the colour tunability (shown in Fig. 7) of the system, which is present in both co-doped and tri-doped UCNPs. The tri-doped nanophosphor also exhibited the Yb3+ concentration-dependent depopulation of Ho3+ ions in 5S2 and 5F4 levels due to the presence of back energy transfer (BET) phenomena, which take place as follows:
| Ho3+(5S2,5F4) + Yb3+(2F7/2) → Ho3+(5I6) + Yb3+(2F5/2). |
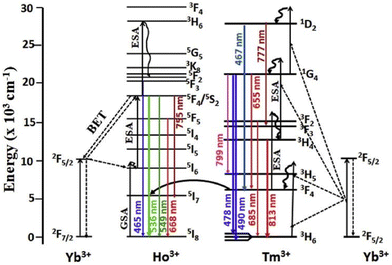 | ||
| Fig. 7 Energy level diagrams of Ho3+–Yb3+–Tm3+ ions and the possible UC and ET processes under 976 nm excitation. Reprinted with permission from Elsevier.60 | ||
The light trapping capability of the UCNPs can be enhanced by developing the core–shell nanostructure, where the shell layer transfers energy to the core more efficiently. Adopting this strategy, Zhang et al. synthesized the core–shell nanostructure of NaYF4:Yb,Er@NaGdF4:Nd@SiO2 and studied the synergistic effects with TiO2 hollow spheres (HS). Here, the TiO2 HS layer is used as a scattering center. Both the UC core–shell nanostructure and HS were applied on the TiO2/FTO photoanode coated with N719 dye to design a DSSC. The incorporation of the core–shell UCNP in this heterostructure enhanced the PCE by 26.93%.63 The enhancement of the photovoltaic efficiency is due to upconversion as well as the size-dependent light scattering of the nanoparticles. However, Zhou et al. demonstrated the contribution of UCNP in enhancing the efficiency of DSSC using the NaYF4:Er3+,Yb3+@SiO2 core–shell geometry where the size-dependent factor was eliminated. The emission peaks were observed at 543 nm and 655 nm for 4S3/2 to 4I15/2 and 4F9/2 to 4I15/2 transitions, respectively. The short-circuit current was enhanced by 4% (from 12.35 mA to 13.03 mA) along with a PEC enhancement of 6.37% due to the presence of UCNP.64 Hao et al. reported an alternate strategy to further improve the PCE by designing a core–shell architecture of UCNP with IR783 organic dye. The dye showed a broad and efficient NIR-harvesting capability due to a larger molecular absorption cross-section (10–17 cm2) as compared to the narrow and inefficient absorption of UCNP in the NIR region. Here, Nd3+ is acting as a sensitizer and transmitting the absorbed NIR light to the Yb/Er core, resulting in 540/650 nm emission with an enhancement in upconversion luminescence by 9-fold and PCE by 13.1%.65 Interestingly, the broadband absorption was further extended with the development of the upconversion and downconversion strategies via the alternation of doping elements in core/shell matrices. Chen et al. demonstrated that the doping of Yb3+/Er3+ in the core matrix for upconversion and Eu3+ in the shell matrix for downconversion (shown in Fig. 8) cumulatively harvested the NIR and UV regions, respectively, increasing the overall PCE by 13.95%.87 The choice of doping elements plays an important role in overall efficiency, and the selection of the host matrix contributes significantly to modulating the photoconversion efficiency.
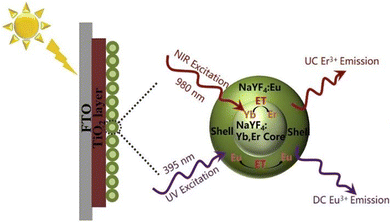 | ||
| Fig. 8 Near-infrared and ultraviolet sunlight harvesting, and spectral conversion into the visible range to activate the N719 dye for the enhancement of a DSSC device. Reprinted with permission from Elsevier.87 | ||
Commonly, a fluoride matrix provides low phonon energy and induces luminescence quenching due to impurities and surface defects (shown in Fig. 10). Tian et al. showed that the decoration of a native oxyfluoride layer (YOF:Yb3+/Er3+) on the NaYF4:Yb3+/Er3+ core geometry via high-temperature annealing suppresses the surface quenching and modulation of the phonon energy of the core host matrix. Thereby, the red-to-green emission ratio was modulated from 1.3 to 11.2 at an optimized annealing temperature of 600 °C. It was observed that a gradient interface was formed due to a huge lattice mismatch between the cubic phase of YOF and the hexagonal phase of NaYF4, helping to shield the emitter ions against quenching, and resulting in the effective coupling of photoelectrons and phonons of YOF:Yb3+/Er3+. Two pathways (shown in Fig. 9a and b) for upconversion have been identified for the photon population in the 4F9/2 excited state when Yb3+ ions are excited directly. The first pathway includes the excitation of Er3+ ions to the 4F7/2 state by Yb3+ ions through 980 nm light. This can lead to non-radiative transitions to 2H11/2/4S3/2 and 4F9/2. The transition from these levels to the ground state 4I15/2 leads to green and red emissions, respectively. The second pathway occurs when Er3+ ions are excited to 4I11/2, followed by non-radiative relaxation to 4I13/2. Further transition to 4F9/2 followed by relaxing back to 4I15/2 results in red emission. Here, the non-radiative transitions in both pathways compete and thus, in the case of a fixed energy gap, the probability of the transition is related to the phonon energy of the host matrix. With the increase in phonon energy, the transitions from 4I11/2 → 4I13/2 and 4S3/2 → 4F9/2 will increase, giving rise to a high R/G ratio. Therefore, the formation of the YOF shell on the NaYF4:Yb3+/Er3+ host matrix increases the phonon energy, leading to a significant improvement in the R/G ratio. This as-synthesized UCNP modulates better NIR absorption and thereby enhances the PCE by 17% (Fig. 10).88
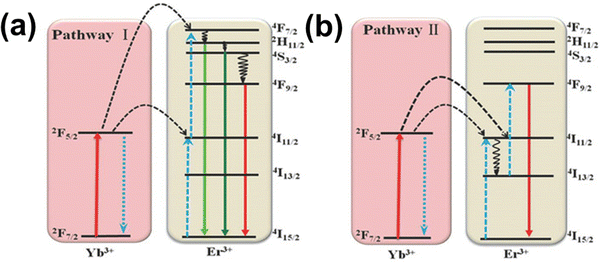 | ||
| Fig. 9 The energy levels of the Yb3+/Er3+-codoped NaYF4:Yb3+/Er3+@YOF:Yb3+/Er3+, showing possible energy transfer upon 980 nm excitation. Reprinted with permission from Wiley.88 | ||
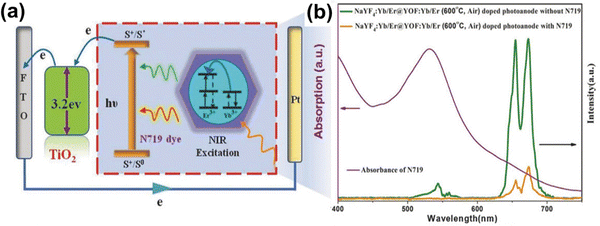 | ||
| Fig. 10 (a) Energy diagram illustrating the NIR light-harvesting by the N719 dye through the UC process, the charge injection into TiO2 and the transport of photoelectrons to the electrode surface. (b) The absorption spectra of the N719 dye and the UC emission spectra of TiO2 photoanodes with NaYF4:Yb3+/Er3+@YOF:Yb3+/Er3+ (600 °C, air) before and after immersion in N719 dye. Reprinted with permission from Wiley.88 | ||
The upconversion nanoparticles showed remarkable improvement in the efficiency of DSSCs. This could be further improved by utilizing UCNPs with greater luminescence intensity developed by designing different morphologies under variable host matrices. Further, the use of dyes as shell materials of UCNPs provides greater light-harvesting opportunities because the high absorption coefficients of the organic dye molecules cumulatively impact and improve the photovoltaic performance.
3.2. Perovskite solar cells
Perovskite-based solar cells (PSC) are seen as future substitutes for conventional solar-powered conversion technologies including the traditional silicon solar cell. Within a short period, the efficiency of the perovskite solar cells has increased from the first reported 3.8% to as high as 26%, recently.89 This improvement in efficiency makes it a potential candidate for the future of the photovoltaic industry. However, perovskite solar cells are still struggling with issues like stability, toxicity (from lead-based perovskites), large-scale production, etc.90 One important criterion that could help to further increase the efficiency would be to harvest photons more efficiently. The most common MAPbI3-based perovskite could only harvest 50% of the total available sunlight at a wavelength of less than 800 nm. Thus, the upconversion mechanism finds its application prospects in enhancing the light-harvesting capacity of perovskite solar cells. Further, the UCNPs could be used in all three different layers of the device including the active layer, a hole-transporting layer, and an electron-transporting layer.91 This section will discuss the different integration strategies adopted in perovskite solar cells.Chen et al. made a primary investigation of the effects of upconversion on the efficiency of solar cells using LiYF4 co-doped with Yb3+ and Er3+ single-crystals integrated on top of a perovskite solar cell (shown in Fig. 11). The single-crystal morphology also helps in removing the luminescence quenching effects due to defect states and serves as a transparent layer. This UCNP yielded a dominant green emission, which is dependent on the excitation power density. This resulted in an overall efficiency enhancement of 7.4% under sunlight simulated with a solar constant of 7–8.66 However, introducing the UCNPs into the solar cell architecture provides the additional benefits of reduced light reflections. In this aspect, Zhang et al. investigated the performance of organo-mixed halide (CH3NH3PbI3−xClx) perovskite solar cells with Er3+-doped nanorod arrays synthesized through a hydrothermal route. The TiO2 nanorod architecture provides faster electron transport and Er doping modifies the band gap of TiO2 from 3.00 eV to 3.07 eV and converts IR to green light emission. The Er-doped TiO2 nanorods showed better absorption intensity in the UV region than undoped nanorods. A blue shift was also observed in the optical absorption edge, which could be attributed to the charge transfer transition between the 4f orbital electrons of Er3+ ions and TiO2 valence or conduction bands. This resulted in an increase in PCE from 10.6% to 16.5% as compared to the un-doped TiO2 nanorod configuration.67 These UCNP could also be combined with the hole-transporting layer as demonstrated by Deng et al. They integrated the Li(Gd,Y)F4:Yb,Er upconversion material into the spiro-OMeTAD-based hole-transporting layer. The Li-based matrix provided a higher luminescence intensity as compared to the NaYF4 counterpart with the additional benefit of thermal stability under the same doping conditions. This matrix has a tetragonal bipyramidal morphology (shown in Fig. 12) with an intense green emission, which could be considered pure due to an acute emission peak and a high green-to-red ratio. The optimal concentration of UCNP was found to be 0.10 wt% after which the device performance degraded. This resulted in an overall PCE of 18.34% and an enhancement of over 25% with the upconversion nanoparticles.68
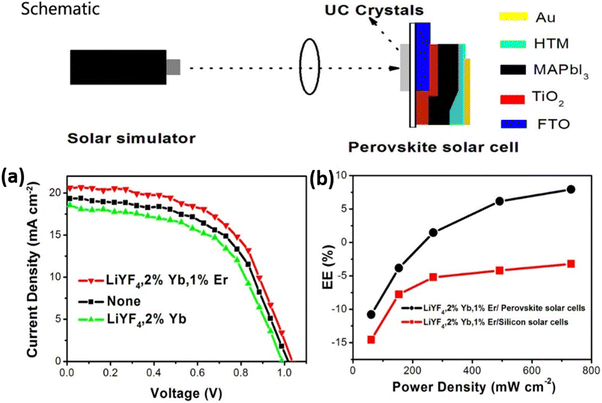 | ||
| Fig. 11 A schematic representation of the perovskite solar cells under the simulated sunlight excitation. (a) J–V curves of the perovskite solar cells: LiYF4:2%Yb3+,1%Er3+ crystals, LiYF4:2%Yb3+ crystals, and no crystals, obtained under simulated solar illumination with an intensity of 0.73 W cm−2. (b) Enhancement efficiencies (EE) of the perovskite solar cells and silicon solar cells with LiYF4:2%Yb3+,1%Er3+ crystals dependent on the excitation power density. Reprinted with permission from the American Chemical Society.66 | ||
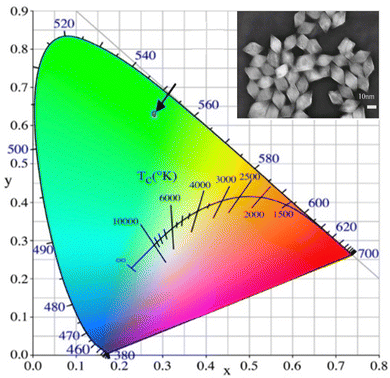 | ||
| Fig. 12 The CIE chromaticity diagram of Li(Gd,Y)F4:Yb,Er (inset: the TEM image of Y3+-doped LiGdF4:Yb3+,Er3+ upconversion nanocrystals). Reprinted with permission from Elsevier.68 | ||
Another major issue that hampers the efficiency of perovskite solar cells is the charge recombination. The doping of upconversion nanoparticles into various layers of the solar cell also helps to reduce the effects of charge recombination and, thus, enhances the photoconversion efficiency. Li et al. fabricated a hole-conductor-free perovskite solar cell employing the synergistic effects of NaYbF4:Ho3+ and ZrO2 as a scaffold layer in FA0.4MA0.6PbI3 perovskite solar cells. They observed a flake-like morphology, which depends on the reaction time, and obtained heterogeneous grain sizes at reaction times of 5, 10, 15 and 15 h. A uniform, spherical grain size was obtained for the reaction times of 20 and 24 h. An FTO/compact TiO2(cp-TiO2)/(mesoporous)mp-TiO2/mp-ZrO2/FA0.4MA0.6PbI3/CE-based perovskite solar cell was fabricated. Three emission peaks were observed at 540 nm, 640 nm and 750 nm, corresponding to 5S2, 5F4 → 5I8, 5F5 → 5I8 and 5S2, 5F4 → 5I7 transitions, respectively. Here, 540 nm is the dominant peak giving fluorescent green emission. It was observed that the UCNP and ZrO2 combination led to fewer holes in the scaffold layer, creating a smooth interface. This design also provided an additional benefit of a reduced electron–hole recombination rate along with NIR harvesting. The major areas where recombination could occur are the grain boundaries but, in this case, the large grain sizes reduced the surface and bulk defects. The UCNP further filled the pinholes present in ZrO2, reducing the leakage current and the band gap was modified from 3.46 eV for ZrO2 to 3.37 eV for the UCNP-doped ZrO2 layer. With an optimum concentration of 40 wt% of UNCP, a PCE of 14.32% was achieved. A further increase in concentration led to a decrease in the short-circuit current density. Overall, lower recombination rates, lower trap density and enhanced light harvesting in the NIR region led to the better efficiency of the as-designed solar cell.69
More recently, Wu et al. explored another nanorod architecture where the synthesized NaGdF4:Yb3+,Er3+ nanorods (shown in Fig. 13) were the upconversion material. However, the enhancement in photocurrent due to the infrared region is very low. The enhancement in efficiency was achieved due to lower defect states obtained through the modification of the perovskite by the UCNP and lower charge carrier recombination. Thus, an overall power conversion efficiency of 21.1% was achieved.70 Adopting a similar approach, Qi et al. developed a hole transport-free perovskite solar cell. The SiO2/NaYF4:Yb,Er@SiO2 core–shell structure doped in TiO2 nanorods (shown in Fig. 14) was explored. The absence of hole-transporting material (HTM) reduced the cost of production and provided better stability. The core–shell architecture reduced the detrimental charge recombination that is present in the exposed NaYF4 crystals due to the presence of defects and surface ligands. The pinholes present in the NaYF4:Yb,Er@SiO2 film led to better infiltration of perovskite between SiO2 particles. The presence of an insulating layer above TiO2 nanorods prevented direct contact with the carbon counter electrode and enhanced the charge transport by reducing charge carrier recombination. A power conversion efficiency of 14.52% was obtained using this hole transport-free architecture along with the contribution of UNCP.71
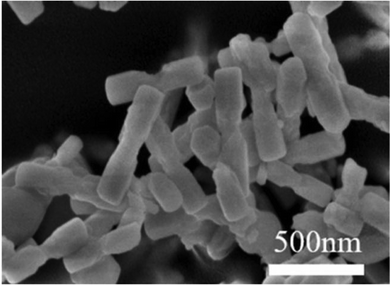 | ||
| Fig. 13 SEM image of NaGdF4:Yb3+,Er3+ nanoparticles. Reprinted with permission from Elsevier.70 | ||
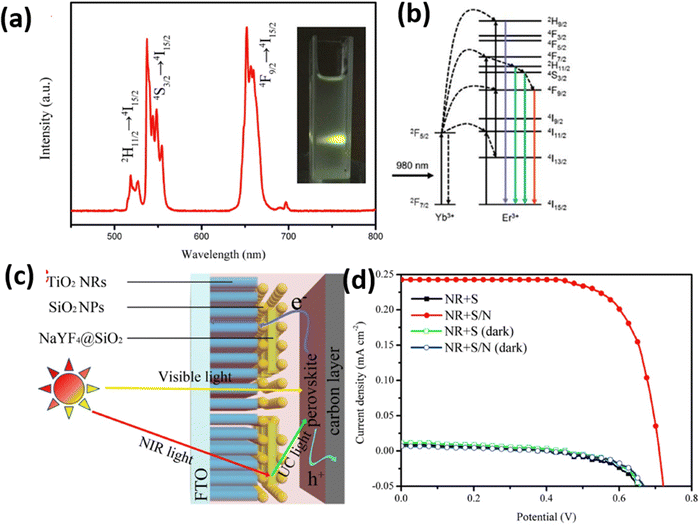 | ||
| Fig. 14 (a) PL spectra of the NaYF4:Yb,Er@SiO2 under a 300 mW 980 nm NIR laser excitation; the inset is a photograph of the NaYF4:Yb,Er@SiO2 under a 300 mW 980 nm NIR laser excitation. (b) Energy-level diagram and the corresponding energy transitions in the NaYF4:Yb,Er system. (c) Schematic diagrams of the energy transfer process in PSCs. (d) J–V curves of PSCs based on TiO2 NRs with a SiO2 or SiO2/NaYF4:Yb,Er@SiO2 insulating layer obtained under irradiation by a 300 mW 980 nm NIR laser. Reprinted with permission from Elsevier.71 | ||
Apart from surface charge recombination, pinholes also have a deteriorating effect on the efficiency of solar cells. As a remedy, Qiu et al. studied the modification of MAPbI3 films with β-NaYF4:Yb,Er upconversion nanocrystals. The upconversion matrix was sandwiched between the perovskite and hole-transporting layer (HTL). It was found that the UNCPs also acted as pin-hole filling material and reduced the surface charge recombination along with upconversion. The UNCP materials are hydrophobic, thus contributing to the stability of the solar cell. The smoothness of the interface between the HTL and perovskite increased light absorption for wavelengths higher than 500 nm. This configuration reached an efficiency of 15.7% and was stable in an air atmosphere after 720 hours of storage.92
To further enhance the power conversion efficiency, the effects of surface plasmon resonance could be combined with the upconversion process. Park et al. investigated the effects of the silica-coated NaYF4:Yb3+,Er3+ upconversion material between the hole-transporting material and the gold electrode. They explored the combined effects of upconversion and surface plasmon resonance. A dry transfer method utilising polydimethylsiloxane (PDMS) was used for transferring the UCNP due to its hydrophobic nature. The contribution from upconversion was found to be rather low (∼1%); however, surface plasmon resonance is beneficial for solar cell efficiency. The UNCP deposited on gold film induced strong electromagnetic fields at the sharp Au bottom cores, which could interact with the UCNP layer. The reflection from the Au layer also contributed to the recycling of NIR light. They also studied the effects of UCNP on the solar cell performance when used with the perovskite layer and as an electron transporting layer (ETL) and obtained power conversion efficiencies of 14.40% and 11.07%, respectively, as compared to the 13.61% for the solar cell without upconversion material. The UCNP layer between the ETL and perovskite was found to be detrimental to the performance of the solar cell as the insulating nanoparticles added to the sheet resistance of the cell. However, the highest efficiency of 15.56% was achieved when the UNCPs were coated below the gold electrode.89 Ma et al. investigated another fabrication strategy for perovskite solar cells where a double layer of upconversion material was used next to the rear (Au) and front (FTO) electrode having device fabrication in the following manner: FTO/c-TiO2/UCNPs/perovskite/UCNPs/spiro-OMeTAD/Au. A β-NaYF4 doped with Yb3+ and Tm3+ was used as the upconversion material. The scattering effect of UCNP reflected the light into the perovskite layer promoting a better photoresponse. This encapsulated matrix provided long-term stability under the open environment of 20–25% relative humidity at 25 °C, retaining up to 80% of the initial power conversion efficiency after 846 hours. The PCE was improved from 15.2% to 18.2% using the upconversion material. The bottom and top layers of UCNP also contributed to better electron transport and smooth film morphology that increased the fill factor (FF) and open circuit voltage (VOC), whereas, the upconversion effect increased the short-circuit current density.72 Xu et al. also studied the effects of surface plasmon resonance for boosting the upconversion luminescence for the NaCsWO3@NaYF4@NaYF4:Yb,Er matrix. The upconversion luminescence intensity was enhanced more than 124 times using the optimum amount of NaCsWO3 (2.8 mmol%) and adding in the spiro-OMeTAD layer. The overall efficiency increased from 17.99% to 18.89% for the device with UCNPs (shown in Fig. 15).93
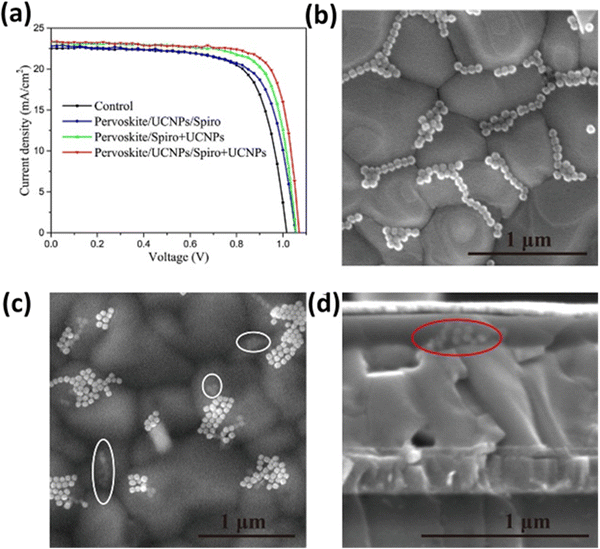 | ||
| Fig. 15 (a) J–V characteristics of several types of PSCs. Top-view SEM images of (b) perovskite/UCNP film and (c) perovskite/UCNP/spiro + UCNP film. (d) Cross-sectional SEM images of the PSC with the structure of ITO/SnO2/perovskite/UCNPs/spiro + UCNPs/Au. Reprinted with permission from the American Chemical Society.93 | ||
Another strategy is to use the upconversion material along with organic dyes. Bi et al. investigated the effect of NaYF4:Yb3+,Er3+@NaYF4:Yb3+,Nd3+ core–shell nanoparticles, along with dye sensitisation by IR-783 dye coupled with plasmonic Au nanorod (AuNR) film (shown in Fig. 16). For nanoparticles of less than 20 nm, the luminescence quantum efficiency is in the range of 0.1–1%, thus an enhancement in the absorption cross-section is essential. The dye layer acts as an antenna to absorb a broad band of light. Oleic acid at the surface of the UCNPs was removed through a ligand exchange reaction that connected dye molecules to the surface. There must be an efficient energy transfer between the dye molecules and Nd3+ ions, which was confirmed by the fluorescence decay curves of the IR-783 dye with and without UCNP. A decay in the lifetime of the IR-783 dye from 1.3 ns to 0.69 ns could be due to Fluorescence Resonance Energy Transfer (FRET) from dye molecules to Nd3+ ions. The energy transfer efficiency was calculated as follows:
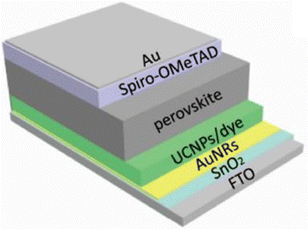 | ||
| Fig. 16 The structure of PSCs and the scattering and reflecting mechanism diagram. Reprinted with permission from the American Chemical Society.74 | ||
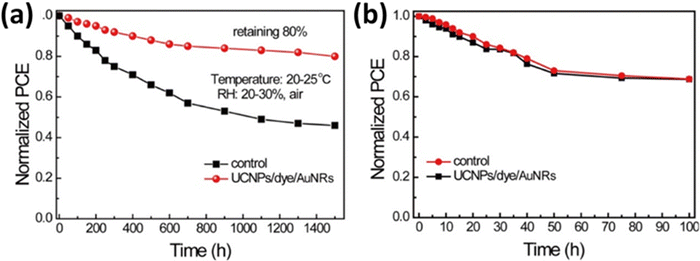 | ||
| Fig. 17 (a) The stability of devices for a control film and a film incorporating a UCNPs/IR-783 dye/AuNRs composite film under an air environment, RH = 20–30% and 20–25 °C. (b) Light stability of devices for a control film and a film incorporating a UCNPs/IR-783 dye/AuNRs composite under AM 1.5G irradiation. Reprinted with permission from the American Chemical Society.74 | ||
The perovskite solar cells have ample integration strategies for the incorporation of upconversion nanoparticles at different stages of the device fabrication, which are projected towards better photovoltaic performance. However, different levels of efficiencies have been achieved by the incorporation of UCNPs into different layers of the device. Thus, to achieve the maximum PCE, a variety of combinations of UCNPs with perovskite and other layers of the solar cell needs to be adopted along with the strategies to enhance the luminescence intensity of the upconversion nanoparticle itself.
3.3. Silicon solar cells
The enhancement of the efficiency of silicon solar cells, as they continue to dominate the solar cell market, remains an intriguing topic for researchers. They can utilize the solar spectrum up to 1100 nm but the mid-IR range largely goes unutilized, comprising a 20% share of the overall solar spectrum. This unutilized part of the spectrum provides the opportunity to improve the photoconversion efficiency of the existing silicon solar cell technology.94 While there have been several studies on DSSC and perovskite solar cells, the integration of upconversion nanoparticles in silicon solar cells remains unexplored. Various sophisticated deposition techniques play major roles in thin film solar cells, whereas the synthesis of UCNPs is mainly through the chemical synthesis route. The requirement of low phonon energy also hampers the possibility of doping lanthanides into various kinds of thin films. To overcome this challenge, a simple strategy of doping the upconversion material into a glass has been adopted, where this glass would be kept at the top of the photovoltaic device.Working on a similar pathway, Rodriguez et al. studied the effects of Yb3+ and Er3+-doped fluoroindate glass on the performance of a commercially available silicon solar cell. The Yb3+ and Er3+ ions have the capability of absorbing solar radiation at 1.54 μm. Yb3+ acts as a sensitizer due to its large cross-section area. Also, the chosen host matrix is fluoroindate glass, which provides very low phonon energy that necessitates at least 20 phonons for a non-radiative transition and, therefore, serves as a suitable host material for an upconverter. It has been found that the UC emission depends on the concentration of Er3+ ions with 0.1 mol% of Yb3+, where the most efficient performance was observed with 2.25 mol% of Er3+. The upconverter matrix was simply placed on the Si solar cell without using an index-matching oil, and the external quantum efficiency (EQE) was significantly improved with 37 mW excitation.96 More recently, Gracia et al. used a tellurite glass codoped with Eu3+ and silver nanoparticles for downconversion-induced enhancement in solar cells. The fabrication strategy was to use the UCNP on a glass substrate with a refractive index of 1.5, which was kept above the solar cell using oil (shown in Fig. 18) with a refractive index of 1.9 as an interface. Both the refractive indices should be close to each other to reduce the reflection coefficient. The oil interface ensures good optical contact between both elements and also reduces reflection losses, whereas the silver nanoparticles enhance the efficiency through surface plasmon resonance.95 Similarly, Gunji et al. investigated a germanate glass layer doped with Eu3+ ions and TiO2 nanoparticles.97 The refractive index requirements for this kind of glass-based configuration were confirmed by Zampiva et al. who used a simulation approach. It was observed that different layered configurations having an increasing refractive index right from the air interface to the bottom layer of solar cells were most efficient in reducing the reflection losses. Also, they fabricated a forsterite-based thin film, which provided the additional benefit of scratch resistance, humidity control and enhanced stability for the solar cell.97 The UCNPs showed an enhancement in the PCE of solar cells but the overall external quantum efficiency remained low.
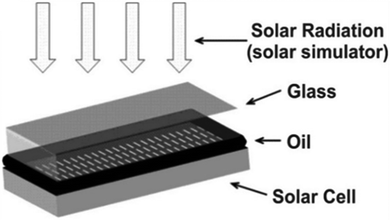 | ||
| Fig. 18 A Si solar cell covered with glass and the matching oil. Reprinted with permission from Elsevier.95 | ||
To overcome this issue, Chen et al. investigated the role of the loading medium on the UCNP performance. They synthesized a transparent UC film via a silane ligand exchange reaction (shown in Fig. 19), which provided the additional properties of strong bonding with the glass substrate, hydrophilic behaviour and enhanced the emission intensity. At the same time, it reduced the effects of the luminescence quenching of bare C–H and C–C vibrational oscillators. The low IR radiation screening capability of this rigid ligand exchange thereby resulted in an overall efficiency enhancement from 7.68% to 8.337% for a bifacial silicon solar cell. A transparent UC film could be utilised for further applications in the development of transparent solar cells.76 Similarly, the upconverter could be placed at the backside of the solar cell along with a reflective coating in which the upconverted light will get reflected to the silicon solar cell. However, the fabrication of the upconversion layer within the solar cell device remains a superior alternative to eliminate the reflection losses present in the glass-based fabrication strategy and removes the additional requirement of the matching oil. An alternate strategy is to use UCNPs on the backside of the solar cells.
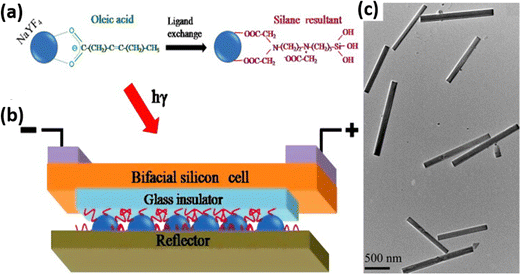 | ||
| Fig. 19 (a) Ligand exchange of NaYF4:Er nanocrystals. (b) A schematic of upconversion film application in silicon solar cells. (c) TEM image of NaYF4:Er nanocrystals dispersed in methanol after ligand exchange. Reprinted with permission from Elsevier.76 | ||
This has been explored by Ho et al. who utilised a YF3 matrix doped with Yb3+/Er3+ on the backside of silicon solar cells, since theoretically, the NIR-IR region of light could pass through a 150-μm-thick silicon substrate. These UCNPs were mixed with SiO2 at different concentrations of 3, 10, 20 and 30 wt%. Here, SiO2 also served as a passivation layer that additionally improved the solar cell efficiency. An array of groves (shown in Fig. 20) was formed using photolithographic etching and upconversion material was deposited in the as-designed groves. This setup yielded an increase in efficiency from 7.55% to 8.55% at a 30 wt% concentration of UCNP.77 The same group also investigated a similar device but with further improvements, including the texturization of silicon and Al2O3 as a passivation layer. The Al2O3 was further doped with Er/Yb nanophosophor to combine the effects of the passivation layer with upconversion. They also studied the effect of using silver as an anti-reflection coating at the back of the solar cell. The solar cell with 3 layers of SiO2 mixed with UNCP along with Al2O3 and silver coating yielded an efficiency enhancement of 3.84%.98 On the other hand, Wild et al. studied the effect of NaYF4:Yb3+18%/Er3+2% on the performance of amorphous silicon solar cells in combination with white paint back-reflectors. The UCNPs were dissolved in a solution of PMMA that was spin-coated on the backside of the standard p–i–n amorphous Si solar cell, which enhanced the short-circuit current density of 5 μA cm−2 using a 4 mW laser light.99 An important question that needs to be addressed while discussing these techniques is the adhesive properties of these nanoparticles on silicon substrates to get good-quality films. Trabelsi et al. utilised the spin coating technique for the thin film deposition of TiO2:Er3+–Yb3+. They investigated the SEM images to determine the adhesion properties of these UCNPs. It was found that the UCNPs adhered firmly to the n-Si substrate and formed a uniform thin layer.100 This backside configuration turned out to be an easy, yet efficient way of incorporating UCNPs into the devices, but drop-casting and spin-coating techniques still give films in the micrometre range, and there is still non-uniformity.
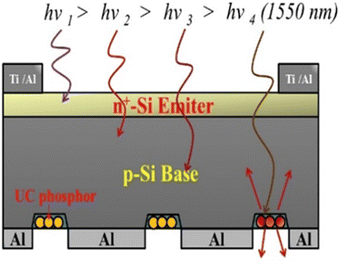 | ||
| Fig. 20 A schematic diagram showing a silicon solar cell with SiO2 coating containing YF3:Yb3+/Er3+ phosphor particles within the backside matrix grooves for use in the upconversion of photons under excitation by a light source with a wavelength of 1550 nm. Reprinted with permission from Elsevier.77 | ||
For further fabrication of controllable and uniform conformal thin films, other techniques need to be adopted. Grigoroscutta et al. investigated the CeO2 UC film doped with Yb/Er on a silicon solar cell prepared through pulsed laser deposition (PLD). The film was found to be affected by the PLD laser fluence, which varied from 1.7 J cm−2 to 3.7 J cm−2. The host matrix, CeO2 or ceria, has a phonon energy of 465 cm−1 and is transparent to the UV-Visible-NIR spectrum. Additionally, it has a greater capacity for the isomorphous substitution of rare earth ions. The solar cell characteristics for the p+–n–n+ Si diode were studied before and after CeO2 film deposition. It was observed that the different morphologies of CeO2 film (columnar, island and pyramidal) varied with the laser fluence. The film with the highest out-of-plane growth with respect to the in-plane growth component gave rise to an equiaxial spherical morphology and the highest device performance enhancement. While there was enhanced emission intensity with the increase in film thickness, growth defects also increased, which acted as luminescence quenchers. Therefore, the thickness of the film also affects the upconversion efficiency. The PCE varied with the laser fluence of PLD (shown in Fig. 21) and with the dopant (Yb/Er) elemental composition. It was found that the maximum efficiency of the solar cell was obtained at an elemental ratio of Yb![[thin space (1/6-em)]](https://www.rsc.org/images/entities/char_2009.gif) :
:![[thin space (1/6-em)]](https://www.rsc.org/images/entities/char_2009.gif) Er close to 4 and using film grown at 2.3 J cm−2 PLD laser fluence. A relative external quantum efficiency of 8.2% was obtained along with a maximum relative photoconversion efficiency of 12.1% for one-sun illumination.79 Ghazy et al. utilised the atomic layer deposition technique for the thin film deposition of (Er,Ho)2O3. They fabricated films with different thicknesses where the film with the highest thickness, i.e., 60 nm, gave the highest efficiency enhancement.101 Thus, deposition techniques are an important variable for the development of upconversion-based photovoltaics.
Er close to 4 and using film grown at 2.3 J cm−2 PLD laser fluence. A relative external quantum efficiency of 8.2% was obtained along with a maximum relative photoconversion efficiency of 12.1% for one-sun illumination.79 Ghazy et al. utilised the atomic layer deposition technique for the thin film deposition of (Er,Ho)2O3. They fabricated films with different thicknesses where the film with the highest thickness, i.e., 60 nm, gave the highest efficiency enhancement.101 Thus, deposition techniques are an important variable for the development of upconversion-based photovoltaics.
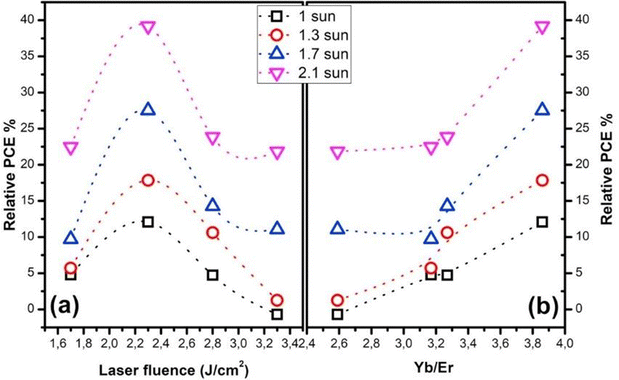 | ||
| Fig. 21 The relative PCE dependence on the laser fluence (a), and (b) the Yb/Er elemental ratio measured at different solar simulator incident powers. Reprinted with permission from Elsevier.75 | ||
The effects of surface plasmon resonance enhancement on upconversion luminescence have also been studied for silicon solar cells. Li et al. studied the efficiency enhancement in a p–i–n hydrogenated amorphous silicon solar cell using NaYF4:Yb/Er/Gd nanorods combined with gold nanoparticles. The UCNPs could be tuned in size up to 10 nm, with a cubic or hexagonal phase, and blue to green emission colour, using different doping concentrations. The UCNPs exhibited two strong emission bands at 540 and 660 nm, and a weak emission peak at 524 nm, corresponding to the 4S3/2 → 4I15/2, 4F9/2 → 4I15/2 and 2H11/2 → 4I15/2 transitions of Er3+, respectively. However, the formation of the nanorod architecture combined with gold nanoparticles improved the emission intensity by a factor of 3.2 and 9.6, respectively. A comparative study of the effects of the Au shell and nanoparticles on emission intensity was also conducted, which demonstrated a better efficiency using Au nanoparticles with UCNP. The solar cell with UCNP and Au nanoparticles showed a maximum efficiency enhancement of 72 times with a short-circuit current of 1.16 mA.80 Thakur et al. synthesized a composite of graphene with SiO2-coated UCNP. Here, the UCNPs were exploited as photo-absorbers and graphene acted as the electron transport layer. They fabricated a highly responsive photodetector giving a photoresponsivity of 2.7 × 10⁴ A W−1 as compared to the initial 1.52 × 10⁴ A W−1 under a 1.0 V bias and 980 nm irradiation. This approach could be utilised for efficiency enhancement in Si-graphene-based photovoltaics.102
Although upconversion materials have been integrated into silicon solar cells, their potential has not yet been fully exploited and the growth of UCNP thin films remains a barrier to their practical application in various deposition techniques. The integration of UCNPs into the active layers of silicon solar cells is, therefore, necessary for the effective improvement of photovoltaic performance.
4. Conclusion and outlook
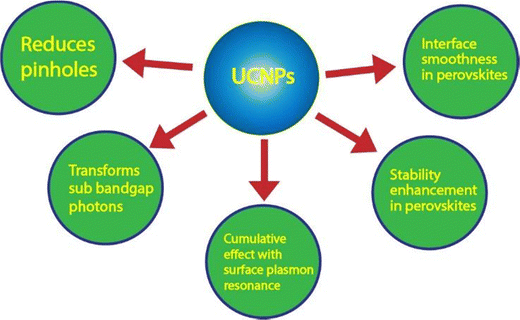
This review highlights the various mechanisms of the upconversion process and their applications in different photovoltaic technologies, including silicon, perovskite, and dye-sensitized solar cells (summarised in Table 2). The recent advancements in this strategy of enhancing the performance of solar cells are being widely explored. Several upconversion materials have been developed, of which the most promising matrix is NaYF4 due to its low phonon energy and activation by heavier lanthanide dopant ions like Yb3+, Er3+ and Eu3+, etc., leading to high efficiency along with high absorption cross-section area and narrow crystal field splitting. These matrices help to cover the broader range of the solar spectrum that often goes wasted by the present technologies of photovoltaics. They not only increase the light-harvesting efficiency of the solar cell but they are also beneficial for various other issues in current solar technology, including the presence of pinholes, losses due to surface charge recombination, and the roughness of deposited films (shown in Fig. 22). Therefore, the host matrix with maximum power conversion efficiency needs to be explored.| Device | UCNP | V oc | J sc (mA cm−2) | PCE (without UNCP) | PCE (with UNCP) | Enhancement (%) | Year/ref. |
|---|---|---|---|---|---|---|---|
| DSSC | YbF3/Ho3+ | 0.71 | 18.58 | 6.5 | 8.0 | 23 | 201658 |
| DSSC | NaGdF4:Yb,Er | 0.785 | 12.62 | 5.8 | 7.04 | 21.3 | 201359 |
| DSSC | Y2O3/Yb3+,Ho3+ | 0.791 | 18.97 | 8.9 | 9.82 | 10.33 | 202060 |
| DSSC | CeO2/Er3+,Yb3+ | 0.62 | 14.46 | 5.65 | 6.12 | 8.31 | 202261 |
| DSSC | BiYO3/Er3+,Yb3+ | 0.701 | 16.78 | 5.73 | 6.2 | 8.2 | 202162 |
| DSSC | NaYF4:Yb,Er@NaGdF4:Nd@SiO2 | 0.74 | 14.26 | 5.13 | 6.65 | 29.63 | 202263 |
| DSSC | NaYF4:Er3+,Yb3+@SiO2 | 0.71 | 13.03 | 5.96 | 6.34 | 6.3 | 201364 |
| DSSC | NaYF4:Yb3+,Er3+@NaYF4:Nd3+ core | 7.573 | 8.658 | 13.1 | 201765 | ||
| DSSC | NaYF4:Yb3+,Er3+@NaYF4:Eu3+ core/shell | 0.764 | 14.3 | 6.726 | 7.664 | 13.9 | 201887 |
| DSSC | NaYF4:Yb3+/Er3+@YOF:Yb3+/Er3+ core/shell | 0.74 | 16.53 | 7.02 | 8.39 | 17.1 | 201788 |
| Commercial Si solar cell | Fluoroindate glass/Er3+,Yb3+ | — | — | — | — | 0.1 | 201375 |
| p–i–n amorphous Si | NaYF4:Er3+Yb3+ | — | 10−5 | — | — | — | 201099 |
| Bifacial silicon | NaYF4:Er3+ | 0.596 | 36.861 | 7.68 | 8.337 | 8.6 | 201276 |
| p+–n–n+ Si diode | CeO2:Yb3+,Er3+ | — | 3.7 | — | — | 12.1 | 201879 |
| Hydrogenated amorphous Si | NaYF4:Yb/Er/Gd with Au nanoparticles | 0.41 | 1.16 | — | — | — | 201180 |
| Commercial crystalline Si solar cell | SiO2:YF3:Er3+,Yb3+ | 0.516 | 23.91 | 7.55 | 8.55 | 13.26 | 201993 |
| Al/textured Si/SiNx/Ag | SiO2/Al2O3:Er3+,Yb3+ | 0.604 | 40.99 | 16.91 | 17.56 | 3.84 | 202198 |
| FTO/TiO2/UCNP/MAPbI3/spiro-oMeTAD/Au | LiYF4:Er3+,Yb3+ | 1.0 | 21 | 11 | 11.869 | 7.9 | 201666 |
| FTO/TiO2 nanorods + UCNP/MAPbI3/spiro-oMeTAD/Ag | TiO2 nanorods: Er3+ | 0.67 | 22.97 | 9.1 | 10.6 | 16.5 | 201867 |
| FTO/TiO2/MAPbI3/UCNP/spiro-oMeTAD/Ag | NaYF4:Er3+,Yb3+ | 1.04 | 20.48 | 13.32 | 15.17 | 13.38 | 201892 |
| FTO/TiO2 nanorods/MAPbI3/spiro-oMeTAD + UCNP/Ag | Li(Gd,Y)F4:Yb3+,Er3+ | 1.1 | 23.14 | 14.69 | 18.34 | 24.8 | 201968 |
| FTO/TiO2/ZrO2:UCNP/perovskite/carbon | NaYbF4:Ho3+ | 0.975 | 25.16 | 11.12 | 14.32 | 28.8 | 201869 |
| FTO/TiO2 nanorods/SiO2:UCNP:SiO2/perovskite/carbon | SiO2/NaYF4:Yb3+,Er3+@SiO2 core–shell | 1.019 | 21.27 | 11.87 | 14.01 | 18 | 201971 |
| ITO/SnO2/perovskite/UCNP/spiro-oMeTAD + UCNP/Au | NaGdF4:Er3+/Yb3+ | 1.063 | 24.6 | 18.01 | 21.1 | 14.6 | 202270 |
| FTO/perovskite/spiro-OMeTAD/UCNPs/Au | NaYF4:Yb3+,Er3+ | 1.07 | 21.67 | 13.61 | 15.56 | 8.4 | 201989 |
| FTO/c-TiO2/UCNPs/perovskite/UCNPs/spiro-OMeTAD/Au | NaYF4:Yb3+,Tm3+ | 1.06 | 25.46 | 15.2 | 18.2 | 19.7 | 201972 |
| ITO/SnO2/perovskite/UCNPs/spiro-OMeTAD + UCNPs/Au | NaCsWO3@NaYF4@NaYF4:Yb3+,Er3+ | 1.08 | 23.26 | 17.99 | 18.89 | 5 | 202193 |
| ITO/SnO2/Au nanorods/UCNP + IR-783/perovskite/spiro-OMeTAD/Au | NaYF4:Yb3+,Er3+@NaYF4:Yb3+,Nd3+ core–shell | 1.167 | 23.26 | 19.4 | 21.1 | 8 | 202074 |
The efficiency of these architectures can further be enhanced using various strategies, including the formation of core–shell architectures, dye sensitization, and surface plasmon resonance as discussed in the previous sections. Additionally, upconversion nanoparticles are known to enhance the internal multiple scattering-mediated absorption of light that improves the light-harvesting capability of the various devices. The dye-sensitized solar cells and perovskite solar cells have shown tremendous results in efficiency with the incorporation of upconversion nanoparticles. The long battle of the stability issues of perovskite solar cells has been addressed using upconversion films to a certain extent. Many efficiency-enhancement strategies, including dye sensitization of the upconversion matrix, have been incorporated; however, the enhancement due to upconversion remains low. In the case of dye sensitization, the functionality of the dye determines the binding ability of the dye with the nanoparticles. Thus, the effect of different functionalities on the upconversion efficiency needs to be investigated. Along with this, surface plasmon resonance phenomena with different types of nanoparticles could be explored thoroughly to achieve better upconversion performance.
Silicon solar cells are the traditional pioneers of the photovoltaic industry and are near their theoretical efficiency limit and, thereby, various strategies have been recently adopted to tune their performance. However, most strategies include the use of upconversion nanoparticles on glass substrates, which are assembled along with the solar cell. A much better way would be to incorporate the matrix into various layers of the solar cells to minimize the reflection losses. In addition, the use of a matching oil interface between the solar cell and glass-based upconversion strategy poses various challenges when used along with textured solar cells including silicon nanowire-based technology and graphene-based silicon solar cells deteriorating the graphitic layer. Therefore, alternate strategies of device fabrication, including deposition techniques like sputtering, pulse layer deposition and atomic layer deposition, should be further explored. One such device fabrication strategy could be to use silicon nanowire architecture conformally coated with graphene and decorated with UCNPs (as shown in Fig. 23). Here, the UCNPs would transform the sub-bandgap photons and the upconverted light would be internally reflected and absorbed on the nanowire surface, which has been demonstrated in photovoltaic as well as photoelectrochemical applications.103,104 This configuration would eliminate the need for reflector materials to transfer upconverted light at the junction of the solar cell. Upconversion materials have potential applications in solving the energy demands of the world. Despite the various benefits of upconversion, the cost of lanthanides and upconversion photoluminescence efficiency need further exploration for the advancement of the photovoltaic industry and increasing renewable energy applications.
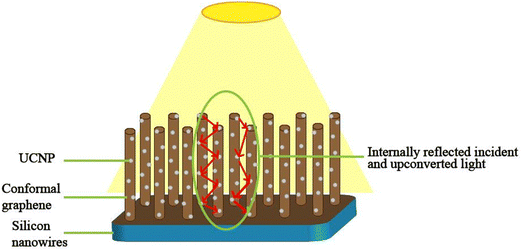 | ||
| Fig. 23 Schematic of the proposed solar cell with conformally coated graphene on silicon nanowires coated with upconversion nanoparticles. | ||
Conflicts of interest
There are no conflicts to declare.Acknowledgements
K. G. is grateful to Ministry of Textiles [Grant 2/3/2021-NTTM(Pt.)], Govt. of India. N. C. is thankful to CSIR, New Delhi, India [Grant No.-09/1129(13373)/2022-EMR-I] for providing financial support.References
- Solar Energy, IRENA, https://www.irena.org/Energy-Transition/Technology/Solarenergy.
- World Energy Resources: Solar,World Energy Council 2013, https://www.worldenergy.org/assets/images/imported/2013/10/WER_2013_8_Solar_revised.pdf.
- C. Chen, S. Zheng and H. Song, Chem. Soc. Rev., 2021, 50, 7250–7329 RSC.
- The History of Solar, https://www1.eere.energy.gov/solar/pdfs/solar_timeline.pdf.
- Solar Energy Market Outlook. 2026, https://www.alliedmarketresearch.com/solar-energymarket.
- IEA (2022), Solar PV, IEA, Paris, https://www.iea.org/reports/solar-pv.
- Operation and Physics of Photovoltaic Solar Cells: An Overview, https://revistas.utp.ac.pa.
- C. Ballif, F.-J. Haug, M. Boccard, P. J. Verlinden and G. Hahn, Nat. Rev. Mater., 2022, 7, 597–616 CrossRef.
- P. K. Nayak, S. Mahesh, H. J. Snaith and D. Cahen, Nat. Rev. Mater., 2019, 4, 269–285 CrossRef CAS.
- PV Magazine, https://www.pv-magazine.com/2022/11/21/longi-claims-worlds-highest-silicon-solar-cell-efficiency.
- A. Ghazy, M. Safdar, M. Lastusaari, H. Savin and M. Karppinen, Sol. Energy Mater. Sol. Cells, 2021, 230, 111234 CrossRef CAS.
- W. Shockley and H. J. Queisser, J. Appl. Phys., 1961, 32, 510–519 CrossRef CAS.
- C. Strümpel, M. McCann, G. Beaucarne, V. Arkhipov, A. Slaoui, V. Švrček, C. Del Cañizo and I. Tobias, Sol. Energy Mater. Sol. Cells, 2007, 91, 238–249 CrossRef.
- X. Liu, T. Chen, Y. Gong, C. Li, L. Niu, S. Xu, X. Xu, L. Pan, J. G. Shapter, Y. Yamauchi, J. Na and M. Eguchi, J. Photochem. Photobiol., Part C, 2021, 47, 100404 CrossRef CAS.
- D. I. Kim, J. W. Lee, R. H. Jeong and J.-H. Boo, Sci. Rep., 2022, 12, 697 CrossRef CAS PubMed.
- A. S. Sharma, A. Pusch, M. P. Nielsen, U. Römer, M. J. Y. Tayebjee, F. E. Rougieux and N. J. Ekins-Daukes, Sol. Energy, 2022, 237, 44–51 CrossRef CAS.
- N. S. Satpute, C. M. Mehare, A. Tiwari, H. C. Swart and S. J. Dhoble, ACS Appl. Electron. Mater., 2022, 4, 3354–3391 CrossRef CAS.
- A. Shalav, B. S. Richards and M. A. Green, Sol. Energy Mater. Sol. Cells, 2007, 91, 829–842 CrossRef CAS.
- J. Chen and J. X. Zhao, Sensors, 2012, 12, 2414–2435 CrossRef CAS.
- Y. Shang, S. Hao, C. Yang and G. Chen, Nanomaterials, 2015, 5, 1782–1809 CrossRef CAS PubMed.
- B. Zhou, B. Shi, D. Jin and X. Liu, Nat. Nanotechnol., 2015, 10, 924–936 CrossRef CAS PubMed.
- B. Golesorkhi, H. Nozary, A. Fürstenberg and C. Piguet, Mater. Horiz., 2020, 7, 1279–1296 RSC.
- H. Dong, L.-D. Sun and C.-H. Yan, Nanoscale, 2013, 5, 5703 RSC.
- B. Zhou, L. Yan, L. Tao, N. Song, M. Wu, T. Wang and Q. Zhang, Adv. Sci., 2018, 5, 1700667 CrossRef PubMed.
- J. Huang, L. Yan, Z. An, H. Wei, C. Wang, Q. Zhang and B. Zhou, Adv. Mater., 2023, 2310524 CrossRef PubMed.
- F. Auzel, Chem. Rev., 2004, 104, 139–174 CrossRef CAS PubMed.
- J. F. Da Silva, R. F. Da Silva, E. P. Santos, L. J. Q. Maia and A. L. Moura, Appl. Phys. Lett., 2020, 117, 151102 CrossRef CAS.
- P. Bharmoria, H. Bildirir and K. Moth-Poulsen, Chem. Soc. Rev., 2020, 49, 6529–6554 RSC.
- W. Yang, X. Li, D. Chi, H. Zhang and X. Liu, Nanotechnology, 2014, 25, 482001 CrossRef PubMed.
- S. Fischer, R. D. Mehlenbacher, A. Lay, C. Siefe, A. P. Alivisatos and J. A. Dionne, Nano Lett., 2019, 19, 3878–3885 CrossRef CAS PubMed.
- R. G. Felsted, A. Pant, A. B. Bard, X. Xia, D. R. Luntz-Martin, S. Dadras, S. Zhang, A. N. Vamivakas and P. J. Pauzauskie, Cryst. Growth Des., 2022, 22, 3605–3612 CrossRef CAS.
- X. Zhang, M. Wang, J. Ding, X. Song, J. Liu, J. Shao and Y. Li, RSC Adv., 2014, 4, 40223–40231 RSC.
- X. Zhou, B. E. Smith, P. B. Roder and P. J. Pauzauskie, Adv. Mater., 2016, 28, 8658–8662 CrossRef CAS PubMed.
- S. P. Tiwari, S. K. Maurya, R. S. Yadav, A. Kumar, V. Kumar, M.-F. Joubert and H. C. Swart, J. Vac. Sci. Technol., B: Nanotechnol. Microelectron.: Mater., Process., Meas., Phenom., 2018, 36, 060801 Search PubMed.
- G. Wang, Q. Peng and Y. Li, J. Am. Chem. Soc., 2009, 131, 14200–14201 CrossRef CAS PubMed.
- R. Singh, E. Madirov, D. Busko, I. M. Hossain, V. A. Konyushkin, A. N. Nakladov, S. V. Kuznetsov, A. Farooq, S. Gharibzadeh, U. W. Paetzold, B. S. Richards and A. Turshatov, ACS Appl. Mater. Interfaces, 2021, 13, 54874–54883 CrossRef CAS PubMed.
- X. He and B. Yan, J. Mater. Chem. C, 2013, 1, 3910 RSC.
- M. Haase and H. Schäfer, Angew. Chem., Int. Ed., 2011, 50, 5808–5829 CrossRef CAS PubMed.
- W. Kong, J. Shan and Y. Ju, Mater. Lett., 2010, 64, 688–691 CrossRef CAS.
- L.-Y. Yang, Y.-J. Dong, D.-P. Chen, C. Wang, N. Da, X. Jiang, C. Zhu and J. Qiu, Opt. Express, 2005, 13, 7893 CrossRef CAS PubMed.
- S. R. Johannsen, L. R. Lauridsen, B. Julsgaard, P. T. Neuvonen, S. K. Ram and A. N. Larsen, Thin Solid Films, 2014, 550, 499–503 CrossRef CAS.
- C. Xu, Q. Yang, G. Ren and Y. Liu, J. Alloys Compd., 2010, 503, 82–85 CrossRef CAS.
- B. S. Cao, J. L. Wu, N. S. Yu, Z. Q. Feng and B. Dong, Thin Solid Films, 2014, 550, 495–498 CrossRef CAS.
- R. L. Tranquilin, L. X. Lovisa, C. R. R. Almeida, C. A. Paskocimas, M. S. Li, M. C. Oliveira, L. Gracia, J. Andres, E. Longo, F. V. Motta and M. R. D. Bomio, J. Phys. Chem. C, 2019, 123, 18536–18550 CrossRef CAS.
- N. R. Aghamalyan, G. G. Demirkhanyan, R. K. Hovsepyan, R. B. Kostanyan and D. G. Zargaryan, Opt. Mater., 2010, 32, 1046–1049 CrossRef CAS.
- M. Yang, Y. Liang, Q. Gui, B. Zhao, D. Jin, M. Lin, L. Yan, H. You, L. Dai and Y. Liu, Sci. Rep., 2015, 5, 11844 CrossRef CAS PubMed.
- J. L. Wu, B. S. Cao, F. Lin, B. J. Chen, J. S. Sun and B. Dong, Ceram. Int., 2016, 42, 18666–18673 CrossRef CAS.
- R. Naccache, Q. Yu and J. A. Capobianco, Adv. Opt. Mater., 2015, 3, 482–509 CrossRef CAS.
- K. Du, J. Feng, X. Gao and H. Zhang, Light: Sci. Appl., 2022, 11, 222 CrossRef CAS PubMed.
- A. Nadort, J. Zhao and E. M. Goldys, Nanoscale, 2016, 8, 13099–13130 RSC.
- K. Malhotra, D. Hrovat, B. Kumar, G. Qu, J. V. Houten, R. Ahmed, P. A. E. Piunno, P. T. Gunning and U. J. Krull, ACS Appl. Mater. Interfaces, 2023, 15, 2499–2528 CrossRef CAS PubMed.
- H. Liu, K. Huang, R. R. Valiev, Q. Zhan, Y. Zhang and H. Ågren, Laser Photonics Rev., 2018, 12, 1700144 CrossRef.
- S. Han, R. Deng, X. Xie and X. Liu, Angew. Chem., Int. Ed., 2014, 53, 11702–11715 CrossRef CAS PubMed.
- X. Zheng, Y. Chen, S. Pan, Z. Liu, D. Xu, Y. Zhang and H. Lin, J. Fluoresc. Chem., 2022, 261–262, 110013 CrossRef CAS.
- R. K. Sharma, A.-V. Mudring and P. Ghosh, J. Lumin., 2017, 189, 44–63 CrossRef CAS.
- J. Hu, B. Zhao, R. Wen, X. Zhang, Y. Zhang, D. S. Kohane and Q. Liu, Nano Lett., 2023, 23, 5209–5216 CrossRef CAS PubMed.
- S. SeethaLekshmi, A. R. Ramya, M. L. P. Reddy and S. Varughese, J. Photochem. Photobiol., Part C, 2017, 33, 109–131 CrossRef CAS.
- J. Yu, Y. Yang, R. Fan, P. Wang and Y. Dong, Nanoscale, 2016, 8, 4173–4180 RSC.
- P. Ramasamy and J. Kim, Chem. Commun., 2014, 50, 879–881 RSC.
- P. Tadge, R. S. Yadav, P. K. Vishwakarma, S. B. Rai, T.-M. Chen, S. Sapra and S. Ray, J. Alloys Compd., 2020, 821, 153230 CrossRef CAS.
- M. Ambapuram, M. M. Parnapalli, G. Maddala, V. Tankasala, S. Kalvapalli and R. Mitty, Opt. Mater., 2022, 129, 112515 CrossRef CAS.
- J. Dutta and V. K. Rai, Opt. Laser Technol., 2021, 140, 107087 CrossRef CAS.
- S. Zhang, S. Dun, X. Guo and J. Zhang, Electrochim. Acta, 2022, 421, 140435 CrossRef CAS.
- Z. Zhou, J. Wang, F. Nan, C. Bu, Z. Yu, W. Liu, S. Guo, H. Hu and X.-Z. Zhao, Nanoscale, 2014, 6, 2052–2055 RSC.
- S. Hao, Y. Shang, D. Li, H. Ågren, C. Yang and G. Chen, Nanoscale, 2017, 9, 6711–6715 RSC.
- X. Chen, W. Xu, H. Song, C. Chen, H. Xia, Y. Zhu, D. Zhou, S. Cui, Q. Dai and J. Zhang, ACS Appl. Mater. Interfaces, 2016, 8, 9071–9079 CrossRef CAS PubMed.
- H. Zhang, Q. Zhang, Y. Lv, C. Yang, H. Chen and X. Zhou, Mater. Res. Bull., 2018, 106, 346–352 CrossRef CAS.
- X. Deng, C. Zhang, J. Zheng, X. Zhou, M. Yu, X. Chen and S. Huang, Appl. Surf. Sci., 2019, 485, 332–341 CrossRef CAS.
- Y. Li, L. Zhao, M. Xiao, Y. Huang, B. Dong, Z. Xu, L. Wan, W. Li and S. Wang, Nanoscale, 2018, 10, 22003–22011 RSC.
- J. Wu, S. Wei, X. Weng, R. Wang, H. Zhou and S. Cheng, Sol. Energy Mater. Sol. Cells, 2022, 248, 112029 CrossRef CAS.
- F. Qi, Y. Xiao, Z. Yu, P. Liu, S. Kong, F. Li, H. Zhang, Y. Wang and X.-Z. Zhao, Org. Electron., 2019, 73, 152–158 CrossRef CAS.
- D. Ma, Y. Shen, T. Su, J. Zhao, N. U. Rahman, Z. Xie, F. Shi, S. Zheng, Y. Zhang and Z. Chi, Mater. Chem. Front., 2019, 3, 2058–2065 RSC.
- M. Xu, Z. Xu, Z. Sun, W. Chen, L. Wang, Y. Liu, Y. Wang, X. Du and S. Pan, ACS Appl. Mater. Interfaces, 2023, 15, 3664–3672 CrossRef CAS PubMed.
- W. Bi, Y. Wu, C. Chen, D. Zhou, Z. Song, D. Li, G. Chen, Q. Dai, Y. Zhu and H. Song, ACS Appl. Mater. Interfaces, 2020, 12, 24737–24746 CrossRef CAS PubMed.
- M. A. Hernández-Rodríguez, M. H. Imanieh, L. L. Martín and I. R. Martín, Sol. Energy Mater. Sol. Cells, 2013, 116, 171–175 CrossRef.
- S. Chen, G. Zhou, F. Su, H. Zhang, L. Wang, M. Wu, M. Chen, L. Pan and S. Wang, Mater. Lett., 2012, 77, 17–20 CrossRef CAS.
- W.-J. Ho, C.-Y. Wei, J.-J. Liu, W.-C. Lin and C.-H. Ho, Vacuum, 2019, 166, 1–5 CrossRef CAS.
- W. Ho, P. Lu and J. Liu, Int. J. Energy Res., 2022, 46, 278–289 CrossRef CAS.
- M. Grigoroscuta, M. Secu, L. Trupina, M. Enculescu, C. Besleaga, I. Pintilie and P. Badica, Sol. Energy, 2018, 171, 40–46 CrossRef CAS.
- Z. Q. Li, X. D. Li, Q. Q. Liu, X. H. Chen, Z. Sun, C. Liu, X. J. Ye and S. M. Huang, Nanotechnology, 2012, 23, 025402 CrossRef CAS PubMed.
- B. O’Regan and M. Grätzel, Nature, 1991, 353, 737–740 CrossRef.
- T. W. Hamann, R. A. Jensen, A. B. F. Martinson, H. Van Ryswyk and J. T. Hupp, Energy Environ. Sci., 2008, 1, 66 RSC.
- M. Kokkonen, P. Talebi, J. Zhou, S. Asgari, S. A. Soomro, F. Elsehrawy, J. Halme, S. Ahmad, A. Hagfeldt and S. G. Hashmi, J. Mater. Chem. A, 2021, 9, 10527–10545 RSC.
- A. A. Ansari, V. K. Thakur and G. Chen, Coord. Chem. Rev., 2021, 436, 213821 CrossRef CAS.
- K. Kim, S. K. Nam and J. H. Moon, ACS Appl. Energy Mater., 2020, 3, 5277–5284 CrossRef CAS.
- G. Shan and G. P. Demopoulos, Adv. Mater., 2010, 22, 4373–4377 CrossRef CAS PubMed.
- T. Chen, Y. Shang, S. Hao, L. Tian, Y. Hou and C. Yang, Electrochim. Acta, 2018, 282, 743–749 CrossRef CAS.
- L. Tian, Y. Shang, S. Hao, Q. Han, T. Chen, W. Lv and C. Yang, Adv. Funct. Mater., 2018, 28, 1803946 CrossRef.
- J. Park, K. Kim, E.-J. Jo, W. Kim, H. Kim, R. Lee, J. Y. Lee, J. Y. Jo, M.-G. Kim and G. Y. Jung, Nanoscale, 2019, 11, 22813–22819 RSC.
- S. S. Dipta and A. Uddin, Energy Technol., 2021, 9, 2100560 CrossRef CAS.
- C. Chen, S. Zheng and H. Song, Chem. Soc. Rev., 2021, 50, 7250–7329 RSC.
- L. Qiu, Y. Yang, G. Dong, D. Xia, M. Li, X. Fan and R. Fan, Appl. Surf. Sci., 2018, 448, 145–153 CrossRef CAS.
- F. Xu, Y. Sun, H. Gao, S. Jin, Z. Zhang, H. Zhang, G. Pan, M. Kang, X. Ma and Y. Mao, ACS Appl. Mater. Interfaces, 2021, 13, 2674–2684 CrossRef CAS PubMed.
- C. Battaglia, A. Cuevas and S. De Wolf, Energy Environ. Sci., 2016, 9, 1552–1576 RSC.
- J. A. M. Garcia, L. Bontempo, L. A. Gomez-Malagon and L. R. P. Kassab, Opt. Mater., 2019, 88, 155–160 CrossRef CAS.
- C. Fuentes-Hernandez, W.-F. Chou, T. M. Khan, L. Diniz, J. Lukens, F. A. Larrain, V. A. Rodriguez-Toro and B. Kippelen, Science, 2020, 370, 698–701 CrossRef CAS PubMed.
- R. Y. S. Zampiva, C. G. Kaufmann, L. H. Acauan, R. L. Seeger, F. Bonatto, C. D. Boeira, W. Q. Santos, C. Jacinto, C. A. Figueroa, L. S. Dorneles, A. K. Alves, C. P. Bergmann and C. S. Ten Caten, Sol. Energy, 2018, 170, 752–761 CrossRef CAS.
- W. Ho, P. Lu and J. Liu, Int. J. Energy Res., 2022, 46, 278–289 CrossRef CAS.
- J. De Wild, A. Meijerink, J. K. Rath, W. G. J. H. M. Van Sark and R. E. I. Schropp, Sol. Energy Mater. Sol. Cells, 2010, 94, 1919–1922 CrossRef CAS.
- F. Trabelsi, F. Mercier, E. Blanquet, A. Crisci and R. Salhi, Ceram. Int., 2020, 46, 28183–28192 CrossRef CAS.
- A. Ghazy, M. Safdar, M. Lastusaari, A. Aho, A. Tukiainen, H. Savin, M. Guina and M. Karppinen, Sol. Energy Mater. Sol. Cells, 2021, 219, 110787 CrossRef CAS.
- M. K. Thakur, A. Gupta, M. Y. Fakhri, R. S. Chen, C. T. Wu, K. H. Lin and S. Chattopadhyay, Nanoscale, 2019, 11, 9716–9725 RSC.
- S. Riyajuddin, S. Kumar, D. Badhwar, S. A. Siddiqui, J. Sultana and K. Ghosh, Sustainable Energy Fuels, 2021, 5, 3160–3171 RSC.
- S. Riyajuddin, J. Sultana, S. A. Siddiqui, S. Kumar, D. Badhwar, S. S. Yadav, S. Goyal, A. Venkatesan, S. Chakraverty and K. Ghosh, Sustainable Energy Fuels, 2022, 6, 197–208 RSC.
| This journal is © The Royal Society of Chemistry 2024 |

