 Open Access Article
Creative Commons Attribution 3.0 Unported Licence
Diffusive properties of solvent molecules in the neighborhood of a polymer chain as seen by Monte-Carlo simulations
M.
Kozanecki
*a,
K.
Halagan
a,
J.
Saramak
a and
K.
Matyjaszewski
ab
aDepartment of Molecular Physics, Lodz University of Technology, Zeromskiego 116, Lodz 90924, Poland. E-mail: marcin.kozanecki@p.lodz.pl; Fax: +48 42 6313218; Tel: +48 42 6313205
bDepartment of Chemistry, Carnegie Mellon University, 4400 Fifth Avenue, Pittsburgh, Pennsylvania 15213, USA
First published on 20th April 2016
Abstract
The influence of both polymer chain length and concentration on the mobility of solvent molecules in polymer solutions was studied by Monte Carlo simulations with the use of the dynamic lattice liquid (DLL) model. The poly(vinylmethylether)–water system was used as a model. Two different solvent (water) states with differing mobilities were distinguished in polymer solutions. The first one with high molecular mobility independent of polymer concentration corresponds to bulk solvent in real systems. The second state relates to so called bound solvent. In this case the solvent diffusivity decreases with polymer content. For diluted solutions the diffusion of bound solvent is affected by polymer chain length, precisely, by the ability of the polymer chain to undergo coil formation.
Introduction
A significant difference in the size of solvent and polymer molecules results in an important difference in their mobility. In consequence, many polymer systems (concentrated solutions, membranes, gels) deviate from normal (Fickian) diffusion.1–7 Diffusion is an especially important issue in stimuli responsive gels exhibiting volume phase transition (VPT). In such systems, molecular mobility (diffusivity in the case of water and molecular relaxations of polymer segments) is one of the key factors that determine dynamics of VPT.8,9 VPT and other phase transitions are accompanied by a drastic change in local polymer concentration and by a change in the character of diffusion.8,10–14 Poly(vinylmethylether) (PVME) is a perfect candidate for a model of stimuli responsive polymer, because of its simple chemical structure and the many experimental results collected for neat PVME as well as for its solutions and gels.8,10–27 Moreover, the PVME–water systems may be easily considered by the coarse-graining procedure with conservation of the natural scale of objects and distances between them28 – see also Fig. 1.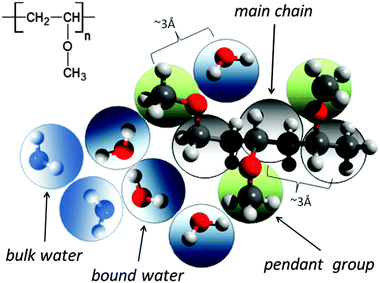 | ||
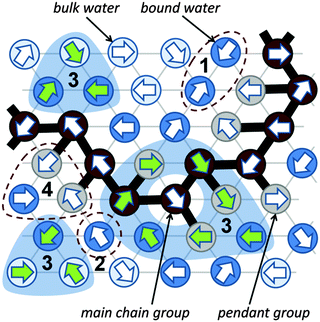
| Fig. 1 Chemical structure of PVME and scheme of the coarse-graining procedure applied to transfer the real PVME–water system to the lattice simulations. | ||
According to the model proposed by Maeda,29 water in hydrogels may be classified as:
(a) strong (primary) or weak (secondary) bound water depending on the type of intermolecular interactions between water and polymer network,
(b) interstitial water closed in a confined space of entangled chains,
(c) bulk water distant from polymer segments.
Similar classification may be introduced also for water in a solution of linear polymers. Water in various states differs in terms of ability for crystallisation and also rotational and vibrational dynamics.11–13,16,17,21,24,25,30–32 Thus, these states may be distinguished by some experimental methods such as differential scanning calorimetry,30 neutron scattering,33,34 vibrational16,17,31,32 and dielectric spectroscopies.29,35,36 The diffusive properties of water as well as various useful additives (tracers, drugs, ionic and non-ionic solutes, nanoparticles) in polymer systems have still been explained insufficiently.1–7,37 Experimental techniques useful to characterise diffusive properties — like fluorescence correlation spectroscopy (FCS),3–6 dynamic light scattering,38 nuclear magnetic resonance2,39,40 — give only an average picture of the sample, without distinction between water in its various states. However, recently two fractions of diffusant differed in terms of mobility were distinguished by FCS.4,6,7 Thus, the presented problem seems to be especially attractive for computer simulations.
Recently, it was shown that the presence of polymer chains in the direct neighbourhood of solvent (water) molecules significantly reduced their mobility.28
In this work the influence of polymer chain length and polymer concentration on the mobility of solvent molecules in various states will be discussed in light of theoretical models as well as experimental data.
Theoretical background
The classical approach to diffusion based on Fick's laws originated from an assumption that the particle movements are governed by Brownian motions. In that case the mean-squared displacement 〈r2〉 is proportional to time t:| 〈r2〉 = kt, | (1) |
| 〈r2〉 ∼ tα, | (2) |
Many factors influence molecular mobility in polymer systems: temperature, pressure, molecular mass of a polymer and its dispersion, polymer concentration, polymer topology, diffusant size and shape, inter- and intramolecular interactions and others.1,2,5 Such a wide variety of variables has resulted in many models being proposed in this field. These models may be grouped into three main classes:
(a) models based on free volume theory41–47 – which assume that the free volume is a key factor controlling molecular mobility; rearrangement of free volume creates the holes being a transport channels for diffusant;
(b) models based on obstruction48–52 – where macromolecules are regarded as motionless; in consequence both mean path length and self-diffusion coefficient of a diffusant increase;
(c) models based on hydrodynamic theories53–58 – which take into account hydrodynamic interactions such as friction.
Some other models as well as detailed presentation and comparison of those mentioned above are available in literature.5
Coarse-graining procedure
The studies presented herein concerned a model system that reflects well the aqueous solutions of PVME. In order to transfer the real PVME–water system to the lattice simulations, the coarse-graining procedure was applied. It is schematically presented in Fig. 1 and has been described in detail elsewhere.28 Three types of united-atoms (grains) such as: water (H–O–H), main chain (–CH–CH2–) and pendant group (–O–CH3) were introduced. Only two types of water acting as a solvent were distinguished: bound water directly interacting with polymer by excluded volume, and bulk water located at further distances (see Fig. 1 and 2). Distinction between strong and weak bound water requires the consideration of electrostatic interactions in the system, and additional energetic tests should be introduced to the algorithm. Such an approach, although interesting, results in a significant increase in computing time. Thus, in this paper only excluded volume interactions were taken into account.Dynamic lattice liquid model
The dynamic lattice liquid (DLL) model was first published in 1997 by T. Pakula.59 This model treats a matter as a large set of grains (united-atoms, super-atoms) representing molecules or their parts. The grains are located in the nodes of the network representing their temporary positions. To form bigger molecules, like polymer chains, stars, brushes and others, the grains may be joined by the non-breakable and inextensible (over length of one lattice constant) bonds. It is assumed that each bead has some free excess volume to vibrate around its temporal position. Each bead displacement is considered as an attempt of movement to a neighboring lattice site. A set of possible vectors of movement attempts is equal to lattice coordination number for simplicity. In a dense system long range motion can take place only by cooperative displacement due to the caging effect of neighbors. One of the most powerful advantages of the DLL model is the possibility to work in a dense system (full occupation of lattice) without any holes of molecular size. It has been achieved by the assumption that the translation of the elements over larger distances than vibration range take place only in a cooperative manner – in a frame of closed “cooperative loops” as presented in Fig. 2 (the 2D system is presented in Fig. 2 for clarity).The DLL model fulfills the continuity equation and provides the correlated movements of ‘molecules’ as in a real liquid. The excluded volume is preserved for beads – only one molecule can be present in a lattice node at any time, and for bonds – molecules cannot move across the bonds. The DLL model does not reproduce all properties known from the liquid mechanics but it is sufficient for studies of coarse-grained models. Moreover, the dynamic properties, which it produces, are in good agreement with those established for liquids in general.60,61 The DLL model has been successfully used to characterize many complex phenomena, like: diffusion limited aggregation,62 reaction diffusion front problems,63 polymer solution dynamics,64 gelation in cross-linked polymeric systems,65–68 spinodal decomposition69,70 and diffusion in crowed environments.71
The Monte Carlo Step (MCS) applied to realize the DLL model in the athermal case reflects discrete time. The single MCS unit includes four operations: (1) random generation of movement attempts vectors (represented in Fig. 2 by arrows) assigned to every lattice bead simultaneously. (2) Immobilization of elements which cannot be moved, e.g. elements engaged in movement attempts leading to: violation of the excluded volume, creation of a vacant site or breaking a bond; examples are presented in Fig. 2 as scenarios 1, 2 and 4 respectively. (3) Selection of groups of vectors (from remaining elements) coinciding with contours of closed continuous paths (loops). (4) Movement of elements along these loops by one lattice constant.
To relate the above defined MCS unit to real time and length scales the comparison of diffusion constant of pure water determined from the DLL algorithm with experimental data is possible. Taking into account that the valuable data for DLL calculations (see ref. 60) related to the athermal case (the electrostatic interactions were neglected), the experimental data should be considered for relatively high temperatures (to minimalize influence of water–water H-bonds on diffusivity). Such a rough estimation leads to the conclusion that 1 MCS is near about 6 × 10⁻¹³ s. This value should be similar for diluted polymer systems analyzed in this paper. However, one should be aware that time scaling will be different for higher polymer concentrations due to conformational constraints.
Experimental
All simulations were carried out on a 3D 503 FCC lattice (coordination number = 12) with periodic boundary conditions. Various lengths of PVME macromolecules (from 5 to 360 polymer units) in different concentrations were studied. A wide range of concentrations and polymer molecular masses allowed us to obtain systems with differing morphology and diffusive properties. In the most extreme case, there was only 1 chain with a length of 360 polymer units in the computational box (1 wt% solution). Contrarily, for the shortest PVME chains, 6693 macromolecules were necessary to reach highly concentrated systems – 65 wt%. Polymer chains were virtually synthesized by a well-known pseudo-living controlled polymerization method.28,65 Kinetic chains were killed when the tailored length of a particular macromolecule was achieved. Therefore, for all samples the molecular mass dispersity was exactly 1. Of course, this is an inaccessible value of molecular mass dispersity in real synthesis, nevertheless, it is not far from the values (1.02–1.05) found for polymers prepared by controlled radical polymerization methods, like atom transfer radical polymerization (ATRP).72–75 This simplification used in the proposed approach is useful to separate effects related to polymer chain length from effects related to polymer concentration.The character of diffusion in a polymer systems often depends on the observation time scale. For long time scales the 〈r2〉 increases usually with time according to the Einstein relation – proportionally to the self-diffusion coefficient Dself:
 | (3) |
 | (4) |
 | (5) |
A(t) = A0![[thin space (1/6-em)]](https://www.rsc.org/images/entities/char_2009.gif) exp(−(t/τ)β), exp(−(t/τ)β), | (6) |
To characterize the morphology (homogeneity) of polymer solutions with different polymer chain lengths and different concentrations, radial pair correlation function gxy(r) was defined as follows:
 | (7) |
The characteristic correlation length ξ was estimated for polymer–polymer correlation, to describe the homogeneity of particular systems numerically, according to the formula:
gpp/g0(r) = R0![[thin space (1/6-em)]](https://www.rsc.org/images/entities/char_2009.gif) exp(−(r/ξ)) + y0, exp(−(r/ξ)) + y0, | (8) |
Results and discussion
A. Comparison with theoretical models and experimental results
In the first approach to analysis of the DLL simulation results, all solvent molecules were treated en masse, without differentiation between the bulk and bound states. It was the only way to validate the used method because of a lack of experimental data as well as theoretical models distinguishing various states of solvent in polymer systems. However, strong intermolecular interactions play an important role in aqueous solutions of PVME, especially below the lower critical solution temperature.13,17 Results presented herein neglected all electrostatic and friction interactions. They may be considered as a limiting case where excluded volume effects are more important than electrostatic interactions. It is also necessary to underline that an introduction of interactions to the DLL algorithm-based simulations leads to a new variable — temperature — and results in a significant increase in computing time (by 2–3 orders even for the most simple isotropic form, like Ising type interactions). Moreover, the presented results are more universal and may be expanded (scaled) to other polymer systems with the ratio of size of monomer unit to solvent close to 2.The presented simulations cover a relatively broad range of polymer concentrations and chain lengths. Most of the samples are in diluted or semi-diluted regimes. Taking into account that the solvent molecules are the main object of the investigation presented herein, it is also worth noting, that for all systems water molecules percolate forming a continuous phase.
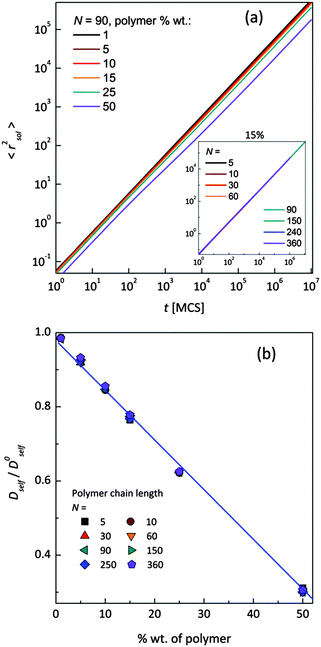
Mean-squared displacement of solvent molecules 〈rsol2〉, measured in lattice spacing units, as a function of time t expressed in Monte Carlo Steps (MCS) units for different PVME weight fractions and one selected chain length (N = 90) is shown in Fig. 3a. For long time scales 〈rsol2〉 increases with time according to Einstein relation (see eqn (3)).
Increasing PVME concentration slightly slows down solvent diffusion. The inset in Fig. 3a presents solvent diffusion for different polymer chain lengths N in the systems with 15 wt% of polymer. Differences due to chain length are negligible. Self-diffusion coefficients for solvent were calculated for times over 1![[thin space (1/6-em)]](https://www.rsc.org/images/entities/char_2009.gif) 000
000![[thin space (1/6-em)]](https://www.rsc.org/images/entities/char_2009.gif) 000 MCS i.e. in a range of normal diffusion (where α was close to 1). Solvent diffusion coefficients in PVME solutions calculated and normalized in relation to self-diffusion coefficient in pure solvent (Dself/D0self) are presented in Fig. 3b. The dependence of Dself/D0self in a function of polymer content is linear in whole range of concentrations, independently of polymer chain length.
000 MCS i.e. in a range of normal diffusion (where α was close to 1). Solvent diffusion coefficients in PVME solutions calculated and normalized in relation to self-diffusion coefficient in pure solvent (Dself/D0self) are presented in Fig. 3b. The dependence of Dself/D0self in a function of polymer content is linear in whole range of concentrations, independently of polymer chain length.
Fig. 4a and b shows an impact of polymer concentration and chain lengths on solvent diffusion parameter α in short and intermediate time scales (below 105 MCS). In this range the results were averaged over 30 independent runs. As it was mentioned in Theory section, α < 1 indicates anomalous character of the solvent diffusion. This slowed-down diffusion is called sub-diffusion and is observed in fractal or porous environments.1 A convenient way to analyze the time dependent exponent α is to plot the logarithmic derivative of 〈r2〉 defined in eqn (4). The results for different polymer content and one selected chain length (N = 90) are presented in Fig. 4a. A low PVME fraction (1 wt%) does not influence the dynamics of solvent (α is close to 1 in whole investigated region).
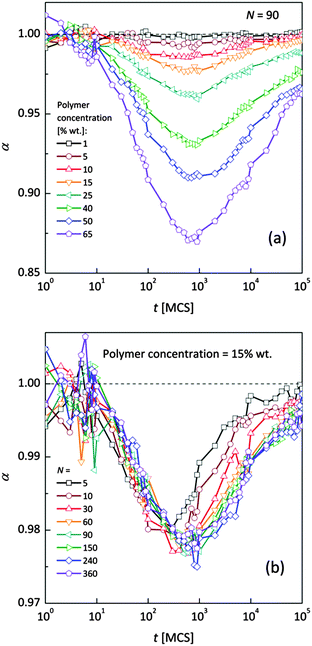 | ||
| Fig. 4 Exponent α as a function of time: (a) for different polymer weight concentrations and (b) for various chain lengths N. | ||
If polymer concentration increases, the slowing down effect is more significant and reaches a maximum (minimum of α exponent) near t = 103 MCS independently of polymer content. Over longer time scales normal diffusion is recovered. The above described dynamic behaviour of solvent can be explained by a smaller amount of excluded volume from polymer grains and bonds than in concentrated solutions. Fig. 4b presents the results for different N for one selected polymer concentration (15 wt%). A slight shift of minimum of α = f(t) dependences towards shorter times and a lesser slowing down effect were found only for short chains (N < 60). For longer chains the character of solvent diffusion is independent of polymer molecular mass.
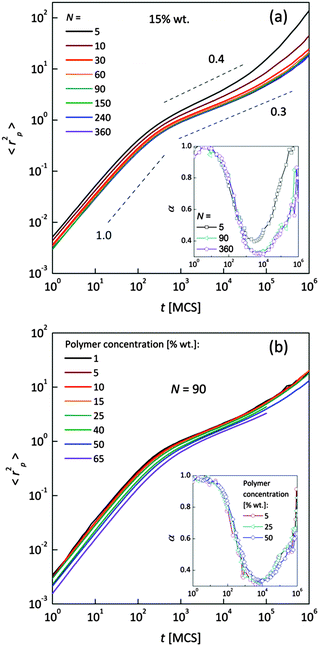
The polymer beads dynamics at short and intermediate time scales was also analyzed to confirm an influence of polymer chain length on solvent mobility in highly diluted systems. Fig. 5 presents mean square displacement 〈rp2〉 of united-atoms (grains) averaged over all elements representing polymer without differentiation between “main chain” and “pendant group” elements. Expressed this way, polymer mobility offers higher sensitivity to sub-diffusion effects than the center of mass diffusion, as Polanowski and Pakula showed.61 Unfortunately, it is difficult to compare these results with experimental data because they do not correspond directly to segmental motions (accessible for broadband dielectric spectroscopy or dynamical mechanical analysis) nor to diffusion of macromolecule center of mass.
In Fig. 5a samples with various chain lengths (for polymer content = 15 wt%) are presented. The inset shows diffusion exponent α determined according to eqn (4), for some selected samples. Three different diffusion regimes can be distinguished. Below 101 MCS, normal diffusion is observed (slope = 1). Then, up to 105–106 MCS, a large slowing down is observed (sub-diffusion zone). After that the normal diffusion starts to recover again. For the shortest chains the minimum α is close to 0.4; for the longest ones – 0.3. A similar value (α = 0.5) was found for neat PVME (without any solvent) by molecular dynamics simulations.34 Higher polymer concentration results in lower displacement of polymer elements. The differences in diffusion character vanish for chain lengths close to 90 polymer units. This corresponds well to chain length dependence of solvent relaxation times for short chains – Fig. 4b. Fig. 5b shows the 〈rp2〉 = f(t) dependences for one selected chain length (N = 90) and different polymer contents. Higher polymer concentrations result in lower diffusion of polymer elements. No threshold value can be observed. Such behavior relates to a nonlinear increase of relaxation times of bound solvent as a function of polymer content, which will be discussed in the next section (compare Fig. 8).
To validate the DLL simulation results, the relation presented in Fig. 3b was analyzed in the frame of various models known form the literature.5 Thus, the results were recalculated for easier comparison with experimental data as well as with theoretical predictions. In Fig. 6 the Dself/D0self ratio is shown in a semi-logarithmic representation as a function of polymer volume fraction (φP) on the background of experimental data collected for methyl methacrylate (MMA)–poly(methyl methacrylate) (PMMA) and ethylbenzene (EtPh)–polystyrene (PS) systems. Additionally, a line representing the Mackie–Meares model was added (doted lines in Fig. 6). This model is one of the simplest and of the most popular models. It assumes, that the diffusion coefficient of small solvent molecule (DSM), of the same size as the monomer unit is given by the equation:
 | (9) |
(a) The Mackie–Meares model belongs to the diffusion models based on obstruction effect, which means that the polymer chain is treated as immobile; in the case of the performed simulations macromolecules could move freely.
(b) The mentioned model diffusant (solvent) was assumed to be equal in size to a polymer unit, while in simulations its size was two times smaller in comparison to the polymer unit.
(c) The Mackie–Meares model does not take into account the free volume interactions in the system.
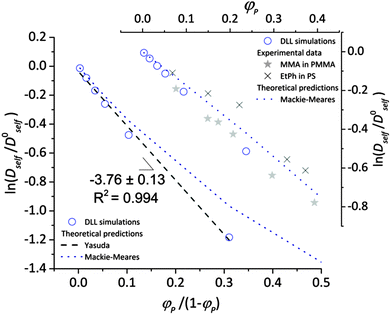 | ||
| Fig. 6 Comparison between results of the DLL simulation for selected polymer chain length N = 90, experimental data from ref. 48 and theoretical predictions.42,50 | ||
The free volume models seem to be more appropriate to describe the results of the DLL simulations. However most of them introduce also other interactions. The Fujita's model41 assumes that the diffusion coefficient of small solvent molecule relates to the average free volume per molecule, temperature and size of diffusant. However, this model was used to characterize the diffusion of various particles (including oligomers) in polymer solutions,2,77,78 gels79 and even in solid state,42 Masaro and Zhu5 stated that it is adequate to describe diffusion of small-sized molecules, mostly organic, in diluted and semi-diluted polymer solutions. The model proposed by Vrentas and Duda44–46 takes into account several physical parameters such as temperature, polymer concentration, solvent size and its molecular weight, activation energy for a solvent “jump” and even glass temperatures of both polymer and a solvent. One of the biggest disadvantages of this model is the number of independent parameters (14) needed to apply it. It is also worthy to note the model proposed by Peppas and Reinhart.47 It is especially useful to describe hydrogel systems and polymer membranes, as it considers a mesh size of polymer network and the hydrodynamic radius of a diffusant.80
In the performed studies only excluded volume interactions are taken into account. Thus, the above mentioned models seem to be not fully appropriate to describe properly obtained simulation results. One of the simplest models based on free volume theory was proposed by Yasuda.42 Their main assumptions are very similar to those of the DLL algorithm, as follows:
(a) the polymer is less mobile than the solvent,
(b) the effective free volume is contributed to mainly from a solvent,
(c) there are no additional interactions between polymer and the diffusing molecule,
(d) solvent diffusion decreases with increasing polymer concentration.
As a result, the self-diffusion coefficient of a small solvent molecule may be expressed as follows:
 | (10) |
B. Diffusion of bulk and bound solvent
Fig. 7 shows, at different polymer concentrations, some exemplary autocorrelation curves A(t) (defined according to eqn (5) – see Experimental section) for solvent molecules. It is clearly visible that the autocorrelation functions of bulk solvent are independent of polymer concentration.28 The autocorrelation functions for bound solvent are sensitive to polymer concentration. The higher the polymer concentration, the lower diffusivity of bound solvent.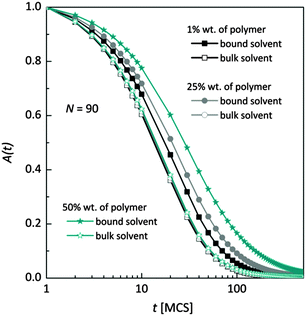 | ||
| Fig. 7 Autocorrelation functions for bound and bulk solvent for solutions differ on polymer concentration. Polymer chain length was 90. | ||
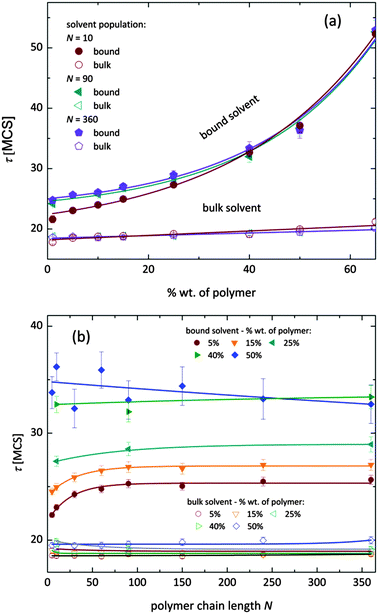
To qualitatively compare the solvent mobility in different vicinities of polymer, the characteristic diffusion relaxation times of solvent in various states were calculated using the KWW equation (see eqn (6)). Relaxation times for various solvent states as a function of polymer content are presented in Fig. 8a. Relaxation times for bulk solvent increase very slightly with polymer concentration. This effect insignificantly relates to the cooperativity of movement and results from the large slowing down of both polymer and bound solvent (compare to Fig. 5).
As expected, bulk solvent dynamics do not depend on polymer chain length – see Fig. 8b. In the case of bound solvent, the effect of polymer content is clearly seen. Higher relaxation times of bound solvent in comparison to bulk solvent were found even for highly diluted solutions. For diluted systems the relaxation times of bound solvent depend also on the polymer chain length. Relaxation times of bound solvent for samples containing short chains are smaller than for samples with longer chains. The threshold chain length, where no further differences between relaxation times are observed, is close to 90, as shown in Fig. 8. The differences in relaxation times of bound solvent vanish for higher polymer contents, and are not observed for a system with polymer concentration higher than 40 wt%. Such behaviors suggest that a large polymer content reduces the long-distance mobility of short chains and, in consequence, influences solvent dynamics.
As it was shown, diffusion relaxation times of bound solvent are significantly influenced by polymer concentration and, within a limited range, also by chain length. This can be explained taking into account that the molecular mobility is governed by the system morphology and assuming cooperativity of movements. Thus, the polymer mobility influences solvent mobility in direct proximity of polymer chains. Higher mobility of short chains is suppressed in samples with high polymer concentration. This fact can be confirmed by analysis of an average neighborhood in the samples.
Fig. 9 presents the histograms of a normalized number of solvent molecules surrounded by n number of polymer elements for systems with different polymer content and for selected chain lengths. In diluted solutions containing short chains the fraction of solvent with a small number of neighboring polymer elements (<4) is more pronounced than in solutions containing longer chains. Also, the fraction of solvent with a larger number of polymer elements in the neighborhood (>6) is smaller for chains of length 10 that for 90 and higher. No significant differences are seen for systems containing chains of length 90 and longer. This means that in the system with a low polymer concentration, short chains are surrounded more uniformly by solvent than the longer ones. The reason is the different homogeneity of the systems. Long chains form coils where solvent “inclusions” are surrounded mainly by polymer. The shorter the chains the better dispersion of polymer chains.
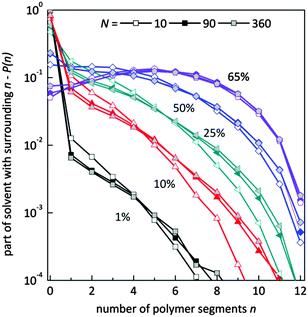 | ||
| Fig. 9 Histograms of a normalized number of solvent molecules surrounded by n number of polymer elements for different polymer content (in wt%) and for selected chain lengths. | ||
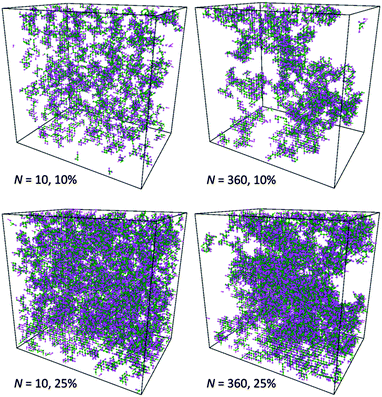
This observation is confirmed by analysis of computational box snapshots for various polymer concentrations and chain lengths (some example snapshots are presented in Fig. 10). The solutions of PVME with a chain length of 360 are clearly more heterogeneous in comparison to solutions of PVME with a chain length 10. The regions of high polymer content and empty spaces (pores) filled with solvent are clearly visible for systems containing longer polymer chains. Contrarily, short polymer chain systems are homogenous even at relatively high polymer concentrations.
Fig. 11a shows the normalized radial polymer–polymer (pp) pair correlation functions prepared according to eqn (7). Systems containing various chain lengths are shown for one selected polymer content (15 wt%). Values close to 1 stand for pure solvent, while 0 represents pure polymer. For short chains, uniform solvent concentration is reached faster than for longer ones. The chain length effect vanishes for macromolecules containing more than 90 polymer units. Also, for the shortest measurable distance (equal to one lattice constant) shorter chains are statistically surrounded by more solvent molecules than the longer ones.
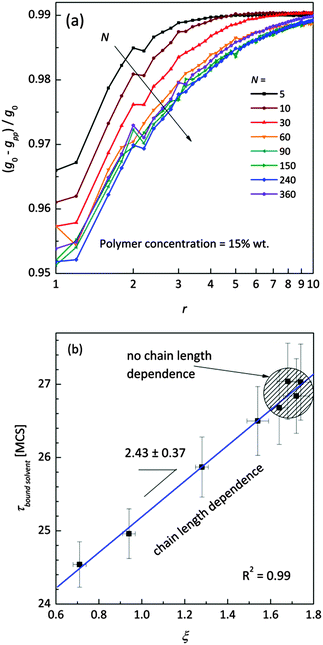 | ||
| Fig. 11 (a) Normalized (to pure FCC lattice g0) radial polymer–polymer pair correlation functions presented as difference functions. Various chain lengths are shown for the selected polymer weight content (15 wt%). (b) Correlation between diffusion relaxation time of bound solvent and ξ parameter describing the homogeneity of polymer–solvent systems from eqn (8). | ||
This fact also indicates enhanced homogeneity in that case. Fig. 11b presents the dependence of diffusion time for bound solvent as a function of characteristic parameter ξ for the solutions containing 15 wt% of polymers with different lengths. The ξ parameter was determined according to eqn (8) and may be used as a measure of system homogeneity. A high correlation between these two parameters is clearly visible. This means that the bound solvent diffusivity is strictly joined with the morphology (homogeneity) of the polymer system.
The homogeneity of the studied systems should be also reflected in the percolation threshold (one can expect that for more homogenous systems the percolation threshold for polymer chains should be shifted to lower values). As Adamczyk et al.81 showed for 2D systems, the percolation threshold is an important factor influencing anomalous diffusion in polymer solutions. Performed herein rough estimation of percolation thresholds showed that polymer chains always percolate independently of chain length, for polymer concentrations higher than 20 wt%. For the concentrations lower than 7–8 wt%, percolation of polymer chains was not observed in any sample. It was also impossible to detect any specific correlation between diffusive properties and percolation for investigated 3D systems. Nevertheless, the determination of a reliable phase diagram of studied systems seems to be a very interesting problem for future studies. Moreover, solvent molecules percolated in all investigated systems independently of polymer concentration and chain length.
Finally, it is necessary to underline the consistency between the presented results and FCS data4,6,7 showing a deviation from the single Fickian diffusion model in PNIPAAM cross-linked systems.
It was shown that two types of diffusion processes may be distinguished in the PNIPAAM gels under the volume phase transition. The authors correlated them with two possible diffusant trajectories in heterogeneous systems:
(a) through a solvent-rich region only – related to the fast diffusion contribution in the experimental autocorrelation function and to normal diffusion,
(b) through polymer-rich regions – related to the slow diffusion contribution in the experimental autocorrelation function and to sub-diffusion.
However, the referred to FCS experiments relate to the diffusion of small tracer molecules, while the results of the MC simulations reported herein correspond to solvent diffusion, though their qualitative comparison seems to be fully rational. Especially, taking into account the much lower size of both solvent and tracer molecules in comparison to significantly lager and less mobile macromolecules or networks.
Conclusions
The results of simulations performed with the use of the DLL model are consistent with experimental data4,6,7 as well as with theoretical predictions (Yasuda's model based on free volume concept).39,42 Two different solvent states with differing mobility were evidently distinguished in the polymer solutions. The first one with a high molecular mobility independent of polymer concentration corresponds to bulk solvent in real systems. The second state relates to so called bound solvent. In this case the solvent diffusivity strongly depends on the polymer content in the system. Moreover, in diluted solutions, the bound solvent diffusion is affected by polymer chain length. These specific behaviours were correlated to the homogeneity of the polymer systems. The solutions containing long chains are more heterogeneous in comparison to solutions with short chain lengths due to the formation of coils. As a result, short chains are surrounded more uniformly by solvent than the longer ones in the diluted solutions. For concentrated solutions, the effect of chain length is lost because the fraction of bulk solvent significantly decreases and most of the solvent molecules are surrounded by polymer elements.The presented results are a good introduction to study polymer systems with complex architectures such as dendrimers, stars, brushes and networks. Thus, further investigations focused on the influence of the various topologies of macromolecules on solvent diffusion are planned.
Acknowledgements
The research was partially supported by Polish National Science Centre grants No. 2013/09/B/ST4/03010 and 2014/14/A/ST5/00204. The Authors are grateful to Prof. Jacek Ulanski and Prof. Piotr Polanowski for comments and fruitful discussions.Notes and references
- R. Metzler and J. Klafter, Phys. Rep., 2000, 339, 1 CrossRef CAS.
- J.-M. Petit, X. X. Zhu and P. M. Macdonald, Macromolecules, 1996, 29, 70 CrossRef CAS.
- A. Vagias, J. Schultze, M. Doroshenko, K. Koynov, H.-J. Butt, M. Gauthier, G. Fytas and D. Vlassopoulos, Macromolecules, 2015, 48, 8907 CrossRef CAS.
- A. Vagias, R. Raccis, K. Koynov, U. Jonas, H.-J. Butt, G. Fytas, P. Kosovan, O. Lenz and C. Holm, Phys. Rev. Lett., 2013, 111, 088301 CrossRef PubMed.
- L. Masaro and X. X. Zhu, Prog. Polym. Sci., 1999, 24, 731 CrossRef CAS.
- R. Raccis, R. Roskamp, I. Hopp, B. Menges, K. Koynov, U. Jonas, W. Knoll, H.-J. Butt and G. Fytas, Soft Matter, 2011, 7, 7042 RSC.
- P. Vagias, K. Kosovan, C. Koynov, H.-J. Holm, G. Butt and G. Fytas, Macromolecules, 2014, 47, 5303 CrossRef.
- R. Casalini and C. M. Roland, J. Chem. Phys., 2003, 119, 4052 CrossRef CAS.
- J. Zhang and W. G. Hodge, US Pat., 113901, 2010 Search PubMed.
- K. van Durme, G. van Assche, E. Nies and B. van Mele, J. Phys. Chem. B, 2007, 111, 1295 CrossRef PubMed.
- K. van Durme, E. Loozen, E. Nies and B. van Mele, Macromolecules, 2005, 38, 10234 CrossRef CAS.
- E. Loozen, K. van Durme, E. Nies, B. van Mele and H. Berghmans, Polymer, 2006, 47, 7034 CrossRef CAS.
- F. Meeussen, Y. Bauwens, R. Moerkerke, E. Nies and H. Berghmans, Polymer, 2000, 41, 3737 CrossRef CAS.
- E. Nies, T. Li, H. Berghmans, R. K. Heenan and S. M. King, J. Phys. Chem. B, 2006, 110, 5321 CrossRef CAS PubMed.
- M. Pyda, K. van Durme, B. Wunderlich and B. van Mele, NATAS Notes, 2005, 47, 7 Search PubMed.
- Y. Maeda, Langmuir, 2001, 17, 1737 CrossRef CAS.
- Y. Maeda, H. Mochiduki, H. Yamamoto, Y. Nishimura and I. Ikeda, Langmuir, 2003, 19, 10357 CrossRef CAS.
- Y. Maeda, H. Yamamoto and I. Ikeda, Langmuir, 2004, 20, 7339 CrossRef CAS PubMed.
- L. Hanykova, J. Spevacek and M. Ilavsky, Polymer, 2001, 42, 8607 CrossRef CAS.
- L. Hanykova, J. Labuta and J. Spevacek, Polymer, 2006, 47, 6107 CrossRef CAS.
- Y. T. Tamai, Macromolecules, 1996, 29, 6750 CrossRef CAS.
- H. Schafer-Soenen, R. Moerkerke, H. Berghmans, R. Koningsveld, K. Dusek and K. Solc, Macromolecules, 1997, 30, 410 CrossRef.
- N. Shinyashiki, Y. Matsumura, S. Mashimo and S. Yagihara, J. Chem. Phys., 1996, 104, 6877 CrossRef CAS.
- J. Zhang, B. Berge, F. Meeussen, E. Nies, H. Berghmans and D. Shen, Macromolecules, 2003, 36, 9145 CrossRef CAS.
- J. Zhang, H. Teng, X. Zhou and D. Shen, Polym. Bull., 2002, 48, 277 CrossRef CAS.
- T. Schmidt, I. Janik, S. Kadlubowski, P. Ulanski, J. M. Rosiak, R. Reichelt and K.-F. Arndt, Polymer, 2005, 46, 9908 CrossRef CAS.
- S. Richter, Colloid Polym. Sci., 2004, 282, 1213 CAS.
- J. Saramak, K. Halagan, M. Kozanecki and P. Polanowski, J. Mol. Model., 2014, 20, 2529 CrossRef CAS PubMed.
- Y. Maeda and H. Kitano, Spectrochim. Acta, Part A, 1995, 51, 2433 CrossRef.
- M. Pastorczak, S. Kadlubowski, L. Okrasa, M. Kozanecki, G. Boiteux, J. Rosiak and J. Ulanski, J. Non-Cryst. Solids, 2007, 353, 4536 CrossRef CAS.
- M. Pastorczak, G. Dominguez-Espinosa, L. Okrasa, M. Pyda, M. Kozanecki, S. Kadlubowski, J. M. Rosiak and J. Ulanski, Colloid Polym. Sci., 2014, 292, 1775 CAS.
- M. Pastorczak, M. Kozanecki and J. Ulanski, Polymer, 2009, 50, 4535 CrossRef CAS.
- Y. Maréchal, The Hydrogen bond and the water molecule – the physics and chemistry of water, aqueous and bio mediaElsevier, Amsterdam, 2007 Search PubMed.
- S. Capponi, PhD thesis, The University of the Basque Country, 2011.
- A. Richter, A. Turke and A. Pich, Adv. Mater., 2000, 19, 1109 CrossRef.
- T. Fukasawa, T. Sato, J. Watanabe, Y. Hama, W. Kunz and R. Buchner, Phys. Rev. Lett., 2005, 95, 197802 CrossRef PubMed.
- J. Siepmann and F. Siepmann, Int. J. Pharm., 2008, 364, 328 CrossRef CAS PubMed.
- K. L. Linegar, MSc thesis, University of Maryland, 2008.
- S. Matsukawa and I. Ando, Macromolecules, 1996, 29, 7136 CrossRef CAS.
- M. Holz, S. R. Heila and A. Saccob, Phys. Chem. Chem. Phys., 2000, 2, 4740 RSC.
- H. Fujita, Adv. Polym. Sci., 1961, 3, 1 CrossRef CAS.
- H. Yasuda, C. E. Lamaze and L. D. Ikenberry, Die Makromolekulare Chemie, 1968, 118, 19 CrossRef CAS.
- J. S. Vrentas and J. L. Duda, J. Polym. Sci., Polym. Phys. Ed., 1977, 15, 403 CrossRef CAS.
- J. S. Vrentas and J. L. Duda, J. Polym. Sci., Polym. Phys. Ed., 1977, 15, 417 CrossRef CAS.
- J. S. Vrentas, J. L. Duda and H. C. Ling, J. Polym. Sci., Polym. Phys. Ed., 1985, 22, 459 CrossRef.
- J. S. Vrentas, J. L. Duda and H. C. Ling, J. Polym. Sci., Polym. Phys. Ed., 1985, 23, 275 CrossRef CAS.
- N. A. Peppas and C. T. Reinhart, J. Membr. Sci., 1983, 15, 275 CrossRef CAS.
- A. R. Waggoner, F. D. Blum and J. M. D. MacElroy, Macromolecules, 1993, 26, 6841 CrossRef.
- P. C. Griffiths, P. Stilbs, B. Z. Chowdhry and M. J. Snowden, Colloid Polym. Sci., 1995, 273, 405 CAS.
- J. S Mackie and P. Meares, Proc. R. Soc. London, Ser. A, 1955, 232, 498 CrossRef.
- A. G. Ogston, B. N. Preston and J. D. Wells, Proc. R. Soc. London, Ser. A, 1973, 333, 297 CrossRef CAS.
- J. F. Brady, Hindered Diffusion, San Francisco, CA, 1994 Search PubMed.
- R. I. Cukier, Macromolecules, 1984, 17, 252 CrossRef CAS.
- G. D. J. Phillies, Macromolecules, 1986, 19, 2367 CrossRef CAS.
- G. D. J. Phillies, Macromolecules, 1987, 20, 558 CrossRef CAS.
- A. R. Altenberger, M. Tirrell and J. S. Dahler, J. Chem. Phys., 1986, 84, 5122 CrossRef CAS.
- P. G. Gennes, Macromolecules, 1976, 9, 587 CrossRef.
- P. Gao and P. E. Fagerness, Pharm. Res., 1995, 12, 955 CrossRef CAS.
- T. Pakula and J. Teichmann, J. Mol. Liq., 2000, 86, 109 CrossRef CAS.
- P. Polanowski and T. Pakula, J. Chem. Phys., 2003, 118, 11139 CrossRef CAS.
- P. Polanowski and T. Pakula, J. Chem. Phys., 2004, 120, 6306 CrossRef CAS PubMed.
- P. Polanowski, J. Chem. Phys., 2007, 353, 4575 CAS.
- P. Polanowski and Z. Koza, Phys. Rev. E: Stat. Phys., Plasmas, Fluids, Relat. Interdiscip. Top., 2006, 74, 36103 CrossRef PubMed.
- P. Polanowski and T. Pakula, J. Chem. Phys., 2002, 117, 4022 CrossRef CAS.
- H. Gao, P. Polanowski and K. Matyjaszewski, Macromolecules, 2009, 42, 5929 Search PubMed.
- P. Polanowski, J. K. Jeszka and K. Matyjaszewski, Polymer, 2010, 51, 6084 CrossRef CAS.
- P. Polanowski, J. K. Jeszka, W. Li and K. Matyjaszewski, Polymer, 2011, 52, 5092 CrossRef CAS.
- P. Polanowski, J. K. Jeszka and K. Matyjaszewski, Polymer, 2013, 54, 1979 CrossRef CAS.
- K. Halagan and P. Polanowski, J. Non-Cryst. Solids, 2009, 355, 1318 CrossRef CAS.
- K. Hałagan and P. Polanowski, Acta Phys. Pol., A, 2015, 127, 585 CrossRef.
- P. Polanowski and A. Sikorski, Soft Matter, 2014, 10, 3597 RSC.
- K. Matyjaszewski, Macromolecules, 2012, 45, 4015 CrossRef CAS.
- K. Matyjaszewski and N. V. Tsarevsky, Nat. Chem., 2009, 1, 276 CrossRef CAS PubMed.
- K. Matyjaszewski and J. Xia, Chem. Rev., 2001, 101, 2921 CrossRef CAS PubMed.
- K. Matyjaszewski and A. H. E. Müller, Prog. Polym. Sci., 2006, 31, 1039 CrossRef CAS.
- R. Kohlrausch, Ann. Phys. Chem., 1854, 91, 56 CrossRef.
- D. L. Gilbert, T. Okano, T. Miyata and S. W. Kim, Int. J. Pharm., 1988, 47, 79 CrossRef CAS.
- S. X. Chen and R. T. Lostritto, J. Controlled Release, 1996, 38, 185 CrossRef CAS.
- W. E. Hennink, H. Talsma, J. C. H. Borchert, S. C. De Smedt and J. Demeester, J. Controlled Release, 1996, 39, 47 CrossRef CAS.
- N. A. Peppas and S. R. Lustig, in Hydrogels in Medicine and Pharmacy. Vol. 1. Fundamentals, ed. N. A. Peppas, CRC Press, Boca Raton, 1987, vol. 1, pp. 57–83 Search PubMed.
- P. Adamczyk, P. Polanowski and A. Sikorski, J. Chem. Phys., 2009, 131, 234901 CrossRef PubMed.
| This journal is © The Royal Society of Chemistry 2016 |

