Deciphering the structure and potassium-ion transport mechanism of potassium borate glass†
Lulu
Song
ab,
Alex C.
Hannon
 c,
Steve
Feller
d,
Ruirui
Liu
 a,
Peyton
McGuire
d,
Bo
Zhang
a,
Yongquan
Zhou
a,
Peyton
McGuire
d,
Bo
Zhang
a,
Yongquan
Zhou
 a,
Wu
Li
 *a and
Fayan
Zhu
 *a
*a
aKey Laboratory of Green and High-end Utilization of Salt Lake Resources, Qinghai Institute of Salt Lakes, Chinese Academy of Sciences, Xining 810008, China. E-mail: zhufayan@126.com
bUniversity of Chinese Academy of Science, Beijing 100049, China
cISIS Facility Rutherford Appleton Laboratory, Chilton, Didcot, Oxon OX11 0QX, UK
dCoe College, Physics Department, 1220 First Ave NE, Cedar Rapids, IA 52402, USA
First published on 26th April 2024
Abstract
Potassium borate glass has great potential as an ion transport material. The ion transport rate is closely related to the microstructure of the glass. However, the disorder and variations in boron and oxygen atom types in the glass structure pose challenges in the analysis of this complex glass structure. In this work, the structure of potassium borate glass was unveiled through the neutron diffraction method and ab initio molecular dynamics (AIMD) simulations. The B–O, K–O, and O–O atomic interactions, bond lengths, coordination numbers, cavity distribution, ring structure distributions and other detailed information in the microstructure of potassium borate glass were obtained. By comparing the structure and properties of potassium borate glass with those of crystals of similar components, it is found that the bond lengths of 3B–BO (BO, bridging oxygen), 4B–BO and 3B–NBO (NBO, non-bridging oxygen) are longer than those of corresponding crystals, so the structure of the boron–oxygen network is looser and the density is smaller than that of similar crystals. Moreover, we found a rule that in both borate glass and crystal, the increase of NBO shortened the length of the B–O bond, and the increase of 4B increased the length of the B–O bond. The key structures affecting the transport rate of K+ were NBO, chain structure units and cavities. This work will provide reference data for designing and developing electrically conductive amorphous materials with faster potassium-ion transport rates.
1. Introduction
Potassium borate glass is widely used as a glass-forming agent,1–5 which can be utilized to design and prepare new materials with potential applications in optics, electrochemistry, radiation shielding, etc. Alkali metal borate glass exhibits excellent nonlinear optical properties,6 and the borate groups composed of B–O–B bonds contribute to enhancing the optical characteristics of glasses.7 Currently, radiation shielding materials are popular for their use in various fields such as electricity production, military surveillance, and research activities.8,9 Thermoluminescence (TL) is the most basic characteristic of radiation dose materials. Borate glass has excellent thermoluminescence properties, and has better transparency, mechanical strength, and chemical durability.10,11 Therefore, it is a high-performance shielding material that is expected to replace concrete. Potassium-ion batteries (PIBs) have advantages such as abundant reserves, low cost, and oxidation–reduction potentials similar to those of lithium-ion batteries (LIBs), making them preferred alternatives to LIBs.12 The introduction of potassium ions into borate glass helps to improve the strength and electron emission capacity of this glass.13 In terms of bioactive amorphous materials, the addition of K2O enhances ion diffusion rates to promote bone formation.14 The abnormal properties of potassium borate glass depend on its structure, and the diversity of structural units and the variability of K–O and B–O coordination numbers bring challenges to its structural analysis.A variety of techniques have been used to study the complex structures of borate glass. Raman spectroscopy indicates that the main structural units present in potassium borate glass include metaborate units, pyroborate units, orthoborate units, boroxol rings, di-borate groups and tetraborate groups.15–1911B NMR experimental results and physical–chemical models suggest that the peak value of N4 occurs at x = 0.30.19,20 Wright et al.21 used neutron diffraction to determine the distance of the first coordination shell of B–O interactions in the 0.28K2O·0.7211B2O3 glass structure as being ∼1.4 Å, with rB–O(B∅3) = 1.38 Å and rB–O(B∅4−) = 1.46 Å. Handa et al.22 reported that the B–O, K–O and O–O bond lengths in 0.20K2O·0.8011B2O3 glass are 1.39, 2.83 and 2.40 Å, respectively. At higher B∅4−/NBO ratios, alkali and alkaline earth metal cations primarily act as “network formers”, while at higher NBO contents, they primarily act as “network modifiers”.23–26 Furthermore, at higher NBO contents, the main oxygen atoms in B∅4− units are also NBOs.23 An increase in B∅4− content in this glass helps to enhance its thermal and mechanical stability, while an increase in NBO results in denser glass,27 because the B–NBO bond is longer than the B–BO bond.28 In zinc borate glass, the density increases and the molar volume decreases with increasing ZnO content.29 In lithium borate glass, the density initially increases and then decreases, while the molar volume decreases with increasing Li2O content.30 The arrangement of network modifier atoms in uniformly nucleated glass structures is close to that in crystals of a similar component.31,32 The study of metallic glass also shows that the medium range structure exists in both glass and crystal,33 and the medium range structure is closely related to magnetic order.34 The above literature shows that the short and medium-range ordered structure is the key structure of glass, which is crucial for the regulation of microscopic properties. At present, the ion-transport mechanism of potassium borate glass as a solid electrolyte remains to be explored, and there is a lack of relevant studies into the effect of short- and medium-range structural changes on the amorphous properties, especially the internal relationship between NBO, B∅4− and density, ion transport and other properties, which are still unclear.
In this work, neutron diffraction experimental data are analyzed using EPSR and difference subtraction methods, and structure information on potassium borate glass is obtained. Meanwhile, the molecular dynamics simulation method is used to supplement the verification. The effect of glass structure on ion transport, density and molar volume is discussed based on obtaining the structure information of atomic interaction distance and coordination number, ring and chain structure unit, micro-cavity distribution and NBO content change. This study provides a reference for revealing the influence of the medium- and short-range structure on amorphous properties.
2. Experimental
2.1. Sample preparation and characterization
Using isotopic boric acid of analytical purity (purity: 99.27%, company: Eagle-Picher) and potassium carbonate of analytical purity (purity: 99.0%) as raw materials, they were thoroughly mixed in a platinum crucible and then heated in a muffle furnace at 1000 °C for 15 minutes. The temperature was raised to 1100 °C and heating continued for 10 minutes. Colorless, transparent, and uniform potassium borate glass samples with composition xK2O·(1 − x)11B2O3 (x = 0.10, 0.20, 0.30, and 0.40) were prepared by the quenching method on a flat plate. As potassium borate glass is highly hygroscopic, the prepared samples were first sealed and then stored in a nitrogen atmosphere glove box.The composition, mass density (ρn), atomic density (ρa), and molar volume (Vm) of potassium borate glass are shown in Table 1. The deviation of sample composition caused by mass loss is within ±0.016. For calculations formulas of atomic density and molar volume, and for the conversion formula of isotopic sample density to natural boron sample density, please refer to our previous work.30
| Sample | Nominal composition | Composition from mass loss | ρ n (iso) | ρ n (nat) | V m | |||
|---|---|---|---|---|---|---|---|---|
| K2O (x) | 11B2O3 | K2O | 11B2O3 | (g cm−3) | (g cm−3) | ρ a (Å−3) | (mol cm−3) | |
| 0.10K2O·0.9011B2O3 | 0.1000 | 0.9000 | 0.0925 | 0.9075 | 2.0200 | 2.0102 | 0.0843 | 35.7310 |
| 0.20K2O·0.8011B2O3 | 0.2000 | 0.8000 | 0.1958 | 0.8042 | 2.1303 | 2.1211 | 0.0868 | 34.7531 |
| 0.30K2O·0.7011B2O3 | 0.3000 | 0.7000 | 0.2879 | 0.7121 | 2.2644 | 2.2556 | 0.0900 | 33.3799 |
| 0.40K2O·0.6011B2O3 | 0.4000 | 0.6000 | 0.3840 | 0.6160 | 2.2788 | 2.2707 | 0.0893 | 33.7523 |
2.2. Neutron diffraction
Neutron diffraction experiments on potassium borate glass were conducted on the GEM diffractometer at the ISIS Spallation Neutron Source (Rutherford Appleton Laboratory)35 in the UK. The experiments were carried out in a vacuum-sealed vanadium can at room temperature (inner diameter 8.3 mm, wall thickness 25 μm) in an attempt to reduce contact between the sample and air, considering that the potassium borate glass sample is prone to moisture absorption and deterioration during the experiment. The standard ATLAS program36 was used to correct the data from detector groups 1, 2, 3, 4, and 5 (covering a 2θ range from 5.32° to 107.07°) for background diffraction and container diffraction, multiple diffraction, self-attenuation and inelastic (Placzek) effects to obtain a distinct scattering function i(Q). The neutron diffraction data of the measured vanadium niobium rod were used for data normalization. The i(Q) data were subjected to Fourier transformation and Lorch correction37 to obtain the total correlation function T(r). The relevant calculation equations follow,38,39 where the distinct scattering i(Q) is given by the following equation: | (1) |
Structural information may then be obtained by Fourier transformation of i(Q), yielding the total correlation function
 | (2) |
 | (3) |
The correlation function is a weighted sum of partial correlation functions, tll′(r)
 | (4) |
2.3. Molecular dynamics simulation
Born–Oppenheimer molecular dynamics simulation of the potassium borate glass structure was carried out using the CP2K program.40 The generalized gradient approximation and the PBE function were applied.41 The initial atomic configuration of vitreous potassium borate was generated using packmol.42 The cubic simulation box at room temperature contains approximately 400 atoms (depending on the composition of each sample, as shown in Table S1†) to match the experimental number density. Further optimization is performed using density functional theory (DFT), and the molecularly optimized consistent polarization double-zeta basis set DZVP43 and Goedecker–Teter–Hutter (GTH) type pseudopotentials44 are adopted for each atom involved. The FPMD simulation after DFT optimization starts at 298.15 K. A Nosé–Hoover heat bath45,46 with a length of 3 is used in a typical NVT ensemble. The samples are heated from 298.15 K to above the glass transition temperature (∼925 K) to 1398.15 K with a gradient of 400 K, a time step of 1 fs per step, and for 10–20 ps at each temperature. At 1398.15 K, the system is balanced for 20 ps, and it is then cooled to 298.15 K following the same temperature step and similar simulation time values. Finally, after being balanced for 20 ps at 298.15 K, the data are collected. The connectivity and distribution of the ring structure were analyzed using R.I.N.G.S.47 Pore distribution analysis was carried out using the pyMolDyn48 program. The Visual Molecular Dynamics (VMD)49 program was used to analyze the simulated trajectories and visualize them graphically. The ion-transport path of K+ in glass was studied by applying an electric field of 0.02 a.u. along the Z-axis and fixing the boron–oxygen network structure.2.4. Empirical potential structure refinement
The empirical potential structure refinement (EPSR) method50 was used to analyze the neutron diffraction experimental data of potassium borate glass. The model uses reference potentials consisting of standard Lennard-Jones plus Coulomb terms. When building the model, approximately 4500 atoms (K, B, O atoms) are placed in a cubic box with periodic boundary conditions. The Lennard-Jones potential parameters, the atomic charges, box composition and box size are listed in Tables S2 and S3.† Before the empirical potential structure refinement, the model is subjected to a continuous NVT Monte Carlo equilibrium under the reference potential after running to equilibrium at 10![[thin space (1/6-em)]](https://www.rsc.org/images/entities/char_2009.gif) 000 K, and the initial structural model is obtained through a continuous cooling process at 1400 K, 1200 K, 1000 K, 700 K, and 300 K. Then the relaxation balance is performed by adjusting the appropriate ereq value, and the potassium borate glass structure model and smooth pdf data are obtained.
000 K, and the initial structural model is obtained through a continuous cooling process at 1400 K, 1200 K, 1000 K, 700 K, and 300 K. Then the relaxation balance is performed by adjusting the appropriate ereq value, and the potassium borate glass structure model and smooth pdf data are obtained.
3. Structure and discussion
3.1. Neutron diffraction data
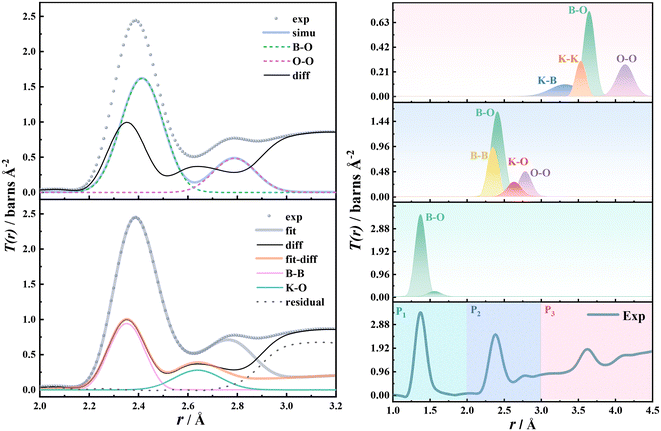
The interference function of potassium borate glass is shown on the left of Fig. 1. As can be seen from the figure, the oscillation amplitude of the i(Q) data at high Q is very small and the data are smooth, indicating that the neutron diffraction data of potassium borate glass obtained in this study are of high quality. There are three peaks, Q0, Q1, and Q2, when 0 < Q < 3.7 Å−1. Q0 is related to the K–K interaction. With the increase of K2O content, the corresponding atomic interaction distance decreases (5.61 Å to 5.07 Å), the atomic interaction range indicated by Q1 and Q2 increases, and the short- and medium-range ordered structure increases. The total correlation function of potassium borate glass is shown on the right of Fig. 1. As can be seen from the figure, there are three main interaction peaks, P1, P2, and P3, within the range of 4 Å. The P1 peak represents the B–O interaction. As the content of K2O increases, the intensity of the P1 peak decreases, the half-peak width increases, and the r value increases from 1.38 to 1.41 Å. The P2 peak includes four types of interaction: B–B, O–O, B–O, and K–O. The P3 peak contains four types of interaction: B–O, O–O, K–K, and K–B. As the content of K2O increases, the intensity of both P2 and P3 peaks decreases, full-width at half maximum (FWHM) increases, and the corresponding r values increase from 2.39 to 2.42 Å, and 3.63 to 3.68 Å, respectively.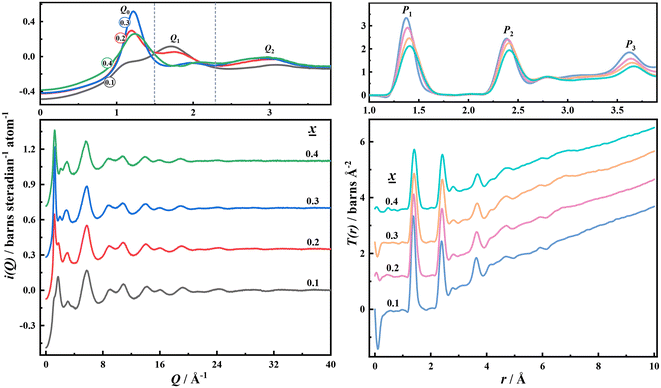 | ||
| Fig. 1 Left panel: Interference function i(Q) of potassium borate glass and right panel: total correlation function T(r) of potassium borate glass. | ||
3.2. Analysis of neutron experiment data
B–O interactions. The pair distribution function (PDF) of B–O interactions and B–O bond lengths in different structural units obtained by the EPSR and AIMD methods are shown in Fig. 3. As shown in the figure, the PDF data obtained by the two methods differ slightly, mainly due to the different calculation principles of the two methods40,50 and the box sizes (Tables S1 and S3†). The B–O interaction distances of xK2O·(1 − x)11B2O3 (0.1 ≤ x ≤ 0.4) glass from experimental data are 1.37, 1.39, 1.40, and 1.41 Å, respectively, which are close to the results obtained by the AIMD, EPSR and subtraction methods (Table S4†). In addition, the B–O interaction distance increases with the increase of K2O content. The coordination number distribution of the B–O interaction is shown in Fig. S2.† It can be seen from the figure that with the increase of K2O content, the B–O coordination number gradually increases, which is consistent with the changing trend of the B–O coordination number obtained by the difference method (Table S4†). The maximum point of the change of the tetra-coordinated boron content (N4) is located at x = 0.30, accounting for about 30%,20 indicating that the coordination number of the B–O interaction is less than 3.5, which is close to the results of the B–O coordination number given in this paper. According to the research results given by Koroleva et al.,20 the main basic structural units in potassium borate glass are B∅3 and B∅4− when x = 0.1 and 0.2. At x = 0.3, the B∅2O2− structural unit begins to appear, and at x = 0.4, the B∅2O2− becomes the main structural unit and the B∅O22− structural unit begins to appear. Therefore, the B–O effect in potassium borate glass is mainly that of tri-coordination, but with the increase of K2O content, the proportion of NBO in tri-coordinated boron also increases, and the change of the overall basic structural unit in the glass is that the content of B∅3 decreases, the content of B∅4− increases, and the content of B∅(3−a)Oaa− (a = 1 or 2) increases. The change in the basic structural unit causes the three-dimensional connectivity of the glass to increase and the boron–oxygen network structure to become dispersed, so the density of the glass increases (Fig. S3†).
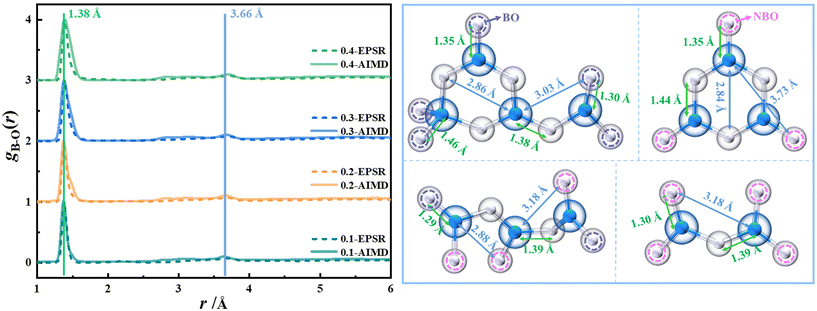 | ||
| Fig. 3 Pair distribution function of B–O interactions and B–O bond lengths in different structural units in xK2O·(1 − x)11B2O3 (0.1 ≤ x ≤ 0.4) glass obtained by EPSR and AIMD methods. | ||
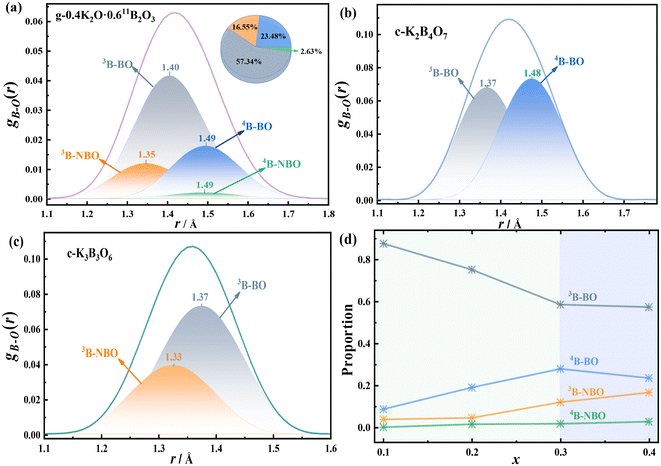
In this work, the atom labeling method was used to mark 3B, 4B, BO, and NBO atoms in the equilibrium structure simulated by AIMD, respectively. Then four kinds of B–O interactions of 3B–BO, 3B–NBO, 4B–BO, and 4B–NBO were obtained. At the same time, the K2B4O7 crystal containing 3B and 4B (the mole content of K2O is 0.33) and the K3B3O6 crystal containing BO and NBO (the mole content of K2O is 0.50) were also marked in the same way, as shown in Fig. 4, with the related data being shown in Table S5.† As can be seen from the figure, there are obvious differences between the structures of the glass and the crystals with similar components: (1) there is a small proportion of 4B–NBO interactions in the 0.40K2O·0.6011B2O3 glass, at about 2.6%, while there is no such interaction in other glasses; (2) the main B–O interaction in the 0.40K2O·0.6011B2O3 glass is 3B–BO, at about 57.3%, whereas the 4B–BO interaction is at about 23.5%, while the proportions of 3B–BO and 4B–BO interactions in the K2B4O7 crystal are very close; (3) the bond lengths of 3B–BO in 0.40K2O·0.6011B2O3 glass, K2B4O7, and K3B3O6 crystals are 1.40, 1.37, and 1.37 Å, respectively. The 4B–BO and 3B–NBO bond lengths (1.49 and 1.35 Å) in the glass are longer than those (1.48, 1.33 Å) in the crystal. In addition, the B–O bond length in the K2B4O7 crystal (1.42 Å) is much longer than the B–O bond length in the K3B3O6 crystal (1.36 Å). The above information shows that potassium borate glass contains more B–O bond types than crystals with similar components, and the bond lengths of 3B–BO, 4B–BO and 3B–NBO are longer than those of corresponding crystals, indicating that the boron–oxygen network of glass is looser than that of similar-component crystals. Fig. S3† shows that the density of the glass is smaller than that of the crystals of similar components, confirming the conclusion that the structure of the glass is relatively loose. In both glass and crystal, the increase of NBO decreases the length of the B–O bond, and the increase of 4B increases the length of the B–O bond. In addition, Edén et al.'s study23 concluded that the bond lengths of 3B–NBO, 3B–BO, 4B–NBO and 4B–BO in sodium borate glass are 1.34, 1.35, 1.34 and 1.43 Å, respectively, and the bond lengths all increase gradually with the increase of Na2O content. Obviously, the four B–O interactions in the structure of potassium borate glass are at greater distances than the corresponding atomic pairs in sodium borate glass, indicating that the arrangement of B and O atoms in potassium borate glass is looser, which is also the structural reason why the density of potassium borate glass is less than that of sodium borate glass.54
The relative contents of the 3B–BO, 3B–NBO, 4B–BO and 4B–NBO interactions in xK2O·(1 − x)11B2O3 (0.10 ≤ x ≤ 0.40) glass are shown in Fig. 4(d), where x = 0.30 is the inflection point of the four interaction changes, which is also the maximum point of the tetra-coordinated boron (4B) content.15,17,19 As can be seen from the figure, 3B–BO has the highest relative content, followed by 4B–BO and 3B–NBO. When 0.10 ≤ x ≤ 0.30, with the increase of K2O content, the 3B–BO interaction significantly decreases, the 3B–NBO and 4B–BO interactions increase, and the total B–O bond length increases. When 0.30 ≤ x ≤ 0.40, the 3B–BO interaction changes little, the 4B–BO interaction decreases, the 3B–NBO interaction increases, the 4B content decreases slightly, but a new 4B–NBO interaction is generated, so the total B–O bond length still increases. The maximum point for the content of B∅4− (x = 0.3) is also the maximum point of density and atomic density, and the minimum point of the molar volume of potassium borate glass (Fig. S3†). On the one hand, due to the increase of B∅4− content, the boron–oxygen network connectivity is enhanced, the atomic arrangement of the glass becomes denser, and the corresponding molar volume decreases. On the other hand, the increase of NBO content (Fig. S4†) and the length of the B–NBO bond being shorter than the B–BO bond leads to the shortening of the distance between B and O atoms in the boron–oxygen network structure, the increase of glass density and the decrease of molar volume. Thus, the effects of B∅4− and NBO on properties are synergistic rather than independent.
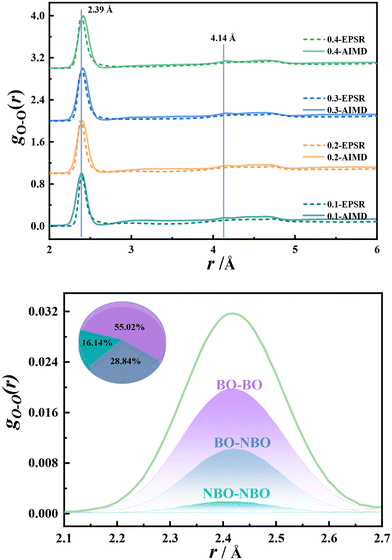
O–O interactions. The pair distribution function of the O–O interactions in the structure of potassium borate glass is shown in the upper panel of Fig. 5. As can be seen from the figure, with the increase of K2O content, the distance of the first coordination shell of O–O interactions increases from 2.40 to 2.42 Å, indicating that the addition of K2O elongates the O–O distance. The research of Handa et al.22 also supports this conclusion. However, the reason for the increasing O–O distance is still unclear. In this work, the atomic labeling method is used to denote three types of O–O interactions: BO–BO, BO–NBO, and NBO–NBO, as shown in the lower panel of Fig. 5. In 0.40K2O·0.6011B2O3 glass, the proportion of BO–BO interactions is the highest, accounting for about 55.02%, followed by that of BO–NBO and NBO–NBO, accounting for 28.84% and 16.14%, respectively. It is worth noting that the distances of the three types of O–O interactions are basically the same, all located at 2.42 Å. This indicates that there is little correlation between the content of NBO and the O–O distance. In K2B4O7 crystals containing B∅4− and BO3, the O–O distance in B∅4− is about 2.43 Å, and the O–O distance in BO3 is about 2.37 Å, indicating that the increase in the O–O distance in the glass is related to B∅4−. In summary, with the increase of K2O content in potassium borate glass, the B∅4− content gradually increases, although the O–B–O bond angle decreases (Fig. S5†), and the 4B–O bond distance still increases, so the O–O distance increases. Therefore, the density increase of potassium borate glass is mainly related to the content of NBO and B∅4−, and has no direct correlation with the O–O effect.
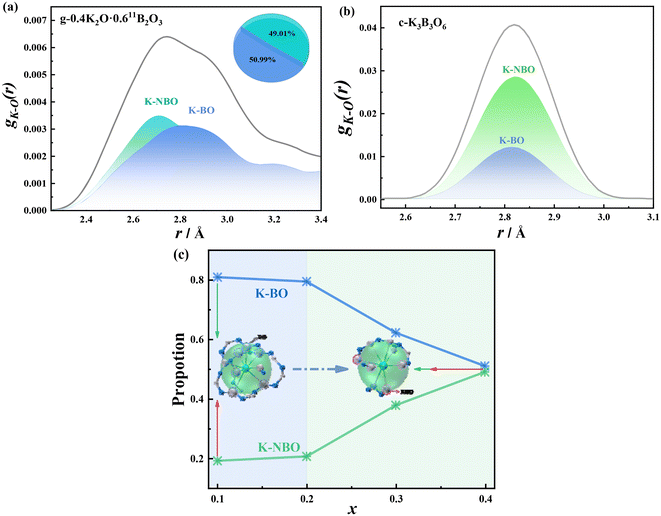
K–O interaction. The first coordination layer distance of K–O interaction in xK2O·(1 − x)11B2O3 (0.1 ≤ x ≤ 0.4) glass is 2.835, 2.815, 2.735 and 2.715 Å, respectively, and the K–O distance decreases gradually with the increase of K2O content. The interaction between K–BO and K–NBO was obtained by the atomic labeling method. Fig. 6(a) shows the PDF diagram of the first coordination layer of K–O interaction. It can be seen from the diagram that the relative proportions of K–BO and K–NBO interaction are very close, at 50.99% and 49.01%, respectively, with bond lengths of 2.80 and 2.71 Å. This suggests that K+ and NBO form a stronger bond. However, the distance between K–BO and K–NBO in potassium borate crystals with similar components is close, as shown in Fig. 6(b). Fig. 6(c) shows the variation of the K–BO and K–NBO interactions in xK2O·(1 − x)11B2O3 (0.1 ≤ x ≤ 0.4) glass. As the content of K2O increases, the proportion of K–BO interactions gradually decreases, while the proportion of K–NBO interactions gradually increases. The turning point is x = 0.20. This point also happens to be the maximum point of the K–O coordination number, as shown in Fig. S2.† When x = 0.40, the numbers of K–BO and K–NBO interactions are very close. The structure image in Fig. 6 shows snapshots of 0.10K2O·0.9011B2O3 and 0.40K2O·0.6011B2O3 glass when K+ is 8-coordinated. In 0.10K2O·0.9011B2O3 glass, K+ mainly coordinates with BO. As K–NBO interaction increases, in the 0.40K2O·0.6011B2O3 glass, K+ coordinates with four NBOs and four BOs. Therefore, as the content of K2O increases, the content of NBO increased, and the structural units containing NBO increased, so the interaction of K+ with NBO increases. In lithium borate glass, when the content of NBO also increases with the increase of Li2O content,55 the results show that both Li2O and K2O will destroy the ring structure of B2O3 glass and gradually transform it into a “molecular” structural unit containing NBO. Kamitsos et al.'s56 study of the far infrared spectral region of K2O·2B2O3 glass show that potassium ions exist in two vibration modes: L bands (low frequency) and H bands (high frequency). Combined with the research of Bray et al.,57 the H bands may correspond to the vibration associated with K–NBO, while the L bands correspond to the vibration associated with K–BO. When x = 0.33, in our work, the relative content of K–NBO is about 0.41, while the results from Kamitsos et al.56 reveal that it is about 0.57 ± 0.05. This difference is mainly caused by the error of different research methods.
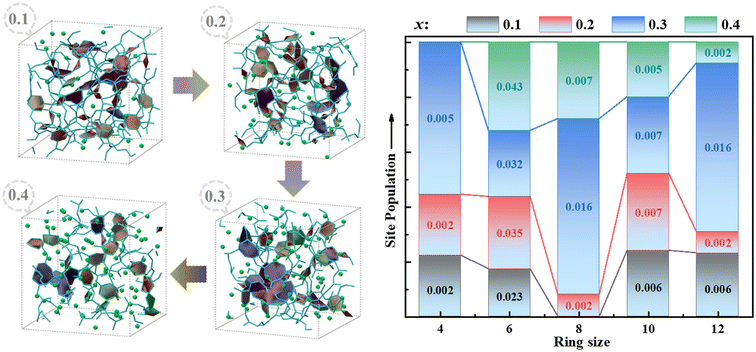 | ||
| Fig. 7 Rings and ring-size distribution in a simulated box of xK2O·(1 − x)11B2O3 (0.1 ≤ x ≤ 0.4) obtained by AIMD methods. | ||
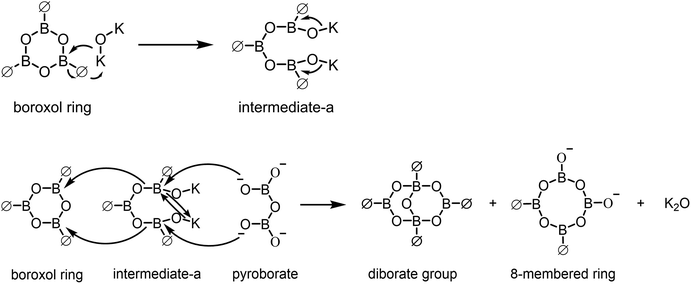 | ||
| Fig. 8 Schematic diagram of the conversion mechanism between the boroxol ring and the diborate group, 8-membered ring. | ||
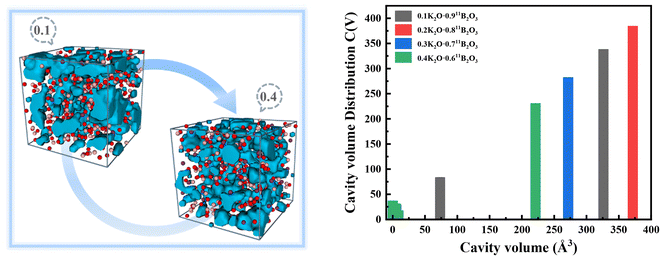
The distribution of cavities of xK2O·(1 − x)11B2O3 glass obtained by the domain-based method48 is shown in Fig. 9, with all components having a cutoff radius of 2.0 Å. With the increase of K2O content, the occupancy proportions of cavities of xK2O·(1 − x)11B2O3 (x = 0.10, 0.20, 0.30, and 0.40) glass are 7.3%, 6.9%, 5.6%, and 5.2%, respectively, where the cavity volumes are 399, 379, 277 and 234 Å3, respectively. The cavities show a decreasing trend in cavity occupancy. This phenomenon of decreasing cavity occupancy with an increase of metal ion content also exists in sodium thioarsenate and silver thioarsenate glass.58–60
3.3 Transport of K+ in glassy materials
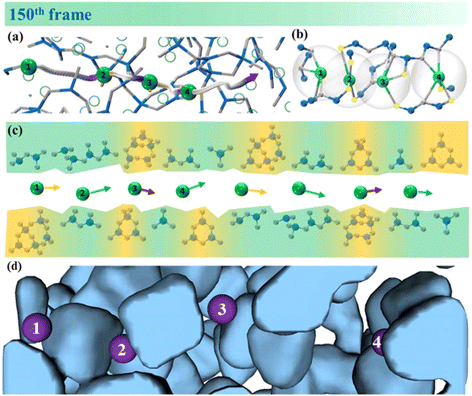
The study of the ion-transport pathway of K+ in borate glassy materials and the structural factors that influence the ion-transport rate are essential for improving the performance of potassium solid-state batteries and developing new K+ batteries. Fig. S8† shows an animation of the K+ transport process in the 0.40K2O·0.6011B2O3 glassy material. An interesting phenomenon observed is that the transport pathways and sites for adjacent K+ ions are almost identical. However, the transmission rate of K+ during the transmission process is affected by the boron–oxygen network structure. The structural reasons that affect the transport path and rate of potassium ions are analyzed in the following content.Fig. 10(a) shows the time trajectory of four K+ ions at the 150th frame. The denser the trajectory points, the slower the ion transport. According to Fig. S8,† the transport of 1# and 3# K+ is slow, and the transport of 2# and 4# K+ is faster. This study suggests that the structural factors influencing the K+ transport rate may include the following points. (1) coordination number and type of K+: Fig. 10(b) shows the coordination distribution of four types of K+ ions at frame 150. The NBO/CN ratios (the number of NBOs coordinated with K+ divided by the total coordination number of that K+) of 1 to 4# K+ are 0, 1, 0.4, and 0.4, respectively. Therefore, one of the structural reasons for the faster transport rate of 2# compared to 1# K+ is that all oxygen atoms coordinated with 2# K+ are NBOs. It is worth noting that 3# and 4# K+ ions have the same NBO/CN ratio, but the transport rate of the 4# ion is significantly higher than that of 3# K+. Therefore, besides coordination number and coordination type, there are other factors that influence ion transport. (2) Structural units: Fig. 10(c) shows the distribution of surrounding structural units for K+ ions at the 150th frame. It can be observed that 3# K+ is mainly surrounded by ring-type structures, such as six-membered rings containing B∅4− tetrahedra and complex eight-membered rings. On the other hand, 4# K+ is mainly surrounded by simple chain-type structures, such as orthoborate units and metaborate units. Therefore, the presence of chain-type structures enhances the facilitation of K+ transport. (3) Distribution of cavities: as shown in Fig. 10(d), 1# and 3# K+ ions are at some distance from the adjacent cavity, so they transport slowly at first. In contrast, 2# and 4# K+ ions are directly attached to the cavity, so they are initially transported faster. Akola et al.59,60 also suggest that the cavities adjacent to Ag+ serve as diffusion sites. The data at the 600th frame in Fig. S9† precisely verify the above analysis results.
In conclusion, the structural factors that influence K+ transport in potassium borate glass are not singular but rather the result of multiple factors working together. Firstly, the content of NBOs plays a significant role, with a higher NBO content leading to faster K+ transport. Secondly, the presence of chain-type structural units, such as metaborate rings and orthoborate chains, which predominantly contain NBOs, facilitates K+ transport. It should be noted that these chain-type structural units are considered as “molecular-type” structures, as shown in Fig. S6.† The structural statistical results reveal the absence of “molecular-type” structures for x = 0.1 and 0.2, with the presence of only a limited number of B∅2O− chain structures observed for x = 0.3, while a significant abundance of metaborate units and orthoborate chains exist for x = 0.4. The distribution of cavity regions also plays a crucial role in ion transport dynamics. The availability of cavity structures surrounding K+ is essential for diffusion, and a more homogeneous distribution of these regions facilitates efficient K+ transport. Based on the findings of our analysis, this study employed AIMD simulations to calculate the diffusion coefficients of K+ in xK2O·(1 − x)11B2O3 (x = 0.10, 0.20, 0.30, and 0.40) glasses as presented in Table 2, while the relevant fitting curves are as shown in Fig. S10.† It is evident from the results that the diffusion coefficients of K+ ions gradually increase with an elevated content of K2O in the glass. This conclusion further substantiates our previous analysis. In other words, the increase of the K2O content in potassium borate glass leads to the increase in the NBO content (Fig. S4†) and the increase of chain structure, and the distribution of cavities became more and more uniform (Fig. 9). These structural changes all contributed to the transport of potassium ions and increased the diffusion coefficient of potassium ions under the action of an electric field. The positive correlation between the contents of NBO and the chain-structure units in potassium borate glass on the transport rate of K+ ions was established. The study of Kamitsos et al.61 showed that the diffusion of Li+ in lithium borate glass is mainly through the NBO site and, in the range of 0.2 ≤ x (mol Li2O%) ≤ 0.4, with the increase of lithium oxide content, the content of NBO also increases, and the diffusion coefficient of the lithium ion also shows an increasing trend, which is the same as that of potassium-ion diffusion in potassium borate glass.
| Sample | D (cm2 s−1 × 10⁻⁵) | Error (cm2 s−1 × 10⁻⁵) | Equations |
|---|---|---|---|
| 0.10K2O·0.9011B2O3 | 3.13 | 0.040 | MSD = 0.0013 × t − 0.48 |
| 0.20K2O·0.8011B2O3 | 6.43 | 0.086 | MSD = 0.0026 × t + 0.34 |
| 0.30K2O·0.7011B2O3 | 13.25 | 0.075 | MSD = 0.0053 × t − 1.48 |
| 0.40K2O·0.6011B2O3 | 17.90 | 0.055 | MSD = 0.0072 × t − 2.00 |
4. Conclusions
In potassium borate glass, with the increase of K2O content, B∅3 content decreases, B∅4− content increases first and then decreases, and B∅(3−a)Oaa− (a = 1 or 2) content increases. With the increase of B∅4−, the three-dimensional connectivity of the network structure of the glass is enhanced. With the increase of B∅(3−a)Oaa− (a = 1 or 2), the content of NBO also increases, and the structure of the boron–oxygen network becomes dispersed. The maximum point of B∅4− content (x = 0.3) is also the point with the highest number of rings, density and atomic density. Potassium borate glass contains more B–O bond types than crystals with similar components, and the bond lengths of 3B–BO, 4B–BO and 3B–NBO are longer than those of corresponding crystals, so the boron–oxygen network structure is looser than that of crystals with similar components. Additionally, both the crystal and glass exhibited a reduction in the B–O bond length with an increase in NBO, while an increase in 4B resulted in the elongation of the B–O bond.The structural factors affecting the K+ transport rate in xK2O·(1 − x)11B2O3 (x = 0.10, 0.20, 0.30, 0.40) glass mainly include: (1) NBO content, where the higher the value, the faster the K+ transport. (2) Chain structure unit, where the greater the number of chain-type structural units, the faster the K+ transport. (3) Cavity distribution, where the more uniform the cavity distribution, the more conducive it is to K+ transport. With the increase of K2O content, the diffusion coefficient of K+ in glass increases gradually. This study provides reference information for understanding the structure of potassium borate glass and for designing and preparing a solid potassium-ion glass electrolyte.
Author contributions
Lulu Song performed sample preparation, characterization, ab initio molecular dynamics simulation, data analysis and manuscript writing. Alex C. Hannon performed neutron diffraction experiments and manuscript revision. Steve Feller participated in manuscript revision and sample preparation. Ruirui Liu participated in ab initio molecular dynamics simulation. Peyton McGuire participated in sample preparation. Bo Zhang participated in data analysis. Yongquan Zhou participated in manuscript revision. Wu Li supervised and revised the manuscript., Fayan Zhu designed and supervised the study, and revised manuscript.Conflicts of interest
There are no conflicts to declare.Acknowledgements
The authors thank the Qinghai Province innovation platform construction project (no. 2024-ZJ-T01), the US National Science Foundation (DMR-RUI 2203142), and the Qinghai Province “High-end Innovative Talents Plan” (E240HX1001) project for financial support, and also thank the Science and Technology Facilities Research Council (STFC) for beam time on SANDALS (No. 2010510).References
- E. O. Taha and A. Saeed, Sci. Rep., 2023, 13, 12260 CrossRef CAS PubMed.
- A. E. Harby, A. E. Hannora and A. M. Ali, et al. , Sci. Rep., 2023, 13, 12498 CrossRef CAS PubMed.
- A. R. Ghazy, B. M. Elmowafy and A. M. Abdelghany, et al. , Sci. Rep., 2023, 13, 7292 CrossRef CAS PubMed.
- M. Fayaz, S. Ali and S. Bibi, et al. , Ceram. Int., 2023, 49, 24690–24695 CrossRef CAS.
- J. Banerjee, G. Ongie and J. Harder, et al. , J. Non-Cryst. Solids, 2006, 352, 674–678 CrossRef CAS.
- J. F. Wang and P. Liang, J. Chem. Thermodyn., 2019, 134, 1–4 CrossRef CAS.
- A. M. A. Ghany, A. S. A. Khadra and M. S. Sadeq, J. Non-Cryst. Solids, 2020, 548, 120320 CrossRef.
- M. I. Sayyed, M. A. Abdo and H. E. Ali, et al. , Ceram. Int., 2022, 48, 24310–24318 CrossRef CAS.
- S. A. M. Issa, M. Ahmad and H. O. Tekin, et al. , Results Phys., 2019, 13, 102165 CrossRef.
- M. I. Sayyed, M. A. Abdo and H. E. Ali, et al. , Ceram. Int., 2022, 48, 30817–30825 CrossRef CAS.
- H. Aboud, H. Wagiran and R. Hussin, et al. , Appl. Radiat. Isot., 2014, 90, 35–39 CrossRef CAS PubMed.
- B. Pandit, E. S. Goda and M. Ubaidullah, et al. , Ceram. Int., 2022, 48, 28856–28863 Search PubMed.
- R. Balaji Rao, R. A. Gerhardt and N. Veeraiah, J. Phys. Chem. Solids, 2008, 69, 2813–2826 CrossRef CAS.
- A. E. Omar, A. M. Ibrahim and T. H. Abd El-Aziz, et al. , J. Biomed. Mater. Res., Part B, 2021, 109, 1059–1073 CrossRef CAS PubMed.
- R. E. Youngman and J. W. Zwanziger, J. Phys. Chem., 1996, 100, 16720–16728 Search PubMed.
- W. L. Konijnendijk and J. M. Stevels, J. Non-Cryst. Solids, 1975, 18, 307–331 CrossRef CAS.
- E. Kamitsos, M. A. Karakassides and G. D. Chryssikos, Phys. Chem. Glasses, 1989, 30, 229–234 CAS.
- G. D. Chryssikos, E. Kamitsos and M. A. Karakassides, Phys. Chem. Glasses, 1990, 31, 109–116 Search PubMed.
- A. A. Osipov, L. M. Osipova and R. T. Zainullina, Phys. Chem. Glasses: Eur. J. Glass Sci. Technol., Part B, 2015, 56, 248–254 Search PubMed.
- O. N. Koroleva and M. V. Shtenberg, J. Non-Cryst. Solids, 2023, 601, 122053 Search PubMed.
- A. C. Wright, R. N. Sinclair and C. E. Stone, et al. , Phys. Chem. Glasses: Eur. J. Glass Sci. Technol., Part B, 2012, 53, 191–204 CAS.
- K. Handa, Y. Kitab and S. Kohara, et al. , J. Phys. Chem. Solids, 1999, 60, 1465–1471 CrossRef CAS.
- B. Stevensson, Y. Yu and M. Edén, Phys. Chem. Chem. Phys., 2018, 20, 8192–8209 RSC.
- G. D. Chryssikos, E. I. Kamitsos and A. P. Patsis, et al. , J. Mater. Sci. Eng. B, 1990, 7, 1–4 Search PubMed.
- E. I. Kamitsos and G. D. Chryssikos, J. Mol. Struct., 1991, 247, 1–16 Search PubMed.
- T. Liu, B. Duan and Y. Q. Li, et al. , J. Non-Cryst. Solids, 2023, 604, 122134 CrossRef CAS.
- V. Dua, S. K. Arya and K. Singh, J. Mater. Sci., 2023, 58, 8678–8699 CrossRef CAS.
- S. C. Colak and G. Kilic, J. Mater. Sci.: Mater. Electron., 2022, 33, 21852–21863 Search PubMed.
- N. Effendy, H. A. A. Sidek and M. K. Halimah, Chin. J. Phys., 2022, 75, 1–13 Search PubMed.
- L. L. Song, Y. X. Wang and A. C. Hannon, et al. , J. Non-Cryst. Solids, 2023, 616, 122478 CrossRef CAS.
- H. Bradtmüller, A. Gaddam and H. Eckert, et al. , Acta Mater., 2022, 240, 118318 CrossRef.
- E. D. Zanotto, J. E. Tsuchida and J. F. Schneider, et al. , Int. Mater. Rev., 2015, 60, 376–391 CrossRef.
- S. Lan, L. Zhu and Z. Wu, et al. , Nat. Mater., 2021, 20, 1347–1352 CrossRef CAS PubMed.
- J. Ge, Y. Gu and Z. Yao, et al. , J. Mater. Sci. Technol., 2024, 176, 224–235 Search PubMed.
- A. C. Hannon, Nucl. Instrum. Methods Phys. Res., Sect. A, 2005, 551, 88–107 CrossRef CAS.
- A. Hannon, W. Howells and A. Soper, Inst. Phys. Conf. Ser., 1990, 193–211 Search PubMed.
- E. Lorch, Phys. Solid State, 1969, 2, 229 Search PubMed.
- A. C. Hannon, J. Non-Cryst. Solids, 2016, 451, 56–67 CrossRef CAS.
- A. C. Hannon, A. S. Gibbs and H. Takagi, J. Appl. Crystallogr., 2018, 51, 854–866 CrossRef CAS.
- J. Hutter, M. Iannuzzi and F. Schiffmann, et al. , WIREs Comput. Mol. Sci., 2014, 4, 15–25 CrossRef CAS.
- Z. Wu and R. E. Cohen, Phys. Rev. B: Condens. Matter Mater. Phys., 2006, 73, 235116 CrossRef.
- L. Martínez, R. Andrade and E. G. Birgin, et al. , J. Comput. Chem., 2009, 30, 2157–2164 CrossRef PubMed.
- D. V. Oliveira, J. Laun and M. F. Peintinger, et al. , J. Comput. Chem., 2019, 40, 2364–2376 CrossRef PubMed.
- S. Goedecker, M. Teter and J. Hutter, Phys. Rev. B: Condens. Matter Mater. Phys., 1996, 54, 1703 CrossRef CAS PubMed.
- S. Nosé, Mol. Phys., 1984, 52, 255–268 CrossRef.
- W. G. Hoover, Phys. Rev. A: At., Mol., Opt. Phys., 1985, 31, 1695 CrossRef PubMed.
- S. Le Roux and P. Jund, Comput. Mater. Sci., 2010, 49, 70–83 CrossRef CAS.
- I. Heimbach, F. Rhiem and F. Beule, et al. , J. Comput. Chem., 2017, 38, 389–394 CrossRef CAS PubMed.
- W. Humphrey, A. Dalke and K. Schulten, J. Mol. Graphics Modell., 1996, 14, 33–38 CrossRef CAS PubMed.
- A. K. Soper, Phys. Rev. B: Condens. Matter Mater. Phys., 2005, 72, 104204 CrossRef.
- A. Hannon, D. Grimley and R. Hulme, et al. , J. Non-Cryst. Solids, 1994, 177, 299–316 CrossRef CAS.
- P. A. Johnson and A. C. Wright, J. Non-Cryst. Solids, 1982, 50, 281–311 CrossRef CAS.
- R. L. Mozzi and B. E. Warren, J. Appl. Crystallogr., 1970, 3, 251–257 CrossRef CAS.
- N. P. Lower, J. L. McRae and H. A. Feller, et al. , J. Non-Cryst. Solids, 2001, 293, 669–675 CrossRef.
- G. Lelong, L. Cormier and L. Hennet, et al. , Inorg. Chem., 2021, 60, 798–806 CrossRef CAS PubMed.
- E. I. Kamitsos, A. P. Patsis and G. D. Chryssikos, J. Non-Cryst. Solids, 1993, 152, 246–257 CrossRef CAS.
- J. H. Zhong and P. J. Bray, J. Non-Cryst. Solids, 1989, 111, 67–76 CrossRef CAS.
- M. Kassem, T. Bounazef and D. Fontanari, et al. , Inorg. Chem., 2020, 59, 16410–16420 CrossRef CAS PubMed.
- J. Akola, P. Jóvári and I. Kaban, et al. , Phys. Rev. B: Condens. Matter Mater. Phys., 2014, 89, 064202 CrossRef.
- J. Akola, B. Beuneu and R. O. Jones, et al. , J. Phys.: Condens.Matter, 2015, 27, 485304 CrossRef CAS PubMed.
- C. P. Varsamis, A. Vegiri and E. I. Kamitsos, Phys. Rev. B: Condens. Matter Mater. Phys., 2002, 65, 1–14 CrossRef.
Footnote |
| † Electronic supplementary information (ESI) available. See DOI: https://doi.org/10.1039/d4dt00804a |
| This journal is © The Royal Society of Chemistry 2024 |

