
Guanine-derived carbon nanosheet encapsulated Ni nanoparticles for efficient CO2 electroreduction†
Ying
Peng
,
Shuo
Chen
,
Zhengli
Hu
,
Mengqi
Yin
,
Lishun
Pei
,
Qiaohua
Wei
 * and
Zailai
Xie
*
* and
Zailai
Xie
*
Key Laboratory of Advanced Carbon-Based Functional Materials (Fujian Province University), Fuzhou University, Fuzhou 350016, Fujian, China. E-mail: qhw76@fzu.edu.cn; zlxie@fzu.edu.cn
First published on 21st May 2024
Abstract
Developing novel electrocatalysts for achieving high selectivity and faradaic efficiency in the carbon dioxide reduction reaction (CO2RR) poses a major challenge. In this study, a catalyst featuring a nitrogen-doped carbon shell-coated Ni nanoparticle structure is designed for efficient carbon dioxide (CO2) electroreduction to carbon monoxide (CO). The optimal Ni@NC-1000 catalyst exhibits remarkable CO faradaic efficiency (FECO) values exceeding 90% across a broad potential range of −0.55 to −0.9 V (vs. RHE), and attains the maximum FECO of 95.6% at −0.75 V (vs. RHE) in 0.5 M NaHCO3. This catalyst exhibits sustained carbon dioxide electroreduction activity with negligible decay after continuous electrolysis for 20 h. More encouragingly, a substantial current density of 200.3 mA cm−2 is achieved in a flow cell at −0.9 V (vs. RHE), reaching an industrial-level current density. In situ Fourier transform infrared spectroscopy and theoretical calculations demonstrate that its excellent catalytic performance is attributed to highly active pyrrolic nitrogen sites, promoting CO2 activation and significantly reducing the energy barrier for generating *COOH. To a considerable extent, this work presents an effective strategy for developing high-efficiency catalysts for electrochemical CO2 reduction across a wide potential window.
1. Introduction
The combustion of fossil fuels and other human activities increase the concentration of carbon dioxide (CO2) in the atmosphere, leading to natural environmental problems such as global warming and rising sea levels.1–3 Currently, electrochemically reducing CO2 to value-added fuels and chemicals using electricity generated from renewable sources of energy (e.g. solar, wind and tidal) is an effective way to overcome fuel shortages, alleviate environmental problems and achieve carbon neutrality.4–6 Among the numerous CO2 reduction products, carbon monoxide (CO) as a key raw material for Fischer–Tropsch synthesis, and is recognized to be one of the most economically cost-effective products.7,8 However, because of the structural stability of CO2, the carbon dioxide reduction reaction (CO2RR) process is disadvantageous in thermodynamics and kinetics. Meanwhile, the inevitable competitive hydrogen evolution reaction (HER) also greatly hinders the yield and selectivity of CO from the CO2RR.9–11 Therefore, it is urgent to explore high-efficiency and high-selectivity electrocatalysts to achieve efficient conversion of CO2 to CO.Transition metal electrocatalysts (e.g. Fe, Co and Ni) are considered as the most promising materials to replace noble metal catalysts (e.g. Au, Ag and Pb) due to their rich Earth reserves, high activity potential and good stability.12–14 Numerous research efforts have been devoted to developing transition metal–carbon composites, which combine the inherent catalytic activity of transition metal species and the high conductivity, porous structure of carbon, thus further improving their carbon dioxide electroreduction activity and durability.15–17 However, the relatively weak interaction between the metal and carbon support in conventional carbon-supported catalysts may lead to aggregation or leaching of metal nanoparticles, which is a major obstacle to the application of electrocatalytic reactions. In recent years, carbon-coated transition metal nanoparticles, as a novel type of electrocatalytic material, have become a hot research topic due to their special morphological structure and electronic properties. Unlike the traditional carbon-supported catalysts, carbon coated catalysts can effectively inhibit the agglomeration of metal particles and slow down the surface electrochemical oxidation by encapsulating the carbon layer on the transition metal surface, which greatly improves the stability of the catalysts. In addition, influenced by the geometric structure and electronic properties of carbon shells, the activity and selectivity of the catalyst will also be significantly enhanced.18 For example, Deng et al.19 prepared a core–shell structure catalyst (Ni@N–C) via a hard template strategy, displaying a good industrial current density of 236.7 mA cm−2 and a maximum FECO of 97% at −1.1 V (vs. RHE). Miao et al.20 synthesized a reduced graphene oxide-supported N-doped carbon-coated nickel catalyst (Ni@N–C/rGO) using N-containing ligands, with the Ni@N–C/rGO (4,4′-bipy) catalyst exhibiting the best catalytic performance. Tuo et al.21 developed an NC@Ni/C catalyst with an N-doped carbon-encapsulated Ni NP structure, which exhibited high CO selectivity and faradaic efficiency, exceeding 90% at −0.65 and −1.45 V (vs. RHE). However, despite the great potential of carbon-encapsulated catalysts in the CO2RR, the research is still in its early stages, and many synthetic strategies involve complex processes with high cost and low yield.22,23 Addressing the needs of practical applications, our recent focus has been on developing a simple, environmentally friendly, and universally applicable synthesis strategy.
Herein, we devise a facile and low-cost strategy for preparing Ni nanoparticles encapsulated by a N-doped carbon shell (Ni@N–C) catalyst through the pyrolysis of a precursor containing guanine and anhydrous nickel chloride. Benefitting from this unique carbon-coated structure and the introduction of Ni nanoparticles, the as-prepared catalysts show high efficiency in catalyzing CO2 into CO. Specifically, the optimal Ni@NC-1000 catalyst exhibits remarkable CO2RR performance with an FECO over 90% in a wide potential range of −0.55 to −0.9 V (vs. RHE), and reaches the maximum FECO of 95.6% in an H-cell at −0.75 V (vs. RHE). Moreover, it displays superior stability with nearly unchanged FECO for 20 h. Notably, the Ni@N–C-1000 catalyst presents a near industrial level current density of over 200.3 mA cm−2 at −0.9 V (vs. RHE) in a flow cell system, highlighting its potential for industrial applications. In situ Fourier transform infrared spectroscopy confirms the enhanced adsorption of *COOH and the facile formation of *CO on the Ni@NC-1000 surface. Further density functional theory calculations reveal that the pyrrolic nitrogen serves as the key active site for the CO2RR, influencing the electronic structure of the catalyst and lowering the energy barrier for the generation of *COOH, thereby facilitating the catalytic process of CO2 to CO conversion.
2. Experimental section
2.1. Materials
Guanine (C5H5N5O, 99%) was purchased from Aladdin, nickel chloride anhydrous (NiCl2, 98%) was purchased from Adamas, ethanol absolute (C2H5OH, 99.7%) was purchased from Sinopharm Chemical Reagent, and Nafion D-521 dispersion (5 wt%) was purchased from Sigma-Aldrich. Sodium bicarbonate (NaHCO3, AR) was purchased from Shanghai Titan Scientific Co., Ltd. Ultrapure CO2 (99.999%) and N2 (99.999%) were purchased from Fuzhou General Gas Co., Ltd. All materials were used without further purification. A deionized water (18.2 MΩ cm) system was provided by Shanghai Hetai Instrument Co., Ltd.2.2. Catalyst synthesis
In the typical synthesis of the hybrid catalysts, 1 g guanine and 10 mg nickel chloride anhydrous were dispersed in 40 mL of absolute ethanol, and the mixture was stirred vigorously for 12 h at room temperature, and then the redundant solvent was evaporated at 60 °C to obtain a solid product. 500 mg of the solid product obtained above was weighed into a porcelain boat and further carbonized for 2 h under a N2 atmosphere with different temperatures (900, 1000 and 1100 °C, at a heating rate of 5 °C min−1), and then naturally cooled down to room temperature. The obtained samples were named Ni@NC-X (X = 900, 1000, and 1100 °C, where X represents different carbonization temperatures). For comparison, the NC-1000 catalyst was also successfully synthesized by the same procedure without the introduction of Ni species.2.3. Catalyst characterization
The morphologies of the electrocatalysts were observed using a transmission electron microscope (TEM, FEI Talos F200S) and a scanning electron microscope (SEM, Hitachi S-4800). The structure and chemical composition were characterized using an X-ray diffractometer (XRD, RIGAKU Ultima IV), a Raman spectrometer (Raman, Invia Reflex), and an X-ray photoelectron spectrometer (XPS, ESCLAB 250), respectively. The Brunauer–Emmett–Teller (BET) specific surface areas were calculated according to the N2 adsorption/desorption measurements at 77 K and the pore size distributions were obtained through non-local density functional theory. In situ Fourier transform infrared spectroscopy (FTIR) data were obtained by chronoamperometry test using a Thermo Nicolet iS10 spectrometer in the potential range from −0.4 to −1.1 V (vs. RHE). The working electrode was a glassy carbon electrode coated with a catalyst ink, and the reference and counter electrodes were an Ag/AgCl electrode and Pt wire, respectively.2.4. Electrochemical measurements
To prepare the working electrode, first, deionized water, Nafion, ethanol absolute, and isopropanol were mixed in a ratio of 7![[thin space (1/6-em)]](https://www.rsc.org/images/entities/char_2009.gif) :2:8:3 to prepare a Nafion solution. Then, 5 mg of the catalyst powder synthesized above was mixed with 500 μL of the prepared Nafion solution, and the obtained catalyst ink was subjected to ultrasound for 30 min. A 200 μL ink was coated onto a carbon paper of size 1 × 1.5 cm2 and allowed to dry with a baking lamp, giving a catalyst loading of 2 mg cm−2.
:2:8:3 to prepare a Nafion solution. Then, 5 mg of the catalyst powder synthesized above was mixed with 500 μL of the prepared Nafion solution, and the obtained catalyst ink was subjected to ultrasound for 30 min. A 200 μL ink was coated onto a carbon paper of size 1 × 1.5 cm2 and allowed to dry with a baking lamp, giving a catalyst loading of 2 mg cm−2.
All electrochemical measurements of CO2 electrochemical reduction were carried out in a two-compartment gastight H-type cell (Gaoss Union) separated by a cation exchange membrane (Nafion 117), and the voltage required for catalytic reaction was provided by the electrochemical workstation (CHI660e). In a typical three electrode test, a graphite stick and a saturated Ag/AgCl electrode were used as the counter and reference electrodes, respectively, and a certain amount of NaHCO3 was dissolved in DI water to prepare the 0.5 M electrolyte. Before each electrolytic test, the electrolyte in the cathodic compartment was bubbled with 30 sccm high-purity CO2 for 30 min to obtain the CO2-saturated solution, and this flow rate was maintained unchanged during the electrochemical measurements. For the flow cell tests, saturated Ag/AgCl, ruthenium iridium titanium mesh and catalyst-coated gas diffusion electrode (GDE) were used as the reference electrode, counter electrode, and working electrode, respectively, and 1.0 M KOH was used as the electrolyte. Cyclic voltammetry (CV) was performed with a scan rate of 100 mV s−1 to remove impurities from the catalyst surface. Linear sweep voltammetry (LSV) was performed at a scan speed of 5 mV s−1. All the above potentials were converted to the reversible hydrogen electrode (RHE) scale according to the Nernst equation at 25 °C:
| ERHE = EAg/AgCl + 0.197 V + 0.0591 × pH. |
The gas products were analyzed using an online gas chromatograph (Ruimin GC-2060) equipped with a thermal conductivity detector (TCD) and flame ionization detector (FID), using ultrapure N2 as the carrier gas. The calibration curve of gas chromatography was obtained by using a standard gas (known gas composition and content), which was used as the basis for analyzing the types and contents of gas products. After the test was completed, the composition and content of the sample were analyzed according to the previous calibration curve. The gas products’ faradaic efficiency (FE) was calculated as follows:
| FE = (z × P0 × F × v × vj)/(R × T × j) |
485 C mol−1, and the gas constant R is 8.314 J mol−1 K−1.
2.5. Density functional theory (DFT) calculation details
DFT calculations using the Perdew–Burke–Ernzerhof (PBE) formula in the Generalised Gradient Approximation (GGA) were carried out with the Vienna Ab Novo Calculation Software Package (VASP).24 The interaction between the nucleus and valence electrons was described by means of projector augmented wave (PAW),25 and the kinetic energy cut-off is 450 eV. The supercell size of a graphene sheet was 9.84 Å × 9.84 Å × 15.59 Å, periodic conditions were applied along the z-direction and the Brillouin zone was sampled using 3 × 3 × 1 Monkhorst Pack k-point mesh. The final optimised geometry and band structure calculations were performed using VASPKIT until the energy change on each atom was below 0.01 eV Å−1 and converged to 10−6 eV per atom.26 The equation for calculating the Gibbs free energy is as follows:| G = Etotal + EZPE − TS |
3. Results and discussion
3.1. Structural and morphological characterization
The presented N-doped carbon-coated nickel nanocomposites (Ni@NC-X) were prepared by an in situ pyrolysis synthesis method. In the synthesis process of Ni@NC-X (as illustrated in Fig. 1a), guanine, a biological molecule, served as the carbon and nitrogen source, while anhydrous nickel chloride acted as the nickel source. These components were added to anhydrous ethanol and stirred for 12 h to ensure a complete reaction. Subsequently, the solvent was evaporated at 60 °C, and the resulting solid product was pyrolyzed at temperatures of 900, 1000, and 1100 °C under a N2 atmosphere for 2 h. For comparative analysis, NC-1000 was synthesized by adjusting the precursor composition. The microstructure and morphologies of the catalysts were characterized using SEM and TEM. From the SEM images (Fig. 1b, c and S1a–d†), it can be observed that the as-prepared Ni@NC-X all show a similar two-dimensional crimped nanosheet structure with a smooth surface, and as the pyrolysis temperature increases, the nanosheets gradually become thinner and highly wrinkled. Additionally, a comparison with NC-1000 indicates that the introduction of nickel does not alter the morphology of guanine-derived carbon bases (Fig. S1e and f†). The two-dimensional thin graphene-like carbon layer structure was further confirmed by TEM. As shown in Fig. 1d, plentiful Ni nanoparticles are embedded into the carbon nanosheet. It means that the Ni metal agglomerates into nanoparticles and they are all encapsulated by the green biomolecular guanine derived carbon matrix under high-temperature pyrolysis. For the NC-1000 catalyst, there are no metallic Ni nanoparticles and only C and N elements uniformly dispersed throughout the nanosheet structure (Fig. S2†). The high-resolution TEM (HRTEM) images of Ni@NC-1000 clearly show that the crystal plane spacing of 0.176 nm in the core region corresponds to the (200) plane of metallic Ni, and the lattice fringes with a spacing of 0.350 nm in the shell region are ascribed to the (002) plane of graphitic carbon (Fig. 1e–h). The element mapping is illustrated by the energy-dispersive X-ray spectroscopy (EDS) analysis (Fig. 1i), where C, N, O and Ni are evenly dispersed on the carbon matrix. For a comparison, the catalysts obtained at different pyrolysis temperatures were also characterized by TEM, revealing similar carbon-encapsulated structures to Ni@NC-1000 (Fig. S3 and S4†).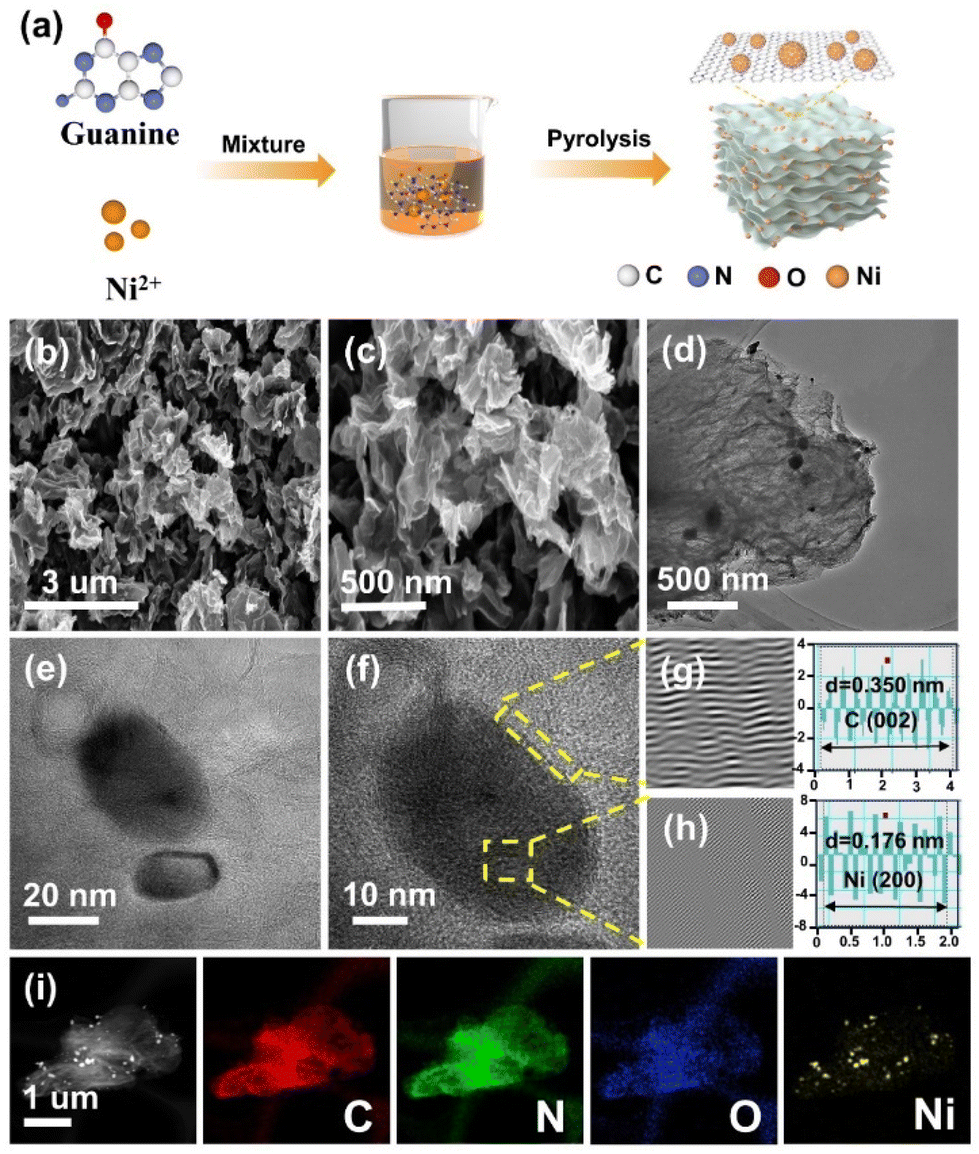 | ||
| Fig. 1 (a) Schematic illustration of the preparation of Ni@NC-X. (b and c) SEM images of Ni@NC-1000. (d) TEM image of Ni@NC-1000. (e and f) HRTEM image of Ni@NC-1000. (g and h) FFT images and the corresponding interplanar spacing images of the square marked areas. (i) Elemental mapping images of C, N, O and Ni of Ni@NC-1000. | ||
The crystal structures of all samples were characterized by XRD. As shown in Fig. 2a, Ni@NC-X exhibit a broad peak at 26.0° attributed to the (002) crystal planes of carbon. Notably, three distinct characteristic peaks appear at 44.5°, 51.8° and 76.4°, belonging to the (111), (200) and (220) crystal planes of typical nickel species, respectively.27,28 In comparison, NC-1000 shows only two peaks at 26.3° and 42.7°, corresponding to the reflection of the (002) and (100) crystal planes of graphitic carbon (Fig. S5a†).29,30 This observation further indicates the successful introduction of Ni nanoparticles into the guanine-derived carbon matrix, which is consistent with the structural analysis by TEM. Additionally, the Raman spectra were also presented to reveal the graphitization degree and amorphous carbons. As depicted in Fig. 2b and Fig. S5b,† there are two characteristic peaks at 1340 cm−1 and 1590 cm−1, attributed to the D-band (disordered sp3 carbon) and G-band (sp2 graphite carbon), respectively. The ID/IG ratio, also known as the D-band to G-band intensity ratio, is a crucial parameter to evaluate the defect degree of carbon-based materials.31,32 The value of ID/IG for Ni@NC-1000 is 0.85, while for Ni@NC-900, Ni@NC-1100 and NC-1000, the values are 0.89, 0.84 and 0.90, respectively. The result indicates that both the increase in pyrolysis temperature and the introduction of nickel nanoparticles can enhance the graphitization degree of carbon supports.33
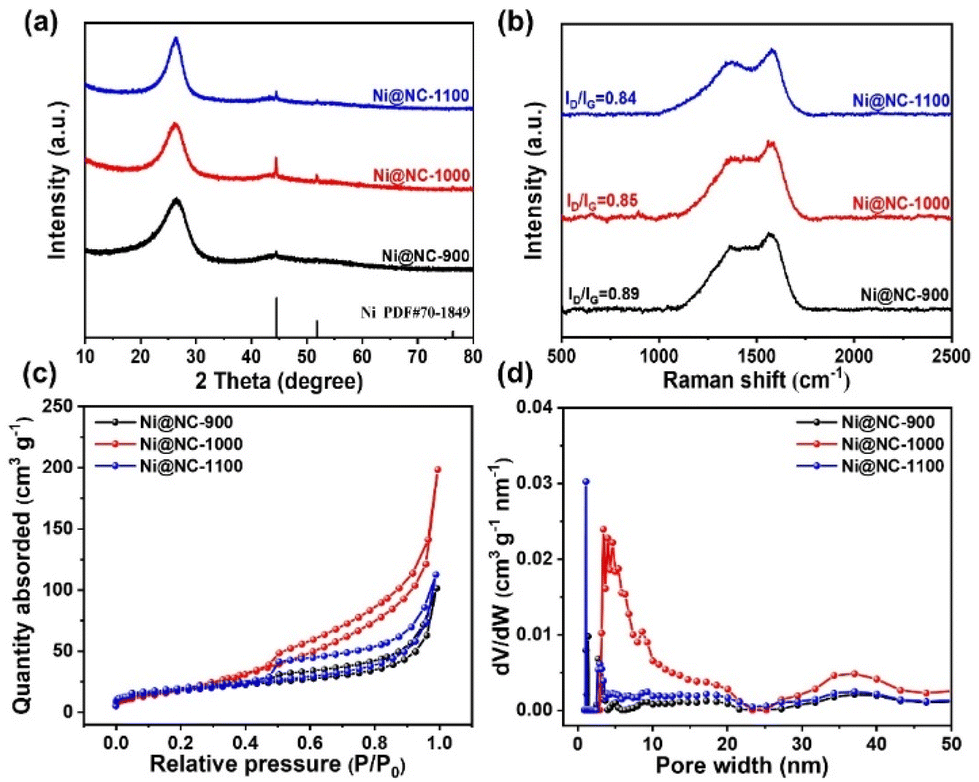 | ||
| Fig. 2 (a) XRD spectra. (b) Raman spectra. (c) N2 adsorption–desorption isotherms. (d) Pore size distribution obtained by the BJH method. | ||
The N2 adsorption–desorption isotherm and pore size distribution were used to investigate the specific surface area and pore structure of catalysts. As depicted in Fig. 2c and S5c,† all catalysts exhibit typical type IV isotherms with significant hysteresis loops, implying the existence of a mesoporous structure. Fig. 2d and S5d† show that the pore size of the prepared catalysts is mainly concentrated in the 2–50 nm range, which is consistent with the above analysis results. Among these samples, optimized Ni@NC-1000 has the highest BET specific surface area of 77 m2 g−1 and the largest pore volume of 0.31 cm3 g−1 (Table S1†). This characteristic enables the exposure of more active sites, thereby enhancing electrocatalytic activity.34,35
To further investigate the elemental composition and chemical states of all samples, X-ray photoelectron spectroscopy (XPS) experiments were conducted. The XPS survey spectrum (Fig. 3a) reveals the presence of four elements: C, N, O, and exclusively Ni in the Ni@NC-X samples, consistent with the EDS results. The specific contents of each element are summarized in Table S2.† In the C 1s high-resolution spectra (Fig. 3b and S6b†), three types of C species are observed at 284.6, 285.7 and 287.9 eV, corresponding to C![[double bond, length as m-dash]](https://www.rsc.org/images/entities/char_e001.gif) C, C–N, and C–O, respectively.36 The C–N species proves that N atoms are successfully doped into the carbon matrix. Furthermore, the N 1s spectra of the as-prepared samples (Fig. 3c and S6c†) can be deconvoluted into four N configurations, corresponding to pyridinic-N, pyrrolic-N, graphitic-N, and oxidized-N, with binding energies of 398.0 eV, 399.0 eV, 400.9 eV and 402.0 eV, respectively.37,38 Compared with NC-1000, the N 1s peaks of Ni@NC-1000 shift to a higher binding energy, representing the electron-deficient property of N species, which may be conducive to the adsorption of CO2 molecules and the enhancement of the CO2RR.39 The relative contents of different types of N species in various catalysts were figured out and are shown in Fig. S6d and Table S3.† Moreover, the O 1s high-resolution spectra of all samples shown in Fig. S7† reflect the presence of C–OH and CO species. In Fig. 3d, the Ni 2p spectra of Ni@NC-X display two peaks at 852.8 eV and 870.4 eV, revealing the presence of metallic Ni.40 In addition, two sharp peaks centered at binding energies of 854.9 eV (2p3/2) and 872.2 eV (2p1/2) accompanied by two satellite peaks are also observed. These features are characteristic of coordinated Ni species, possibly due to the interaction between the surface of Ni nanoparticles and N-doped carbon shells, as well as the occurrence of surface oxidation of Ni.41 Further observation shows that the Ni species of Ni@NC-1000 and Ni@NC-1100 shift to the lower binding energies compared with that of Ni@NC-900, indicating that the oxidation state of Ni decreases, may be due to the interaction between Ni and the carrier changing with the increase of pyrolysis temperature.33,42
C, C–N, and C–O, respectively.36 The C–N species proves that N atoms are successfully doped into the carbon matrix. Furthermore, the N 1s spectra of the as-prepared samples (Fig. 3c and S6c†) can be deconvoluted into four N configurations, corresponding to pyridinic-N, pyrrolic-N, graphitic-N, and oxidized-N, with binding energies of 398.0 eV, 399.0 eV, 400.9 eV and 402.0 eV, respectively.37,38 Compared with NC-1000, the N 1s peaks of Ni@NC-1000 shift to a higher binding energy, representing the electron-deficient property of N species, which may be conducive to the adsorption of CO2 molecules and the enhancement of the CO2RR.39 The relative contents of different types of N species in various catalysts were figured out and are shown in Fig. S6d and Table S3.† Moreover, the O 1s high-resolution spectra of all samples shown in Fig. S7† reflect the presence of C–OH and CO species. In Fig. 3d, the Ni 2p spectra of Ni@NC-X display two peaks at 852.8 eV and 870.4 eV, revealing the presence of metallic Ni.40 In addition, two sharp peaks centered at binding energies of 854.9 eV (2p3/2) and 872.2 eV (2p1/2) accompanied by two satellite peaks are also observed. These features are characteristic of coordinated Ni species, possibly due to the interaction between the surface of Ni nanoparticles and N-doped carbon shells, as well as the occurrence of surface oxidation of Ni.41 Further observation shows that the Ni species of Ni@NC-1000 and Ni@NC-1100 shift to the lower binding energies compared with that of Ni@NC-900, indicating that the oxidation state of Ni decreases, may be due to the interaction between Ni and the carrier changing with the increase of pyrolysis temperature.33,42
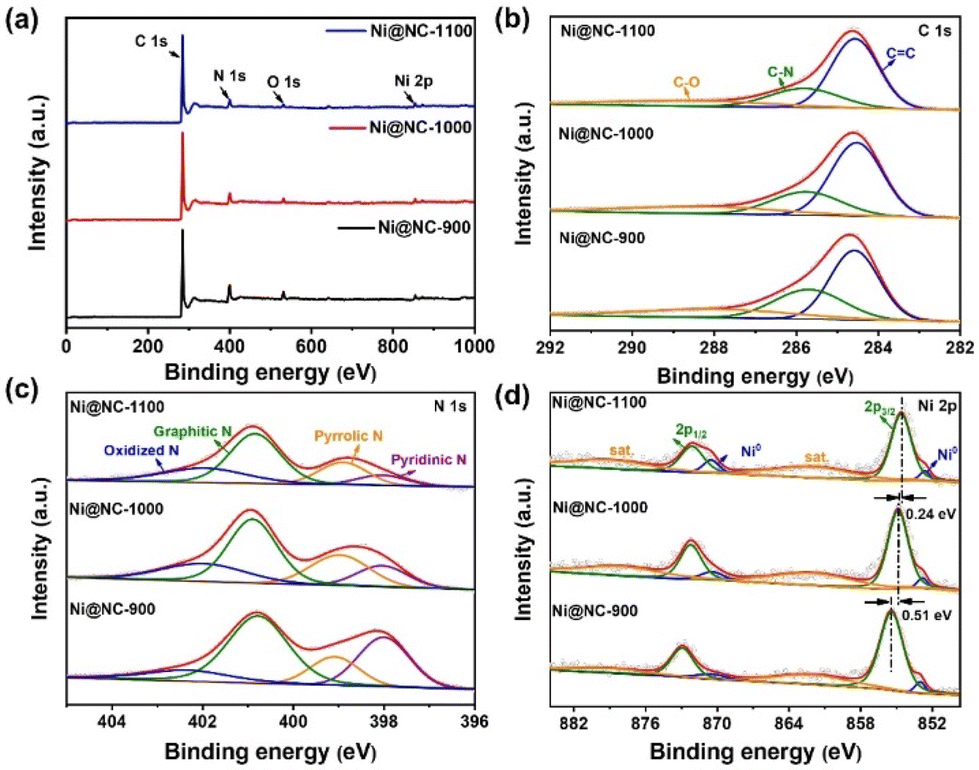 | ||
| Fig. 3 (a) XPS survey spectra of Ni@NC-X (X = 900, 1000, 1100). (b) High-resolution C 1s XPS spectra. (c) High-resolution N 1s XPS spectra. (d) High-resolution Ni 2p XPS spectra. | ||
3.2. Electrocatalytic performance of the CO2RR
The CO2RR performance of all samples was first analyzed by linear sweep voltammetry (LSV) in N2 and CO2-saturated NaHCO3 solutions. The LSV curves of Fig. S8a–c† clearly illustrate that the current densities of Ni@NC-X obtained under a CO2 atmosphere are dramatically improved in comparison with those obtained under a N2 atmosphere, indicating that the current increase originates from the CO2RR process. Moreover, Ni@NC-1000 has a lower onset potential and higher current density than its counterparts obtained at other temperatures. Further comparison with the electrocatalytic activity of guanine derived NC-1000 (Fig. 4a) suggests that the addition of Ni plays an important role in promoting the electrochemical reduction activity of CO2. Subsequently, to further analyze the product distribution, controlled potential was used in CO2 electrolysis. As shown in Fig. 4b, Ni@NC-1000 shows a superior advantage in the electrochemical reduction of CO2 to CO among all tested catalysts, which attains a FECO above 90% in a wide potential window range from −0.55 to −0.9 V (vs. RHE), with a maximum FECO of 95.6% at −0.75 V (vs. RHE), indicating the excellent selectivity of Ni@NC-1000 for CO2 conversion to CO. In contrast, the FECO values of Ni@NC-900, Ni@NC-1100 and NC-1000 at the same potential are 87.2%, 78.6% and 45.9%, respectively. Notably, only H2 and CO were detected across the entire applied potential range, and the total faradaic efficiency (FE) was approximately 100%, indicating that no other products were produced during this process (Fig. S9†). Besides, the CO partial current density (jCO) of Ni@NC-X and the comparative sample at different potentials were calculated to further evaluate the CO selectivity of the catalysts. As shown in Fig. 4c, Ni@NC-1000 exhibits a jCO of 12.3 mA cm−2 at −0.9 V (vs. RHE), which is 1.3, 1.9 and 24.6 times higher than those of Ni@NC-900 (9.5 mA cm−2), Ni@NC-1100 (6.4 mA cm−2) and NC-1000 (0.5 mA cm−2) at the same potential, respectively. | ||
| Fig. 4 (a) LSV curves of Ni@NC-X and NC-1000 in CO2-saturated 0.5 M NaHCO3. (b) CO faradaic efficiency (FECO) at different applied potentials. (c) CO partial current density (jco) at different applied potentials. (d) Double-layer capacitance (Cdl). (e) Tafel slope. (f) Catalytic stability test of Ni@NC-1000 at −0.75 V (vs. RHE) for 20 h. | ||
Additionally, the CV curves of all simples were measured at different scanning rates (25, 50, 75, 100 and 125 mV s−1) (Fig. S10†), and the double layer capacitance (Cdl) was calculated, which has a positive correlation with the ECSAs (Fig. 4d). As seen in Fig. 4d, the obtained Cdl value of Ni@NC-1000 is 17.3 mF cm−2 in 0.5 M NaHCO3, which exhibits a substantially higher value among all control samples. Furthermore, the accurate ECSAs of the samples were calculated based on the Cottrell equation.43 As shown in Fig. S11b,† the ECSAs of Ni@NC-900, Ni@NC-1000, Ni@NC-1100 and NC-1000 are assessed to be 0.0025, 0.0044, 0.00094 and 0.00048 cm2, respectively. These results imply that Ni@NC-1000 can provide more electrochemically active sites to strengthen the electrocatalytic performance of the CO2RR, which is attributed to the comparatively higher porous structure of Ni@NC-1000.44 To reveal the reaction kinetics process and the rate-determining step (RDS) of different catalysts, Tafel slopes are shown in Fig. 4e, where the Tafel slope value of Ni@NC-1000 (129 mV dec−1) is lower than those of Ni@NC-900 (145 mV dec−1), Ni@NC-1100 (160 mV dec−1) and NC-1000 (245 mV dec−1), indicating that Ni@NC-1000 has the fastest kinetics for the CO2-to-CO conversion. The value reaching 118 mV dec−1 indicates that the rate-determining step is the generation of the *COOH intermediate in the initial electron transfer step.45,46 Moreover, electrochemical impedance spectroscopy (EIS) is conducted to study charge-transfer characteristics of catalysts. As shown in Fig. S12,† Ni@NC-1000 exhibits a lower charge-transfer resistance (Rct) than those of Ni@NC-900, Ni@NC-1100 and NC-1000, suggesting that Ni@NC-1000 has a faster charge-transfer kinetics.
In addition to the product selectivity, the long-time stability is also a key condition for evaluating the performance of the CO2RR. After continuous electrolysis for 20 h, the total current density (jtotal) exhibits slight decay with a FECO above 90% (Fig. 4f), and the TEM characterization of Ni@NC-1000 evidences the structural integrity of the spent sample (Fig. S13†). The CO2RR performance of Ni@NC-1000 was also studied in a self-made flow cell with a gas diffusion electrode (GDE), where 1 M KOH was chosen as the electrolyte. The results show that Ni@NC-1000 can achieve a high FECO of 92.6% at −0.9 V (vs. RHE) with a current density of 200.3 mA cm−2, which indicates that the flow cell can effectively improve the mass transfer on the catalyst surface, accelerate the adsorption of CO2 and the desorption of products, and greatly enhance the electrocatalytic performance of the materials (Fig. S14†).47 The above results indicate that Ni@NC-1000 exhibits excellent performance and stability in the CO2RR process, demonstrating enormous application potential for CO production.
3.3. Mechanism investigation
To gain insight into the effect of Ni species introduction on the CO2RR process, in situ Fourier transform infrared (FTIR) spectroscopy was performed to detect the reaction intermediates at different potentials. As shown in Fig. 5a and b, two characteristic peaks at 1267 and 1370 cm−1 can be observed in both samples, attributed to the O–H deformation and C–O stretching of *COOH species, respectively.48 Notably, the peak intensity on Ni@NC-1000 is higher than that on NC-1000, suggesting the stronger adsorption of *COOH on the Ni@NC-1000 surface. Besides, the peaks around 1548 and 1667 cm−1 correspond to the asymmetric stretching of COO− and H–O–H, respectively.49Fig. 5a shows a distinct characteristic peak of *CO at 2056 cm−1, in contrast to that of the NC-1000 catalyst on which no *CO signal was detected, indicating a better ability of the Ni@NC-1000 catalyst to form *CO.50 Based on the above analysis, it can be inferred that the introduction of Ni species enhances the adsorption of *COOH on the catalyst surface and promotes the formation of *CO, thus improving the catalytic activity of the CO2RR.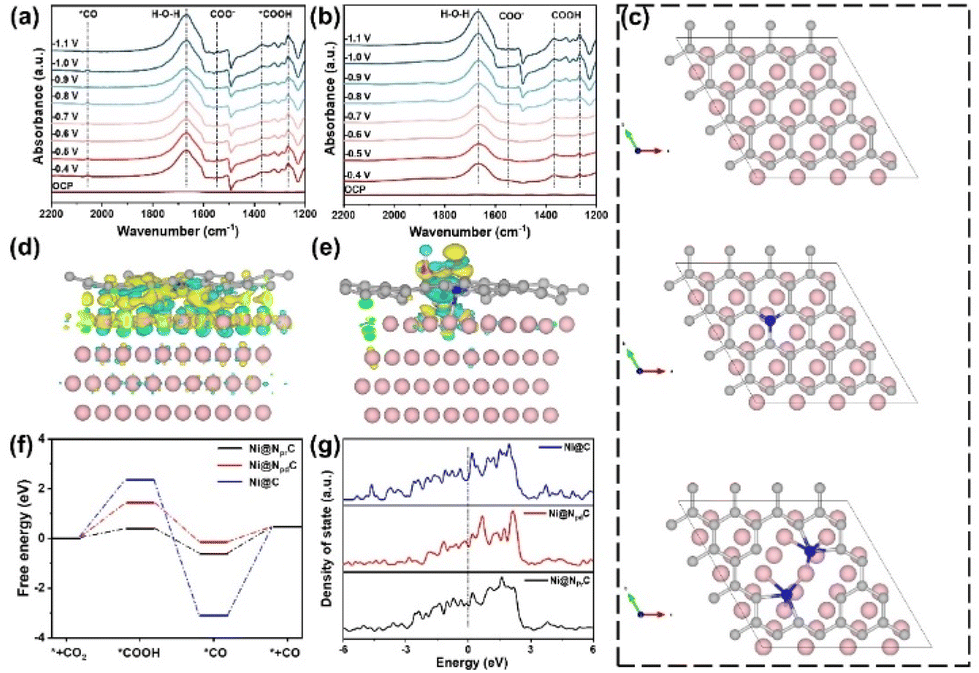 | ||
| Fig. 5 The in situ FTIR spectra of (a) Ni@NC-1000 and (b) NC-1000. (c) The models of Ni@C, Ni@NpdC and Ni@NprC. The charge density distribution on Ni@NprC before (d) and after (e) *COOH intermediate sorption (the yellow and cyan areas represent electron accumulation and depletion). (f) The free-energy diagram for the CO2RR to CO on Ni@C, Ni@NpdC and Ni@NprC. (g) The density of states for Ni@C, Ni@NpdC and Ni@NprC. | ||
Furthermore, combined with the relationship between the content of pyrrolic N in catalysts and the corresponding CO2RR activity (Fig. S15†), it is found that the content of pyrrolic N is directly proportional to its CO faradaic efficiency, indicating that pyrrolic N is closely related to the CO2 catalytic activity. Therefore, density functional theory (DFT) calculations were conducted to further shed light on the underlying mechanism of Ni@NC-1000 with high catalytic activity in the CO2RR. Based on the experimental results of TEM, the Ni (200) surface was selected as the model of Ni nanoparticles, and then three modeling structures of carbon-encapsulated Ni particles (Ni@C), pyridinic-N doped carbon-encapsulated Ni particles (Ni@NpdC) and pyrrolic-N doped carbon-encapsulated Ni particles (Ni@NprC) were established (Fig. 5c). Firstly, we calculated the differential charge density on Ni@NprC before and after *COOH intermediate sorption. A significant electron transfer between *COOH and the N and Ni atoms in the adsorption centre is observed by comparing Fig. 5d and e, demonstrating the facile adsorption of *COOH.51 Meanwhile, Fig. 5f shows the Gibbs free energy diagram for the CO2RR to CO on these three structures. It is worth noting that the free energy of *COOH on the Ni@NprC model is much smaller than those of Ni@NpdC and Ni@C, and features relatively moderate binding strength toward *CO. This suggests that the Ni@NprC structure is more conducive to the formation of *COOH and further desorption of *CO, thereby remarkably improving the CO2RR catalytic activity.52 In addition, the density of states (DOS) of the three modeling structures was calculated to investigate the electronic structure of Ni and N species. Compared with Ni@C and Ni@NpdC, Ni@NprC exhibits a stronger electron density near Fermi levels (Fig. 5g), and the result reveals that the existence of nitrogen in the carbon layer, especially pyrrolic nitrogen, can effectively regulate the electronic structure of the catalyst. Overall, DFT calculations further reveal that pyrrolic nitrogen in the carbon coated nickel nanoparticle structure is the optimal active site for the CO2RR, which can effectively regulate the electronic structure of the catalyst, reduce the energy barrier for generating the key intermediate *COOH, and thus promote the catalytic process of CO2-to-CO conversion.
4. Conclusions
In summary, we successfully prepared a kind of Ni@N–C catalyst with a nitrogen doped carbon shell coated Ni nanoparticle structure via an in situ synthesis method. As expected, the optimal Ni@NC-1000 catalyst exhibits excellent catalytic selectivity. Specifically, the FECO of Ni@NC-1000 remains well above 90% in the applied potential window of −0.55 to −0.9 V (vs. RHE), with the maximum FECO of 95.6% at −0.75 V (vs. RHE). Notably, it achieved a high current density of 200.3 mA cm−2 in a flow cell at −0.9 V (vs. RHE). In situ Fourier transform infrared spectroscopy and DFT calculations reveal that, owing to the high activity of pyrrolic nitrogen doping in the carbon layer, the Ni@NC catalyst significantly reduces the energy barrier for the formation of *COOH and provides appropriate *CO desorption energy. This promotes the efficient electroreduction of CO2 to CO. This work provides a new solution for the simple synthesis of low-cost and high activity electrocatalysts, signifying significant progress in advancing the CO2RR field.Author contributions
Ying Peng: conceptualization, formal analysis, investigation, methodology, data curation, and writing – original draft. Shuo Chen: formal analysis, data curation, and investigation. Zhengli Hu: writing – review & editing and formal analysis. Mengqi Yin: data curation. Lishun Pei: writing – review & editing. Qiaohua Wei: supervision, methodology, and editing. Zailai Xie: supervision, project administration, funding acquisition, conceptualization, methodology, and writing – review & editing.Conflicts of interest
There are no conflicts to declare.Acknowledgements
This work was funded by the National Natural Science Foundation of China (22072018 and 22372039), the Natural Science Foundation of Fujian Province of China (2021J06010) and the Collaborative Innovation Platform Project of Fu-Xia-Quan National Independent Innovation Demonstration Zone (2022-P-021).References
- M. Liu, Q. Y. Wang, T. Luo, M. Herran, X. Y. Cao, W. R. Liao, L. Zhu, H. M. Li, A. Stefancu, Y. R. Lu, T. S. Chan, E. Pensa, C. Ma, S. G. Zhang, R. Y. Xiao and E. Cortés, J. Am. Chem. Soc., 2023, 146, 468–475 CrossRef PubMed.
- X. F. Zhang, T. Lei, M. Xia, Q. H. Wei and Z. L. Xie, Dalton Trans., 2023, 52, 6267–6272 RSC.
- S. A. Farooqi, A. S. Farooqi, S. Sajjad, C. L. Yan and A. B. Victor, Environ. Chem. Lett., 2023, 21, 1515–1553 CrossRef CAS.
- K. J. Chen, M. Q. Cao, Y. Y. Lin, J. W. Fu, H. X. Liao, Y. J. Zhou, H. M. Li, X. Q. Qiu, J. H. Hu, X. S. Zheng, M. Shakouri, Q. F. Xiao, Y. F. Hu, J. Li, J. L. Liu, E. Cortés and M. Liu, Adv. Funct. Mater., 2022, 32, 2111322 CrossRef CAS.
- C. Jia, S. N. Li, Y. Zhao, R. K. Hocking, W. H. Ren, X. J. Chen, Z. Su, W. F. Yang, Y. Wang, S. S. Zheng, F. Pan and C. A. Zhao, Adv. Funct. Mater., 2021, 31, 2107072 CrossRef CAS.
- W. Y. Deng, P. Zhang, B. Seger and J. L. Gong, Nat. Commun., 2022, 13, 803 CrossRef CAS PubMed.
- Q. Y. Wang, K. Liu, K. M. Hu, C. Cai, H. J. W. Li, H. M. Li, M. Herran, Y. R. Lu, T. S. Chan, C. Ma, J. W. Fu, S. G. Zhang, Y. Liang, E. Cortes and M. Liu, Nat. Commun., 2022, 13, 6082 CrossRef CAS PubMed.
- Y. T. Qin, G. M. Zhan, C. Tang, D. Yang, X. B. Wang, J. H. Yang, C. L. Mao, Z. T. Hao, S. Y. Wang, Y. X. Qin, H. M. Li, K. Chen, M. Liu and J. Li, Nano Lett., 2023, 23, 9227–9234 CrossRef PubMed.
- Y. N. Gong, C. Y. Cao, W. J. Shi, J. H. Zhang, J. H. Deng, T. B. Lu and D. C. Zhong, Angew. Chem., Int. Ed., 2022, 61, 2215187 Search PubMed.
- Y. Z. Zhou, Q. Zhou, H. J. Liu, W. J. Xu, Z. X. Wang, S. C. Qiao, H. H. Ding, D. L. Chen, J. F. Zhu, Z. M. Qi, X. J. Wu, Q. He and L. Song, Nat. Commun., 2023, 14, 3776 CrossRef PubMed.
- W. C. Lai, Y. Qiao, J. W. Zhang, Z. Q. Lin and H. W. Huang, Energy Environ. Sci., 2022, 15, 3603–3629 RSC.
- C. Jia, Y. Zhao, S. Song, Q. Sun, Q. Meyer, S. Y. Liu, Y. S. Shen and C. Zhao, Adv. Energy Mater., 2023, 13, 2302007 CrossRef CAS.
- S. Zhou, L.-J. Zhang, L. Zhu, C.-H. Tung and L.-Z. Wu, Adv. Mater., 2023, 35, 2300923 CrossRef CAS PubMed.
- R. Y. Zhao, Y. D. Wang, G. P. Ji, J. J. Zhong, F. T. Zhang, M. F. Chen, S. R. Tong, P. Wang, Z. H. Wu, B. X. Han and Z. M. Liu, Adv. Mater., 2023, 35, 2205262 CrossRef CAS PubMed.
- X. C. Liu, J. J. Liu, Y. Yang, Y. W. Li and X. D. Wen, ACS Catal., 2021, 11, 2156–2181 CrossRef CAS.
- L. P. Huang, W. Y. Li, M. Zeng, G. J. He, P. R. Shearing, I. P. Parkin and D. J. L. Brett, Composites, Part B, 2021, 220, 108986 CrossRef CAS.
- S. Y. Liang, L. Huang, Y. S. Gao, Q. Wang and B. Liu, Adv. Sci., 2021, 8, 2102886 CrossRef CAS PubMed.
- X. X. Han, J. Lv, S. Y. Huang, Q. Zhao, Y. Wang, Z. H. Li and X. B. Ma, Nano Res., 2023, 16, 6270–6277 CrossRef CAS.
- F. Y. Wang, G. Wang, P. L. Deng, Y. Chen, J. Li, D. X. Wu, Z. T. Wang, C. T. Wang, Y. J. Hua and X. L. Tian, Small, 2023, 19, 2301128 CrossRef CAS PubMed.
- F. Wang, Z. Miao, J. Mu, Y. Zhao, M. Liang, J. Meng, X. Wu, P. Zhou, J. Zhao, S. Zhuo and J. Zhou, Chem. Eng. J., 2022, 428, 131323 CrossRef CAS.
- Q. Lu, C. Chen, Q. Di, W. L. Liu, X. H. Sun, Y. X. Tuo, Y. Zhou, Y. Pan, X. Feng, L. N. Li, D. Chen and J. Zhang, ACS Catal., 2022, 12, 1364–1374 CrossRef CAS.
- J. M. Yoo, H. Shin, D. Y. Chung and Y. E. Sung, Acc. Chem. Res., 2022, 55, 1278–1289 CrossRef CAS PubMed.
- M. F. Liang, Y. Liu, J. Zhang, F. Y. Wang, Z. C. Miao, L. C. Diao, J. L. Mu, J. Zhou and S. P. Zhuo, Appl. Catal., B, 2022, 306, 121115 CrossRef CAS.
- G. Kresse and J. Furthmuller, Mater. Sci., 1996, 6, 15–50 CAS.
- G. Kresse and D. Joubert, Phys. Rev. B: Condens. Matter Mater. Phys., 1999, 59, 1758–1775 CrossRef CAS.
- K. Liu, G. H. Ni, T. Luo, J. W. Fu, H. M. Li, M. Liu and Z. Lin, ChemPhysChem, 2023, 24, 2300050 Search PubMed.
- H. Q. Li, K. N. Gan, R. Li, H. W. Huang, J. B. Niu, Z. P. Chen, J. Zhou, Y. Yu, J. S. Qiu and X. J. He, Adv. Funct. Mater., 2023, 33, 2208622 CrossRef CAS.
- H. J. Zhao, Y. J. Xiong, A. J. Du, W. B. Gong, X. Mao, J. F. Zhang, H. M. Zhang and Y. Lin, ACS Nano, 2023, 17, 3984–3995 CrossRef PubMed.
- G. M. Wang, S. H. Chen, Q. W. Duan, F. F. Wei, S. Lin and Z. L. Xie, Angew. Chem., Int. Ed., 2023, 62, 2307470 Search PubMed.
- F. P. Pan, B. Y. Li, X. M. Xiang, G. F. Wang and Y. Li, ACS Catal., 2019, 9, 2124–2133 CrossRef CAS.
- S. C. Li, Y. L. Ke, X. F. Zhang, S. C. Wu and Z. L. Xie, Sep. Purif. Technol., 2024, 338, 126570 CrossRef CAS.
- X. P. Wang, X. Y. Li, S. S. Ding, Y. L. Chen, Y. Liu, M. W. Fang, G. Z. Xiao and Y. Zhu, Nano Energy, 2021, 90, 106541 CrossRef CAS.
- L. Qiu, S. Shen, C. Ma, C. Lv, X. Guo, H. Jiang, Z. Liu, W. Qiao, L. Ling and J. Wang, Chem. Eng. J., 2022, 440, 135956 CrossRef CAS.
- B. B. Huang, Y. X. Li, X. Guan and Z. L. Xie, FlatChem, 2022, 35, 100415 CrossRef CAS.
- W. T. Bi, X. G. Li, R. You, M. L. Chen, R. L. Yuan, W. X. Huang, X. J. Wu, W. S. Chu, C. Z. Wu and Y. Xie, Adv. Mater., 2018, 30, 1706617 CrossRef PubMed.
- X. Liu, P. V. Kumar, Q. Chen, L. Zhao, F. Ye, X. Ma, D. Liu, X. Chen, L. Dai and C. Hu, Appl. Catal., B, 2022, 316, 121618 CrossRef CAS.
- Y. C. Liu, X. Hu, B. B. Huang and Z. L. Xie, ACS Sustainable Chem. Eng., 2019, 7, 18835–18843 CrossRef CAS.
- C. Wang, Y. P. Liu, H. A. Ren, Q. X. Guan, S. L. Chou and W. Li, ACS Catal., 2022, 12, 2513–2521 CrossRef CAS.
- Y. J. Niu, C. H. Zhang, Y. Y. Wang, D. Fang, L. L. Zhang and C. Wang, ChemSusChem, 2021, 14, 1140–1154 CrossRef CAS PubMed.
- S. Y. Liang, Q. Jiang, Q. Wang and Y. F. Liu, Adv. Energy Mater., 2021, 11, 2101477 CrossRef CAS.
- D. X. Tan, C. N. Cui, J. B. Shi, Z. X. Luo, B. X. Zhang, X. N. Tan, B. X. Han, L. R. Zheng, J. Zhang and J. L. Zhang, Nano Res., 2019, 12, 1167–1172 CrossRef CAS.
- S. H. Gong, W. B. Wang, R. Q. Lu, M. H. Zhu, H. T. Wang, Y. Zhang, J. M. Xie, C. D. Wu, J. Liu, M. X. Li, S. Y. Shao, G. S. Zhu and X. M. Lv, Appl. Catal., B, 2022, 318, 121813 CrossRef CAS.
- Y. C. Zhang, C. S. Cao, X. T. Wu and Q. L. Zhu, Inorg. Chem. Front., 2021, 8, 2461–2467 RSC.
- F. Wang, H. Xie, T. Liu, Y. Wu and B. Chen, Appl. Energy, 2020, 269, 115029 CrossRef CAS.
- S. Chen, L. Pei, Y. Peng, X. Zhang and Z. Xie, Nano Res., 2024, 17, 4744–4752 CrossRef CAS.
- D. Lin, T. T. Wang, Z. L. Zhao, Y. N. Liu, H. H. Song, X. X. Yang, Z. J. Li, S. Y. Yao, X. B. Hu, L. C. Lei, B. Yang and Y. Hou, Nano Energy, 2023, 113, 108568 CrossRef CAS.
- X. Y. Meng, C. T. Zhu, X. Wang, Z. H. Liu, M. M. Zhu, K. B. Yin, R. Long, L. N. Gu, X. X. Shao, L. T. Sun, Y. M. Sun, Y. Q. Dai and Y. J. Xiong, Nat. Commun., 2023, 14, 2643 CrossRef CAS PubMed.
- C. M. Lv, K. Huang, Y. Fan, J. Xu, C. Lian, H. L. Jiang, Y. Z. Zhang, C. Ma, W. M. Qiao, J. T. Wang and L. C. Ling, Nano Energy, 2023, 111, 108384 CrossRef CAS.
- J. Y. Chen, T. T. Wang, X. Y. Wang, B. Yang, X. H. Sang, S. X. Zheng, S. Y. Yao, Z. J. Li, Q. H. Zhang, L. C. Lei, J. Xu, L. M. Dai and Y. Hou, Adv. Funct. Mater., 2022, 32, 2110174 CrossRef CAS.
- Y. Z. Li, B. Wei, M. H. Zhu, J. C. Chen, Q. K. Jiang, B. Yang, Y. Hou, L. C. Lei, Z. J. Li, R. F. Zhang and Y. Y. Lu, Adv. Mater., 2021, 33, 2102212 CrossRef CAS PubMed.
- S. Liu, M. M. Jin, J. Q. Sun, Y. J. Qin, S. S. Gao, Y. Chen, S. S. Zhang, J. Luo and X. J. Liu, Chem. Eng. J., 2022, 437, 135294 CrossRef CAS.
- H. D. Li, Y. Pan, Z. C. Wang, Y. D. Yu, J. Xiong, H. Y. Du, J. P. Lai, L. Wang and S. H. Feng, Nano Res., 2022, 15, 3056–3064 CrossRef CAS.
Footnote |
| † Electronic supplementary information (ESI) available. See DOI: https://doi.org/10.1039/d4dt00495g |
| This journal is © The Royal Society of Chemistry 2024 |