
 Open Access Article
 This Open Access Article is licensed under a Creative Commons Attribution-Non Commercial 3.0 Unported Licence
Predicting pharmaceutical crystal morphology using artificial intelligence
Matthew R.
Wilkinson
 abc,
Uriel
Martinez-Hernandez
d,
Laura K.
Huggon
a,
Chick C.
Wilson
be and
Bernardo
Castro Dominguez
*abc
abc,
Uriel
Martinez-Hernandez
d,
Laura K.
Huggon
a,
Chick C.
Wilson
be and
Bernardo
Castro Dominguez
*abc
aDepartment of Chemical Engineering, University of Bath, Claverton Down, Bath, BA2 7AY, UK. E-mail: bcd28@bath.ac.uk
bEPSRC Future Continuous Manufacturing and Advanced Crystallisation Research Hub (CMAC), University of Bath, Claverton Down, Bath, BA2 7AY, UK
cCentre for Sustainable and Circular Technologies (CSCT), University of Bath, Claverton Down, Bath, BA2 7AY, UK
dCentre for Autonomous Robotics (CENTAUR), Department of Electronic and Electrical Engineering, University of Bath, Claverton Down, Bath, BA2 7AY, UK
eDepartment of Chemistry, University of Bath, Claverton Down, Bath, BA2 7AY, UK
First published on 5th October 2022
Abstract
The crystal morphology of active pharmaceutical ingredients is a key attribute for product design, manufacturing and pharmacological performance. Currently, the morphology of pharmaceutical crystals is designed and controlled through resource intensive screening methods, which rely on trial-and-error approaches and experience. The demand for a more efficient and sustainable approach has driven research into the development of 21st century predictive methods. In this work, we demonstrate how artificial intelligence offers extraordinary potential for developing predictive, data-driven morphology models. Here, machine learning algorithms were implemented to predict the morphology of crystalline products. Using publicly available data, key limitations were identified, highlighting the lack of systematic experimental detail. These issues were addressed through an in-house experimental screening campaign, which leveraged robotics to increase throughput and overcome the challenges associated with the inherently subjective morphology labelling. As a result, we show that data-driven models can predict crystal morphology with an accuracy of up to 87.9%. These results are proof of the predictive power of artificial intelligence for morphology prediction and pharmaceutical product design.
1 Introduction
Crystallization has been used as the primary purification method during the production of Active Pharmaceutical Ingredients (API); even so, predicting the morphology or shape of the crystal product has been one of the biggest challenges in pharmaceutical manufacturing. The morphology of crystals is a critical attribute that significantly affects both physical and chemical properties of pharmaceutical products. Some examples include stability, solubility and dissolution rate, all of which affect storage, formulation/product design and the delivery mechanism to the patient (pharmacological performance).1 Crystal morphology also affects the downstream processing of the drug;2 some examples include processes that require a particular particle behaviour (e.g. morphology to maximize filtration, particle flowability and tabletability).3Many pharmaceuticals crystallize in morphologies that inhibit the effective downstream processing of APIs. As such, crystal engineering has focused on either targeting specific interactions through solvent selection, including additives or controlling experimental conditions in order to produce a desirable crystal morphology.4 In these cases, the success depends on the scientists' experience or extensive trial-and-error protocols, which require time, human resources and materials. Consequently, there is a clear opportunity for the application of Artificial Intelligence (AI) for the identification of patterns or the development of predictive models for crystal morphology. Nonetheless, such methods are still in the early adoption phases and show limited evidence in the scientific literature. Contributing factors for this slow adoption include: (i) the lack of systematically recorded, well-curated databases, (ii) limited open access to proprietary data, and (iii) a bias towards only reporting positive results. Moreover, to achieve large throughput in product screening for data collection, expensive and specialized automated equipment must be used. Indeed, this expense in data generation, often produced by industry, creates incentives to limit the accessibility of data.
Previous work in crystal morphology prediction makes use of computational methods outside the field of AI. For instance, early methods calculated face energies to predict growth rates in different directions. However, these methods were only effective when considering an isolated API. This case is exceedingly rare in industrial crystallization scenarios where solvents and additives are routinely a part of the process. Employing these methods required reasonable manual involvement as well as large computational costs.5 Many of these methods also assumed that morphology is the result of favoured growth along particular faces, an assumption which has had its accuracy questioned.6 Furthermore, strategies focusing on modelling the thermodynamics or kinetics have been employed, often using molecular simulations; however, due to the persisting computational cost, most of this work focuses on single API molecules or small systems and consequentially, it is not suitable to completely replace contemporary extensive screening approaches.7–9 At the time of writing, the authors find no evidence of machine learning applied to the prediction of API crystal morphology.
In this work, we present the prediction of crystal morphology using AI methods. To predict the morphology of crystallizing APIs, this work utilized the world's largest and most complete publicly available crystallographic database, the Cambridge Structural Database (CSD), which contains >1 million entries.10 Unfortunately, the data presented limitations and therefore, an in-house systematic experimental screening was carried out to address those issues. This experimental data was then used to train a deep learning model, offering better performance with only 99 data points. Although these results show great potential, we identified that testing on small scale is not entirely representative and as such, we present a labelling robot, of our own design. Partnered with deep learning, this open-source, accessible labelling platform will address the challenges associated with the subjective nature of morphology labelling, as well as allowing for faster sample analysis. We hope that this will open the door to wider screening efforts and hence greater data availability.
2 Experimental
Fig. 1 shows a schematic depicting the steps used in this work, aligning with the workflow used in conventional machine learning studies. The key steps for the development of data-driven models are: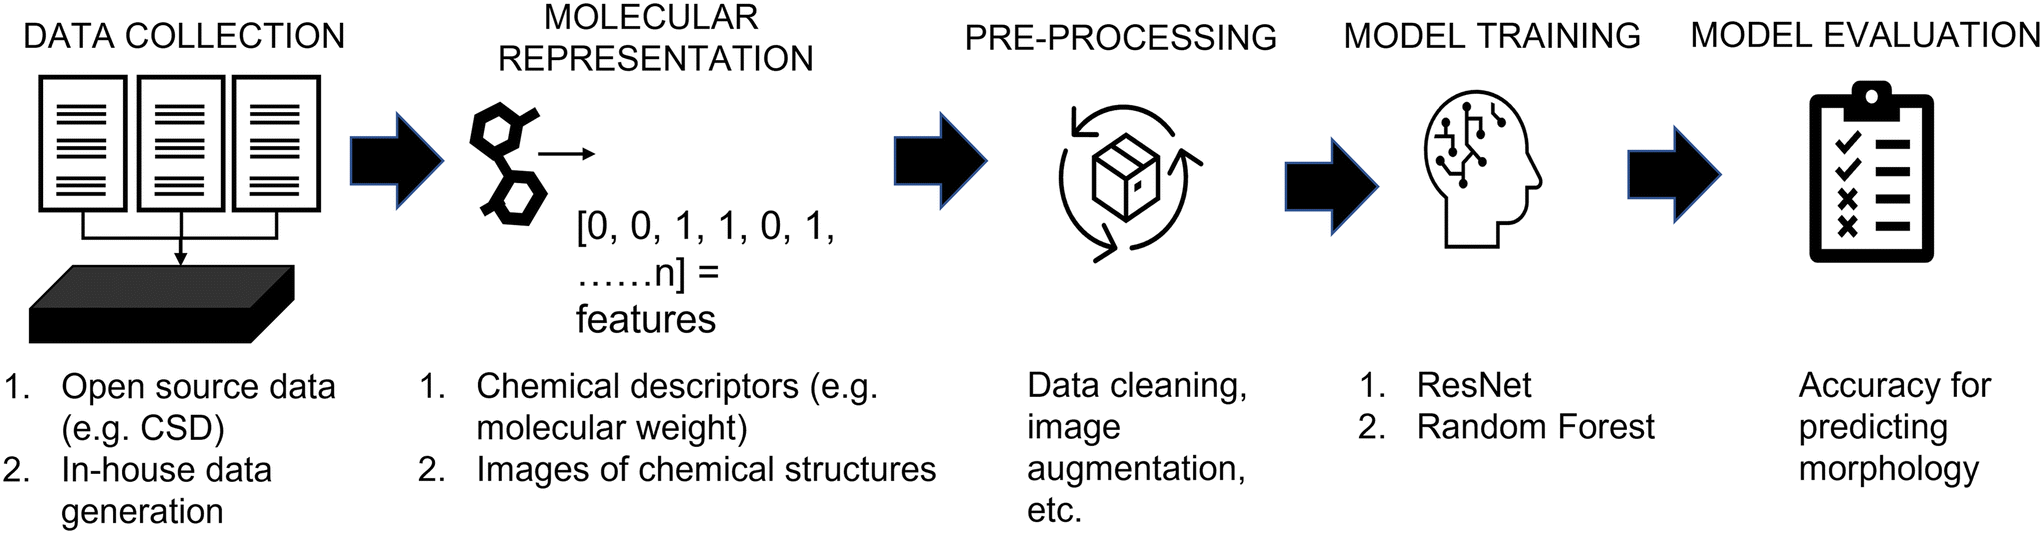 | ||
| Fig. 1 Workflow for the application of machine learning to predict crystal morphology. | ||
1. Data collection; two data sources containing the information of molecules and their crystal morphology were used: (a) the Cambridge Structural Database, and (b) in-house experimental data.
2. Molecular feature representation; two methods were used to represent molecules: (a) chemical descriptors, and (b) images of chemical structures.
3. Data pre-processing; the pre-processing step was customized depending on the source of the data, the type of molecular representation and the model used.
4. Model training; ResNet and random forest models were used to correlate the molecular features to morphology. To reduce the subjectivity of labelling crystal shapes, an automated labelling robot was developed and used to assess “human” labelling.
5. Evaluation; all models were assessed based on their accuracy for predicting untested molecules. Please note, further description of each step is shown in the following subsections; while the data and code implementations have been made available online (https://github.com/MRW-Code/ai_robotics_morphology_prediction).
2.1. Data collection
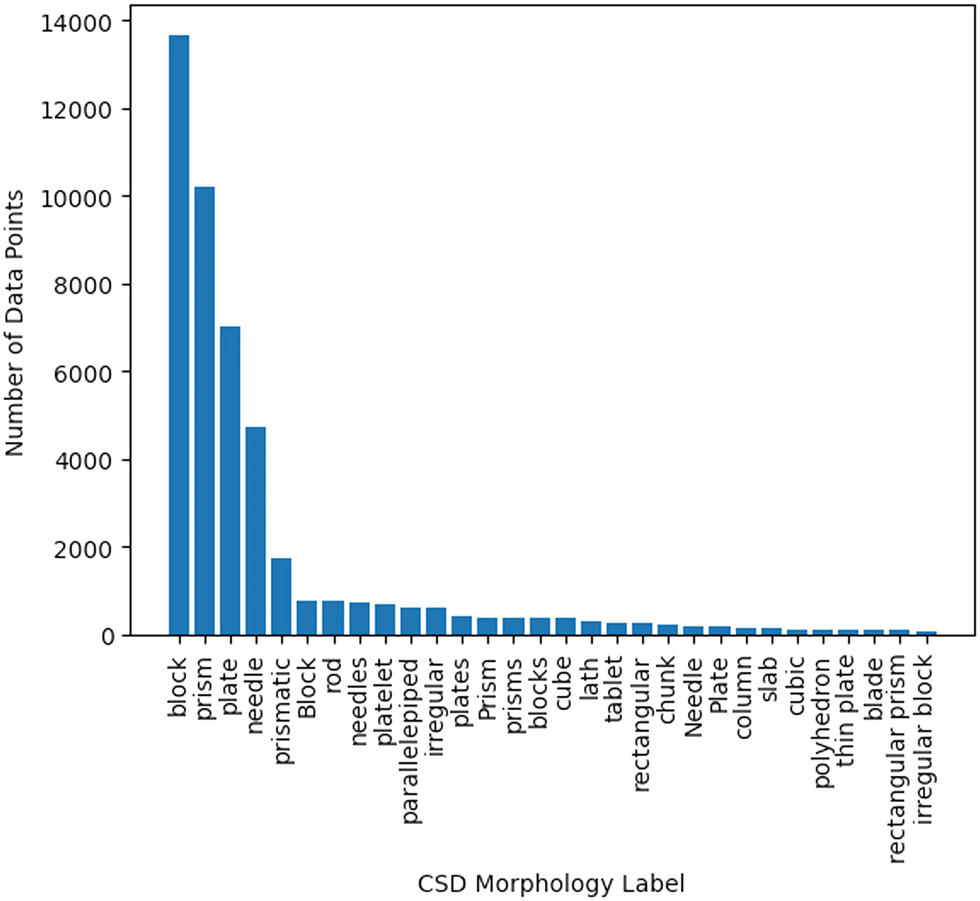 | ||
| Fig. 2 Number of data points for each morphology class mined from the CSD before syntax correction and data cleaning was applied. | ||
2.2. Molecular feature generation and pre-processing
The representation of molecules and their properties in digital format is key for the implementation of AI in computational chemistry. In this work, the process of representing molecules was approached using two methods: (i) chemical descriptors and (ii) images of chemical structures. Recent work assessed different molecular representations for use in chemical applications focusing specifically on tasks relevant to the field of solid form engineering.11 This demonstrated that images of chemical structures offer the best accuracy among the methods tested. Despite this, the work is recent, and as such other chemical applications beyond those presented have not been tested using images as inputs. Hence, descriptors, which are common molecular representations in data-driven solid form modelling, are included as a baseline for comparison.Using two methods of molecular representation also aids in understanding the model's predictions and helps with identifying limitations. Images and descriptors represent different information. Descriptors correlate to specific, numerical chemical properties, while images capture their detail as pixels, paying no attention to the fact they are of a molecule. By using both approaches, we test if images are appropriate for morphology prediction. Furthermore, the contribution of the API representation to the overall prediction (see Fig. 4) can be tested by assessing if the method of representation impacts performance. This is important as the API is the most important input to a morphology model.
Generating the molecular representations was carried out by using SMILES to act as unique identifiers for molecules, which were then converted into the final representations outlined in sections 2.2.1 and 2.2.2. Converting SMILES to chemical descriptors gives additional information in the form of the chemical properties the descriptors represent. By converting SMILES codes to images, pre-trained computer vision architectures can be leveraged using a transfer learning approach. In addition, images are more accessible and readable to the average user compared to SMILES, which take the form of text strings. This helps in understanding the model's predictions as users can visualize molecular structures. Moreover, images present explicit spatial arrangements. Although these might be inferred from text strings, explicit definition ensures that the network is presented with this information.
2.3. Model training and evaluation
The model applied to the datasets in this work was dependent on the choice of molecular representation. When using images to represent molecules, ResNet neural models were used, and when using chemical descriptors, random forests were applied. ResNet models were chosen as a result of previous evidence of image-based deep learning models used in chemical applications and wider image recognition tasks.11,13 These models were trained and evaluated using stratified cross-validation, from which the mean accuracy was recorded across the splits. The batch size was 256 for the CSD dataset and 8 for the in-house experimental dataset. A learning rate decay was used during the training process to ensure convergence. The models were trained for a maximum of 50 epochs with early stopping to prevent overfitting. Random forest classifiers were chosen due to evidence in the literature of them providing the best accuracy scores for predictions on chemical tasks.14 The models followed the same cross-validation strategy as used in the image models, and contained 100 estimators. The same ResNet and random forest models were used in both the CSD and in-house sections of this work. The sections were trained and evaluated on their corresponding datasets only; there was no combination of datasets in any section.2.4. High throughput imaging robot design
A high throughput automated labelling system (see Fig. 3) was created by modifying a Creality Ender 5 3D printer. The design removed the original printer head and replaced it with a Jiusion digital USB microscope such that the microscope could move in the X, Y and Z directions. The magnification can be manually adjusted with a scroll wheel in the range of 40–1000×. The system used an Arduino Mega 2560 microcontroller with a Computerized Numerical Control (CNC) shield for communication and control of the stepper motors of the 3D printer. The open-source GBRL library was used with the microcontroller to be able to control the automated machine using standard low-level g-code commands. A graphical user interface was developed using Python language to allow the user to configure a range of parameters to systematically move the microscope, capturing images from the samples for labelling. These parameters include: motor step size, velocity, initial and end positions, number of locations for data collection, number of trails for data collection and object label. The configuration of these parameters makes the high throughput system capable of working in different experimental setups. The source code for the automated labelling system robot has been made available online (https://github.com/inte-R-action/hiTrosBot).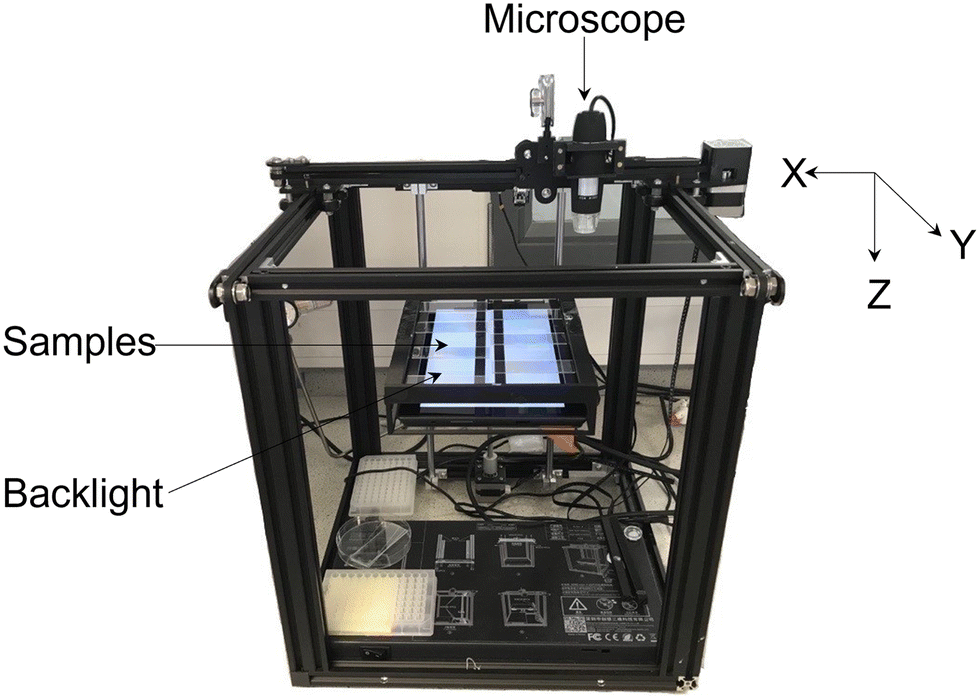 | ||
| Fig. 3 Automated robotics platform for rapid sample imaging and morphology labelling using deep learning. | ||
To remove the subjective nature of morphology labelling, a deep learning model was implemented to systematically classify the morphology of the samples offline. Please note that at this stage, the classification was limited to blocks, needles and plates, as these were the only morphologies obtained experimentally. The authors note that there is potential to move beyond these classes if a larger-scale screening could be carried out to provide a more diverse training dataset. The ResNet neural model was trained to classify morphology based on user-labelled data.
3 Results and discussion
Crystal morphology is a product of 4 factors: API, solvent, synthesis method, and additives. Therefore, in order to predict morphology (in an ideal scenario), a machine learning model must receive information about each of these factors to make an informed prediction (see Fig. 4). It is important to notice that additives are outside the scope of this work.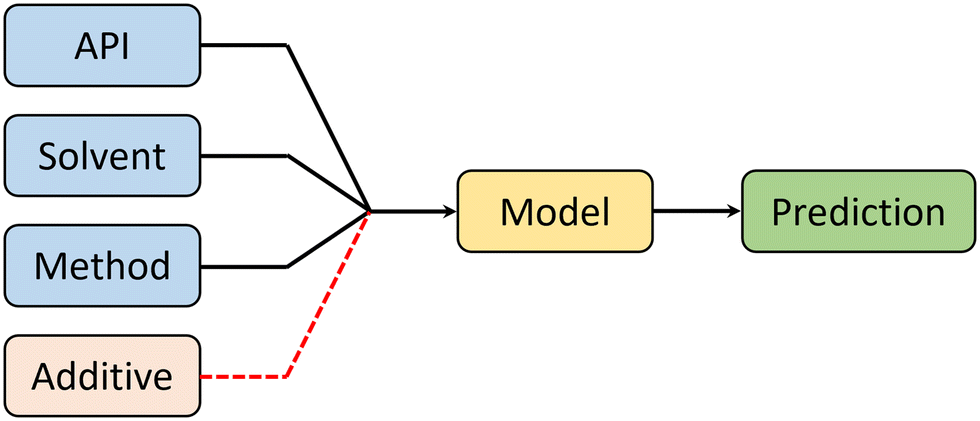 | ||
| Fig. 4 Ideal model design, showing all the inputs which are proven through experimental literature to have an effect on crystal morphology. Additives are included for completeness, but in this work they have not been used. | ||
In this work, the contribution of these key morphology factors was systematically controlled to assess their influence to the overall predictive performance of the model. Table 1 shows three case studies used to explore the contributions of these factors. Note that in all cases, the contribution of the API to morphology was not controlled, as this reflects the deployment of the model towards untested APIs. For the CSD-based case studies, the lack of readily available synthesis detail in the database used, suggests that the model must implicitly assume that these factors will not drastically impact performance. With this assumption in place, the “multiple model” case study evaluates how accurate the model is, based on the information associated with the API only. The “one model” approach assesses if there is any performance improvement from integrating both API and solvent details. Finally, to address the assumption made in the CSD cases, the “in-house” case study explores the importance of the crystallization method.
| Case study | Dataset | API | Solvent | Synthesis method |
|---|---|---|---|---|
| Multiple model | CSD | ✓ | ✗ | — |
| One model | CSD | ✓ | ✓ | — |
| In-house | Experimental | ✓ | ✗ | ✗ |
3.1. CSD data
The CSD contains information on APIs, solvents used for crystallization and the morphology of the crystal, but fails to provide synthesis detail which can be readily extracted for every entry. Despite this, the CSD remains the most complete crystallographic database available and so it is important to assess how accurate models trained on this data can be. For such assessment, the data was organized using two different approaches, as shown in Fig. 5.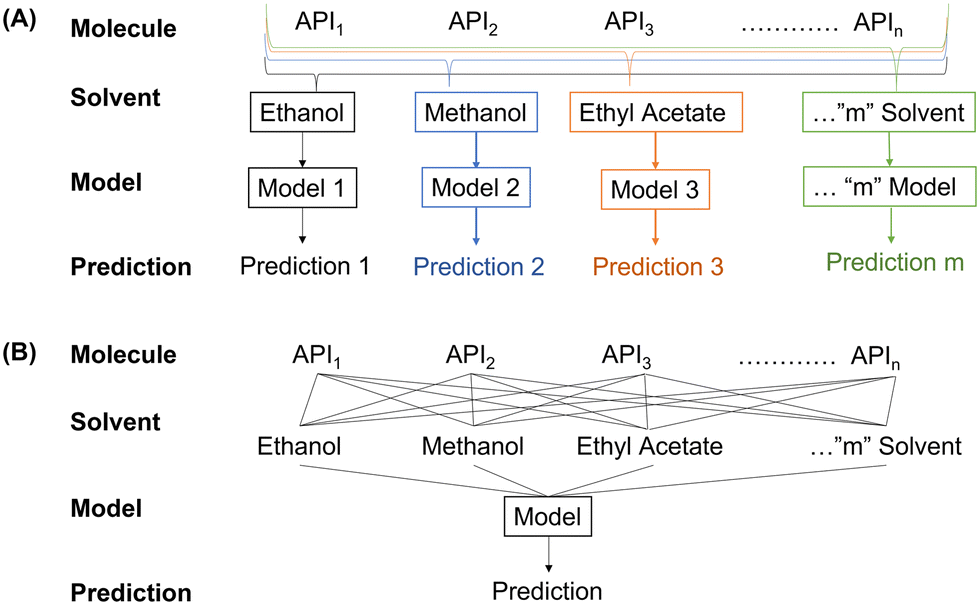 | ||
| Fig. 5 Modelling approaches for systems that need two inputs to make their prediction. “Multiple model” (A) trains a new model for every individual solvent. “One model” (B) takes multiple inputs to a single trained model. | ||
(1) The “multiple model” approach focused on developing a unique model for every solvent, thereby removing the effect of differing solvents. As a result, only the physicochemical properties of the API are taken into account when differentiating between data points. Although this model has a significantly larger associated computational cost (requiring the training of 17 different models); this approach reduces the degree of input variability as only the API changes.
(2) A “one model” approach was taken to assess if the explicit and/or implicit concatenation of properties allow for a better prediction. Doing so determines if the additional information improves the predictive power of the model, or if the extra information causes confusion, thus lowering accuracy. From a deployment perspective, the “one model” approach allows for the inclusion of a new solvent or processing condition, significantly reducing time and resource requirements for screening unknown materials.
| Solvent | Dataset size | Descriptor accuracy | Image accuracy |
|---|---|---|---|
| Ethanol | 8910 | 0.467 | 0.553 |
| Methanol | 3313 | 0.426 | 0.569 |
| Ethyl acetate | 1960 | 0.463 | 0.622 |
| Acetone | 1328 | 0.481 | 0.684 |
| Hexane | 1441 | 0.399 | 0.703 |
| Acetonitrile | 1011 | 0.420 | 0.696 |
| Diethyl ether | 961 | 0.380 | 0.678 |
| Toluene | 693 | 0.365 | 0.764 |
| Benzene | 367 | 0.450 | 0.812 |
| Pentane | 302 | 0.334 | 0.846 |
| Tetrahydrofuran | 263 | 0.434 | 0.838 |
| Water | 240 | 0.358 | 0.717 |
| Dimethylsulfoxide | 197 | 0.473 | 0.802 |
| Isopropanol | 152 | 0.368 | 0.852 |
| Dimethylformamide | 151 | 0.431 | 0.808 |
| Cyclohexane | 126 | 0.351 | 0.842 |
| Heptane | 113 | 0.381 | 0.824 |
Although crystal morphology is the result of the physicochemical properties of the API and solvent/additive interactions, the choice of the synthetic method and experimental conditions contribute to a large extent to crystal growth and morphology (see Fig. 4). This “multiple model” approach only compares examples with the same solvent; therefore, the variance in predictive performance across the different models must be the result of any variation in the crystallization method, which is not accounted for in this case. Moreover, by considering the number of data points alone, it appears that solvents with a large number of data points solubilize a wider range of APIs, while solvents with poor API solubilization power present only a small number of data points. Therefore, we hypothesize that when the API presents a solubility restriction in an “unconventional” solvent, the crystallization method is limited to temperature-driven methods, such as cooling crystallization, in order to create sufficiently saturated solutions.15 In these situations, the experimental conditions are more likely to be more consistent to allow the “poorly soluble API–solvent” system to crystallize. This more systematic methodology is a key factor for better accuracy scores.
| Input type | Join method | Model accuracy |
|---|---|---|
| Descriptors | Concatenate | 0.355 |
| One-hot encode | 0.431 | |
| Exclude | 0.433 | |
| Images | Concatenate | 0.586 |
| Exclude | 0.591 |
Table 3 shows the different model accuracy scores. Here, image models show no statistically significant difference between models trained including or excluding solvent detail, with accuracy scores of 0.586 and 0.591 respectively. Descriptor models show that the inclusion of the solvent information through concatenation hinders the model's predictive capability, reducing the accuracy score from 0.433 without, to 0.355 with solvent information. The concatenation method explicitly integrates the solvent features, resulting in up to 1825 dimensions for each component. Such high dimensional space cannot be adequately covered with 17 solvents; an explanation of why concatenating descriptors leads to the lowest model accuracy. To overcome the high number of dimensions, one-hot encoding was implemented, where the solvent is treated as a categorical feature rather than a continuous one.16 This approach creates inputs with fewer dimensions when compared to the concatenation of chemical descriptors. Table 3 shows that the one-hot encode approach improved the accuracy of the model to 0.431, when compared to 0.355 using concatenation. One-hot encoding allows for a more simplistic decision-making process when the random forest algorithm performs its recursive splitting. When working with categorical features, the splitting process reflects the same scenario outlined in the “multiple models approach”. Considering a single decision tree in the random forest, the data is split into subsets based on the solvent categories in much the same way as it was deliberately engineered in the “multiple model”. The resemblance between the decision making processes is confirmed through comparison of the accuracy scores of the “one model” approach with the mean across all of the “multiple model” tests, which were 0.433 and 0.411 respectively. These results suggest that representing the solvent detail through concatenation is not a useful approach, as both the “exclude” approach (completely ignoring solvent information) and the “one-hot encode” approach outperform concatenation.
The results from Tables 2 and 3 demonstrate that the CSD database has limitations to develop data-driven models. These limitations could include: (i) the lack of systematic data – not all crystals were synthesized in the same manner with the same conditions; and (ii) poor morphology labelling practices – crystal morphology is labelled subjectively by the authors contributing to populate the CSD database. Furthermore, the CSD-based models presented have shown that including the physicochemical properties of the solvents has no effect on the final crystal shape. However, the literature demonstrates that in fact, the nature of the solvents are key to predict the crystal morphology.17,18 Indeed, the models seem to lack some level of detail needed to effectively classify the data. This missing information is the lack of experimental details. The crystallization method is a critical aspect of controlling the morphology of crystals.19,20 Unfortunately, at the time of writing, there is no open-source database that systematically complies the crystallization method and the attributes of the crystals produced. The CSD contains more than 1 million entries without predefined classes for synthesis conditions. Therefore, the only method available to capture the experimental details is to manually record the contents of each associated publication – a procedure deemed to be highly impractical.
Although the CSD requests synthesis details when structures are submitted, the database showed many incomplete entries or passages of text that were too unique for grouping into categories. Since crystallization is a complex process, the authors suggest that, to develop accurate data-driven models, it is critical to include a series of categorical synthesis details. Examples of categories may include crystallization method (evaporative, cooling, anti-solvent, neat/liquid assisted grinding), temperatures, rate of cooling/heating, saturation point and/or number of temperature cycles. Indeed, at present, the lack of experimental detail is identified as the major limiting factor for the development of data-driven models used for crystal morphology prediction.
3.2. In-house morphology data generation for AI
A systematic in-house experimental protocol was implemented to address the limitations shown in the CSD case studies. In these experiments, both solvent and experimental conditions (as far as was practically possible) were kept constant in order to remove their influence on the crystal shape. As a result, the only factor which impacts the accuracy of the model is the API. Fig. 6 shows some examples of the crystal shapes experimentally obtained: plate, block and needle-shaped crystals. The crystal morphologies of all 99 samples were compiled into a dataset and used to develop a data-driven model. The model was evaluated with both 5-fold and 10-fold cross-validation. Using both these cross validations strategies enabled comparison with the previous models (10-fold), and increased the number of samples in the validation set, thus obtaining a more representative evaluation metric (5-fold). In both cross-validation methods, 5 independent trials were undertaken, and thus the final metrics represent the mean of these. This ensures that any difference in performance is statistically significant.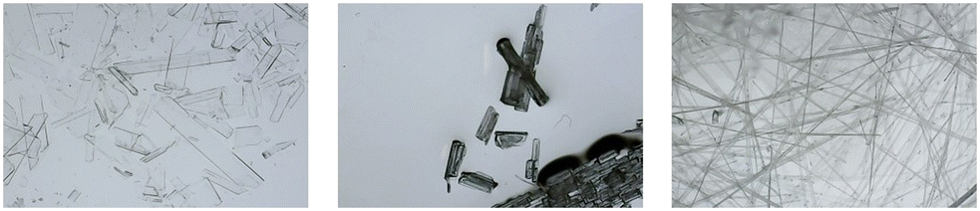 | ||
| Fig. 6 Example images from each class in the experimental dataset, taken using the USB microscope on the screening robot. The images show examples of plates (left), blocks (centre) and needles (right). | ||
Training a model using the systematic experimental dataset coupled with images as inputs provided a significant performance increase, reaching accuracy scores of 0.879 and 0.839 for each of the cross validation strategies (see Table 4). This enhancement can be appreciated when compared against the “one model” accuracy score. If we consider only water, the CSD dataset displayed an accuracy of 0.717 (see Table 2), while the in-house dataset achieved 0.879 (Table 4) – both with the same cross fold strategy. The difference in these two tests, was that the CSD has no details on the synthesis methodology undertaken; while the in-house ensured that all parameters were kept constant. The difference in results highlights that when all the information is systematic, it is possible to generate data-driven models with high accuracy.
| Input type | Model accuracy | |
|---|---|---|
| 10-Fold | 5-Fold | |
| Descriptors | 0.407 | 0.390 |
| Images | 0.879 | 0.839 |
The increase in performance is significant considering that only 99 data points were available; in contrast to the CSD, which contained 240 data points for water. The mean classification accuracy scores in Table 4, of 0.879 and 0.839, respectively for 10-fold and 5-fold cross-validation, demonstrates that despite the reduced number of training examples, maintaining systematic experimental conditions is critical for accurate morphology prediction. In light of this, it can be concluded that there are no limitations associated with distinguishing the molecular features of the APIs. In fact, when all other information is systematically presented (or held constant as in this case), the performance metrics are the best.
Table 4 shows that the method used to distinguish the molecular features of the APIs is essential when developing data-driven models. It can be appreciated that images displayed much higher accuracy scores than chemical descriptors across all case studies. This performance difference is a result of images' improved ability to distinguish molecular features as highlighted across wider chemical applications.11 Indeed, by leveraging the information provided by 99 data points, this work demonstrates the advantages of transfer learning for solid-state applications, an area where big data is (at present) exceedingly scarce. Transfer learning offers improved performance on small data applications by carrying experience from training in other tasks. Here, we used the annual ImageNet Large Scale Visual Recognition Challenge.21
Although the systematic experimental protocol enabled the training of models with outstanding predictive capabilities, there are further improvements to be made. First, as a consequence of the limited size of the dataset, a single incorrect prediction corresponded to a 0.1 accuracy score drop. Closer inspection of the cross-validation metrics shows that in every case the model made no more than two mistakes when predicting morphology using 10-fold cross-validation. Even so, a significantly larger dataset should be compiled, as currently, individual mislabels produce a significant reduction in the model's accuracy score. Second, this work demonstrated the predictive power of this approach using water as the only solvent. Therefore, future work should focus on incorporating other solvents, both pure and mixed. A large screening campaign is important for integrating commonly used solvents, such as ethanol, that make up a large proportion of the crystallization records in the CSD. Certainly, the main limitation in training a complete morphology prediction model is gathering a sufficiently large training dataset that captures all combinations of API, solvent and methodology. An alternative to experimental screening methods is to focus on data mining strategies to extract the synthesis details from the associated publications in the CSD.
3.3. Automated morphology labelling
Assuming data availability is no longer an issue, there remains one final challenge in the prediction of crystal morphology. Morphology labelling is an inherently subjective process and as such, there is error introduced during the characterization of the crystal shape. This error is difficult to account for in the model when utilizing supervised learning approaches, as it presents a one-to-many relationship, which is impossible to model. Therefore, an objective and reproducible system of assigning morphology labels in training must be implemented to avoid additional sources of error.To address reproducible morphology labelling, we developed an automated labelling system, where an image recognition model labels the samples in a reproducible manner. Fig. 7 shows the confusion matrix attained by the automated labelling unit. The deep learning labelling method showed identical labels to those manually assigned. These results suggest that AI has the potential to be an effective way of ensuring reproducible morphology labelling of samples, as well as dramatically reducing the time and human resources used for capturing and labelling images. Even so, it is important to consider that only 99 images were used in this dataset, and therefore it is essential to expand this work to cover more crystal types. Particular attention must be placed on data points where distinguishing classes is difficult; for instance rods and needles. As this method is limited by data availability, without further testing, we cannot conclude that potential overlapping classes will match the morphology assigned by a human.
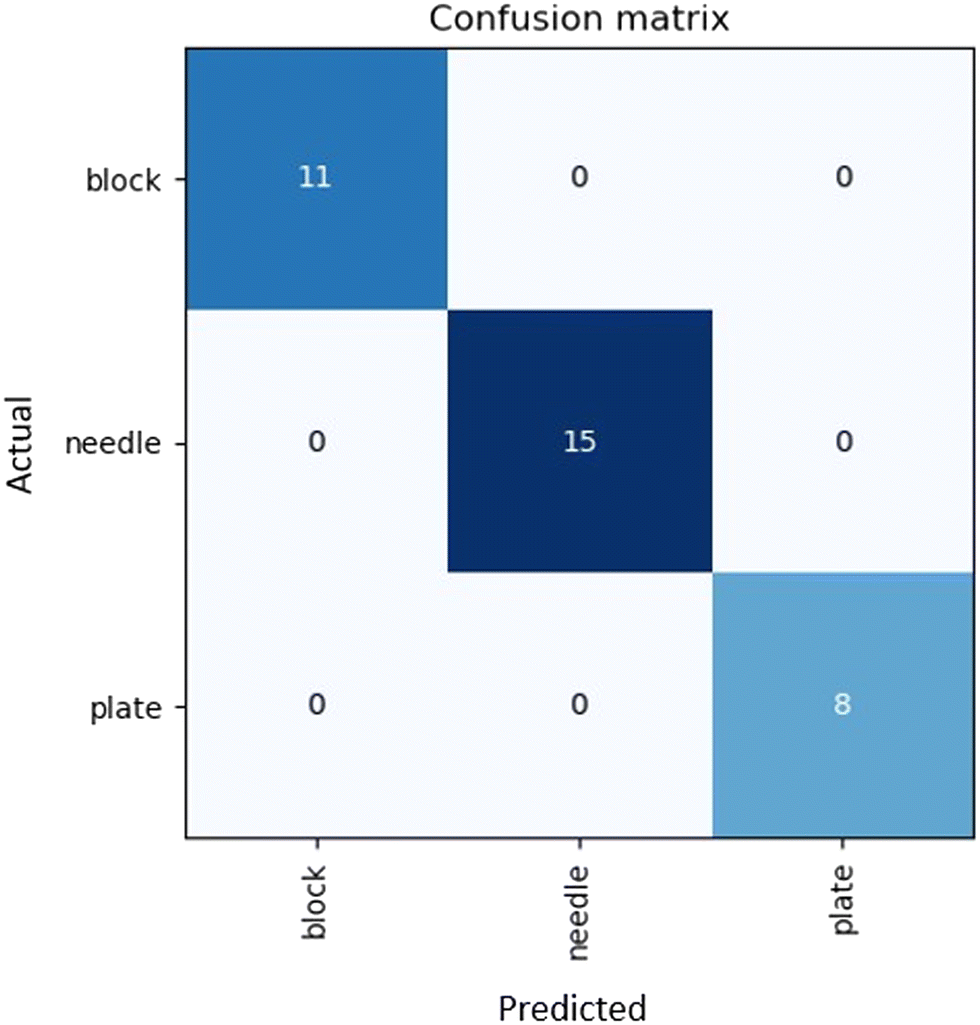 | ||
| Fig. 7 Confusion matrix of morphology labels assigned by the labelling robot using a deep learning model trained on the “in house” experimental dataset. | ||
Manual labelling is essential to train the classifier in the first instance, and since the model reflects human opinion, it will display some bias. To remove this issue, it is important to define characteristics of each morphology label, which can be quantified such as sphericity or aspect ratio. Defining such rules reduces uncertainty in training data, and aids in creating accurate labels.
Finally, the authors suggest that recording images of crystal shape should form part of the data entry process in the CSD. This task would need considerable considerations regarding the imaging methods, so that there was a degree of consistency between images. The use of low-cost, automated platforms such as the one outlined in this work could be a suitable solution for systematic image generation.
4 Conclusion
In this work, we present the use of transfer learning and open-source robotics to improve the state-of-the-art in applying artificial intelligence for the prediction of crystal morphology. It was demonstrated that despite a vast, extensive collection of literature data, there are limitations in accessing specific experimental details, which leads to poor performance. By screening in controlled conditions, it was shown that the accuracy of morphology prediction increased up to 87.9%, demonstrating that experimental details are key in high-performing models. This work also reinforces the conclusion that using images of chemical structures as molecular representations leads to better model accuracy, as a result of wider augmentation strategies, more representative coverage of high dimensional feature space and transfer learning. This conclusion supports the rise of graph and image-based models in the literature, which are increasingly outperforming descriptor-based machine learning methods. An automated deep learning system for reproducible morphology labelling is presented, in the hope this will address the remaining limitations arising from subjective labelling. This work acts as a baseline study in the hope that with higher throughput screening capability, more accurate morphology prediction can be achieved. This intelligent approach will reduce the timescales of drug development and lead to a more sustainable and efficient manufacturing approach.Data and code availability
The source code and experimental data for this project is available at (https://github.com/MRW-Code/ai_robotics_morphology_prediction). The code required for using the automated labelling system is available at (https://github.com/inte-R-action/hiTrosBot).Author contributions
M. R. W. carried out: all stages involving the CSD data, deep learning for morphology labelling with the robot, design and planning of the experimental synthesis methods as well as applying AI methods to the experimental data. L. K. H. carried out all the crystal synthesis and imaging thus generating the experimental dataset. U. M. H. designed and built the screening robot as well as providing supervisory support overseeing the AI methods in this work. The manuscript preparation was led by M. R. W. with support from B. C. D. and U. M. H. All other authors provided critical feedback on the manuscript. B. C. D., U. M. H. and C. C. W. were responsible for general project supervision. B. C. D. and C. C. W. were responsible for the PhD funding to support M. R. W.Conflicts of interest
The authors declare that there are no competing interests.Acknowledgements
The authors thank the PhD studentship funded by CMAC Future Manufacturing Research Hub and the Centre for Sustainable and Circular Technologies at the University of Bath. Furthermore, the authors thank Dr Tom Fincham Haines and the Department of Computer Science at the University of Bath for their support in accessing the hardware resources needed for this work.Notes and references
- C. R. Gardner, C. T. Walsh and Ö. Almarsson, Nat. Rev. Drug Discovery, 2004, 3, 926–934 CrossRef PubMed.
- H.-H. Tung, Crystallization of organic compounds: an industrial perspective, Wiley-Blackwell, 2009 Search PubMed.
- V. Waknis, E. Chu, R. Schlam, A. Sidorenko, S. Badawy, S. Yin and A. S. Narang, Pharm. Res., 2014, 31, 160–172 CrossRef PubMed.
- P. Dandekar, Z. B. Kuvadia and M. F. Doherty, Annu. Rev. Mater. Res., 2013, 43, 359–386 CrossRef.
- C. Schmidt and J. Ulrich, J. Cryst. Growth, 2012, 353, 168–173 CrossRef.
- A. L. Rohl, Curr. Opin. Solid State Mater. Sci., 2003, 7, 21–26 CrossRef.
- D. S. Coombes, C. R. A. Catlow, J. D. Gale, M. J. Hardy and M. R. Saunders, J. Pharm. Sci., 2002, 91, 1652–1658 CrossRef PubMed.
- Y. Wang and Z. Liang, J. Cryst. Growth, 2017, 480, 18–27 CrossRef CAS.
- Y. Zhang, Trop. J. Pharm. Res., 2014, 13, 829–834 CrossRef.
- C. R. Groom, I. J. Bruno, M. P. Lightfoot and S. C. Ward, Acta Crystallogr., Sect. B: Struct. Sci., Cryst. Eng. Mater., 2016, 72, 171–179 CrossRef CAS PubMed.
- M. R. Wilkinson, U. Martinez-Hernandez, C. C. Wilson and B. Castro-Dominguez, J. Mater. Res., 2022, 37, 2293–2303 CrossRef CAS.
- H. Moriwaki, Y.-S. Tian, N. Kawashita and T. Takagi, J. Cheminf., 2018, 10, 4 Search PubMed.
- K. He, X. Zhang, S. Ren and J. Sun, Proceedings of the IEEE Conference on Computer Vision and Pattern Recognition (CVPR), 2016 Search PubMed.
- A. Ghosh, L. Louis, K. K. Arora, B. C. Hancock, J. F. Krzyzaniak, P. Meenan, S. Nakhmanson and G. P. F. Wood, CrystEngComm, 2019, 21, 1215–1223 RSC.
- G. Dhanaraj, K. Byrappa, V. Prasad and M. Dudley, in Crystal Growth Techniques and Characterization: An Overview, 2010, pp. 3–16 Search PubMed.
- J. T. Hancock and T. M. Khoshgoftaar, J. Big Data, 2020, 7, 1–41 CrossRef.
- J. H. ter Horst, R. M. Geertman and G. M. van Rosmalen, J. Cryst. Growth, 2001, 230, 277–284 CrossRef.
- M. Maghsoodi, Adv. Pharm. Bull., 2015, 5, 13–18 Search PubMed.
- G. Yang, N. Kubota, Z. Sha, M. Louhi-Kultanen and J. Wang, Cryst. Growth Des., 2006, 6, 2799–2803 CrossRef.
- A. K. E.-Z. El-Yafi and H. El-Zein, Asian J. Pharm. Sci., 2015, 10, 283–291 CrossRef.
- O. Russakovsky, J. Deng, H. Su, J. Krause, S. Satheesh, S. Ma, Z. Huang, A. Karpathy, A. Khosla and M. Bernstein, Int. J. Comput. Vis., 2015, 115, 211–252 CrossRef.
| This journal is © The Royal Society of Chemistry 2022 |