 Open Access Article
Metal ions impact on the isostructurality and properties of 2D coordination polymers†
Yurii M.
Chumakov
a,
Olga
Danilescu
*b,
Olga V.
Kulikova
 a,
Paulina
Bourosh
a,
Ion
Bulhac
b and
Lilia
Croitor
a,
Paulina
Bourosh
a,
Ion
Bulhac
b and
Lilia
Croitor
 *a
*a
aInstitute of Applied Physics, Academiei 5, MD2028, Chisinau, Republic of Moldova. E-mail: croitor.lilia@gmail.com
bInstitute of Chemistry, Academiei 3, MD2028, Chisinau, Republic of Moldova. E-mail: olgadanilescu@mail.ru
First published on 26th May 2022
Abstract
Two new 2,6-diacetylpyridine bis(nicotinoylhydrazone) coordination polymers with the general formula {[MIIL]·xsolvent}n, in which MII = Fe, Co, were prepared solvothermally and characterized by various methods. Both compounds exhibit isostructurality with different solvents with our previously reported homo- and heteronuclear coordination layers (MII = Mn, Zn, Cd, MnZn, Zn0.75Cd1.25). A comprehensive investigation of the isometricity revealed the existence of a high degree of similarity for five pairs, medium similarity for six pairs, and low similarity for ten pairs. Despite the fact that the Mn(II) and Zn(II) coordination polymers are isostructural to each other, they are enantiomers of other compounds. The photoluminescence study was performed on all seven compounds and some of them were found to exhibit high photoluminescence intensities. Density functional theory has been used to estimate the nonlinear optical and thermoelectric properties of the given series of coordination polymers. It has been shown that, regardless of the different degrees of isostructurality of the studied coordination polymers, their properties significantly depend on the nature of the metal ions.
1. Introduction
To date, coordination polymers (CPs) have embodied one of the most intriguing areas of the solid-state chemistry that continues to develop expeditiously. Due to their diversity of structural topologies, compositions, properties, and applications, as well as the possibility of easy adjustment and preparation, CPs are of great interest to many researchers.1–7 Design, prediction and structural control are key factors for the synthesis of new CPs.5,8 However, structural control is a constant difficulty as a result of various internal and external factors (metal ion, organic ligand, counterion, solvent, reaction condition, temperature and time, pH value, etc.), as well as the existence of possibilities for the equivalence of crystal structures. This phenomenon, isostructurality, reflects the ability of the structurally similar molecule to have an identical or nearly identical crystal packing. In organic molecules, the nature of compounds is often characterized by divergences of one or two atoms/groups such as C/N, H/Hal, H/CH3, Hal/Hal, CH3/OCH3, etc.,8–13 while in coordination materials the isostructurality is usually manifested by the exchange of metal ions. Despite the fact that isostructural crystals are very similar in packing arrangement, they may have different properties. Thus, some coordination compounds exhibit difference in their thermal stability,14,15 photoluminescent and magnetic properties,15–19 heterogeneous catalytic and biological activity,15,20,21 which, apparently, are most affected by the central metal ion.The isostructurality effect is of great interest, especially to crystal engineers, as it may provide useful information for crystal structure prediction and this phenomenon caused its systematic study. The Kálmán group22,23 introduced the indexes of unit-cell similarity and isostructurality to determine the degree of similarity in the spatial arrangement of molecules. Subsequently, Fábián and Kálmán24 pointed out the limitations of the isostructural index and introduced a new measure of isostructurality, the volumetric isostructural index, to overcome these limitations. Another group, Gelbrich and Hursthouse,25 recommended the dissimilation index as a descriptor showing how far two crystal structures deviate from ideal geometric similarity. Martins et al.26 proposed, in addition to the geometric indexes mentioned above, to calculate the quantitative ones (geometric, contact area and energy parameters) in order to evaluate the packing similarity of complete crystal structures. More recently, Bombicz research group10 showed that indices of cell similarity, isostructurality, and molecular isometricity, combined with preliminary multivariate analysis of structural data, contribute to the easy recognition and characterization of isostructural crystals.
Recently, we published the X-ray structures of five isomorphous and isostructural homo- and heteronuclear 2D coordination polymers differing in central atoms, {[MIIL]·xsolvent}n where MII = Mn, Zn, Cd, MnZn, Zn0.75Cd1.25.27,28 In continuation of the previous results, we reveal here two new CPs, {[FeL]·0.5dmf·H2O}n (1) and {[CoL]·dmf}n (2), to study the degree of isostructurality of the entire series of compounds and the influence of metal ions on their properties. In this regard, a detailed crystallographic analysis and photoluminescent measurements were carried out, as well as an assessment of the nonlinear optical and thermoelectric properties of this series of CPs.
2. Experimental
General
All chemicals (2,6-diacetylpyridine, nicotinic acid hydrazide, FeCl3·6H2O, CoSO4·7H2O, dmf and ethanol) were obtained from commercial sources and were used without further purification. The ligand 2,6-diacetylpyridinebis(nicotinoylhydrazone) (H2L) was obtained by the condensation of 2,6-diacetylpyridine and nicotinic acid hydrazide by the previously described methods.29,30Elemental analysis was performed on an Elementar Analysensysteme GmbH Vario El III elemental analyzer.
The IR spectra were obtained in vaseline oil (400–4000 cm−1) and ATR (650–4000 cm−1) on a FT IR Spectrum-100 Perkin Elmer spectrometer.
The photoluminescence (PL) was excited by a pulsed N2 laser with λexc = 337 nm in the interval of 350–750 nm at room temperature. The emission was detected with a FEU-79 instrument (multialkaline photocathode Sb(Na2K) with the adsorbed cesium layer on the surface, characteristic to the S20 type). The obtained PL spectra consist of several radiative processes. The Gaussian function was used for the bands' deconvolution to resolve the spectra as superpositions of several radiative processes (Fig. S1†).
Synthesis of 1 and 2
The synthesis of complexes 1 and 2 were carried out under solvothermal conditions similar to the previously published CPs from this series.27,28 A mixture of metal salt (FeCl3·6H2O 0.027 g/CoSO4·7H2O 0.028 g, 0.1 mmol), H2L (0.04 g, 0.1 mmol) and solvents (dmf![[thin space (1/6-em)]](https://www.rsc.org/images/entities/char_2009.gif) :
:![[thin space (1/6-em)]](https://www.rsc.org/images/entities/char_2009.gif) ethanol = 1
ethanol = 1![[thin space (1/6-em)]](https://www.rsc.org/images/entities/char_2009.gif) :
:![[thin space (1/6-em)]](https://www.rsc.org/images/entities/char_2009.gif) 2.33/H2O
2.33/H2O![[thin space (1/6-em)]](https://www.rsc.org/images/entities/char_2009.gif) :
:![[thin space (1/6-em)]](https://www.rsc.org/images/entities/char_2009.gif) dmf
dmf![[thin space (1/6-em)]](https://www.rsc.org/images/entities/char_2009.gif) :
:![[thin space (1/6-em)]](https://www.rsc.org/images/entities/char_2009.gif) ethanol = 1
ethanol = 1![[thin space (1/6-em)]](https://www.rsc.org/images/entities/char_2009.gif) :
:![[thin space (1/6-em)]](https://www.rsc.org/images/entities/char_2009.gif) 3
3![[thin space (1/6-em)]](https://www.rsc.org/images/entities/char_2009.gif) :
:![[thin space (1/6-em)]](https://www.rsc.org/images/entities/char_2009.gif) 7) was sealed in a Teflon-lined autoclave (10 mL) and heated at 120 °C for 48 h under autogenous pressure and cooled to room temperature with a rate of 0.6 °C min−1. Products were obtained as brown (0.021 g, 1) and ruby crystals (0.042 g, 2), which were collected by filtration, washed with ethanol, and dried in air at room temperature.
7) was sealed in a Teflon-lined autoclave (10 mL) and heated at 120 °C for 48 h under autogenous pressure and cooled to room temperature with a rate of 0.6 °C min−1. Products were obtained as brown (0.021 g, 1) and ruby crystals (0.042 g, 2), which were collected by filtration, washed with ethanol, and dried in air at room temperature.
![[double bond, length as m-dash]](https://www.rsc.org/images/entities/char_e001.gif) O)(amide I, complex); 1670 ν(C
O)(amide I, complex); 1670 ν(C![[double bond, length as m-dash]](https://www.rsc.org/images/entities/char_e001.gif) O)(amide I,dmf); 1581 ν(CN)(of amide II); 1257 νas(OCN)(of amide III); 1593 ν(C
O)(amide I,dmf); 1581 ν(CN)(of amide II); 1257 νas(OCN)(of amide III); 1593 ν(C![[double bond, length as m-dash]](https://www.rsc.org/images/entities/char_e001.gif) N)(azomethine).
N)(azomethine).
![[double bond, length as m-dash]](https://www.rsc.org/images/entities/char_e001.gif) O)(amide I, complex); 1669 ν(C
O)(amide I, complex); 1669 ν(C![[double bond, length as m-dash]](https://www.rsc.org/images/entities/char_e001.gif) O)(amide I,dmf); 1583 ν(CN)(of amide II); 1255 νas(OCN)(of amide III); 1595 ν(C
O)(amide I,dmf); 1583 ν(CN)(of amide II); 1255 νas(OCN)(of amide III); 1595 ν(C![[double bond, length as m-dash]](https://www.rsc.org/images/entities/char_e001.gif) N)(azomethine).
N)(azomethine).
X-ray crystallography
X-ray diffraction data of 1 and 2 were collected at room temperature on a Xcalibur E CCD diffractometer with a CCD area detector and a graphite monochromator using MoK radiation. Determination of the unit cell parameters and processing of experimental data were performed using the CrysAlis Oxford Diffraction Ltd.31 The structures were solved by direct methods. The programs SHELXS97 and SHELXL201432,33 were used for structure solution and refinement of the proposed models. All non-H atoms were refined anisotropically. Hydrogen atoms attached to carbon were positioned geometrically and treated as riding atoms, while water molecules H atoms were calculated based on the formation of a H-bond. The solvent guest molecules were refined with an occupation factor of 0.25 in 1 and 0.5 in 2. Full crystallographic details are given in Table 1. The Figures were produced by the Mercury program.34| 1 | 2 | |
|---|---|---|
| CCDC | 2161673 | 2161674 |
| Empirical formula | C22.50H22.50FeN7.50O3.50 | C24H24CoN8O3 |
| Formula weight | 509.83 | 531.44 |
| Crystal system | Orthorhombic | Orthorhombic |
| Space group | P21212 | P21212 |
| Z | 2 | 2 |
| a(Å) | 12.377(3) | 12.2124(5) |
| b(Å) | 9.4953(13) | 9.4700(4) |
| c(Å) | 10.2036(15) | 10.2670(6) |
| Volume (Å3) | 1199.2(4) | 1187.39(10) |
| ρ c (g cm−1−3) | 1.412 | 1.486 |
| μ (mm−1) | 0.671 | 0.767 |
| F(000) | 528 | 550 |
| Crystal size (mm3) | 0.4 × 0.04 × 0.04 | 0.2 × 0.18 × 0.02 |
| Reflections collected | 3179 | 2653 |
| Unique reflections | 2036 | 1875 |
| R(int) | 0.0644 | 0.0335 |
| Reflections with [I>2σ(I)] | 1199 | 1612 |
| Restraints/parameters | 4/162 | 0/190 |
| GOF on F2 | 1.000 | 1.003 |
| R 1, wR2 [I>2σ(I)] | 0.0775, 0.1142 | 0.0421, 0.0770 |
| R 1, wR2 (all data) | 0.1393, 0.1381 | 0.0537, 0.0828 |
Isostructurality calculation
The isometricities of all examined CPs were performed using the Mercury software (version 2021.2.0),34 superimposing the asymmetric units of all pairs of complexes followed by calculating the root mean square of the distance differences of the corresponding atoms (RMSD) and the largest distance difference between the compared atoms (max![[thin space (1/6-em)]](https://www.rsc.org/images/entities/char_2009.gif) D).
D).
The isostructurality of compounds was assessed by two geometric descriptors – the indixes of cell similarity (π) and isostructurality (Is) (Table 2), which were calculated as follows:
![[thin space (1/6-em)]](https://www.rsc.org/images/entities/char_2009.gif) D) of possible pairs of studied compounds
D) of possible pairs of studied compounds
| Pair | π | Is | RMSD | max![[thin space (1/6-em)]](https://www.rsc.org/images/entities/char_2009.gif) D D |
|---|---|---|---|---|
| 1/2 | 0.004 | 94.486 | 0.017 | 0.038 |
| 1/3 | 0.011 | 11.139 | 0.747 | 1.660 |
| 1/4 | 0.0004 | 8.362 | 0.738 | 1.647 |
| 1/5 | 0.025 | 61.384 | 0.094 | 0.200 |
| 1/6 | 0.004 | 89.049 | 0.033 | 0.057 |
| 1/7 | 0.02 | 67.517 | 0.082 | 0.169 |
| 2/3 | 0.015 | 11.634 | 0.746 | 1.651 |
| 2/4 | 0.004 | 8.285 | 0.737 | 1.638 |
| 2/5 | 0.029 | 56.293 | 0.102 | 0.221 |
| 2/6 | 0.008 | 83.92 | 0.04 | 0.082 |
| 2/7 | 0.024 | 62.385 | 0.0903 | 0.192 |
| 3/4 | 0.011 | 86.646 | 0.032 | 0.071 |
| 3/5 | 0.014 | 12.946 | 0.769 | 1.705 |
| 3/6 | 0.007 | 10.487 | 0.755 | 1.679 |
| 3/7 | 0.0096 | 12.0287 | 0.765 | 1.707 |
| 4/5 | 0.025 | 14.544 | 0.761 | 1.692 |
| 4/6 | 0.005 | 8.947 | 0.747 | 1.666 |
| 4/7 | 0.021 | 12.971 | 0.757 | 1.694 |
| 5/6 | 0.021 | 72.103 | 0.066 | 0.146 |
| 5/7 | 0.0043 | 93.5171 | 0.0197 | 0.034 |
| 6/7 | 0.0162 | 78.2623 | 0.0544 | 0.114 |
where a, b, c and a′, b′, c′ are the orthogonalized lattice parameters of the two related crystals; n is the number of related non-hydrogen atoms; and ΔRi are the distance differences between their atomic coordinates. The compared molecules have to be selected in a way to be within the same section of the related structures, and they should be in the closest possible selection to the origins. In the case of the great similarity of two unit cells, π is close to zero and Is is becoming close to 100% in the case of high structural similarity (the details are in ESI†).
The solvated molecules were not taken into account in the isostructurality and isometricity calculation.
Computational details
A self-consistent ground-state calculations were performed with the ABINIT code.35 The electronic structure calculations were performed in the generalized gradient approximation with the Perdew–Burke–Ernzerhof exchange–correlation energy functional.36 Orbitals were expanded in plane waves up to a cutoff of 30 Hartrees. The pseudopotential generated in our work was one of those of Troullier–Martins.37 The nonshift Monkhorst–Pack k-mesh (6 × 7 × 7)38 was used to generate k-points in the irreducible Brillouin zone, which was enough to obtain a dense mesh of energy eigenvalues. The Seebeck coefficients were calculated using the BoltzTraP code,39 which depends on a well-tested smoothed Fourier interpolation to obtain an analytical expression of bands calculated by ABINIT code. Seebeck coefficient (thermopower) is a measure of the value of the thermoelectric voltage induced by the response to a temperature difference across the material.40 The efficiency of thermoelectric materials is characterized by the thermoelectric figure of merit (ZT), which is defined as ZT = itσS2T/(ke + klat), where S, T, σ, ke, and klat are the Seebeck coefficient, temperature, electrical conductivity, and electronic and lattice contributions to the thermal conductivity, respectively. For studied compounds the figure of merit was estimated as ZTmax= σ S2T/ke.3. Results and discussion
3.1. Structural descriptions of CPs
The crystals of {[FeL]·0.5dmf·H2O}n (1) and {[CoL]·dmf}n (2) are isomorphous and isostructural to one another and with our previous published {[MnL]·dmf}n (3),28 {[ZnL]·0.5dmf·1.5H2O}n (4), {[CdL]·0.5dmf·H2O}n (5), {[MnZnL2]·dmf·3H2O}n (6) and {[Zn0.75Cd1.25L2]·dmf·0.5H2O}n (7) compounds.27 All of them crystallize in orthorhombic P21212 space group with metal atoms and ligands residing on the two fold axis. Each M2+ is heptacoordinated (N5O2) with symmetric pentagonal bipyramidal geometry, where the equatorial positions are occupied by three nitrogen atoms and two oxygen atoms of one ligand, while the axial positions are occupied by the two N of terminal pyridine rings of adjacent symmetry related complexes (Fig. 1). The L2− shows twisted conformation, as evidenced by the dihedral angle between the coordinated and terminal pyridine rings in the range 39.2(3)–40.8(2)°, and is responsible for the connection of metal cations in a 2D wave-like layer with 4,4-net topology (Fig. S1†). The separation of M⋯M by Schiff base ligand is in the range of 8.4625(5)–8.7527(4) Å.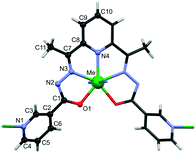 | ||
| Fig. 1 Metal polyhedron in CPs 1–7 with atom labelling of common sets of atoms in asymmetric units of studied compounds. | ||
3.2. Analysis of isostructurality of coordination polymers 1–7
Seven isomorphic and isostructural 2D coordination polymers have been analysed in order to identify similarities and differences not only in their structures, but also in properties. To compare the crystal structures of CPs 1–7, the orientation of the cell parameters was chosen in the same order. Thus, the similar cell dimensions (Table S3†) and identical space group of CPs 1–7 suggest them being isostructural compounds. Our next step was to draw overlay diagrams of asymmetric units for all possible pairs (21) of compounds 1–7 (Fig. 2) and to determine RMSD value for each pair. The smallest results were obtained for pairs 1/2 and 5/7. It was found that the pairs formed by CPs 3 or 4 have the highest values with the largest distance difference of the compared atoms for the C5 atom (Table 2).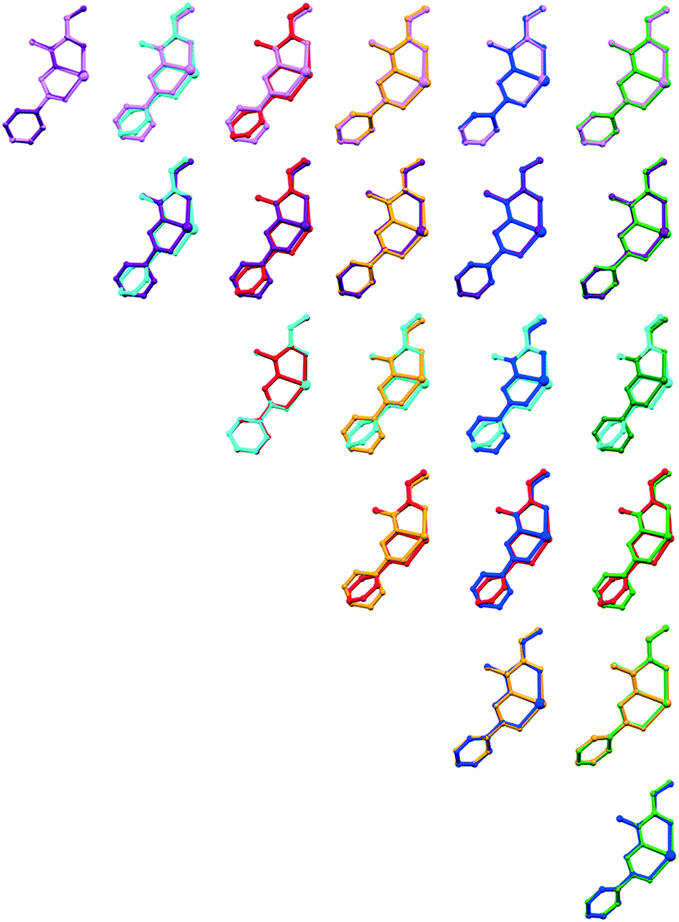 | ||
| Fig. 2 Overlay diagrams of the asymmetric units for all possible pairs between compounds 1–7. Compound color scheme: 1 – violet, 2 – purple, 3 – cyan, 4 – red, 5 – orange, 6 – blue and 7 – green. | ||
Then, we have calculated both the unit-cell similarity (π) and the isostructurality (Is) indexes of all pairs to quantify the molecular similarity. All pairs have π less than 0.1, which indicates their great lattice similarity. Despite this, the values of the geometric index Is divide the resulting pairs of compounds into three groups:23 (A) with high similarity of two structures (>80%), known as isometric molecules, and are found in pairs 1/2, 1/6, 2/6, 3/4 and 5/7; (B) with medium similarity (40–80%), that is, with configuration differences in pairs of 1/5, 1/7, 2/5, 2/7, 5/6 and 6/7; and (C) with low similarity (<40%) or homeostructural crystals, where only “relaxed” packing similarity can be recognized. This group includes ten pairs formed by a combination of compounds 1, 2, 5–7 with CPs 3 and 4. From Table 2 we can see that the Is index is in good agreement with the RMSD and max![[thin space (1/6-em)]](https://www.rsc.org/images/entities/char_2009.gif) D data. Accordingly, for all pairs with a high degree of similarity (group A) the RMSD values are up to 0.04 with 0.082 max D, in group B – the RMSD falls within the range 0.0544–0.102 at max
D data. Accordingly, for all pairs with a high degree of similarity (group A) the RMSD values are up to 0.04 with 0.082 max D, in group B – the RMSD falls within the range 0.0544–0.102 at max![[thin space (1/6-em)]](https://www.rsc.org/images/entities/char_2009.gif) D 0.221, while for group C pairs the RMSD values are greater than 0.737 with the largest distance difference between atoms, 1.638–1.707. Thus, overlaid diagrams, Is index and RMSD data reveal that compounds 3 and 4 are non-superposable with other CPs from the entire family and may be considered as enantiomers of CPs 1, 2 and 5–7.
D 0.221, while for group C pairs the RMSD values are greater than 0.737 with the largest distance difference between atoms, 1.638–1.707. Thus, overlaid diagrams, Is index and RMSD data reveal that compounds 3 and 4 are non-superposable with other CPs from the entire family and may be considered as enantiomers of CPs 1, 2 and 5–7.
3.3. Photoluminescent properties
CPs are promising multifunctional luminescent materials capable of self-assembly not only due to metal ions and organic ligands through coordination bonds, but also due to non-covalent interactions such as hydrogen bonds, π–π stacking, and weak van der Waals interactions observed into crystals. Therefore, CPs can have various structures and these varied structures can be realized by choosing different metal ions or/and ligands.41 In this section, we present the photoluminescent (PL) spectra of 1–7 and their shapes of luminescence spectral dependences (Fig. 3).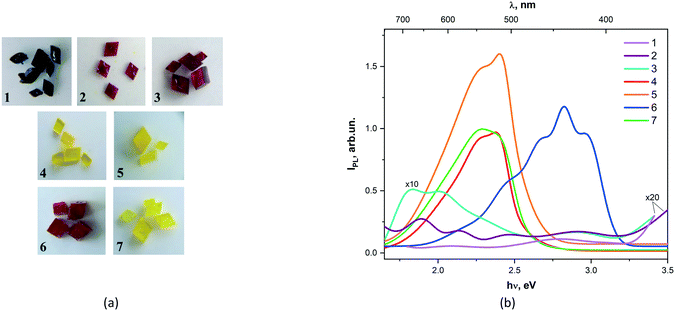 | ||
| Fig. 3 Photos of crystal 1–7 selected for photoluminescent experiment (a). Solid-state emission spectra for compounds 1–7 (b). | ||
Complexes 1, 2, and 3 show a low-intensity luminescence in the long-wavelength spectral range (650–700 nm). For all studied compounds, luminescence bands were observed with maxima at 2.1, 2.45, and 2.7 eV. The maximum photoluminescence intensities of complexes 4, 5, and 7 are observed in the range of 500–600 nm. A closer examination showed that the emission maximum of 5 is blue-shifted compared to compounds 4 and 7. However, the low-energy excitation maximum observed for 7 is red-shifted contrary to 4. Meanwhile, the measured PL spectrum of 7 has characteristic peaks found in the spectra of both 4 and 5 (Fig. S2†). The photoluminescence spectrum 6 is characterized by the appearance of short-wavelength bands in the region of 400–450 nm.
It seems that the studied PL spectra of compounds 1–7 can be attributed to π–π*, n–π* and metal–ligand transitions.27 Thus, high-intensity PL spectra were observed only for Zn and Cd-containing complexes in the long-wavelength region of the studied spectrum, while the PL spectra of Fe, Co, and Mn-containing compounds demonstrate a very low intensity.
Among all studied compounds, the energy gap was estimated only for complexes 4, 5 and 7 and is equal to 2.3 eV ± 0.1 eV (see ESI†).
3.4. Band structure and thermoelectric properties
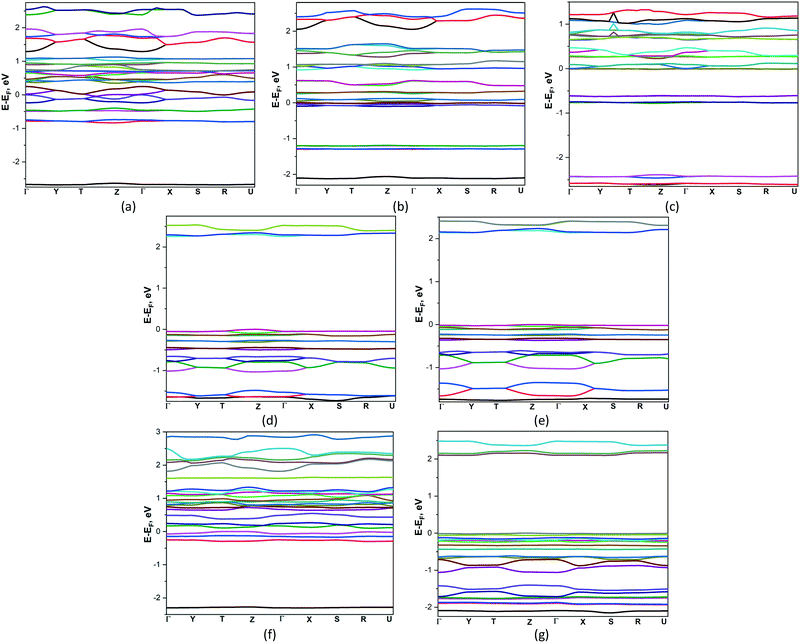
Thermoelectric (TE) materials are receiving the growing interest because their ability to directly converting heat to electricity. Polymer-based TE materials are fascinating to wearable and mobile devices due to their low density, good flexibility, and low toxicity. However, the TE performance of such materials is still challenged by their low energy conversion efficiency.42 Therefore more fundamental investigations are needed for their properties optimization. In this connection the Boltzmann transport equation and the density functional theory were applied for compounds 1–7 to estimate their semiclassical transport coefficients.The band structures of 1–7 are presented on Fig. 4. According to the results obtained, the zero band gaps observed in compounds 1–3, which are semimetals. On their electronic band structures the bands cross at the Fermi level, located in vicinity of Γ high-symmetry points with a very small overlap between the bottom of the conduction band (CB) and the top of the valence band (VB). Compounds 4 and 5 are the indirect band gap semiconductors with bands gaps 2.242 and 2.135 eV where CB minima VB maxima are located at Z and Γ and Γ and Y points respectively. Compounds 6 and 7 are the direct band gap semiconductors, the top of the valence band and the bottom of the conduction band occur at T and Γ points, band gaps are equal to 0.121 and 2.089 eV. In the studied compounds the conduction bands show quite complex behaviour because the bands exhibit crossovers, minima and maxima. Practically along all high-symmetry lines near the Fermi energy level there are some almost flat subband dispersions in the valence band of 1–7. It means that the masses acting in the respective directions in the k-space are massive, indicating that the carriers are localized in the potential walls.
The calculated temperature dependency of Seebeck coefficients and figures of merit, based on band structures of 1–7, are shown on Fig. 5. The Seebeck coefficients provided by BoltzTraP code are calculated as an absolute figure which gives a better control to compare with the measured values. The positive thermopower values were found for 4, 5 and 7 compounds indicating that hole-type carrier is dominant in thermoelectric transport for these materials. The maximal among these compounds and very high values of Seebeck coefficient are observed for 4 in the temperature interval of 200–800 K. The negative Seebeck coefficients were found for 1–3 and 6 compounds that are characteristic for negatively charged carriers providing the thermoelectric transport and 1 and 6 possess the largest absolute values of thermopowers in temperature interval 200–800 K. The maximal values of ZTmax, which are equal ca. 1, in all temperature intervals were found for compound 4. Moreover, the high values of figure of merit (>0.6) are observed for all another compounds at temperatures 500–800 K. Thus, compound 4 demonstrates the highest thermoelectric performance among studied compounds. The localized states in VB of given compound may prevent the electron–hole compensation effect that correlates with the calculated large values of thermopowers and ZTmax.
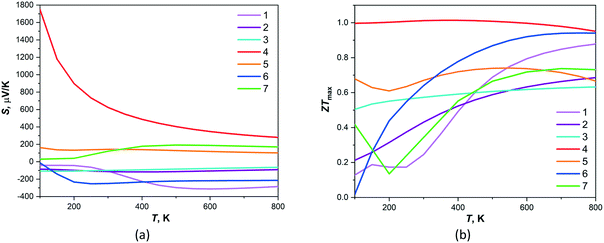 | ||
| Fig. 5 Theoretical temperature dependence of (a) thermopower and (b) dimensionless figure of merit ZT calculated by BoltzTraP for compounds 1–7. | ||
3.5. Nonlinear optical susceptibility
It is known that nonlinear optical susceptibility (NLO) occurs in crystals that are non-centrosymmetric and it has applications in many technical areas such as optoelectronics, laser science, and optical signal processing. In order to estimate the NLO phenomena of studied crystals 1–7, the frequency-dependent second-order nonlinear optical susceptibility χ(2)ijk(−2ω, ω, ω) calculations were performed in the random-phase approximation using the optic utility of the ABINIT package.35 The number of empty bands was increased until the highest empty band was 15 eV above the valence band maximum. The optical properties were calculated with 50 meV broadening and without scissor shifts. For simplicity the χ(2)ijk(−2ω, ω, ω) complex second-order NLO susceptibility tensor χ can be written as χ(2)ijk(ω) where the subscripts i, j and k are Cartesian indices. Under the restriction of Kleinman symmetry for the point group 222 there are 3 nonzero χ(2)ijk(ω) values: χ(2)123(ω), χ(2)213(ω), χ(2)321(ω) and their imaginary parts are presented on Fig. 6. It is observed that the shape of Imχ(2)ijk(ω) curves for studied compounds is different, however the imaginary part of χ(2)321(ω) component is the largest (with exception of 4) among another ones.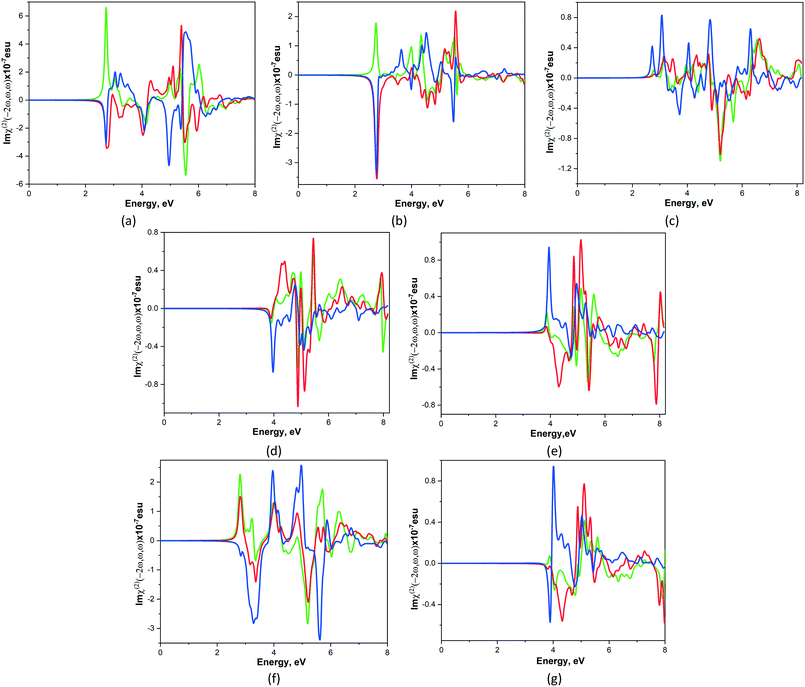 | ||
| Fig. 6 Calculated total imaginary parts of χ(2)123(ω).(green line), χ(2)213(ω) (red line) and χ(2)321(ω) (blue line) for CPs 1–7 (a–g). | ||
As shown in Fig. 6 the total NLO susceptibility for compounds 1–3, 6 are zero below ca. 2.1 eV, whereas for 4, 5 and 7 this quantity is zero below 3.2 and 3.6 eV respectively. Imχ(2)ijk(ω) are very flat for all components in indicated regions. The zeroes values of NLO susceptibility for 4, 5 and 7 compounds lie beyond of their energy gaps and it means that the region around the conduction band minimum does not make a significant contribution to χ(2)ijk(ω). The total of Imχ(2)ijk(ω) of studied compounds decreases in following order 1 > 6 > 2 > 5 > 7 > 3 > 4. Thus, 1 possesses the highest value of the total imaginary part of NLO susceptibility among the other studied compounds.
4. Conclusions
A comparison of the crystal structures of seven coordination polymers formed with the same ligand and differing in central atoms (1 = Fe; 2 = Co; 3 = Mn; 4 = Zn; 5 = Cd; 6 = MnZn and 7 = Zn0.75Cd1.25) showed that compounds containing mainly first-row transition metal elements (1 and 2) show the greatest structural similarity. Two Cd-containing compounds, 5 and 7, also have a high index of isostructurality but have an average similarity to 1 and 2, which may be due to the difference in their metallic radii. Although CPs 3 and 4 are highly isostructural, they are enantiomers of CPs 1, 2 and 5–7.The band structures calculation of 1–7 revealed that compounds 1–3 are semimetals, while 4, 5 and 6, 7 are semiconductors with an indirect and direct band gap, respectively. Due to this, the pseudogaps are observed in the valence bands of 1 (2.0 eV), 2 (1.2, 0.8 eV), 3 (0.7, 1.5 eV) and 6 (2.0 eV). It was found that compounds containing Zn(II) and Cd(II) metals exhibit higher PL intensities than Fe(II), Co(II) and Mn(II)-containing complexes. PL is related to the investigation of photogenerated charge carriers separation since PL spectra usually result from the recombination of photogenerated electron–hole pairs. Thus, the high PL intensity in 4–6 indicates to greater recombination of charge carriers, whereas the lower PL intensity in 1–3 suggests the maximum separation of charge carriers, as well as an enhancement of non-radiative recombination. The presence of pseudogaps in 1–3 can also affect charge carriers recombination, leading to a small number of high k-value holes on the edge of the valance band.
It has been found that some of investigated CPs are able to combine multiple properties together in a one material. Complexes containing Zn(II) and Cd(II) metals exhibit the highest PL intensity. At the same time, these compounds demonstrate positive thermopower values while the electron-type carrier is predominant in other investigated CPs. It was noticed that the combination of Mn(II) and Zn(II) ions in one CP, {[MnZnL2]·dmf·3H2O}n, leads to negative thermopower. The compound {[ZnL]·0.5dmf·1.5H2O}n (4) possesses the highest thermoelectric characteristics compared to other studied complexes. However, high figure of merit values (>0.6) are observed for compounds 1–3 and 5–7 at temperatures of 500–800 K. The best NLO properties were found for Fe(II) containing compound 1, the total imaginary part of which was 2–7 times higher than that of compounds 2–7. Simultaneously, this CP demonstrates the significant negative Seebeck coefficient in the temperature range of 400–800 K.
Thus, despite the different degrees of isostructurality of studied CPs, their properties significantly depend on the nature of the metals.
Author contributions
YMC: conceptualization, methodology, software, validation, data curation, visualization, writing—original draft preparation, writing—review and editing. OD: methodology, formal analysis, investigation, writing—original draft preparation. OVK: methodology, software, formal analysis, visualization, writing—original draft preparation. PB: methodology, software, investigation, writing—review and editing. IB: formal analysis, investigation, writing—review and editing. LC: conceptualization, methodology, software, validation, investigation, data curation, visualization, writing—original draft preparation, writing—review and editing, supervision. All authors have read and agreed to the published version of the manuscript.Conflicts of interest
The authors declare no conflict of interest.Acknowledgements
The authors are grateful to projects financed by the National Agency of Research and Development of R. Moldova – ANCD 20.80009.5007.15 of the Institute of Applied Physics, as well as ANCD 20.80009.5007.28 of the Institute of Chemistry.References
- C. Janiak, Dalton Trans., 2003, 2781–2804 RSC.
- S. Kitagawa, R. Kitaura and S. Noro, Angew. Chem., Int. Ed., 2004, 43, 2334–2375 CrossRef CAS PubMed.
- S. R. Batten, S. M. Neville and D. R. Turner, Coordination Polymers: Design, Analysis and Application, Royal Society of Chemistry, Cambridge, 2008 Search PubMed.
- G. Givaja, P. Amo-Ochoa, C. J. Gómez-García and F. Zamora, Chem. Soc. Rev., 2012, 41, 115–147 RSC.
- G. I. Dzhardimalieva and I. E. Uflyand, RSC Adv., 2017, 7, 42242–42288 RSC.
- J.-Q. Liu, Z.-D. Luo, Y. Pan, A. K. Singh, M. Trivedi and A. Kumar, Coord. Chem. Rev., 2020, 406, 213145 CrossRef CAS.
- Z. Huang, Y. Wang, D. Yao, J. Wu, Y. Hu and A. Yuan, Nat. Commun., 2021, 12, 145 CrossRef CAS PubMed.
- M. Du, C.-P. Li, C.-S. Liu and S.-M. Fang, Coord. Chem. Rev., 2013, 257, 1282–1305 CrossRef CAS.
- D. Cincic, T. Friscic and W. Jones, Chem. Mater., 2008, 20, 6623–6626 CrossRef CAS.
- P. Bombicz, N. V. May, D. Fegyverneki, A. Saranchimeg and L. Bereczki, CrystEngComm, 2020, 22, 7193–7203 RSC.
- M. Arhangelskis, L. Van Meervelt and L. Dobrzańska, CrystEngComm, 2021, 23, 317–323 RSC.
- A. V. Buldakov, M. A. Kinzhalov, M. A. Kryukova, D. M. Ivanov, A. S. Novikov, A. S. Smirnov, G. L. Starova, N. A. Bokach and V. Yu. Kukushkin, Cryst. Growth Des., 2020, 20, 1975–1984 CrossRef CAS.
- A. Saidykhan, N. W. Fenwick, R. D. Bowen, R. Telford and C. C. Seaton, CrystEngComm, 2021, 23, 7108–7117 RSC.
- D. Sun, Sh. Ma, Y. Ke, T. M. Petersen and H.-C. Zhou, Chem. Commun., 2005, 2663–2665 RSC.
- B. Ay, E. Yildiz and İ. Kani, Polyhedron, 2017, 130, 165–175 CrossRef CAS.
- L.-L. Luo, X.-L. Qu, Zh. Li, X. Li and H.-L. Sun, Dalton Trans., 2018, 47, 925–934 RSC.
- B. Bhattacharya, D. K. Maity, R. Mondal, E. Colacio and D. Ghoshal, Cryst. Growth Des., 2015, 15, 4427–4437 CrossRef CAS.
- F. Su, L. Lu, S. Feng, M. Zhu, Z. Gao and Y. Dong, Dalton Trans., 2015, 44, 7213–7222 RSC.
- A. Kliuikov, O. Bukrynov, E. Cizmar, L. Vahovska, S. Vitushkina, E. Samolovad and I. Potocnak, New J. Chem., 2021, 45, 7117–7128 RSC.
- X. Wang, X. Zhang, P. Li, K. Otake, Y. Cui, J. Lyu, M. D. Krzyaniak, Y. Zhang, Z. Li, J. Liu, C. T. Buru, T. Islamoglu, M. R. Wasielewski, Z. Li and O. K. Farha, J. Am. Chem. Soc., 2019, 141, 8306–8314 CrossRef CAS PubMed.
- M. Gacki, K. Kafarska, A. Pietrzak, I. Korona-Glowniak and W. M. Wolf, Molecules, 2020, 25, 3099 CrossRef CAS PubMed.
- A. Kálmán, G. Argay, D. Scharfenberg-Pfeiffer, E. Höhne and B. Ribár, Acta Crystallogr., Sect. B: Struct. Sci., 1991, 47, 68–77 CrossRef.
- A. Kálmán, L. Párkányi and G. Argay, Acta Crystallogr., Sect. B: Struct. Sci., 1993, 49, 1039–1049 CrossRef.
- L. Fábián and A. Kálmán, Acta Crystallogr., Sect. B: Struct. Sci., 1999, 55, 1099–1108 CrossRef PubMed.
- T. Gelbrich and M. B. Hursthouse, CrystEngComm, 2005, 7, 324–336 RSC.
- P. R. S. Salbego, C. R. Bender, M. Hörner, N. Zanatta, C. P. Frizzo, H. G. Bonacorso and M. A. P. Martins, ACS Omega, 2018, 3, 2569–2578 CrossRef CAS PubMed.
- O. Danilescu, P. N. Bourosh, O. Petuhov, O. V. Kulikova, I. Bulhac, Y. M. Chumakov and L. Croitor, Molecules, 2021, 26, 2317 CrossRef CAS PubMed.
- L. Croitor, M. Cocu, I. Bulhac, P. N. Bourosh, V. Ch. Kravtsov, O. Petuhov and O. Danilescu, Polyhedron, 2021, 206, 115329 CrossRef CAS.
- P. Mazza, F. Zani, M. Orcesi, C. Pelizzi, G. Pelizzi and G. Predieri, J. Inorg. Biochem., 1992, 48, 251–270 CrossRef CAS PubMed.
- B. Bottari, R. Maccari, F. Monforte, R. Ottana, M. G. Vigorita, G. Bruno, F. Nicolo, A. Rotondo and E. Rotondo, Bioorg. Med. Chem., 2001, 9, 2203–2211 CrossRef CAS PubMed.
- CrysAlis RED, O.D.L. Version 1.171.34.76. 2003.
- G. M. Sheldrick, Acta Crystallogr., Sect. A: Found. Crystallogr., 2008, 64, 112–122 CrossRef CAS PubMed.
- G. M. Sheldrick, Acta Crystallogr., Sect. C: Struct. Chem., 2015, 71, 3–8 Search PubMed.
- C. F. Macrae, P. R. Edgington, P. McCabe, E. Pidcock, G. P. Shields, R. Taylor, M. Towler and J. van de Streek, J. Appl. Crystallogr., 2006, 39, 453–457 CrossRef CAS.
- X. Gonze, B. Amadon, P.-M. Anglade, J.-M. Beuken, F. Bottin, P. Boulanger, F. Bruneval, D. Caliste, R. Caracas and M. Cote, Comput. Phys. Commun., 2009, 180, 2582–2615 CrossRef CAS.
- J. P. Perdew, K. Burke and M. Ernzerhof, Phys. Rev. Lett., 1996, 77, 3865–3868 CrossRef CAS PubMed.
- N. Troullier and J. L. Martins, Phys. Rev. B, 1991, 43, 8861–8869 CrossRef PubMed.
- H. J. Monkhorst and J. D. Pack, Phys. Rev. B, 1976, 13, 5188–5192 CrossRef.
- G. K. H. Madsen and D. J. Singh, Comput. Phys. Commun., 2006, 175, 67–71 CrossRef CAS.
- Y. Chumakov, F. Aksakal, A. Dimoglo, A. Ata and S. A. Palomares-Sánchez, J. Electron. Mater., 2016, 45, 3445–3452 CrossRef CAS.
- J.-Q. Liu, Z.-D. Luo, Y. Pan, A. K. Singh, M. Trivedi and A. Kumar, Coord. Chem. Rev., 2020, 406, 213145 CrossRef CAS.
- J. Li, A. B. Huckleby and M. Zhang, J. Materiomics, 2021, 8, 204–220 CrossRef.
Footnote |
| † Electronic supplementary information (ESI) available: Reoriented cell parameters and index π for 1 and 2 (Table S1); transformed coordinates (Å) of non-hydrogen atoms in asymmetric unit cells for 1 and 2 (Table S2); combined crystallographic data for compounds 1–7 (Table S3); fragment of polymeric wave-like layer with 4,4-net topology in compounds 1–7 (Fig. S1); solid-state PL emission spectra for compounds 4, 5 and 7 (Fig. S2). CCDC 2161673 and 2161674. For ESI and crystallographic data in CIF or other electronic format see DOI: https://doi.org/10.1039/d2ce00444e |
| This journal is © The Royal Society of Chemistry 2022 |


