Solution size variation of linear and dendritic bis-MPA analogs using DOSY-1H NMR†
Oluwapelumi O.
Kareem
a,
Farzin
Rahmani
b,
Jason A.
Hyman
a,
Christopher B.
Keller
a,
Melissa A.
Pasquinelli
 b,
Daniel A.
Savin
 c and
Scott M.
Grayson
 *a
*a
aDepartment of Chemistry, Percival Stern Hall, Tulane University, New Orleans, Louisiana 70118, USA. E-mail: sgrayson@tulane.edu
bDepartment of Forest Biomaterials, Biltmore Hall, North Carolina State University, Raleigh, North Carolina 27695, USA
cDepartment of Chemistry, Leigh Hall, University of Florida, Gainesville, Florida 32611, USA
First published on 17th December 2020
Abstract
Dendrimers are globular, multi-functional, monodisperse macromolecules with perfect structure fidelity. Their architecture is composed of a series of branched polymeric arms, composed within “wedges”, that emanate from a central core. Their structure contains a high density of functional groups located at their periphery, referred to as the “outer shell”. Due to their globular structure, it is assumed that the relative “size” of a dendrimer does not fluctuate greatly between solvents. This may be due to the inability of the branched arms, or wedges, to significantly expand or collapse (comparative to analogous linear polymers) owing to steric barriers from branching, especially at higher generations. In contrast, it is expected that a linear polymer, of similar molecular weight to a dendrimer analog, would have a greater degree of size variation dependent on solvent-polymer interactions. This stems from its innate flexibility and greater conformational flexibility. For this investigation, analogous dendritic and linear bis-MPA polyesters as well as poly(caprolactone) (PCL) were analyzed using size-measuring techniques including gel permeation chromatography (GPC) and diffusion ordered spectroscopy-nuclear magnetic resonance (DOSY-1H NMR).
Introduction
Dendrimers are perfect, globular, monodisperse macromolecules with a highly branched three-dimensional architecture.1,2 These branched “arms” are often divided into wedges that are made up of an AB2-monomer. This bifunctionality allows for growth of the dendrimer through successive iterative steps, increasing functionality exponentially per generation. Each of these growth steps increase branching and are referred to as generations using the [GX] naming scheme (Fig. 1). These iterative steps lead to a well-defined macromolecular structure, and as a result, a higher correlation of structure–property relationships (Đ = 1.0) compared to linear polymers (Đ > 1.0). These aforementioned properties have led to the use of this class of polymeric material as drug delivery vectors, as imaging-contrast agents, as well-defined dendrimer films, as encapsulation agents, and as mass standards for mass analysis techniques such as matrix-assisted laser desorption ionization mass spectrometry (MALDI-ToF MS).1–9 One attractive family of branched polymers that has seen increased interest are those based upon 2,2-bis(hydroxymethyl)propionic acid (bis-MPA). First reported by Hult et al.,10,11 the synthesis of bis-MPA dendritic materials has not only improved, but examples of their utility12,13 have also flourished over the last three decades.1,8–11,14–17 This improved synthesis allows for an unprecedented level of purity, rivaling convergently-grown dendrimers. The increased use of bis-MPA dendritic systems can be attributed to their relatively inexpensive monomer, ease of synthesis, high purity, and biocompatibility due to the presence of their polyester linkages.2,14,16–19 Their utilization by other researchers has led to a growing desire to understand dendritic behavior, especially in solution. The understanding of how dendritic materials (or segments of hybrids) behave in solution has a significant impact on their use in linear-dendritic hybrids for drug delivery or in making discrete polymer films to name a couple of examples.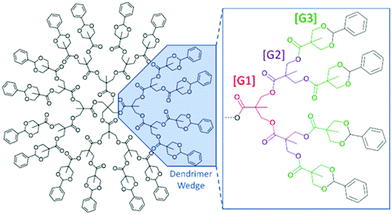 | ||
| Fig. 1 Drawing of a benzylidene-protected pentaerythritol-core [G3] bis-MPA dendrimer (Tetra[G3]Bnz16). | ||
In 1983, de Gennes and Hervert used a self-consistent field model to investigate the relationship between generation limit and spacer length.20 This is one of the earliest studies investigating this relationship as dendrimers were only discovered a few years prior in 1978. They found that every dendrimer has a theoretical growth limit where the polymer cannot be quantitatively functionalized at higher generations. This is driven by the increasing density of functional groups at the periphery and the length of the spacer molecules within each arm, assuming a fully extended structure. Generally, the longer the spacer length between branch points (e.g. poly(propylene imine) (PPI) dendrimers (–(CH2)3– spacer) vs. poly(amido amine) PAMAM dendrimers (–(CH2)2C(O)NH(CH2)2– spacer), the slower the peripheral functional density increases with subsequent functionalization, thus allowing for higher achievable generations. This means the generation limit is driven primarily by monomer (spacer) length but does not consider the effect solvent may have on dendrimer generation limit.
As dendrimer generation increases, each of the dendrimer wedges grow closer together as the rate of increasing dendrimer functional density exceeds the rate of increasing dendrimer volume. As such, there are likely several factors that contribute to the overall size of dendrimers, especially in solution. Backfolding of dendrimers was first highlighted by a kinetic growth model by Lescanec and Muthukumar in 1990.21 Their study suggested that the dendrimer terminal functional groups do not strictly populate the periphery of the dendrimer space, at any generation, but rather are distributed throughout the dendrimer volume.21 Further computational work done by Mansfield and Klushin with PAMAM dendrimers also supports this viewpoint.22 Since these early computational studies, there have been numerous experimental investigations into how dendrimers behave in solution, some with differing results.
One of the earliest experimental studies on dendrimer solution size was conducted by Ihre et al. using pulsed field spin echo proton nuclear magnetic resonance (PGSE-1H NMR) looking at acetyl terminated bis-MPA dendrimers.23 They found that the estimated hydrodynamic radii did increase as generation size increased (from [G1] to [G4]) in chloroform (CHCl3), though this was not strictly linear. Lyulin et al. used small-angle neutron scattering (SANS) in their studies of [G5] and [G8] PAMAM dendrimers (–(CH2)2C(O)NH(CH2)2– spacer) to find that the overall solution size of each dendrimer did not change significantly as solvent quality was reduced. This suggests a relatively “rigid” structure where each of the arms must be restricted in its movement, at least for the [G5] and [G8] size range.24 However, when looking at poly(propylene imine) (PPI or DAB) (–(CH2)3– spacer) dendrimers, Chai et al. found using 2-D nuclear Overhauser effect spectroscopy (NOESY) NMR that the arms of a [G3] sample seem to have increased interaction between the terminal groups and interior methylenes in benzene (poor solvent quality) versus increased interaction between the terminal groups and solvent in CHCl3 (good solvent quality).25 This shows that the apparent size of PPI dendrimers may be impacted by the extent of backfolding depending on the solvent quality, despite still being soluble in a poor quality solvent such as benzene.
The extent of backfolding of dendrimers seems to be dependent on the analytical approach used and the dendritic family studied. Individual dendrimer family investigations are necessary to improve application design where dendrimers may be useful. Additionally, studies that include linear or branched analogs as points of comparison can provide context as to the significance of this backfolding. Unfortunately, this type of work has proven difficult since not all dendrimer families have linear equivalents to conduct such a study. Thus far, most experimental studies of dendrimers have been limited by examination in one or two solvents, or by looking solely at the dendrimer and no additional analog. PAMAM dendrimers are one of the most widely used commercially available dendrimers. However, a linear equivalent for these dendrimers does not yet exist for such a comparison. In contrast, poly(benzyl ether) dendrimers have been compared to other polymeric analogs,26–28 including their linear poly(benzyl ether) variant. These dendrimers have shown they can expand and contract quite readily depending on solvent but not to the same degree as their linear variant.26,27
Dendrimers are of interest since, theoretically, their hydrodynamic size variation or conformational flexibility may be more limited than a linear counterpart. They also have increased solubility across a wider range of solvents than linear polymers.29,30 However, as discussed earlier, the conclusions of previous studies are difficult to rely on when generalized for all other dendrimer families. Therefore, it is more appropriate to study each dendritic system, individually. Additional comparison to a linear analog would provide a clearer picture of how they behave. Though bis-MPA dendrimers have seen increased use, they have not had a true linear equivalent until Kareem et al. recently published a benzoyl-protected bis-MPA linear polyester, poly(3-(benzoyloxy)-2-(bromomethyl)-2-methylpropanoic acid) (PBBM).31 Though a linear bis-MPA polycarbonate has existed for some time,32–36 it is not the best linear analog to traditional bis-MPA dendrimers due to the lack of polyester linkages.31 With the advent of PBBM, it should now be possible to investigate the contribution the branched architecture a dendrimer provides to the overall “rigidness” of a bis-MPA dendrimer. With bis-MPA dendrimers already showing their worth as mass calibrants for MALDI-ToF MS2,8,9,12,19 and now having a true linear analog,31 an apparent size investigation on this dendrimer family would be of great importance.
As such, a study exploring solution size variation of bis-MPA dendrimers was performed. PBBM was used as the linear analog due to its similar atom composition and repeat unit mass (OC(O)C(CH3)(CH2OC(O)C6H5)(CH2Br)) (∼220 Da) to the terminal benzylidene-protected bis-MPA groups (C(O)C(CH3)(CH2O)2CHC6H5) (∼205 Da) at the dendrimer periphery. To provide more context to this investigation, linear poly(caprolactone) (PCL) was included as it is a common homopolyester that has a similar atom composition (C(O)(CH2)5O) and repeat unit mass (∼114 Da) to the bis-MPA subunit of bis-MPA dendrimers (C(O)C(CH3)(CH2)2O2) (∼115 Da). These two linear analogs are good comparative points for evaluating the size variation of these dendrimers. Herein, benzylidene-protected pentaerythritol (tetra)-core [G1–G4] dendrimers, PBBM, and PCL are analyzed using an observed mass versus apparent mass comparison via MALDI-ToF MS and GPC, respectively. Furthermore, diffusion ordered spectroscopy-nuclear magnetic resonance (DOSY-1H NMR) is used to measure diffusion coefficient, and subsequently the hydrodynamic (i.e., van der Waals) radii of each polymer in five deuterated solvents of varying solvent quality: tetrahydrofuran (THF-d8), chloroform (CDCl3), acetone (Ace-d6), dimethyl formamide (DMF-d7), and dimethyl sulfoxide (DMSO-d6). Molecular dynamics simulations were also performed to provide insight into the trends observed by DOSY-1H NMR. Though light scattering would be useful for this comparison, the dendrimers in question simply were too small to discern size changes from the inherent error in the measurement.
Results and discussion
Due to the radial distribution of molecular weight, it is expected that a dendrimer should not only appear smaller than a linear analog of similar mass, but also be more restricted in its apparent size variation. At higher generations, the distance between each dendritic wedge is reduced leading to possible steric strain. To relieve this strain, it is possible that each wedge may backfold or twist out of plane with higher generations exhibiting a more globular conformation. Confirmational flexibility may also be reduced at these higher generations due to the additional molecular rigidity provided by the increased branching complexity as discussed by Vargas-Lara et al.37 Though dendrimers exhibit much higher solubility than linear polymers,1,28,29,38 it is possible that, in lower quality solvents, dendritic wedges may backfold to a more condensed conformation. However, this backfolding should be limited by steric hinderance, rigidity of the dendrimer subunits, branch complexity, and the rotational freedom between branch point just to name a few factors.MALDI-ToF MS observed mass vs. GPC apparent mass
Tetra-core [G1–G4] benzylidene-protected bis-MPA dendrimers were analyzed using MALDI-ToF MS and GPC (Fig. S5–10†). Each generation of tetra-core bis-MPA dendrimer was used as the base point for molecular weight ranges for the linear polymers tested in this study. As a result, PBBM and PCL samples were purified using preparative GPC to isolate molecular weight fractions close to the observed mass (within 10% above [G2]) of a corresponding dendrimer generation (Table 1). These molecular weight (Mn) ranges are henceforth referred to as 1 kDa, 2.2 kDa, 4.8 kDa, and 10 kDa. After isolation, these molecular weight analogs were also analyzed using MALDI-ToF MS and GPC (Fig. 3).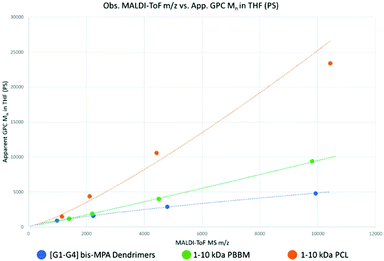 | ||
| Fig. 3 Observed m/z by MALDI-ToF MS versus apparent Mn by GPC (calibrated against PS standards) using the Mn values from Table 1. | ||
| Sample |
M
n![[thin space (1/6-em)]](https://www.rsc.org/images/entities/char_2009.gif)
|
Đ |
M
n![[thin space (1/6-em)]](https://www.rsc.org/images/entities/char_2009.gif)
|
Đ |
|---|---|---|---|---|
| a M n and Đ calculated by MALDI-ToF MS using DCTB with Na+ counterion calibrated against SpheriCal® standards. b M n and Đ calculated by GPC analysis calibrated against poly(styrene) (PS) standards. | ||||
| Tetra[G1]Bnz4 | 975 | 1.00 | 900 | 1.00 |
| Tetra[G2]Bnz8 | 2257 | 1.00 | 1600 | 1.00 |
| Tetra[G3]Bnz16 | 4820 | 1.00 | 2900 | 1.01 |
| Tetra[G4]Bnz32 | 9941 | 1.00 | 4800 | 1.04 |
| 1 kDa PBBM | 1200 | 1.03 | 1200 | 1.05 |
| 2.2 kDa PBBM | 2190 | 1.03 | 1900 | 1.05 |
| 4.8 kDa PBBM | 4830 | 1.01 | 4000 | 1.02 |
| 10 kDa PBBM | 10![[thin space (1/6-em)]](https://www.rsc.org/images/entities/char_2009.gif) 560 560 |
1.01 | 9400 | 1.04 |
| 1 kDa PCL | 1150 | 1.01 | 1500 | 1.03 |
| 2.2 kDa PCL | 2110 | 1.02 | 4400 | 1.08 |
| 4.8 kDa PCL | 4420 | 1.02 | 10![[thin space (1/6-em)]](https://www.rsc.org/images/entities/char_2009.gif) 600 600 |
1.04 |
| 10 kDa PCL | 10![[thin space (1/6-em)]](https://www.rsc.org/images/entities/char_2009.gif) 430 430 |
1.02 | 23![[thin space (1/6-em)]](https://www.rsc.org/images/entities/char_2009.gif) 400 400 |
1.12 |
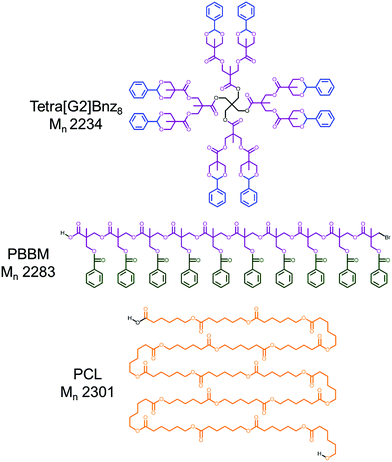
As seen in Table 1 and Fig. 3, despite being of similar molecular weights according to MALDI-ToF MS, bis-MPA dendrimers consistently report lower GPC Mn values in THF than PBBM and PCL. Conceptually, this makes sense since in the case of the [G1–G4] dendrimers, molecular weight is spread out radially rather than linearly. Additionally, the terminal bis-MPA units are protected with benzylidene groups which add significantly to their observed mass (∼115 repeat unit mass vs. terminal unit mass ∼205 Da). PBBM contains a pendant benzoyl group that also adds significant mass to each repeat unit (repeat unit mass ∼220 Da). As a result, Tetra[G4]Bnz32 contains 60 bis-MPA units and an equivalent PBBM chain contains ∼45 bis-MPA units. Removal of these heavy protecting groups results in a molecular weight reduction for the dendrimer of 29% and 48% for PBBM. In contrast, though the PCL unit has a similar atom composition to the bis-MPA repeat unit, it lacks a heavy protecting group. Therefore, at the 10 kDa molecular weight range, PCL contains 87 repeat units compared to the 60 of the [G4] dendrimer. To provide a clearer example, in Fig. 2, Tetra[G2]Bnz8 is drawn along with the nearest molecular weight analog for PCL and PBBM. As shown in Fig. 2, the dendrimer contains twelve bis-MPA units while PBBM and PCL contain ten and twenty repeat units, respectively. These differences increase when looking at higher molecular weights and will be discussed later in this study.
Despite the [G1] dendrimer containing a “core” molecule, it still appears to be very similar in apparent mass to PBBM in THF. This similarity seems to continue even up to 2 kDa when following the trendline fits. Since both contain the same number of bis-MPA units up to this range, the observed overlap is not surprising. 1 kDa PCL also seems to be only marginally larger than the [G1] dendrimer despite having approximately double the number of repeat units. Thus far, it appears that at the 1 kDa range, there is not much difference in the apparent size of these analogs.
However, at the 10 kDa range significant differences can be observed. Despite containing fewer bis-MPA units in this 10 kDa mass range, linear PBBM still has a higher apparent mass by GPC in THF. 10 kDa PCL contains approximately 87 repeat units. Though this is ∼1.5 times as many repeat units as the [G4] dendrimer, this results in an almost five-fold higher apparent mass. At this mass range, linear polymers can appear much larger than dendrimers by GPC even if they have similar molecular weights by MALDI-ToF MS.
To reach the same apparent mass of linear polymers, dendrimers of much higher molecular weights would need to be used. However, this is not feasible, since traditional dendrimers all have a growth limit, as discussed earlier. In this example, the tetra-core bis-MPA dendrimers appear to have a generation limit of [G5]. The differences in apparent mass shown in this preliminary size comparison suggests apparent size variation will be greater for the linear analogs, though more data outside of THF would be needed to confirm this.
DOSY-1H NMR
The previous comparison suggests the dendrimers have a smaller hydrodynamic volume than both linear analogs. However, that experiment was limited to THF as a solvent and does not consider the variations that may occur in other solvents of different polarities. To investigate this, DOSY-1H NMR was used to analyze the selected analog samples in five solvents: THF, CHCl3, acetone, DMF, and DMSO. These five solvents were chosen to balance the range of polarity, the solubility of each polymeric material across the molecular weights analyzed, the boiling point to reduce convection, and the cost effectiveness. Though light scattering would also be useful for this analysis, attempts to measure these analogs confirmed that they were too small to discern hydrodynamic size differences from experimental error.DOSY-1H NMR measures the decay of 1H signal intensity with decreasing gradient strength. This decay was used to calculate a self-diffusion constant (D) using ESI eqn (1)† for each sample. DOSY-1H NMR spectra of each sample in each solvent are shown in Fig. S11–69.† The calculated D values were then used in the Stokes–Einstein equation (ESI eqn (2)†) to calculate the corresponding hydrodynamic radius (Rh). Though these calculations assume an ideal spherical shape for each sample and are not a direct measurement of molecular size, they should still be able to yield good insight into how each polymer is behaving in each solvent. As solvent quality changes for each molecular weight and sample, compounds that are less “rigid” should see greater size variation.
Table 2 shows the calculated D and Rh of each sample in the respective solvent. Additionally, average Rh across all five solvents and calculated variation values are shown in Fig. 4. The variation value was calculated by taking the average of Rh across all five solvents for each sample and molecular weight range and then calculating a variation value of each experiment from this average. These variation values were then averaged to attain the average size variation.
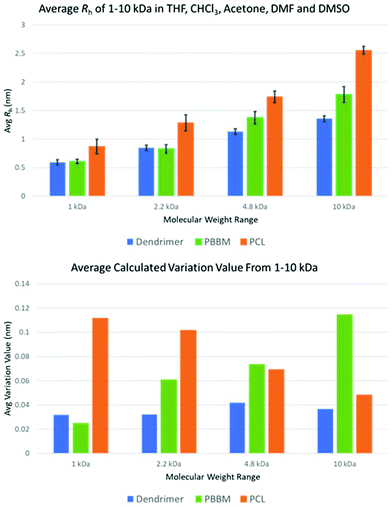 | ||
| Fig. 4 Average Rh and size variation of each polymer across all tested molecular weight ranges using data from DOSY-1H NMR. | ||
| Sample | Solvent | Avg Db (m2 s−1) |
R
h![[thin space (1/6-em)]](https://www.rsc.org/images/entities/char_2009.gif) (nm)
(nm) |
Sample | Solvent | Avg Db (m2 s−1) |
R
h![[thin space (1/6-em)]](https://www.rsc.org/images/entities/char_2009.gif) (nm)
(nm) |
Sample | Solvent | Avg Db (m2 S−1) |
R
h![[thin space (1/6-em)]](https://www.rsc.org/images/entities/char_2009.gif) (nm)
(nm) |
|---|---|---|---|---|---|---|---|---|---|---|---|
| a Each sample was analyzed in duplicate using DOSY-1H NMR at 5 mg ml−1 at 298 K in all five solvents. b Within each DOSY-1H NMR spectrum, D for four separate peaks were calculated using eqn (1). This was done for each of the duplicate spectra. All eight of these calculated D values were then averaged to give the D values shown in the above table. Peaks used for this analysis are shown in Fig. S71–S73.† c R h value was calculated from the average D from two separate runs of each sample using ESI eqn (2).† d 10 kDa PCL was not sufficiently soluble in DMSO at 298 K to complete the experiment. | |||||||||||
| Tetra[G1]Bnz4 | THF | 8.44 × 10⁻¹⁰ | 0.54 ± 0.03 | 1 kDa PBBM | THF | 7.53 × 10⁻¹⁰ | 0.60 ± 0.00 | 1 kDa PCL | THF | 4.45 × 10⁻¹⁰ | 1.02 ± 0.04 |
| CHCl3 | 6.95 × 10⁻¹⁰ | 0.59 ± 0.08 | CHCl3 | 7.20 × 10⁻¹⁰ | 0.56 ± 0.00 | CHCl3 | 5.31 × 10⁻¹⁰ | 0.76 ± 0.06 | |||
| Ace | 1.17 × 10−09 | 0.59 ± 0.05 | Ace | 1.13 × 10−09 | 0.61 ± 0.01 | Ace | 9.49 × 10⁻¹⁰ | 0.74 ± 0.10 | |||
| DMF | 4.80 × 10⁻¹⁰ | 0.57 ± 0.02 | DMF | 4.12 × 10⁻¹⁰ | 0.67 ± 0.01 | DMF | 2.93 × 10⁻¹⁰ | 0.94 ± 0.01 | |||
| DMSO | 1.65 × 10⁻¹⁰ | 0.67 ± 0.03 | DMSO | 1.84 × 10⁻¹⁰ | 0.60 ± 0.02 | DMSO | 1.15 × 10⁻¹⁰ | 0.96 ± 0.03 | |||
| Tetra[G2]Bnz8 | THF | 5.39 × 10⁻¹⁰ | 0.84 ± 0.02 | 2.2 kDa PBBM | THF | 5.36 × 10⁻¹⁰ | 0.85 ± 0.03 | 2.2 kDa PCL | THF | 3.92 × 10⁻¹⁰ | 1.16 ± 0.06 |
| CHCl3 | 5.07 × 10⁻¹⁰ | 0.80 ± 0.07 | CHCl3 | 5.51 × 10⁻¹⁰ | 0.73 ± 0.01 | CHCl3 | 2.67 × 10⁻¹⁰ | 1.51 ± 0.02 | |||
| Ace | 8.46 × 10⁻¹⁰ | 0.82 ± 0.02 | Ace | 8.99 × 10⁻¹⁰ | 0.77 ± 0.08 | Ace | 5.55 × 10⁻¹⁰ | 1.25 ± 0.02 | |||
| DMF | 3.22 × 10⁻¹⁰ | 0.85 ± 0.02 | DMF | 3.12 × 10⁻¹⁰ | 0.88 ± 0.01 | DMF | 2.30 × 10⁻¹⁰ | 1.19 ± 0.00 | |||
| DMSO | 1.20 × 10⁻¹⁰ | 0.92 ± 0.04 | DMSO | 1.21 × 10⁻¹⁰ | 0.91 ± 0.03 | DMSO | 8.40 × 10⁻¹¹ | 1.31 ± 0.05 | |||
| Tetra[G3]Bnz16 | THF | 3.91 × 10⁻¹⁰ | 1.17 ± 0.10 | 4.8 kDa PBBM | THF | 2.98 × 10⁻¹⁰ | 1.53 ± 0.01 | 4.8 kDa PCL | THF | 2.68 × 10⁻¹⁰ | 1.70 ± 0.06 |
| CHCl3 | 3.61 × 10⁻¹⁰ | 1.12 ± 0.04 | CHCl3 | 3.06 × 10⁻¹⁰ | 1.32 ± 0.10 | CHCl3 | 2.12 × 10⁻¹⁰ | 1.90 ± 0.05 | |||
| Ace | 6.34 × 10⁻¹⁰ | 1.09 ± 0.03 | Ace | 5.56 × 10⁻¹⁰ | 1.24 ± 0.01 | Ace | 4.06 × 10⁻¹⁰ | 1.71 ± 0.03 | |||
| DMF | 2.76 × 10⁻¹⁰ | 1.00 ± 0.10 | DMF | 1.96 × 10⁻¹⁰ | 1.40 ± 0.07 | DMF | 1.57 × 10⁻¹⁰ | 1.75 ± 0.05 | |||
| DMSO | 9.21 × 10⁻¹¹ | 1.20 ± 0.02 | DMSO | 8.05 × 10⁻¹¹ | 1.37 ± 0.10 | DMSO | 8.85 × 10⁻¹¹ | 1.25 ± 0.06 | |||
| Tetra[G4]Bnz32 | THF | 3.37 × 10⁻¹⁰ | 1.35 ± 0.01 | 10 kDa PBBM | THF | 2.51 × 10⁻¹⁰ | 1.81 ± 0.08 | 10 kDa PCL | THF | 1.75 × 10⁻¹⁰ | 2.60 ± 0.06 |
| CHCl3 | 2.94 × 10⁻¹⁰ | 1.37 ± 0.09 | CHCl3 | 2.55 × 10⁻¹⁰ | 1.58 ± 0.03 | CHCl3 | 1.55 × 10⁻¹⁰ | 2.61 ± 0.11 | |||
| Ace | 5.44 × 10⁻¹⁰ | 1.28 ± 0.09 | Ace | 3.73 × 10⁻¹⁰ | 1.86 ± 0.08 | Ace | 2.70 × 10⁻¹⁰ | 2.56 ± 0.08 | |||
| DMF | 2.65 × 10⁻¹⁰ | 1.39 ± 0.06 | DMF | 1.47 × 10⁻¹⁰ | 1.87 ± 0.01 | DMF | 1.12 × 10⁻¹⁰ | 2.46 ± 0.04 | |||
| DMSO | 1.98 × 10⁻¹⁰ | 1.40 ± 0.09 | DMSO | 5.67 × 10⁻¹¹ | 1.95 ± 0.05 | DMSOd | — | — | |||
Scaling relationships of size vs. M in varying solvents
The primary goal of this study is to address how solvent quality affects solution size. The discussion will primarily focus on size as a function of solvent for each generation of dendrimer, and corresponding PBBM or PCL analog. As an initial step, it is useful to consider how size scales with molecular weight in various solvents. In general, Rh can be expressed with some scaling relationship such as Rh ∼ Ma where the exponent, a, is the scaling parameter. For linear polymers, a approaches a value of 0.5 or 0.6 for linear polymers in theta solvent or good solvent conditions, respectively. This parameter can also be 1 for rod-like polymers, or 0.33 for globular/spherical particles. Fig. S74† shows log–log plots of Rhvs. M from which an average scaling can be extracted from the slope. It is first observed that the size of linear PBBM is generally the same as the dendrimer for G1 and G2, and larger than the corresponding dendrimer above G2. This difference in size increases with increasing dendrimer generation/corresponding linear molecular weight. This is expected since the dendrimer is expected to have a more compact structure. In terms of the scaling behavior, the dendrimer exhibits a values between 0.32 (DMSO) and 0.40 (THF), consistent with a more globular structure as expected for the dendrimer. In contrast, linear PBBM exhibits a values between 0.48 (DMF) and 0.54 (DMSO), consistent with linear polymers near the theta condition (Table S1†).1 kDa molecular weight range
As seen in the GPC apparent size comparison (Fig. 3), Tetra[G1]Bnz4 and 1 kDa PBBM have similar apparent masses with 1 kDa PCL being slightly larger. This holds true when looking at measurements in THF according to the DOSY-1H NMR data. However, measurements of 1 kDa PCL in other solvents, such as acetone and chloroform, show it may not be significantly different from PBBM or the [G1] dendrimer in these solvents (Fig. 5 and Table 1). On average, 1 kDa PCL has a Rh that is ∼43% (2.6 Å difference) larger than 1 kDa PBBM and ∼47% (2.8 Å difference) larger than the [G1] dendrimer (Fig. 4). Though by GPC, 1 kDa PCL seemed much closer to the other analogs, DOSY-1H NMR reveals there is a larger difference in size variability between PCL and the other analogs even at this weight range.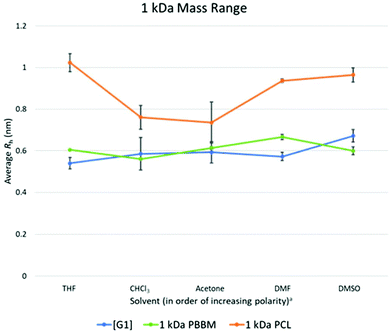 | ||
Fig. 5 Calculated average Rh values, from DOSY-1H NMR, for Tetra[G1]Bnz4, 1 kDa PCL, and 1 kDa PBBM in all tested solvents. a![[thin space (1/6-em)]](https://www.rsc.org/images/entities/char_2009.gif) Solvent polarity values from Reichardt were used to determine order of polarity.39 Solvent polarity values from Reichardt were used to determine order of polarity.39 | ||
When comparing the variation values of the [G1] dendrimer and equivalent PBBM (Fig. 4), it appears that the dendrimer may exhibit slightly more size variation (0.07 Å more). However, this difference is miniscule (less than the length of a carbon–carbon bond) and when looking at Rh calculations they are quite similar (Fig. 4 and 5). This minimal difference between the [G1] dendrimer and 1 kDa PBBM suggests they have similar conformational flexibility. The size variability of 1 kDa PCL on the other hand is much higher than the other analogs (∼4.5 times more than PBBM and ∼3.5 times more than Tetra[G1]Bnz4) (Fig. 4). This may be due to the 1 kDa PCL containing 10 repeat units compared to four bis-MPA units of the [G1] dendrimer and four bis-MPA units of 1 kDa PBBM, thus being larger. The differences here are now at the angstrom scale and may be due to a lack of stabilizing intramolecular interactions of PCL compared to the benzyl rings in PBBM and the dendrimer. Though all three analogs appeared to be similar in our GPC comparison at 1 kDa, differences already exist when looking at multiple solvents though some of these differences are on the sub-Angstrom scale.
2.2 kDa molecular weight range
At the 2.2 kDa range, only PBBM sees an increase in size variability with the PCL decreasing and the dendrimer remaining the same as it was for the 1 kDa range (Fig. 4 and Table 3). It is important to remember the [G2] dendrimer has 12 repeat units, 2.2 kDa PBBM has ∼10 repeat units, and 2.2 kDa PCL has ∼20 repeat units (Fig. 2). Though the [G2] dendrimer has a higher average Rh value than the [G1] as expected, its variation value stays the same. In the case of 2.2 kDa PBBM, there is an expected increase in Rh but unlike the 1 kDa counterpart, its variability is now almost double (∼90% higher) (0.3 Å higher) that of the equivalent [G2] dendrimer. Despite this, the average Rh of the [G2] and 2.2 kDa PBBM appear to be very close, much like it was at the 1 kDa range (Fig. 4). These Rh values seem to be consistent with the GPC data (Fig. 3) where PBBM and the bis-MPA dendrimers appear to be similar in apparent size up to ∼2 kDa. When looking at all 5 solvents, there is a great amount of overlap between the [G2] dendrimer and 2.2 kDa PBBM according to DOSY-1H NMR (Fig. 6). Again, this is likely due to the 2.2 kDa PBBM still having a relatively low number of repeat units. However, the increasing linear nature of PBBM is allowing access to a wider range of conformations and thus increasing its size variability.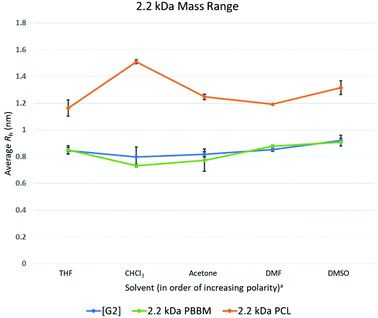 | ||
Fig. 6 Calculated average Rh values, from DOSY-1H NMR, for Tetra[G2]Bnz8, 2.2 kDa PCL, and 2.2 kDa PBBM in all tested solvents. a![[thin space (1/6-em)]](https://www.rsc.org/images/entities/char_2009.gif) Solvent polarity values from Reichardt were used to determine order of polarity.39 Solvent polarity values from Reichardt were used to determine order of polarity.39 | ||
| Sample | Avg Rh![[thin space (1/6-em)]](https://www.rsc.org/images/entities/char_2009.gif) a (nm) a (nm) |
Size fluctuation valueb (Å) |
|---|---|---|
| a Each of the calculated Rh values from each DOSY-1H NMR spectrum was used to calculate the average Rh of each sample across all five tested solvents. b Size variation was calculated by taking the average Rh values and calculating the deviation of each Rh value, in each respective solvent, from the average Rh in all five solvents. These deviations were then averaged to give a size variation value. | ||
| Tetra[G1]Bnz4 | 0.59 ± (0.05) | 0.32 |
| Tetra[G2]Bnz8 | 0.87 ± (0.05) | 0.32 |
| Tetra[G3]Bnz16 | 1.13 ± (0.05) | 0.42 |
| Tetra[G4]Bnz32 | 1.36 ± (0.05) | 0.37 |
| 1 kDa PBBM | 0.61 ± (0.04) | 0.25 |
| 2.2 kDa PBBM | 0.83 ± (0.07) | 0.61 |
| 4.8 kDa PBBM | 1.37 ± (0.11) | 0.73 |
| 10 kDa PBBM | 1.78 ± (0.14) | 1.14 |
| 1 kDa PCL | 0.87 ± (0.13) | 1.11 |
| 2.2 kDa PCL | 1.29 ± (0.14) | 1.01 |
| 4.8 kDa PCL | 1.74 ± (0.10) | 0.69 |
| 10 kDa PCL | 2.56 ± (0.07) | 0.48 |
In the GPC analysis (Fig. 3), 2.2 kDa PCL appears to be significantly larger than the [G2] dendrimer and 2.2 kDa PBBM. This remains consistent in the DOSY-1H NMR data as it is ∼51% larger (4.3 Å larger), on average, than the [G2] dendrimer (Fig. 4). Its variation value is also 1.0 Å which is ∼3 times higher than the [G2]. This is likely due to 2.2 kDa PCL containing ∼20 repeat units. As can be seen in Fig. 6, the apparent size of 2.2 kDa PCL is significantly larger than the other two analogs: a trend that will continue for the rest of this study.
4.8 kDa molecular weight range
At 4.8 kDa, there is again an expected increase in the Rh of all three analogs (Fig. 4 and Table 3). Though Rh of the dendrimer has increased, its size variability remains lower than both linear analogs. In fact, the variation value of the [G3] dendrimer is only 0.1 Å higher than the [G1] dendrimer suggesting a similar level of size stability despite the increasing size of the dendrimer wedges. By comparison, the 4.8 kDa PBBM has a variation value that is 0.5 Å higher than its 1 kDa counterpart. At this mass range, the difference between linear and dendritic bis-MPA analogs can be seen (Fig. 7). The [G3] dendrimer contains 28 bis-MPA units while 4.8 kDa PBBM has ∼21 bis-MPA repeat units. Despite having fewer repeat units, PBBM still has a higher apparent Rh (2.4 Å higher) and higher variation value (0.3 Å higher) than the [G3] dendrimer. However, this size variation difference is still on the sub-angstrom scale, so these differences are still minimal.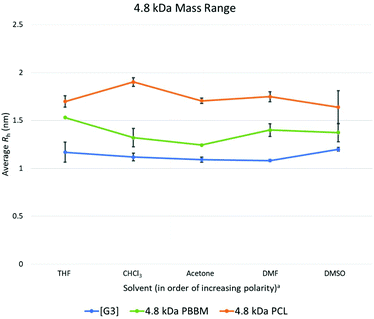 | ||
Fig. 7 Calculated average Rh values, from DOSY-1H NMR, for Tetra[G3]Bnz16, 4.8 kDa PCL, and 4.8 kDa PBBM in all tested solvents. a![[thin space (1/6-em)]](https://www.rsc.org/images/entities/char_2009.gif) Solvent polarity values from Reichardt were used to determine order of polarity.39 Solvent polarity values from Reichardt were used to determine order of polarity.39 | ||
4.8 kDa PCL not only has a larger average Rh (6.1 Å larger) than the [G3] dendrimer, its variation value is also ∼64% higher (higher by 0.28 Å) (Fig. 4). Interestingly, despite being the largest analog thus far, its size variability appears to be lower than it was at both the 1 kDa and 2.2 kDa range. This was unexpected since at this mass range, PCL contains ∼42 repeat units which is 1.5 times the number of repeat units for the [G3] dendrimer despite having similar molecular weights (Table 1). Thus, a higher size variability was expected. However, this may be explained by the introduction of local constraints due to intramolecular chain entanglements or interactions. It should be noted that this trend is in opposition of the PBBM analog. As molecular weight is increasing the PBBM analogs have a growing level of size variability whereas the PCL is becoming more size stable. This trend continues into the 10 kDa range which may suggest a more sphere-like structure than random coil. Despite both materials being linear homopolyesters, their trends in size variability do not mirror each other meaning there are more size influencing factors involved other than just linear vs. branched architecture.
10 kDa molecular weight range
At the 10 kDa range, the [G4] dendrimer contains 60 bis-MPA units, the 10 kDa PBBM contains ∼45 bis-MPA units, and 10 kDa PCL has ∼87 repeat units. An expected increase in the average Rh for the [G4] dendrimer is seen at the 10 kDa range. However, this increase in Rh also seems to lead to a slightly lower variation value (0.04 Å lower) than the [G3] dendrimer. Though the Rh of the [G4] has increased by 1.7 Å over the [G3], its size variability has dropped marginally (Fig. 4 and Table 3). This is somewhat expected as one would assume the larger dendrimer would start to adopt a more “globular” structure especially as it gets closer to its generation limit, approximately [G5]. Though the variability of the PCL is decreasing, the [G4] dendrimer still has a lower variation value (0.1 Å lower) (Fig. 4). The 10 kDa PBBM now has the highest amount of variation out of the three analogs (Fig. 4) with it being 0.4 Å higher than it was in the 4.8 kDa range. Notably, PBBM is behaving more like a linear polymer above ∼2 kDa, mirroring what was expected based upon the GPC comparison (Fig. 3). Though 10 kDa PBBM is smaller than the 10 kDa PCL, it is not as “rigid” (Fig. 8).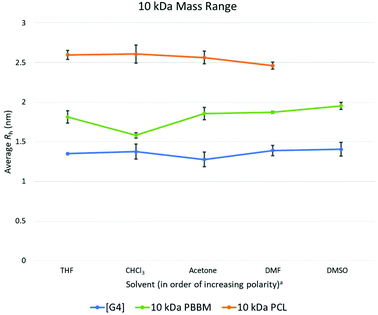 | ||
Fig. 8 Calculated average Rh values, from DOSY-1H NMR, for Tetra[G4]Bnz32, 10 kDa PCL, and 10 kDa PBBM in all tested solvents. a![[thin space (1/6-em)]](https://www.rsc.org/images/entities/char_2009.gif) Solvent polarity values from Reichardt were used to determine order of polarity.39 Solvent polarity values from Reichardt were used to determine order of polarity.39 | ||
Following the same trend from the 2.2 kDa range, 10 kDa PCL has the largest average Rh value across these tested solvents. Its average Rh is 7.8 Å higher than the equivalent PBBM and 12 Å higher than the equivalent [G4] (Fig. 8). Though the 10 kDa PCL is 8.2 Å larger than the 4.8 kDa PCL, another drop in size variability is observed: a reduction of ∼69% (0.2 Å reduction) following the trend starting from the 2.2 kDa range. This again supports the notion of the PCL adopting a more “globular” structure. 10 kDa PCL may not be as size stable as the [G4] dendrimer but its variation value is only 0.1 Å higher. This is much lower than was expected, especially considering that 10 kDa PCL contains ∼27 more repeat units than the [G4] dendrimer.
Size variability comparison of 5 kDa apparent mass range
Though the previous comparisons were based on observed mass by MALDI-ToF MS, it is important to also compare analogs that have similar apparent mass by GPC in THF. When looking at the observed MALDI-ToF mass vs. apparent GPC mass comparison in THF (Table 1 and Fig. 3), the [G4] dendrimer has an apparent mass of ∼5 kDa despite having a nominal mass of 10 kDa. This apparent mass is similar to the apparent mass of 4.8 kDa PBBM and 2.2 kDa PCL in THF. Therefore, it is more appropriate to compare the variation differences of these analogs to one another (Fig. 9). While comparing nominal mass is good, an apparent GPC mass comparison is what is needed to determine if dendrimers are indeed more size stable.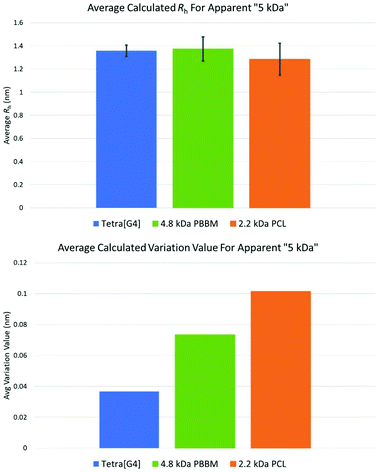 | ||
| Fig. 9 Average Rh and variation values for apparent 5 kDa Tetra[G4]Bnz32, 4.8 kDa PBBM, and 2.2 kDa PCL. | ||
The similarities observed in THF also carry over when looking at the other solvents using DOSY-1H NMR. Despite having ∼39 more bis-MPA units than 4.8 kDa PBBM and ∼40 more repeat units than 2.2 kDa PCL, the [G4] has a similar Rh value to these analogs. Though they are of similar sizes, the fluctuation behavior between these analogs is different. The [G4] dendrimer has a variation value (0.37 Å) that is ∼97% (0.36 Å) less than the 4.8 kDa PBBM (0.73 Å) and ∼172% (0.64 Å) less than the 2.2 kDa PCL (1.01 Å). This supports the notion of dendrimers being globular molecules that have limited size variability compared to linear polymers. However, when comparing the [G4] to its PCL apparent mass analog, 2.2 kDa PCL, the difference is substantially more significant. The observed MALDI mass comparison reveals that PCL must reach a GPC Mn that is ∼five times that of an equivalent bis-MPA dendrimer to exhibit a similar level of size stability. Therefore, the bis-MPA dendrimers are indeed more size stable than both linear analogs when comparing both observed mass and apparent mass, as hypothesized.
Hansen solubility parameter (HSP)
In many of the previous comparisons, the observed differences between the tested analogs are at the sub-Angstrom scale. To provide context to the thermodynamics at play from the DOSY-1H NMR measurements, molecular dynamics simulation was used to determine the differences in solvent quality for each of our analogs across the five tested solvents. This explains and supports the trends in size variability that were observed in the diffusion comparisons.As explained in the computational details section in the ESI,† a series of MD simulations were performed on the 10 kDa analogs to determine their Hansen Solubility Parameters (HSPs). In Table 4, the value of HSP component are shown for the Tetra[G4]Bnz32, 45-mer PBBM, and 87-mer PCL. As seen in this table, the value of the van der Waals and electrostatic components for PCL are 17.31 MPa0.5 and 10.32 MPa0.5, respectively, which closely match the values shown in literature.40 While these results reveal that the δvdW values for all three analogs are similar, the δele values for PBBM and [G4] are significantly higher than the PCL. Therefore, the PBBM and [G4] tend to exhibit greater solvent-polymer interaction in more polar solvents such as DMSO and DMF which is shown in higher Rh values in Table 5.
| 10 kDa analog | Total | δ vdW(MPa0.5) | δ ele(MPa0.5) |
|---|---|---|---|
| Tetra[G4]Bnz32 | 25.35 | 18.22 | 17.63 |
| 45-mer PBBM | 25.51 | 17.86 | 18.22 |
| 87-mer PCL | 20.10 | 17.31 | 10.22 |
| Tetra[G4]Bnz32 | 45-mer PBBM | 87-mer PCL | ||||||
|---|---|---|---|---|---|---|---|---|
| Solventa | R a(A–B) | R h (nm) | Solventa | R a(A–B) | R h (nm) | Solventa | R a(A–B) | R h (nm) |
| a The solvent column for each analog is ordered by increasing Ra(A–B) from top to bottom. b R a(A–B) was determined using MD calculations for each analog and literature values for each solvent. Ra(A–B) was also determined using experimental values for each solvent and that data can be seen in Table S2.† | ||||||||
| DMF | 1.65 | 1.39 | DMF | 1.03 | 1.87 | THF | 1.09 | 2.60 |
| DMSO | 1.72 | 1.40 | DMSO | 1.54 | 1.95 | CHCl3 | 3.86 | 2.61 |
| Ace | 7.45 | 1.28 | Ace | 7.39 | 1.86 | Ace | 4.30 | 2.56 |
| THF | 8.31 | 1.35 | THF | 8.66 | 1.81 | DMF | 7.54 | 2.46 |
| CHCl3 | 11.17 | 1.37 | CHCl3 | 11.73 | 1.58 | DMSO | 9.35 | N/A |
In order to determine solvent quality for each analog, the solubility parameter distance (Ra(A–B)) was determined using eqn (1).
Solubility parameter distance (Ra(A–B) equation:40
 | (1) |
The solubility parameter distance represents the HSP distance from each analog to each solvent. As a result, a smaller Ra(A–B) value means the HSPs are closer and therefore they should have better compatibility. In Table 5, the calculated Ra(A–B) values are given for all solvent-analog combinations. According to the molecular dynamics’ calculations in Table 4, DMF and DMSO are the best solvents for the [G4] dendrimer. This agrees with the DOSY-1H NMR data as those solvents showed the highest average Rh values. Much like the dendrimer, DMF and DMSO appear to be the best solvents for PBBM. This is mirrored in the Rh values and shows very good agreement between Ra(A–B) and the diffusion experiments. Additionally, the Ra(A–B) trends for the dendrimer and PBBM are the same further supporting that PBBM is a good linear analog for these bis-MPA dendrimers. For PCL, good agreement between the Ra(A–B) and Rh trends are observed. However, though it is also a homopolyester, DMF and DMSO do not appear to be good solvents for PCL. Interestingly, the Ra(A–B) trends for PCL are almost opposite to that of PBBM and the dendrimer. This may point to the reason why the size variation trend for PCL was so different from PBBM and the dendrimers. Though some differences in some of the previous comparisons were minimal, the close agreement of Ra(A–B) and Rh trends support many of the aforementioned claims.
Conclusion
The first investigation into the solution size variation of bis-MPA dendrimers and their linear analog, PBBM, has been reported. With the advent of PBBM, it was now possible to evaluate how the branched architecture of bis-MPA dendrimers affects solution size stability. Across the four tested molecular weight ranges, bis-MPA dendrimers exhibited less size variation than the linear analogs except at the 1 kDa mass range with PBBM. However, it is important to note this (0.07 Å) difference at 1 kDa is minimal. According to GPC, despite being of similar mass by MALDI-ToF MS, bis-MPA dendrimers consistently report smaller GPC Mn values. This means the bis-MPA dendrimers are indeed “smaller” than their linear analog, PBBM. This is mirrored in the analysis by DOSY-1H NMR. DOSY-1H NMR also reveals the bis-MPA dendrimers are also more size stable than their observed MALDI-ToF MS mass analogs. When comparing the [G4] dendrimer to its GPC apparent mass analogs, the difference in stability is even more evident.According to this data, bis-MPA dendrimers do exhibit more solution size stability than their direct linear analog, PBBM, and potentially other linear polymers such as PCL given the same apparent mass or nominal mass. Despite all tested analogs being polyesters, there is greater similarity between the bis-MPA dendrimers and PBBM and less so between those and PCL. As shown in the MALDI vs. GPC comparison, the branch complexity of the bis-MPA dendrimers leads to a more size stable structure compared to PBBM. Though these differences exist on the Å scale, it is important to note that Å scale differences on Rh value can have a significant impact on the overall size and shape of a molecule. Additionally, the data here supports the idea of using dendrimers as small apparent mass calibrants for techniques like GPC from 0 up to at least 5 kDa. Though dendrimers cannot practically reach the same apparent size as, and will not replace, linear calibrants (100 kDa to 1 MDa), they do have added benefits such as increased solubility in a wider range of solvents than linear polymers. This means that dendrimers may prove to be good calibrants for apparent size measuring techniques especially when looking at non-linear architectures or switching between solvents. From the results of this study, the branch architecture of the dendrimers has a measurable effect on the size stability of dendrimers when compared to their linear analog.
Conflicts of interest
There are no conflicts of interest to declare.Acknowledgements
The authors thank the support of the American Chemical Society-Petroleum Research Fund (53980-ND7), the National Science Foundation-MSN (1807358) and the National Science Foundation-MRI for the MALDI-ToF MS. O.O.K. thanks the Louisiana Board of Regents and Southern Regional Education Board for his graduate fellowship.References
- A. W. Bosman, H. M. Janssen and E. W. Meijer, About Dendrimers: Structure, Physical Properties, and Applications, Chem. Rev., 1999, 99, 1665–1688 CrossRef CAS.
- S. García-Gallego, A. M. Nyström and M. Malkoch, Chemistry of multifunctional polymers based on bis-MPA and their cutting-edge applications, Prog. Polym. Sci., 2015, 48, 85–110 CrossRef.
- M. Sowinska and Z. Urbanczyk-Lipkowska, Advances in the chemistry of dendrimers, New J. Chem., 2014, 38, 2168–2203 RSC.
- M. D. Giles, S. Liu, R. L. Emanuel, B. C. Gibb and S. M. Grayson, Dendronized supramolecular nanocapsules: pH independent, water-soluble, deep-cavity cavitands assemble via the hydrophobic effect, J. Am. Chem. Soc., 2008, 130, 14430–14431 CrossRef CAS.
- L. P. Mendes, J. Pan and V. P. Torchilin, Dendrimers as nanocarriers for nucleic acid and drug delivery in cancer therapy, Molecules, 2017, 22, 1–21 Search PubMed.
- J. F. G. A. Jansen, E. M. M. de Brabander-van den Berg and E. W. Meijer, Encapsulation of Guest Molecules into a Dendritic Box, Science, 1994, 266, 1226–1229 CrossRef CAS.
- M. Calderón, M. A. Quadir, M. Strumia and R. Haag, Functional dendritic polymer architectures as stimuli-responsive nanocarriers, Biochimie, 2010, 92, 1242–1251 CrossRef.
- S. M. Grayson, B. K. Myers, J. Bengtsson and M. Malkoch, Advantages of Monodisperse and Chemically Robust “SpheriCal” Polyester Dendrimers as a “Universal” MS Calibrant, J. Am. Soc. Mass Spectrom., 2014, 25, 303–309 CrossRef CAS.
- B. K. Casey and S. M. Grayson, The potential of amine-containing dendrimer mass standards for internal calibration of peptides, Eur. J. Mass Spectrom., 2015, 21, 747–752 CrossRef CAS.
- A. Hult, E. Malmström, M. Johansson and K. Sörensen, United States Patent Office, 5418301, 1995 Search PubMed.
- A. Hult, E. Malmström and K. Sörensen, World Intellectual Property Organization, WO 93/17060, 1993 Search PubMed.
- J. A. Giesen, B. J. Diament and S. M. Grayson, Iodine-Containing Mass-Defect-Tuned Dendrimers for Use as Internal Mass Spectrometry Calibrants, J. Am. Soc. Mass Spectrom., 2018, 29, 490–500 CrossRef CAS.
- R. Vestberg, M. Malkoch, M. Kade, P. Wu, V. V. Fokin, K. B. Sharpless, E. Drockenmuller and C. J. Hawker, Role of architecture and molecular weight in the formation of tailor-made ultrathin multilayers using dendritic macromolecules and click chemistry, J. Polym. Sci., Part A: Polym. Chem., 2007, 45, 2835–2846 CrossRef CAS.
- P. Stenström, O. Andrén and M. Malkoch, Fluoride-Promoted Esterification (FPE) Chemistry: A Robust Route to Bis-MPA Dendrons and Their Postfunctionalization, Molecules, 2016, 21, 366 CrossRef.
- M. V. Walter and M. Malkoch, Simplifying the synthesis of dendrimers: accelerated approaches, Chem. Soc. Rev., 2012, 41, 4593 RSC.
- M. Malkoch, E. Malmström and A. Hult, Rapid and Efficient Synthesis of Aliphatic Ester Dendrons and Dendrimers, Macromolecules, 2002, 35, 8307–8314 CrossRef CAS.
- M. Malkoch, R. J. Thibault, E. Drockenmuller, M. Messerschmidt, B. Voit, T. P. Russell and C. J. Hawker, Orthogonal approaches to the simultaneous and cascade functionalization of macromolecules using click chemistry, J. Am. Chem. Soc., 2005, 127, 14942–14949 CrossRef CAS.
- A. Carlmark, C. Hawker, A. Hult and M. Malkoch, New methodologies in the construction of dendritic materials, Chem. Soc. Rev., 2009, 38, 352–362 RSC.
- A. Carlmark, E. Malmström and M. Malkoch, Dendritic architectures based on bis-MPA: functional polymeric scaffolds for application-driven research, Chem. Soc. Rev., 2013, 42, 5858 RSC.
- P. G. de Gennes and H. Hervet, Statistics of ‘starburst’ polymers, J. Phys., Lett., 1983, 44, 351–360 CrossRef CAS.
- R. L. Lescanec and M. Muthukumar, Configurational Characteristics and Scaling Behavior of Starburst Molecules: A Computational Study, Macromolecules, 1990, 23, 2280–2288 CrossRef CAS.
- M. L. Mansfield and L. I. Klushin, Intrinsic viscosity of model Starburst dendrimers, J. Phys. Chem., 1992, 96, 3994–3998 CrossRef CAS.
- H. Ihre, A. Hult and E. Söderlind, Synthesis, Characterization, and 1H NMR Self-Diffusion Studies of Dendritic Aliphatic Polyesters Based on 2,2-Bis(hydroxymethyl)propionic Acid and 1,1,1-Tris(hydroxyphenyl)ethane, J. Am. Chem. Soc., 1996, 118, 6388–6395 CrossRef CAS.
- S. V. Lyulin, L. J. Evers, P. Van Der Schoot, A. A. Darinskii, A. V. Lyulin and M. A. J. Michels, Effect of Solvent Quality and Electrostatic Interactions on Size and Structure of Dendrimers. Brownian Dynamics Simulation and Mean-Field Theory, Macromolecules, 2004, 37, 3049–3063 CrossRef CAS.
- M. Chai, Y. Niu, W. J. Youngs and P. L. Rinaldi, Structure and conformation of DAB dendrimers in solution via multidimensional NMR techniques, J. Am. Chem. Soc., 2001, 123, 4670–4678 CrossRef CAS.
- M. Jeong, M. E. Mackay, R. Vestberg and C. J. Hawker, Intrinsic Viscosity Variation in Different Solvents for Dendrimers and Their Hybrid Copolymers with Linear Polymers, Macromolecules, 2001, 34, 4927–4936 CrossRef CAS.
- T. H. Mourey, S. R. Turner, M. Rubinstein, J. M. J. Fréchet, C. J. Hawker and K. L. Wooley, Unique Behavior of Dendritic Macromolecules: Intrinsic Viscosity of Polyether Dendrimers, Macromolecules, 1992, 25, 2401–2406 CrossRef CAS.
- J. M. J. Fréchet, Dendrimers and supramolecular chemistry, Proc. Natl. Acad. Sci. U. S. A., 2002, 99, 4782–4787 CrossRef.
- J. M. J. Fréchet, Functional polymers and dendrimers: reactivity, molecular architecture, and interfacial energy, Science, 1994, 263, 1710–1715 CrossRef.
- A. Topp, B. J. Bauer, D. A. Tomalia and E. J. Amis, Effect of Solvent Quality on the Molecular Dimensions of PAMAM Dendrimers, Macromolecules, 1999, 32, 7232–7237 CrossRef CAS.
- O. O. Kareem, S. P. Daymon, C. B. Keller, B. Chen, S. Nazarenko and S. M. Grayson, Synthesis and Characterization of Linear, Homopolyester, Benzoyl-Protected Bis-MPA, Macromolecules, 2020, 53, 6608–6618 CrossRef CAS.
- T. F. Al-Azemi and K. S. Bisht, One-step synthesis of polycarbonates bearing pendant carboxyl groups by lipase-catalyzed ring-opening polymerization, J. Polym. Sci., Part A: Polym. Chem., 2002, 40, 1267–1274 CrossRef CAS.
- J. Jaworska, M. Kawalec, M. Pastusiak, K. Reczynska, H. Janeczek, K. Lewicka, E. Pamula and P. Dobrzynski, Biodegradable polycarbonates containing side carboxyl groups—synthesis, properties, and degradation study, J. Polym. Sci., Part A: Polym. Chem., 2017, 55, 2756–2769 CrossRef CAS.
- T. F. Al-Azemi and K. S. Bisht, Novel Functional Polycarbonate by Lipase-Catalyzed Ring-Opening Polymerization of 5-Methyl-5-benzyloxycarbonyl-1,3-dioxan-2-one, Macromolecules, 1999, 32, 6536–6540 CrossRef CAS.
- J. V. Olsson, D. Hult, Y. Cai, S. García-Gallego and M. Malkoch, Reactive imidazole intermediates: Simplified synthetic approach to functional aliphatic cyclic carbonates, Polym. Chem., 2014, 5, 6651–6655 RSC.
- S. Tempelaar, L. Mespouille, P. Dubois and A. P. Dove, Organocatalytic Synthesis and Postpolymerization Functionalization of Allyl-Functional Polycarbonates, Macromolecules, 2011, 44, 2084–2091 CrossRef CAS.
- F. Vargas-Lara, B. A. Pazmiño Betancourt and J. F. Douglas, Communication: A comparison between the solution properties of knotted ring and star polymers, J. Chem. Phys., 2018, 149, 161101 CrossRef.
- D. C. Tully and J. M. J. Fréchet, Dendrimers at surfaces and interfaces: chemistry and applications, Chem. Commun., 2001, 2, 1229–1239 RSC.
- C. Reichardt, Solvents and Solvent Effects in Organic Chemistry, Wiley-VCH VErlag GmbH & Co. KGaA, 3rd edn, 2003 Search PubMed.
- C. Bordes, V. Fréville, E. Ruffin, P. Marote, J. Y. Gauvrit, S. Briançon and P. Lantéri, Determination of poly(ε-caprolactone) solubility parameters: Application to solvent substitution in a microencapsulation process, Int. J. Pharm., 2010, 383, 236–243 CrossRef CAS.
Footnote |
| † Electronic supplementary information (ESI) available: Experimental materials, methods, and characterization data of bis-MPA dendrimers, PBBM, and PCL. See DOI: 10.1039/d0py01070g |
| This journal is © The Royal Society of Chemistry 2021 |

