 Open Access Article
Creative Commons Attribution 3.0 Unported Licence
Multiplexed single-cell in situ RNA analysis by reiterative hybridization†
Lu
Xiao
and
Jia
Guo
*
Department of Chemistry and Biochemistry & Biodesign Institute, Arizona State University, Tempe, Arizona 85287, USA. E-mail: jiaguo@asu.edu; Fax: +1-480-965-2747; Tel: +1-480-727-2096
First published on 29th April 2015
Abstract
Most current approaches for quantification of RNA species in their natural spatial contexts in single cells are limited by a small number of parallel analyses. Here we report a strategy to dramatically increase the multiplexing capacity for RNA analysis in single cells in situ. In this method, transcripts are detected by fluorescence in situ hybridization (FISH). After imaging and data storage, the fluorescence signal is efficiently removed by photobleaching. This enables the reinitiation of FISH to detect other RNA species in the same cell. Through reiterative cycles of hybridization, imaging and photobleaching, the identities, positions and copy numbers of a large number of varied RNA species can be quantified in individual cells in situ. Using this approach, we analyzed seven different transcripts in single HeLa cells with five reiterative RNA FISH cycles. This approach has the potential to detect over 100 varied RNA species in single cells in situ, which will have wide applications in studies of systems biology, molecular diagnosis and targeted therapies.
Introduction
Understanding how cellular regulatory networks function in normal cells and malfunction in diseased cells is an important goal of post-genomic research.1 Microarray technologies2 and high-throughput sequencing3–6 have been widely used to infer the function of genes or to detect altered expression patterns in diseased cells by RNA profiling on a genome-wide scale. However, these approaches carried out with extracted and purified RNA mask the spatial information of transcripts. Imaging-based methods, such as molecular beacons7,8 and fluorescence in situ hybridization (FISH),9 enable the RNA analysis in their natural spatial contexts. Nonetheless, due to the spectral overlap of small organic fluorophores, these approaches are limited by the small number of parallel analyses.To integrate the advantages of high-throughput technologies and in situ analysis methods, combinatorial labeling,10–12 sequential barcoding13 and in situ sequencing,14,15 have been explored recently. Although these approaches significantly advanced our ability to study gene expression in situ, some non-ideal factors still exist. For example, the multiplexing capacities of combinatorial labeling and sequential barcoding need to be further enhanced to allow the transcriptome-wide analysis; the current in situ sequencing technologies may miss transcripts with lower copy numbers.
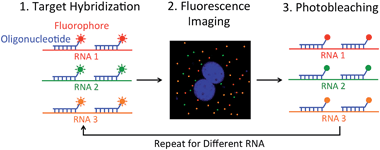
We report here an alternative multiplexed single-cell in situ RNA analysis approach by reiterative hybridization. In this method, fluorescently labeled oligonucleotides are hybridized with their target RNA. Under a fluorescence microscope, each RNA molecule is visualized as a single spot. By counting the number of spots in single cells, we can quantify the abundances of the target RNA species in their natural spatial contexts. After fluorescence imaging and data storage, the fluorescence signals are efficiently removed by photobleaching. In the next cycle, different oligonucleotides labeled with the same set of fluorophores as the ones used in the first cycle are added to the sample to quantify their target RNA. Upon reiterative cycles of target hybridization, fluorescence imaging and photobleaching, a comprehensive in situ RNA profiling can be achieved in single cells (Fig. 1). Using this multicolor and multicycle approach, we successfully detected seven different RNA species in single HeLa cells in situ with five reiterative RNA FISH cycles.
Experimental
Chemicals and bioreagents
Chemicals and solvents were purchased from Sigma-Aldrich or Ambion and were used directly without further purification, unless otherwise noted. Bioreagents were purchased from Invitrogen, unless otherwise indicated.Preparation of fluorescently labeled oligonucleotide probes
Oligonucleotides belonging to one library (BioSearch), each at a scale of 25 pmol, was dissolved in 1 μL of nuclease-free water. To this solution was added sodium bicarbonate aqueous solution (1 M, 3 μL) and Quasar 570 (BioSearch) or Cy5 (AAT Bioquest) in DMF (20 mM, 5 μL). The mixture was then diluted to a volume of 10 μL with nuclease-free water and incubated at room temperature for 2 h. Subsequently, the fluorescently labeled oligonucleotides were purified by using a nucleotide removal kit (Qiagen) and dried in a Savant SpeedVac Concentrator (Thermo Scientific).The dried fluorophore conjugated oligonucleotides were then further purified via an HPLC (Agilent) equipped with a C18 column (Agilent) and a dual wavelength detector set to detect DNA absorption (260 nm) as well as the absorption of the coupled fluorophore (548 nm for Quasar 570, 650 nm for Cy5). For the gradient, triethyl ammonium acetate (Buffer A) (0.1 M, pH 6.5) and acetonitrile (Buffer B) (pH 6.5) were used, ranging from 7% to 30% Buffer B over the course of 30 min, then at 70% Buffer B for 10 min followed by 7% Buffer B for another 10 min, all at a flow rate of 1 mL min−1. The collected fraction was subsequently dried in a Savant SpeedVac Concentrator and stored as the stock probe solution at 4 °C in 200 μL nuclease-free water to which 1× Tris EDTA (TE) (2 μL, pH 8.0) was added.
Cell culture
HeLa CCL-2 cells (ATCC) were maintained in Dulbecco's modified Eagle's Medium (DMEM) supplemented with 10% fetal bovine serum, 10 U mL−1 penicillin and 100 g mL−1 streptomycin in a humidified atmosphere at 37 °C with 5% CO2. Cells were plated on chambered coverglass (Thermo Scientific) and allowed to reach 60% confluency in 1–2 days.Cell fixation
Cultured HeLa CCL-2 cells were washed with 1× PBS at room temperature for 5 min, fixed with fixation solution (4% formaldehyde (Polysciences) in 1× PBS) at room temperature for 10 min, and subsequently washed another 2 times with 1× PBS at room temperature, each for 5 min. The fixed cells were then permeabilized with 70% (v/v) EtOH at 4 °C at least overnight.Fluorescence signal removal efficiency
To 100 μL of hybridization buffer (100 mg mL−1 dextran sulfate, 1 mg mL−1Escherichia coli tRNA, 2 mM vanadyl ribonucleoside complex, 20 μg mL−1 bovine serum albumin and 10% formamide in 2× SSC) was added 2 μL of the Quasar 570 labeled BRCA1 or Cy5 labeled TOP1 stock probe solution. Then the mixture was vortexed and centrifuged to obtain the hybridization solution.Fixed HeLa CCL-2 cells were first washed once with wash buffer (10% formamide in 2× SSC) for 5 min, then incubated with the hybridization solution at 37 °C overnight, and subsequently washed 3 times with wash buffer, each for 30 min, at 37 °C. After incubating with GLOX buffer (0.4% glucose and 10 mM Tris HCl in 2× SSC) for 1–2 min, the stained cells were imaged in GLOX solution (0.37 mg mL−1 glucose oxidase and 1% catalase in GLOX buffer). After imaging, each target cell in 1× PBS was photobleached individually with the Quasar 570 filter for 20 s or the Cy5 filter for 5 s at each z step. 1× PBS was changed every 3 min during photobleaching to remove the radicals. Following photobleaching, the HeLa cells were imaged again in GLOX solution.
Effects of photobleaching on subsequent cycles
Fixed HeLa CCL-2 cells in 1× PBS were first photobleached with the Quasar 570 or Cy5 filter for 2 h, with changing 1× PBS solution every 3 min. Subsequently, after washing with wash buffer for 5 min, the cells were incubated with the BRCA1 or TOP1 hybridization solution at 37 °C for overnight, and subsequently washed 3 times with wash buffer, each for 30 min, at 37 °C. After incubating with GLOX buffer (without enzyme) for 1–2 min, the stained cells were imaged in GLOX solution. Control experiments were carried out using the same protocol without photobleaching steps before the hybridization of BRCA1 or TOP1 probes.Reiterative RNA FISH
Fixed HeLa CCL-2 cells were first washed once with wash buffer for 5 min, then incubated with the hybridization solution at 37 °C overnight, and subsequently washed 3 times with wash buffer, each for 30 min, at 37 °C. After incubating with GLOX buffer (without enzyme) for 1–2 min, the stained cells were imaged in GLOX solution. After imaging, each cell in 1× PBS was photobleached individually with the Quasar 570 filter for 20 s or the Cy5 filter for 5 s at each z step, followed by the next cycle of RNA FISH. 1× PBS was changed every 3 min during photobleaching to remove the radicals.Imaging and data analysis
Stained cells were imaged under a Nikon Ti-E epifluorescence microscope equipped with a 100× objective, using a 5 μm z range and 0.3 μm z spacing. Images were captured using a CoolSNAP HQ2 camera and NIS-Elements Imaging software. Chroma filters 49004 and 49009 were used for Quasar 570 and Cy5, respectively. Fluorescent spots were identified computationally using an image processing program.9Results and discussion
Design and synthesis of RNA FISH probes
To assess the feasibility of this reiterative hybridization approach, a panel of seven libraries of fluorescently labeled probes was designed and synthesized. These probes target mRNA breast cancer 2 (BRCA2), topoisomerase I (TOP1), breast cancer 1 (BRCA1), polymerase II polypeptide A (POLR2A), PR domain containing 4 (PRDM4), glyceraldehyde-3-phosphate dehydrogenase (GAPDH) and actin beta (ACTB), which are expressed at different levels in HeLa cells, ranging from 10 to 1000 copies per cell. Each library of probes is composed of about 48 20mer oligonucleotides complementary to the coding sequences of their target mRNA. These amino-modified oligonucleotides belonging to one library were combined and coupled to succinimidyl ester functionalized fluorophore Quasar 570 or Cy5. After coupling, the fluorescently labeled probes were purified by high-performance liquid chromatography (HPLC) (Fig. 2). The peaks appearing in both the 260 nm and the fluorophore absorbance channels correspond to the coupling products. These results indicate that the fluorophores were successfully coupled to the libraries of oligonucleotides, which can be applied as RNA FISH probes.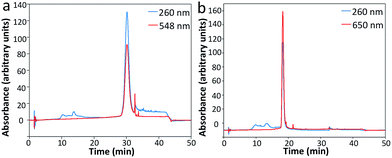 | ||
| Fig. 2 Sample HPLC chromatographs of (a) Quasar 570 and (b) Cy5 coupled oligonucleotides as RNA FISH probes. | ||
Fluorescence signal removal efficiency
One requirement critical for this reiterative hybridization approach is to efficiently remove fluorescence signals at the end of each RNA FISH cycle. Consequently, the fluorescence leftover in previous cycles will not lead to false positive signals in the subsequent cycles. Due to its high signal removal efficiency, photobleaching has been explored for multiplexed immunofluorescence.16 To test the possibility of applying photobleaching for reiterative RNA FISH, we stained mRNA BRCA1 and TOP1 with Quasar 570 and Cy5 labeled probes, respectively. Upon hybridization, individual transcripts were visualized under a fluorescence microscope as diffraction-limited spots (Fig. 3a and b). To minimize the photobleaching effects during image acquisition, the cells were imaged in an antifade buffer containing glucose and glucose oxidase; while to maximize the photobleaching efficiency, the samples were photobleached in 1× phosphate buffered saline (PBS). After photobleaching, almost all the fluorescence signals were removed (Fig. 3c and d). We quantified the photobleaching efficiency by analyzing the fluorescence intensities of 30 spots before and after photobleaching. The ON/OFF ratios for Quasar 570 and Cy5 labeled probes are over 12![[thin space (1/6-em)]](https://www.rsc.org/images/entities/char_2009.gif) :
:![[thin space (1/6-em)]](https://www.rsc.org/images/entities/char_2009.gif) 1 (Fig. 3e) (P < 0.001). Due to the theoretical hybridization efficiency of 75%,12 mRNA secondary structures, proteins bound to mRNA, among other factors, individual mRNA molecules are hybridized with varied numbers of fluorescently labelled oligonucleotides. This leads to the spot intensity variations in Fig. 3e. We also counted the number of fluorescent spots in 30 cells before and after photobleaching. Upon hybridization, about 20 BRCA1 and 60 TOP1 transcripts per cell were observed. After photobleaching, almost no spots were observed (Fig. 3f) (P < 0.0001). These results indicate that the fluorescence signals generated by hybridization of RNA FISH probes can be efficiently erased by photobleaching, and the minimum leftover signal will not interfere with the subsequent cycles.
1 (Fig. 3e) (P < 0.001). Due to the theoretical hybridization efficiency of 75%,12 mRNA secondary structures, proteins bound to mRNA, among other factors, individual mRNA molecules are hybridized with varied numbers of fluorescently labelled oligonucleotides. This leads to the spot intensity variations in Fig. 3e. We also counted the number of fluorescent spots in 30 cells before and after photobleaching. Upon hybridization, about 20 BRCA1 and 60 TOP1 transcripts per cell were observed. After photobleaching, almost no spots were observed (Fig. 3f) (P < 0.0001). These results indicate that the fluorescence signals generated by hybridization of RNA FISH probes can be efficiently erased by photobleaching, and the minimum leftover signal will not interfere with the subsequent cycles.
Effects of photobleaching on subsequent cycles
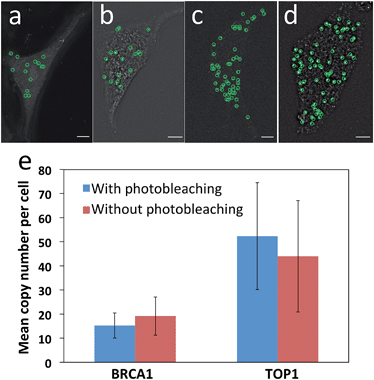
Another requirement for this reiterative hybridization approach is to maintain the integrity of the specimen exposed to extensive photobleaching. To achieve that, we washed the sample every three minutes during photobleaching to remove the radicals generated from degradation of the fluorophores. We assessed the effects of photobleaching on subsequent cycles by comparing the mRNA expression levels and patterns with and without photobleaching before hybridization of RNA FISH probes. After photobleaching with the Quasar 570 filter for two hours, the expression pattern (Fig. 4a) closely resembles the one without photobleaching (Fig. 4b). Under both conditions, the copy numbers of BRCA1 transcripts per cell are similar (Fig. 4e). For cells exposed to photobleaching with the Cy5 filter for two hours, the TOP1 expression patterns (Fig. 4c) and levels (Fig. 4e) also closely resemble those without photobleaching (Fig. 4d and e). These results suggest that the photobleaching process does not compromise the accuracy of the RNA FISH analysis in subsequent cycles.Multiplexed single-cell in situ RNA analysis
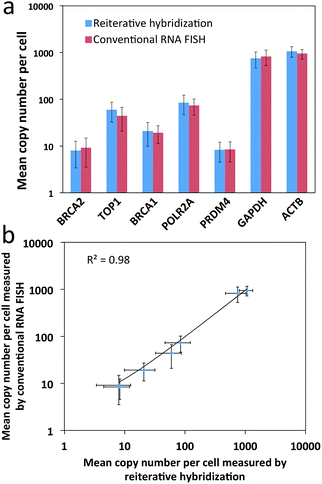
To evaluate the feasibility of our reiterative hybridization approach for multicolor and multicycle RNA detection, we profiled seven different transcripts in single HeLa cells. In the first RNA FISH cycle, BRCA2 (Fig. 5a) and TOP1 (Fig. 5b) transcripts were hybridized with oligonucleotide probes labeled with Quasar 570 and Cy5, respectively. Following fluorescence imaging and data storage, the two fluorophores were efficiently photobleached. This enables the initiation of the second cycle, in which BRCA1 (Fig. 5c) and POLR2A (Fig. 5d) mRNA were stained with Quasar 570 and Cy5 labeled probes. To demonstrate the multicycle potential of this approach, in the subsequent cycles we quantified one transcript per cycle using only Cy5 labeled probes. Upon continuous cycles of target hybridization, fluorescence imaging, and photobleaching, PRDM4 (Fig. 5e), GAPDH (Fig. 5f) and ACTB (Fig. 5g) were unambiguously detected. The distribution patterns of transcripts obtained by this reiterative hybridization approach are similar to those in conventional one-cycle RNA FISH (Fig. 5h–n). To assess the accuracy of our approach, we compared the mean copy numbers of transcripts per cell measured by reiterative hybridization and conventional RNA FISH. For the seven mRNA species with average copy numbers ranging from 10 to 1000 copies per cell, the results obtained using the two methods are consistent with those in the literature17 and closely resemble each other (Fig. 6a), with an R2 value of 0.98 (Fig. 6b). These results indicate this reiterative hybridization approach enables accurate multiplexed RNA profiling in situ by multicolor and multicycle staining.Expression heterogeneity and correlation
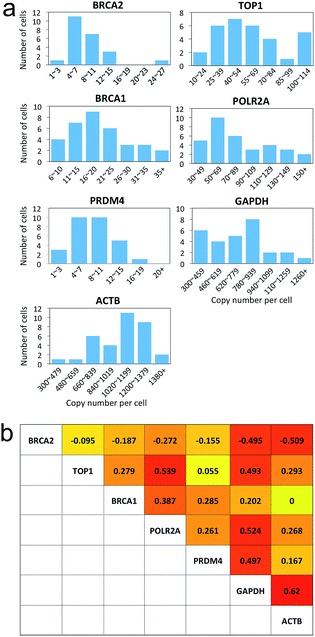
Many experiments show that genetically identical cells can exhibit significant cell-to-cell variations in gene expression.18–25 By enabling comprehensive RNA profiling in single cells, our reiterative hybridization approach can be applied to investigate gene expression heterogeneity. As shown in Fig. 7a, the copy numbers of transcripts per cell are distributed in a wide range. This significant variation in gene expression leads to the relatively large error bars in Fig. 3f, 4e, 6a and b. For all the seven mRNA species, the square of the expression standard deviation is much higher than the mean copy numbers. These results indicate that these mRNA species are synthesized by transcriptional bursts rather than at a constant rate.23 With the single-cell resolution, our approach also allows the investigation of whether the transcriptional bursts of different genes are coordinated. By correlating RNA expression levels pairwise (Fig. S1†), we found correlation coefficients ranging from −0.51 to 0.62 (Fig. 7b), suggesting the heterogeneous coordination of transcriptional bursts.Conclusions
In summary, we have demonstrated that our reiterative hybridization approach can be applied for multiplexed single-cell in situ RNA analysis at the optical resolution. Compared with existing RNA profiling methods, our approach has the following advantages. By directly imaging transcripts in situ, this technique preserves the spatial information of RNA in different cells in a structured tissue. This makes our approach a powerful tool to study cell–cell communications in heterogeneous biological systems. Additionally, this method avoids the intrinsic bias generated during cDNA synthesis or target sequence amplification, which enhances the accuracy to quantify transcripts with low copy numbers. Finally, using oligonucleotide probes labeled with the same fluorophore rather than multiple different fluorophores to stain each RNA molecule, our approach allows the detection of short transcripts.The number of different RNA species that can be quantified in individual cells depends on two factors: the number of RNA FISH cycles and the number of RNA species detected in each cycle. To remove fluorescence signals efficiently, it takes about 6 and 1.5 minutes to photobleach Quasar 570 and Cy5, respectively. And we have shown that after photobleaching for 2 hours, transcripts can still be accurately quantified in subsequent RNA FISH cycles. This suggests that we can further increase the number of RNA FISH cycles significantly. Moreover, by integration with combinational labeling10–12 or multispectral fluorophores,26–28 a much larger number of different RNA species can be quantified in each RNA FISH cycle. Therefore, we envision that this reiterative hybridization approach has the potential to detect more than 100 varied RNA species in single cells in situ. That will bring new insights into systems biology, signaling pathway studies, molecular diagnosis and targeted therapies.
Acknowledgements
This work is supported by grants from Arizona State University.Notes and references
- F. S. Collins, E. D. Green, A. E. Guttmacher and M. S. Guyer, Nature, 2003, 422, 835–847 CrossRef CAS PubMed.
- J. D. Hoheisel, Nat. Rev. Genet., 2006, 7, 200–210 CAS.
- M. L. Metzker, Nat. Rev. Genet., 2010, 11, 31–46 CrossRef CAS PubMed.
- J. Guo, L. Yu, N. J. Turro and J. Ju, Acc. Chem. Res., 2010, 43, 551–563 CrossRef CAS PubMed.
- J. Guo, N. Xu, Z. Li, S. Zhang, J. Wu, D. H. Kim, M. S. Marma, N. J. Turro and J. Ju, Proc. Natl. Acad. Sci. U. S. A., 2008, 105, 9145–9150 CrossRef CAS PubMed.
- P. A. Sims, W. J. Greenleaf, H. Duan and X. S. Xie, Nat. Methods, 2011, 8, 575–880 CrossRef CAS PubMed.
- K. Huang and A. A. Martí, Anal. Bioanal. Chem., 2012, 402, 3091–3102 CrossRef CAS PubMed.
- J. Guo, J. Ju and N. J. Turro, Anal. Bioanal. Chem., 2012, 402, 3115–3125 CrossRef CAS PubMed.
- A. Raj, P. Van Den Bogaard, S. A. Rifkin, A. Van Oudenaarden and S. Tyagi, Nat. Methods, 2008, 5, 877–879 CrossRef CAS PubMed.
- J. M. Levsky, S. M. Shenoy, R. C. Pezo and R. H. Singer, Science, 2002, 297, 836–840 CrossRef CAS PubMed.
- M. J. Levesque and A. Raj, Nat. Methods, 2013, 10, 246–248 CrossRef CAS PubMed.
- E. Lubeck and L. Cai, Nat. Methods, 2012, 9, 743–748 CrossRef CAS PubMed.
- E. Lubeck, A. F. Coskun, T. Zhiyentayev, M. Ahmad and L. Cai, Nat. Methods, 2014, 11, 360–361 CrossRef CAS PubMed.
- R. Ke, M. Mignardi, A. Pacureanu, J. Svedlund, J. Botling, C. Wählby and M. Nilsson, Nat. Methods, 2013, 10, 857–860 CrossRef CAS PubMed.
- J. H. Lee, E. R. Daugharthy, J. Scheiman, R. Kalhor, J. L. Yang, T. C. Ferrante, R. Terry, S. S. F. Jeanty, C. Li, R. Amamoto, D. T. Peters, B. M. Turczyk, A. H. Marblestone, S. A. Inverso, A. Bernard, P. Mali, X. Rios, J. Aach and G. M. Church, Science, 2014, 343, 1360–1363 CrossRef CAS PubMed.
- W. Schubert, B. Bonnekoh, A. J. Pommer, L. Philipsen, R. Böckelmann, Y. Malykh, H. Gollnick, M. Friedenberger, M. Bode and A. W. M. Dress, Nat. Biotechnol., 2006, 24, 1270–1278 CrossRef CAS PubMed.
- M. Uhlén, L. Fagerberg, B. M. Hallström, C. Lindskog, P. Oksvold, A. Mardinoglu, Å. Sivertsson, C. Kampf, E. Sjöstedt, A. Asplund, I. Olsson, K. Edlund, E. Lundberg, S. Navani, C. A. Szigyarto, J. Odeberg, D. Djureinovic, J. O. Takanen, S. Hober, T. Alm, P. Edqvist, H. Berling, H. Tegel, J. Mulder, J. Rockberg, P. Nilsson, J. M. Schwenk, M. Hamsten, K. Von Feilitzen, M. Forsberg, L. Persson, F. Johansson, M. Zwahlen, G. Von Heijne, J. Nielsen and F. Pontén, Science, 2015, 347, 1260419 CrossRef PubMed.
- A. Becskei, B. B. Kaufmann and A. van Oudenaarden, Nat. Genet., 2005, 37, 937–944 CrossRef CAS PubMed.
- W. J. Blake, M. KAErn, C. R. Cantor and J. J. Collins, Nature, 2003, 422, 633–637 CrossRef CAS PubMed.
- M. B. Elowitz, A. J. Levine, E. D. Siggia and P. S. Swain, Science, 2002, 297, 1183–1186 CrossRef CAS PubMed.
- I. Golding, J. Paulsson, S. M. Zawilski and E. C. Cox, Cell, 2005, 123, 1025–1036 CrossRef CAS PubMed.
- E. M. Ozbudak, M. Thattai, I. Kurtser, A. D. Grossman and A. van Oudenaarden, Nat. Genet., 2002, 31, 69–73 CrossRef CAS PubMed.
- A. Raj, C. S. Peskin, D. Tranchina, D. Y. Vargas and S. Tyagi, PLoS Biol., 2006, 4, 1707–1719 CAS.
- J. M. Raser and E. K. O'Shea, Science, 2004, 304, 1811–1814 CrossRef CAS PubMed.
- N. Rosenfeld, J. W. Young, U. Alon, P. S. Swain and M. B. Elowitz, Science, 2005, 307, 1962–1965 CrossRef CAS PubMed.
- J. Guo, S. Wang, N. Dai, Y. N. Teo and E. T. Kool, Proc. Natl. Acad. Sci. U. S. A., 2011, 108, 3493–3498 CrossRef CAS PubMed.
- S. Wang, J. Guo, T. Ono and E. T. Kool, Angew. Chem., Int. Ed., 2012, 51, 7176–7180 CrossRef CAS PubMed.
- N. Dai, J. Guo, Y. N. Teo and E. T. Kool, Angew. Chem., Int. Ed. Engl., 2011, 50, 5105–5109 CrossRef CAS PubMed.
Footnote |
| † Electronic supplementary information (ESI) available: Fig. S1. See DOI: 10.1039/c5ay00500k |
| This journal is © The Royal Society of Chemistry 2015 |

