Polymer thermoelectric modules screen-printed on paper
Qingshuo Wei*,
Masakazu Mukaida*,
Kazuhiro Kirihara,
Yasuhisa Naitoh and
Takao Ishida
Nanosystem Research Institute, Nanosystem Research Institute, National Institute of Advanced Industrial Science and Technology, 1-2-1 Namiki, Tsukuba, Ibaraki 305-8564, Japan. E-mail: qingshuo.wei@aist.go.jp; mskz.mukaida@aist.go.jp
First published on 19th June 2014
Abstract
We report organic thermoelectric modules screen-printed on paper by using conducting polymer poly(3,4-ethylenedioxythiophene):poly(styrenesulfonate) and silver paste. Our large-area devices provided sufficient power to illuminate light-emitting diodes. This is the first example of thermoelectric modules containing conducting polymers being used to power practical devices. The stability of this proof-of-concept module was tested at 100 °C for over 100 h without any encapsulation. We showed that the decrease in device performance was caused not by the deterioration of the materials but by degradation of the interface between the conducting polymers and silver paste. These results suggest that organic thermoelectric modules could be used to harvest heat energy at low temperature, although the stability of the interface must be improved.
1. Introduction
Thermal energy is a potential renewable resource for generating electricity. Thermoelectric devices directly convert thermal energy to electrical energy, and have been the subject of intense research in the field of organic semiconductors for more than a decade.1–3 Thermal energy is ubiquitous, although most sources are at temperatures lower than 150 °C.4 The efficiency of thermal power conversion at low temperatures is low because of the small temperature difference. Therefore, to harvest the huge amount of thermal energy available at low temperatures, large-area thermoelectric devices are required. The low cost of organic semiconductors makes them attractive for large-area devices. However, organic semiconductors have not been thoroughly investigated because of their low electrical conductivity.5–12 Recent advances in organic solar cells and transistors have vastly improved the physical and chemical properties of organic semiconductors.13–15 They can now be tuned over a fairly wide range, making them suitable for thermoelectric devices. Very recently, several groups have reported high power factors and remarkable figures of merit for organic semiconductors and carbon-based materials.16–31 We also reported enhanced apparent Seebeck coefficient of poly(3,4-ethylenedioxythiophene):poly(styrenesulfonate) (PEDOT:PSS) at high humidity conditions.32 This shows that the performance of organic thermoelectrics could approach that of their inorganic counterparts.In addition to the overall performance of the material, there are other criteria organic semiconductors must meet for thermoelectric applications. The first is environmental stability. Many organic semiconductors are not stable to oxygen and water, and thus organic thermoelectric devices may face stability problems, particularly at high temperatures. The second is device design. Conventional inorganic thermoelectric modules have π-type structures which combined both p-type and n-type semiconductors. Organic semiconductors, in principle, can be doped to both p-type and n-type, but effective n-type doping is very challenging.33,34 The studies by using only p-type organic semiconductors to make thermoelectric modules are still very limited.25,35–37 Furthermore, in the conventional device configuration, the thermoelectric performance is determined by the through-plane electrical conductivity and Seebeck coefficient. For organic semiconductors, it is difficult to make a dense block on the centimeter scale; therefore, a common approach for characterizing organic thermoelectric materials is to fabricate a thin film on a substrate and studying the in-plane electrical conductivity and Seebeck coefficient. Many organic semiconductors have anisotropic electric properties, and thus the in-plane electrical conductivity and Seebeck coefficient could be more important for characterizing organic thermoelectric modules.38 The fabrication, optimization and characterization of organic thermoelectric module could be essential parts to guide the material design. In this paper, we report proof-of-concept studies of organic thermoelectric modules using the benchmark p-type material poly(3,4-ethylenedioxythiophene):poly(styrenesulfonate) (PEDOT:PSS).
2. Results and discussion
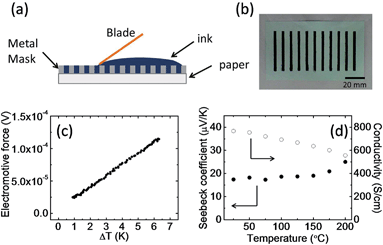
Fig. 1a shows a schematic of the fabrication of the thermoelectric modules. An aqueous PEDOT:PSS solution containing 5% ethylene glycol was used as the ink, because adding a second solvent like ethylene glycol or dimethyl sulfoxide to an aqueous dispersion of PEDOT:PSS can dramatically enhance its electrical conductivity.7,39,40 A PEDOT:PSS layer 2.5 mm wide, 40 mm long, and about 20 μm thick was screen-printed on a 300 μm thick piece of paper. Eleven PEDOT:PSS arrays were printed on one piece of paper, and the distance between the arrays was 8 mm. In theory, a higher density of PEDOT:PSS arrays can be printed; however, we found that the paper bent and cracked the PEDOT:PSS films during drying if the density was too high. This is probably caused by a mismatch of the elastic modulus between the substrate and the PEDOT:PSS layers. There are two reasons why we used paper as a substrate. Firstly, paper shows better thermal stability than polymer substrates such as polyethylene terephthalate and polyethylene naphthalate, which have a glass transition temperature lower than 150 °C. Secondly, the PEDOT:PSS ink is water-based, and thus it should have better wettability on paper than on polymer substrates. A paper-based power source self is desirable for building disposable and flexible electronics.41 A photograph of the PEDOT:PSS films on paper is shown in Fig. 1b. During printing, the substrate temperature was fixed at 70 °C. This is very important for creating a smooth, uniform film with high reproducibility. Printing at a lower temperature results in the delamination of the PEDOT:PSS layer from the paper. Higher temperatures cause the solvents to evaporate too fast, and produce large variations in the conductivity of each array. After the mask was removed, the as-prepared PEDOT:PSS was annealed at 150 °C for 30 min in air to remove the residual solvents. The Seebeck coefficient (S) of the PEDOT:PSS on paper was measured for temperature differences between 1 and 7 °C. The values of S were obtained from the slopes of the plots of ΔV versus ΔT, and more than 30 points were used for the curve fitting (Fig. 1c). A positive Seebeck coefficient indicates p-type conduction. A typical array showed a Seebeck coefficient of about 18 μV K−1 at 25 °C and a four probe conductivity of about 800 S cm−1. The resistance of each array was measured as 10–20 Ω by using a digital multimeter. Fig. 1d shows the conductivity and Seebeck coefficient change with temperature. The electrical conductivity decreased from 770 S cm−1 at 25 °C to 550 S cm−1 at 200 °C. The decrease in conductivity could be related to water being baked out at higher temperatures which will affect the carrier mobility in PEDOT:PSS or may suggest that high-conductivity PEDOT:PSS films behave almost like a metal due to phonon scattering.42 It is important to point out that the same tendency of electrical conductivity change can be observed during cooling process from high temperature to room temperature. This suggested the metal-like conductivity is not due to the degeneration of the PEDOT:PSS.43 This behaviour is different from low-conductivity PEDOT:PSS films, which show an increase in electrical conductivity with increasing temperature. The Seebeck coefficient was 18 μV K−1 at 25 °C and it increased slightly to 25 μV K−1 at 200 °C. At 25 °C, the calculated power factor (P) was 25 μW m−1 K−2, and at 200 °C, P was 34 μW m−1 K−2. The estimated figure-of-merit is on the order of 0.01 by using reported thermal conductivity of PEDOT:PSS.23 The maximum power conversion efficiency at temperature difference of 100 K is estimated around 0.1% by using the equation .2
.2
Silver paste was screen-printed on the PEDOT:PSS arrays to create either series connections (Fig. 2a) or parallel connections (Fig. 2b). In principle, to achieve a high power output, p-type and n-type semiconductors with comparable thermoelectric properties should be used as a pair in the module fabrication. However, the choice of air stable doped n-type organic semiconductors is limited.33,34 The reasons we use silver paste to connect PEDOT:PSS array are due to the high conductivity, low sintering temperature and the good wettability on PEDOT:PSS. The series connections resulted in 11 thermocouples on each piece of paper, and the parallel connections gave 1 thermocouple. The series connections should achieve higher voltages and the parallel connections should give a higher current density. The PEDOT/silver paste arrays were sandwiched between copper plates (Fig. 2c and d), and they were connected either in series or in parallel with metal wires. In this device configuration, the thermoelectric performance was determined by the thermoelectric parameters in the in-plane direction.
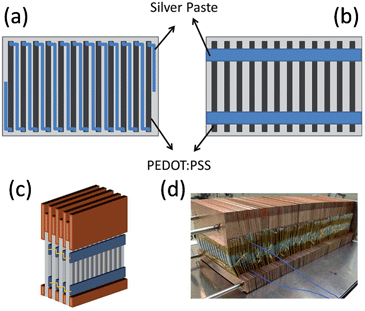 | ||
| Fig. 2 Schematic representation of the (a) series and (b) parallel PEDOT:PSS array, (c) schematic and (d) photograph of the PEDOT:PSS modules sandwiched between copper plates. | ||
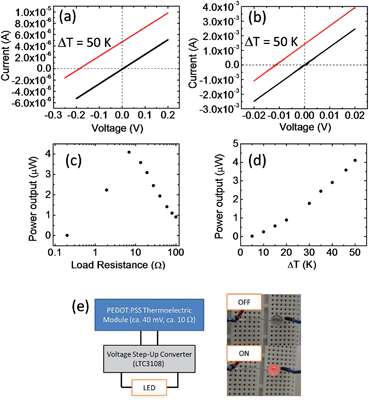
Fig. 3a and b show the current–voltage (I–V) characteristics of two different modules at a temperature difference (ΔT) of 0 and 50 K. The module in Fig. 3a (M1) contains 70 pieces of series-connected paper (2 in parallel, 35 in series; Fig. 2a), which gives 385 thermocouples. The module in Fig. 3b (M2) contains 70 pieces of parallel-connected paper (5 in parallel, 14 in series; Fig. 2b), which results in 14 thermocouples. The linear relationship of the I–V curves suggests ohmic contact between PEDOT and silver paste. At ΔT = 50 K, M1 gave an open circuit voltage of 0.2 V and a short-circuit current of 4 μA, whereas M2 gave a lower open circuit voltage of 0.012 V and a higher short-circuit current of 1.4 mA. Although M1 showed a much higher voltage, its total power output was much lower than that of M2. This suggests that there is a significant loss at the silver paste or the silver/PEDOT interface.
Fig. 3c shows the power output of M2 at ΔT = 50 K for different load resistances. A maximum output power of 4 μW was obtained with a load resistance of about 7 Ω which corresponds to the internal resistance of the module. The power density is ca. 0.1 μW cm−2. If we only considered the volume of PEDOT and silver paste, the power density is ca. 5 μW cm−2. The internal resistance of the module increased with the temperature difference, which is probably caused by the decrease in the conductivity of PEDOT:PSS. At temperatures higher than 250 °C, the significant decrease in the device performance suggested the degradation of PEDOT:PSS.42
To demonstrate that this organic thermoelectric module can power practical devices, a larger area module containing 300 pieces of parallel connected paper was fabricated (10 in parallel, 30 in series; Fig. 2d). The total resistance of this module was less than 10 Ω. At ΔT ≈ 100 K, the large-area module gave a power output greater than 50 μW with an open circuit voltage greater than 40 mV. To improve the output voltage for practical applications, we added a voltage step-up convertor (Linear Tech. LTC 3108, which is a highly integrated DC\DC converter, and there is no additional power needed) to the module. The voltage step-up convertor has a low resistance of about 10 Ω, and operates at inputs of 20 mV to give an output voltage of 2.2 V. The PEDOT:PSS thermoelectric module containing the voltage convertor was sufficient to power a light-emitting diode (LED; Fig. 3e). This is the first example of a thermoelectric module containing conducting polymers being used to power a practical device.
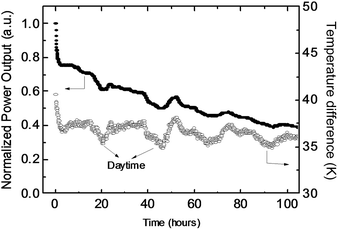
In the introduction, we mentioned the common concern that organic materials may not be stable enough for thermoelectric applications. To evaluate the device stability, we placed the module on a hot plate at 100 °C under ambient conditions. The stable temperature on the hot side was about 80 °C and on the cold side it was 35–45 °C, depending on the environmental temperature. Fig. 4 shows the output power of the module as a function of working time. The power gradually decreased to about half of the initial power density after 100 h of continuous operation, and the loading resistance was about 7 Ω. (The quick decrease of the power output at the first 1 hour is due to the decrease of the temperature difference.) This result is not surprising because the device was not encapsulated and all the materials were exposed to air at high temperatures. However, it should not be concluded that the materials are not air-stable at high temperatures. Because p-type semiconductors are doped using an oxidation reaction, highly doped semiconductors should be very stable to air, even at relatively high temperatures.
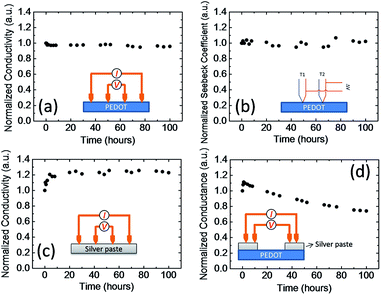
To explain the decrease in the device performance during continuous operation, we carried out further thermal electrical stability measurements for each material. Fig. 5a and b show the four probe electrical conductivity and Seebeck coefficient of PEDOT:PSS as a function of time at 80 °C. The temperature is similar to the temperature of our module on the hot side. Both the electrical conductivity and Seebeck coefficient were very stable over time. The electrical conductivity and Seebeck coefficient changed by less than 5% after 100 h at 80 °C. Fig. 5c shows the four-probe electrical conductivity of the silver paste as a function of time. The electrical conductivity increased about 20% in the first 10 h and then remained almost constant. The increase in the electric conductivity may be caused by the evaporation of the solvent in the paste and the aggregation of the nanoparticles in the ink. These results indicate that PEDOT:PSS and the silver paste are thermally stable. Fig. 5d shows the conductance measurements of the silver paste/PEDOT:PSS/silver paste device. The conductance increased slightly during the first few hours, probably because of the increase in the conductivity of the silver paste (Fig. 5c). However, the conductance decreased to about 70% of its initial value after 100 h. This was similar to the decrease in the power output of the thermoelectric modules. If both materials are stable, the decrease in conductance must be caused by an unstable interface.
To confirm the changes at the silver/PEDOT:PSS interface, we further carry out X-ray photoelectron spectroscopy (XPS) measurements. We have successfully peeled off the PEDOT:PSS layer by using adhesive tapes after the stability test, and compared the Ag 3d and S 2p peaks at silver/PEDOT:PSS interface with silver/air and PEDOT:PSS/air interface. As shown in Fig. 6a, the binding energy of Ag 3d for silver/PEDOT:PSS interface doesn't show significant shift which may suggest PSS doesn't react significantly with silver at the interface. On the other hand, we observed the segregation of PSS on the silver/PEDOT:PSS interface. As shown in Fig. 6b, the PSS/PEDOT ratio increase to ca. 3.5 after the stability test which is higher than the PSS/PEDOT ratio in solution and PEDOT:PSS/air interface (ca. 2.5). PSS is insulator, and the segregation of PSS could increase the contact resistance. This result suggested the surface energy of conductive paste may be important for improving the device stability. Final, we need to point out that this module was not optimized for power density, however, it is easy to handle and the internal resistance can be readily altered to match the voltage convertor. Free-standing PEDOT:PSS films with optimized doping levels (de-doped PEDOT:PSS films)18,26 combined with conductive paste with a negative Seebeck coefficient should have a much higher power density.
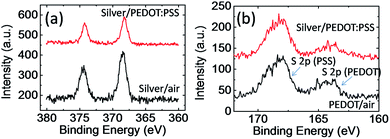 | ||
| Fig. 6 XPS spectra of PEDOT:PSS layer and silver layer at different interface in (a) Ag 3d region and (b) S 2p region. | ||
3. Conclusions
In conclusion, we have fabricated PEDOT:PSS thermoelectric modules on paper by screen-printing. Our large-area devices gave a power output of over 50 μW at ΔT of about 100 K, which provided sufficient power to illuminate an LED. PEDOT:PSS showed remarkable thermal stability in air, although the performance of the module decreased over time. This decrease was attributed to the unstable interface between silver paste and PEDOT:PSS. Our results demonstrate that organic thermoelectric modules could be used to harvest heat energy at low temperatures, although the stability of the interfaces must be improved.444. Experimental
Chemicals
Poly(3,4-ethylenedioxythiophene):poly(styrenesulfonate) (PEDOT:PSS; Clevios PH1000) was purchased from H.C. Starck, and ethylene glycol (EG, >99.5%) was purchased from TCI Chemicals.Device preparation
An aqueous PEDOT:PSS solution containing 5% EG was used as the ink. The substrate was 300 μm thick paper. A metal mask that was 2.5 mm wide, 40 mm long, and 5 mm thick was placed on the paper. The PEDOT:PSS ink was placed on the mask, the solvent was evaporated for 30 min at 70 °C, and then the mask was removed from the substrate. The PEDOT:PSS layers were annealed at 150 °C for 30 min to remove the solvent. The as-prepared PEDOT:PSS layer was 20–30 μm thick. The silver paste was also screen-printed with a metal mask and dried at 150 °C for 30 min.Characterization
The film thickness was measured with a surface profilometer (Sloan Dektak 3, Veeco). The conductivity was measured with a four-probe conductivity test meter (MCP-T600, Mitsubishi Chemical Corp.), and the temperature was controlled with a hot plate. The Seebeck coefficient was measured with a laboratory-built system. All the electrical characteristics were measured using a semiconductor parameter analyzer (4200-SCS, Keithley). The stability of the modules was monitored with a memory data logger (LR8400, Hioki). The XPS spectra were measured with an XPS spectrometer (Theta Probe, Thermo Scientific) using a focused monochromatic Al-Kα X-ray source (1486.6 eV).Acknowledgements
This work was supported by TherMAT, Future Pioneering Projects of the Ministry of Economy, Trade and Industry, Japan.Notes and references
- F. J. DiSalvo, Science, 1999, 285, 703–706 CrossRef CAS.
- G. J. Snyder and E. S. Toberer, Nat. Mater., 2008, 7, 105–114 CrossRef CAS PubMed.
- M. Zebarjadi, K. Esfarjani, M. S. Dresselhaus, Z. F. Ren and G. Chen, Energy Environ. Sci., 2012, 5, 5147–5162 Search PubMed.
- The Energy Conservation Center (Japan), http://www.asiaeec-col.eccj.or.jp/index.html.
- N. Mateeva, H. Niculescu, J. Schlenoff and L. R. Testardi, J. Appl. Phys., 1998, 83, 3111–3117 CrossRef CAS PubMed.
- M. Pfeiffer, A. Beyer, T. Fritz and K. Leo, Appl. Phys. Lett., 1998, 73, 3202–3204 CrossRef CAS PubMed.
- J. Y. Kim, J. H. Jung, D. E. Lee and J. Joo, Synth. Met., 2002, 126, 311–316 CrossRef CAS.
- J. Feng and T. W. Ellis, Synth. Met., 2003, 135–136, 155–156 CrossRef CAS.
- F.-X. Jiang, J.-K. Xu, B.-Y. Lu, Y. Xie, R.-J. Huang and L.-F. Li, Chin. Phys. Lett., 2008, 25, 2202–2205 CrossRef CAS.
- K. P. Pernstich, B. Roessner and B. Batlogg, Nat. Mater., 2008, 7, 321–325 CrossRef CAS PubMed.
- K.-C. Chang, M.-S. Jeng, C.-C. Yang, Y.-W. Chou, S.-K. Wu, M. Thomas and Y.-C. Peng, J. Electron. Mater., 2009, 38, 1182–1188 CrossRef CAS.
- J. Sun, M. L. Yeh, B. J. Jung, B. Zhang, J. Feser, A. Majumdar and H. E. Katz, Macromolecules, 2010, 43, 2897–2903 CrossRef CAS.
- S. R. Forrest and M. E. Thompson, Chem. Rev., 2007, 107, 923–925 CrossRef CAS.
- O. Bubnova and X. Crispin, Energy Environ. Sci., 2012, 5, 9345–9362 CAS.
- T. O. Poehler and H. E. Katz, Energy Environ. Sci., 2012, 5, 8110–8115 CAS.
- R. d. B. Aïch, N. Blouin, A. l. Bouchard and M. Leclerc, Chem. Mater., 2009, 21, 751–757 CrossRef.
- B. Zhang, J. Sun, H. E. Katz, F. Fang and R. L. Opila, ACS Appl. Mater. Interfaces, 2010, 2, 3170–3178 CAS.
- O. Bubnova, Z. U. Khan, A. Malti, S. Braun, M. Fahlman, M. Berggren and X. Crispin, Nat. Mater., 2011, 10, 429–433 CrossRef CAS PubMed.
- O. Bubnova, M. Berggren and X. Crispin, J. Am. Chem. Soc., 2012, 134, 16456–16459 CrossRef CAS PubMed.
- Y. Sun, P. Sheng, C. Di, F. Jiao, W. Xu, D. Qiu and D. Zhu, Adv. Mater., 2012, 24, 932–937 CrossRef CAS PubMed.
- Q. Zhang, Y. Sun, W. Xu and D. Zhu, Energy Environ. Sci., 2012, 5, 9639–9644 CAS.
- M. He, F. Qiu and Z. Lin, Energy Environ. Sci., 2013, 6, 1352–1361 Search PubMed.
- G. H. Kim, L. Shao, K. Zhang and K. P. Pipe, Nat. Mater., 2013, 12, 719–723 CrossRef CAS PubMed.
- A. Yoshida and N. Toshima, J. Electron. Mater., 2014, 43, 1492–1497 CrossRef CAS.
- K. Suemori, S. Hoshino and T. Kamata, Appl. Phys. Lett., 2013, 103, 153902 CrossRef PubMed.
- N. Massonnet, A. Carella, O. Jaudouin, P. Rannou, G. Laval, C. Celle and J.-P. Simonato, J. Mater. Chem. C, 2014, 2, 1278–1283 RSC.
- O. Bubnova, Z. U. Khan, H. Wang, S. Braun, D. R. Evans, M. Fabretto, P. Hojati-Talemi, D. Dagnelund, J.-B. Arlin, Y. H. Geerts, S. Desbief, D. W. Breiby, J. W. Andreasen, R. Lazzaroni, W. M. Chen, I. Zozoulenko, M. Fahlman, P. J. Murphy, M. Berggren and X. Crispin, Nat. Mater., 2013, 13, 190–194 CrossRef PubMed.
- T. Park, C. Park, B. Kim, H. Shin and E. Kim, Energy Environ. Sci., 2013, 6, 788–792 CAS.
- W. Zhao, S. Fan, N. Xiao, D. Liu, Y. Y. Tay, C. Yu, D. Sim, H. H. Hng, Q. Zhang, F. Boey, J. Ma, X. Zhao, H. Zhang and Q. Yan, Energy Environ. Sci., 2012, 5, 5364–5369 CAS.
- Y. Nonoguchi, K. Ohashi, R. Kanazawa, K. Ashiba, K. Hata, T. Nakagawa, C. Adachi, T. Tanase and T. Kawai, Sci. Rep., 2013, 3, 3344 Search PubMed.
- Y. Nakai, K. Honda, K. Yanagi, H. Kataura, T. Kato, T. Yamamoto and Y. Maniwa, Appl. Phys. Express, 2014, 7, 025103 CrossRef.
- Q. S. Wei, M. Mukaida, K. Kirihara, Y. Naitoh and T. Ishida, Appl. Phys. Express, 2014, 7, 031601 CrossRef.
- B. Russ, M. J. Robb, F. G. Brunetti, P. L. Miller, E. E. Perry, S. N. Patel, V. Ho, W. B. Chang, J. J. Urban, M. L. Chabinyc, C. J. Hawker and R. A. Segalman, Adv. Mater., 2014, 26, 3473–3477 CrossRef CAS PubMed.
- R. A. Schlitz, F. G. Brunetti, A. M. Glaudell, P. L. Miller, M. A. Brady, C. J. Takacs, C. J. Hawker and M. L. Chabinyc, Adv. Mater., 2014, 26, 2825–2830 CrossRef CAS PubMed.
- R. R. Søndergaard, M. Hösel, N. Espinosa, M. Jørgensen and F. C. Krebs, Energy Sci. Eng., 2013, 1, 81–88 CrossRef.
- J. Wüsten and K. Potje-Kamloth, J. Phys. D: Appl. Phys., 2008, 41, 135113 CrossRef.
- F. Jiao, C.-a. Di, Y. Sun, P. Sheng, W. Xu and D. Zhu, Philos. Trans. R. Soc., A, 2014, 372, 20130008 CrossRef PubMed.
- A. M. Nardes, M. Kemerink, R. A. J. Janssen, J. A. M. Bastiaansen, N. M. M. Kiggen, B. M. W. Langeveld, A. J. J. M. van Breemen and M. M. de Kok, Adv. Mater., 2007, 19, 1196–1200 CrossRef CAS.
- S. Ashizawa, R. Horikawa and H. Okuzaki, Synth. Met., 2005, 153, 5–8 CrossRef CAS PubMed.
- Q. S. Wei, M. Mukaida, Y. Naitoh and T. Ishida, Adv. Mater., 2013, 25, 2831–2836 CrossRef CAS PubMed.
- Q. Zhong, J. Zhong, B. Hu, Q. Hu, J. Zhou and Z. L. Wang, Energy Environ. Sci., 2013, 6, 1779–1784 CAS.
- S. K. A. Elschner, W. Lovenich, U. Merker and K. Reuter, PEDOT: Principles and Applications of an Intrinsically Conductive Polymer, CRC Press, Boca Raton, FL, USA, 2010 Search PubMed.
- P. Rannou and M. Nechtschein, Synth. Met., 1999, 101, 474 CrossRef CAS.
- During the revision of this paper, we became aware of a very recent publication which is highly recommended as a reference: P. Shen, Y. Sun, F. Jiao, C. Di, W. Xu and D. Zhu, Synth. Met., 2014, 193, 1–7 CrossRef PubMed.
| This journal is © The Royal Society of Chemistry 2014 |

