A novel Gaussian-DAEM-reaction model for the pyrolysis of cellulose, hemicellulose and lignin
Jinzhi Zhangab,
Tianju Chen*a,
Jingli Wua and
Jinhu Wu*a
aKey Laboratory of Biofuels, Qingdao Institute of Bioenergy and Bioprocess Technology, Chinese Academy of Sciences, 189 Songling Road, Qingdao 266101, China. E-mail: chentianju27@gmail.com; wujh@qibebt.ac.cn; Tel: +86-532-80662763 Tel: +86-532-80662761
bUniversity of Chinese Academy of Sciences, Beijing 100049, China
First published on 31st March 2014
Abstract
This work deals with the pyrolysis kinetics of cellulose, hemicellulose and lignin. Experiments were carried out in a thermogravimetric analyzer (TGA Q5000) in the inert atmosphere of nitrogen at a heating rate of 10 K min−1. The single Gaussian distributed activation energy model (DAEM) was utilized to study the pyrolysis kinetics. Kinetic parameters such as the pre-exponential factor (k0), mean activation energy (E0) and standard variance (σ) were computed by a pattern search algorithm. It was found that the calculated kinetic parameters using the single Gaussian-DAEM-reaction model could reproduce the differential thermogravimetric (DTG) curves of cellulose very well. However, there existed obvious deviations in the whole range of temperatures between the calculated and experimental data for hemicellulose and lignin. In order to describe the thermal decompositions of hemicellulose and lignin more accurately, a novel double Gaussian-DAEM-reaction model consisting of two parallel partial reactions was developed to describe the pyrolysis processes. Calculated results of the fitting procedure using the double Gaussian-DAEM-reaction model showed good agreement with experimental DTG data of hemicellulose and lignin.
1. Introduction
The combustion of fossil fuels has become the largest source of greenhouse gas emissions.1 Due to the demand for environmental responsibility and the depletion of fossil fuels, biomass, as a clean and sustainable energy source, has currently received increased attention for being converted into alternative fuels.2 Two main kinds of process technologies by which biomass can be converted into alternative fuels are biological technology and thermochemical technology. Pyrolysis, as one kind of biomass thermochemical conversion technology, involves the thermal degradation of the starting material resulting in the production of solid, liquid and gas products. Pyrolysis has been applied for commercial production of varieties of fuels, solvents, chemicals and other products from biomass feedstocks.3–5 Pyrolysis process is thought to be one of the most promising ways to convert biomass into chemicals and higher value fuels as it takes advantage both of a great flexibility and a relatively easy control of products yields and characteristics.6–9A fundamental study of pyrolysis kinetics can help us to predict the pyrolysis behavior of biomass materials as well as design efficient pyrolytic reactors for engineering applications.10 Thermogravimetric analysis (TGA) is the most commonly used thermoanalytical technique for the pyrolysis of samples by monitoring the mass changes online.11 Nonisothermal TGA can offer some advantages over the classical isothermal method because it permits a rapid and complete scan of the entire temperature in a single experiment.12 Although both thermogravimetric (TG) and differential thermogravimetric (DTG) curves could be obtained from TGA, many researchers selected to choose DTG curves to estimate the kinetic parameters, because DTG curves made easier the identification of the kinetic process.13,14 In addition, DTG curves were more sensitive to changes of thermal decomposition, for small changes in the TG curves were magnified in the corresponding DTG curves.
Several models such as the single reaction model, two parallel reaction model, three-pseudocomponent model, and the distributed activation energy model (DAEM) have been used to describe the kinetic process of biomass pyrolysis.15,16 The most accurate and up-to-date method for modeling the thermal decomposition of biomass is to adopt DAEM, which has been widely applied to describe complex biomass pyrolysis.17–19 The model assumes that a series of irreversible first order parallel reactions occur simultaneously, which have a range of activation energies. And the activation energy is usually approximated described by a Gaussian distribution.20 Researchers have made a lot of research on biomass pyrolysis by the three-parallel-DAEM-reaction model, which assumes three independent parallel reacting pseudocomponents (cellulose, hemicellulose and lignin).21–25 It was further assumed that the pyrolysis kinetics of each pseudocomponent can be described by the single Gaussian-reaction-DAEM.
In the previous research, the pyrolysis and gasification process of biomass and its three main components (cellulose, hemicellulose and lignin) were investigated.26,27 One aim of this work was to make sure whether the single Gaussian-DAEM-reaction model could describe thermal decompositions of cellulose, hemicellulose and lignin successfully. Calculated results in this work showed that the single Gaussian-DAEM-reaction model could not describe DTG curves of hemicellulose or lignin correctly. So the other aim was to find a kinetic model that could well describe the pyrolysis decompositions of hemicellulose and lignin. The multi-peaks method was first used to fit multiple peaks by Gaussian functions to DTG curves of hemicellulose and lignin, and results showed that two Gaussian distribution models could fit the DTG curves of hemicellulose and lignin very well. Accordingly in this work, a novel double Gaussian-DAEM-reaction model based on the multi-peaks method was developed to describe the pyrolysis processes of the hemicellulose and lignin. Kinetic parameters such as pre-exponential factor (k0), mean activation energy (E0) and standard variance (σ) were determined by pattern search method.
2. Experimental
2.1 Materials
Cellulose (CAS no.: 9004-34-6), hemicellulose (CAS no.: 9014-63-5) and lignin (CAS no.: 8068-05-1) were obtained from Sigma-Aldrich Co., Ltd (USA). In this study, cellulose was a polysaccharide composed of long chains of β(1,4) linked D-glucose units. The hemicellulose was refined from the beechwood. The low sulfonate content alkali lignin was chosen in this study. All the experimental samples were dried for 12 h at 378 K to remove water before experiment. The ash content for cellulose, hemicellulose and lignin were 0, 0.48%, and 11.6%, respectively.TG and DTG curves were obtained from the thermogravimetric equipment (TGA Q5000 V3.15 Build 263). This analyser provides for simultaneous measurement of weight changes from ambient to 900 K at a heating rate of 10 K min−1 in N2 atmosphere at a flow rate of 80 mL min−1.
2.2 Nonisothermal DAEM equation
α(T) is the degree of conversion at temperature T, and its value can be obtained from TGA data of the sample according to eqn (1). In the equation, ω0 is the initial weight, ωf is the final weight and ωT is the weight at temperature T.
 | (1) |
DAEM has been widely applied to analyze complex reactions such as pyrolysis of biomass and fossil fuels.18–20 When the model is applied to represent the change in total volatiles of non-isothermal pyrolysis process, the model is as shown in eqn (2). In this equation, k0 is the pre-exponential factor corresponding to the E value, and β is the heating rate, R is the universal gas constant, T is the temperature, and f(E) is the distribution of the activation energy representing the differences in the activation energies of many reactions.
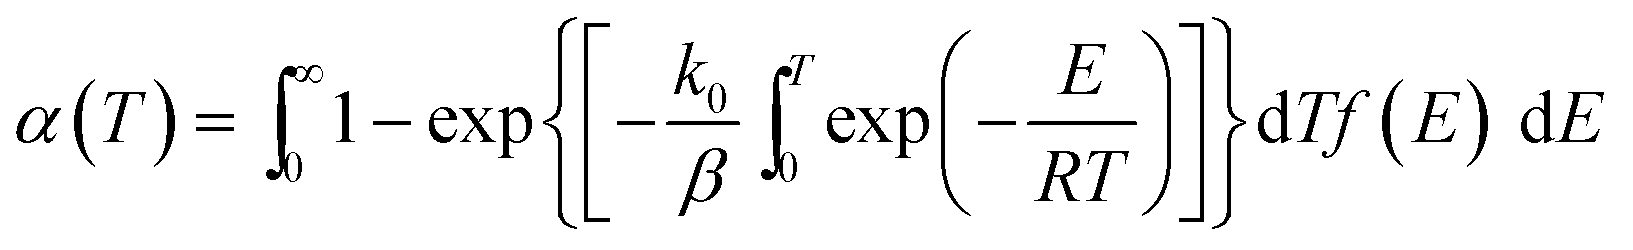 | (2) |
In order to estimate the values of k0 and f(E), the activation energy distribution is generally assumed by a Gaussian distribution with mean activation energy E0 and standard deviation σ as shown in eqn (3).
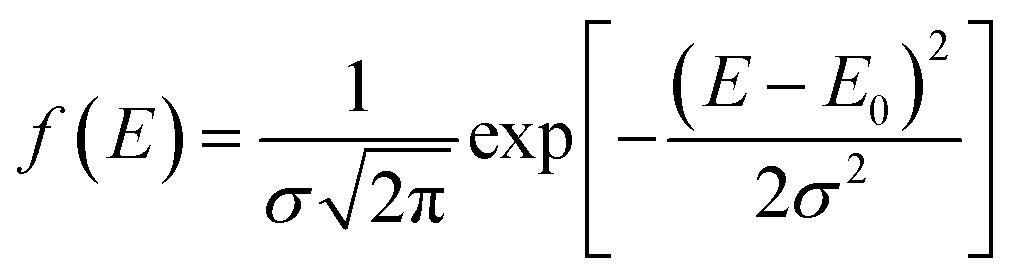 | (3) |
The derivative of eqn (2) is given by eqn (4).
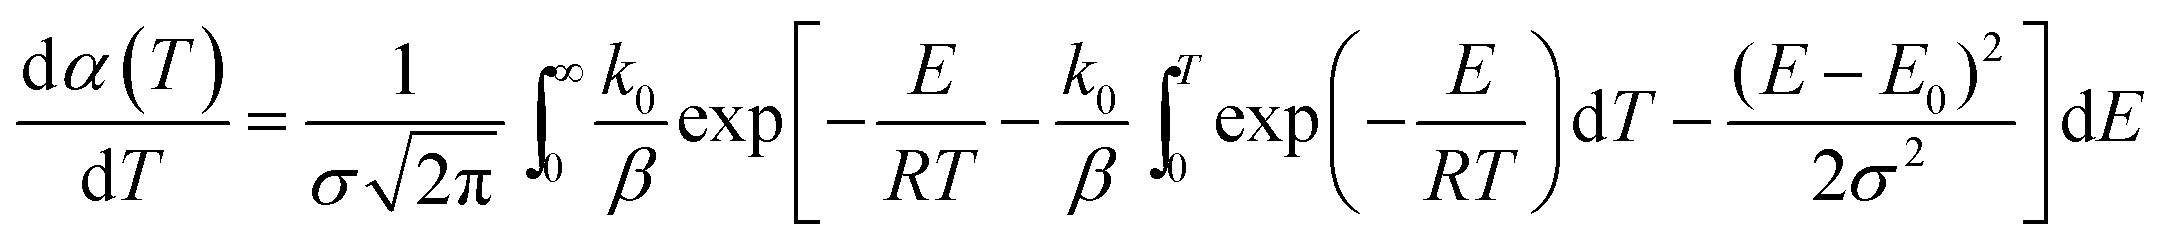 | (4) |
Both the inner dT integral and the outer dE integral in eqn (4) have no exact analytical solution, and a large number of approximations have been proposed.28 In this work, the approximation for the temperature integral proposed by Doyle29 was utilized to replace the general temperature integral as shown in eqn (5). What's more, a computer program has been created in MATLAB to perform the outer dE integral of eqn (4).
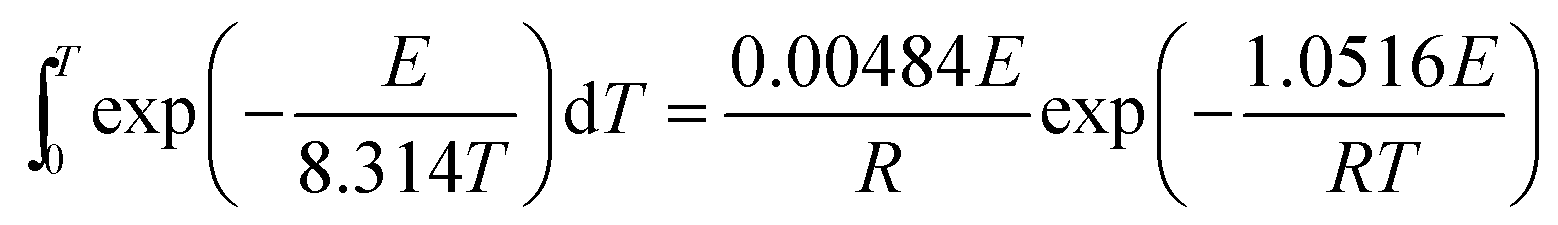 | (5) |
2.3 Determination of kinetic parameters
For the purpose of optimizing kinetic parameters (including k0, E0, and σ) of nonisothermal DAEM equations, the objective function was formed according to eqn (6). The subscript i refers to the data points used, nd is the number of the data points, (dα/dT)i,exp represents the experimental data, and (dα/dT)i,cal represents those calculated by eqn (4) for a given set of parameters of k0, E0, and σ.
 | (6) |
The value of Fit as shown in eqn (7) accounts for the differences between the experimental values and those calculated from the model prediction according to eqn (4), where (dα/dT)max is the maximum experimental value. A lower value of Fit in eqn (7) indicates a better quality of fitness.
 | (7) |
It is hard to deal with the optimization problem by using traditional optimization techniques if the objective function has no explicit expression, because it is difficult to obtain information about gradient or higher derivations of the objective function without explicit expression. Consequently, the optimization algorithm should be derivative-free. According to Cai et al.,30 it is efficient to solve the problem by using pattern search method, which is a derivative-free, direct search method, and superior to other direct search method such as Powell method and Simplex method in both robustness and number of function evaluations.
According to the values of k0, E0, and σ reported in the literature,31,32 the range of E0 was selected from 100 to 350 kJ mol−1, σ was from 1 to 50 kJ mol−1, and k0 was from 105 to 1030 s−1.
3. Results and discussion
3.1 Single Gaussian-DAEM-reaction model
Fig. 1 compared the TG and DTG curves of three main components of biomass, namely: cellulose, hemicellulose and lignin. As shown in Fig. 1a and b, remarkable differences were found among thermal decomposition behaviors of cellulose, hemicellulose and lignin. It was evident that cellulose exhibited a tall narrow peak, while the other two samples both had a lower peak with a flat tailing. It can be observed from Fig. 1 that cellulose degradation happened between 560 and 650 K, hemicellulose began to thermally decompose at 460–690 K, and lignin degradation took place at 450–850 K. These results were consistent with reported data.33 When temperature was higher than 650 K, almost all cellulose was decomposed with a very low solid residue (4.3%) left. However, high solid residue was left for hemicellulose (26.0%) and lignin (60.7%) at 950 K. Ash existed in the solid residue.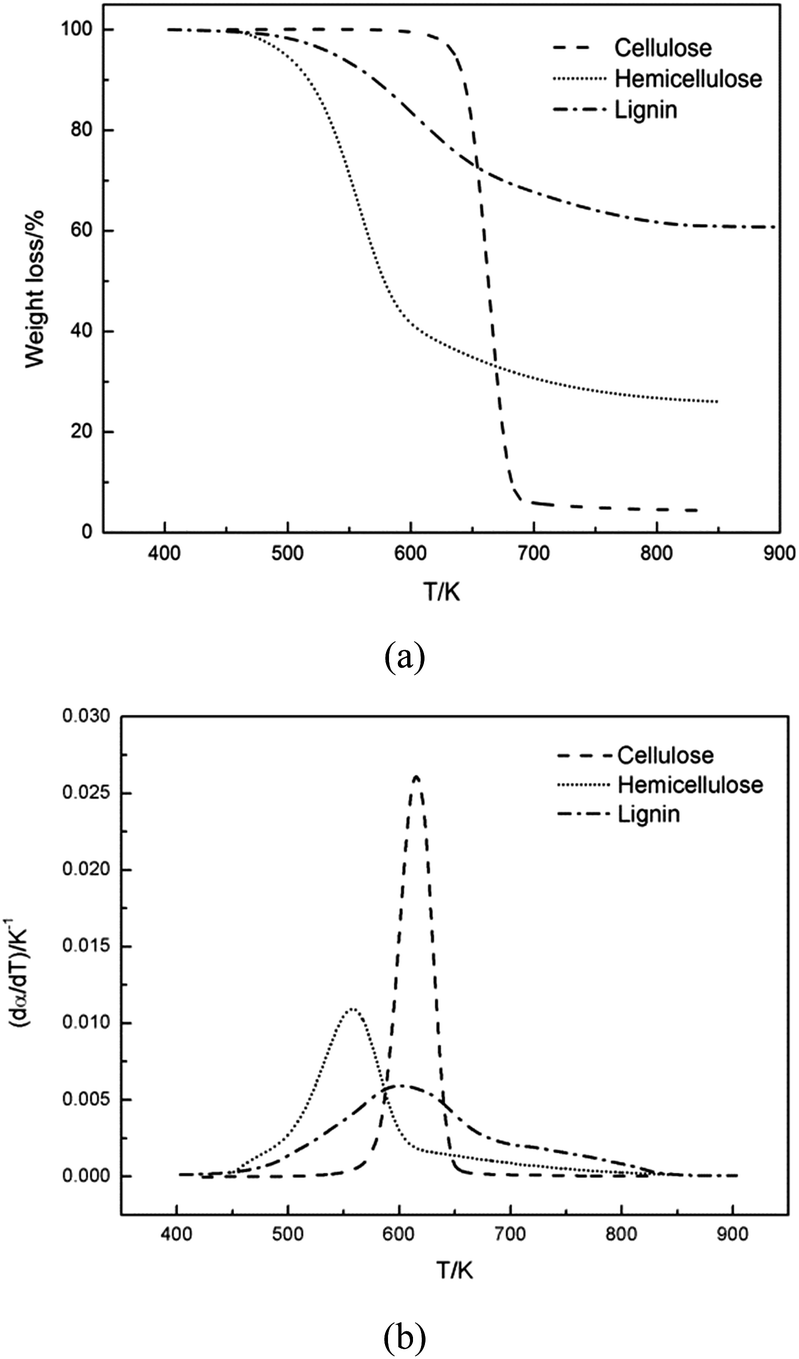 | ||
| Fig. 1 Experimental TG and DTG curves of cellulose, hemicellulose and lignin. | ||
Shanks et al.34–36 investigated the influence of minerals salts and switchgrass ash on fast pyrolysis of the three samples, it was found that mineral salts and switchgrass ash actually had effect on pyrolysis product distributions of cellulose and hemicellulose. In this work, cellulose and hemicellulose contained negligible amount of ash content (0 and 0.48%, respectively), so the impact of the small amount of mineral impurities on the pyrolysis kinetics could be ignored. Shanks et al.34,35 also found that the presence of minerals had no obvious effect on lignin pyrolysis. It was supposed that ash had no significant influence on lignin pyrolysis, although high ash content was found in lignin (11.6%) in this study. Therefore, it was reasonable to consider the obtained samples without further purification for kinetic studies.
DTG curves make easier identification of the kinetic process than do the TG curves. Consequently, DTG curves were selected to determine the kinetic parameters. The single Gaussian-DAEM-reaction model was applied to investigate the pyrolysis kinetics of three pseudocomponents of biomass according to the theory introduced in part 2.2.
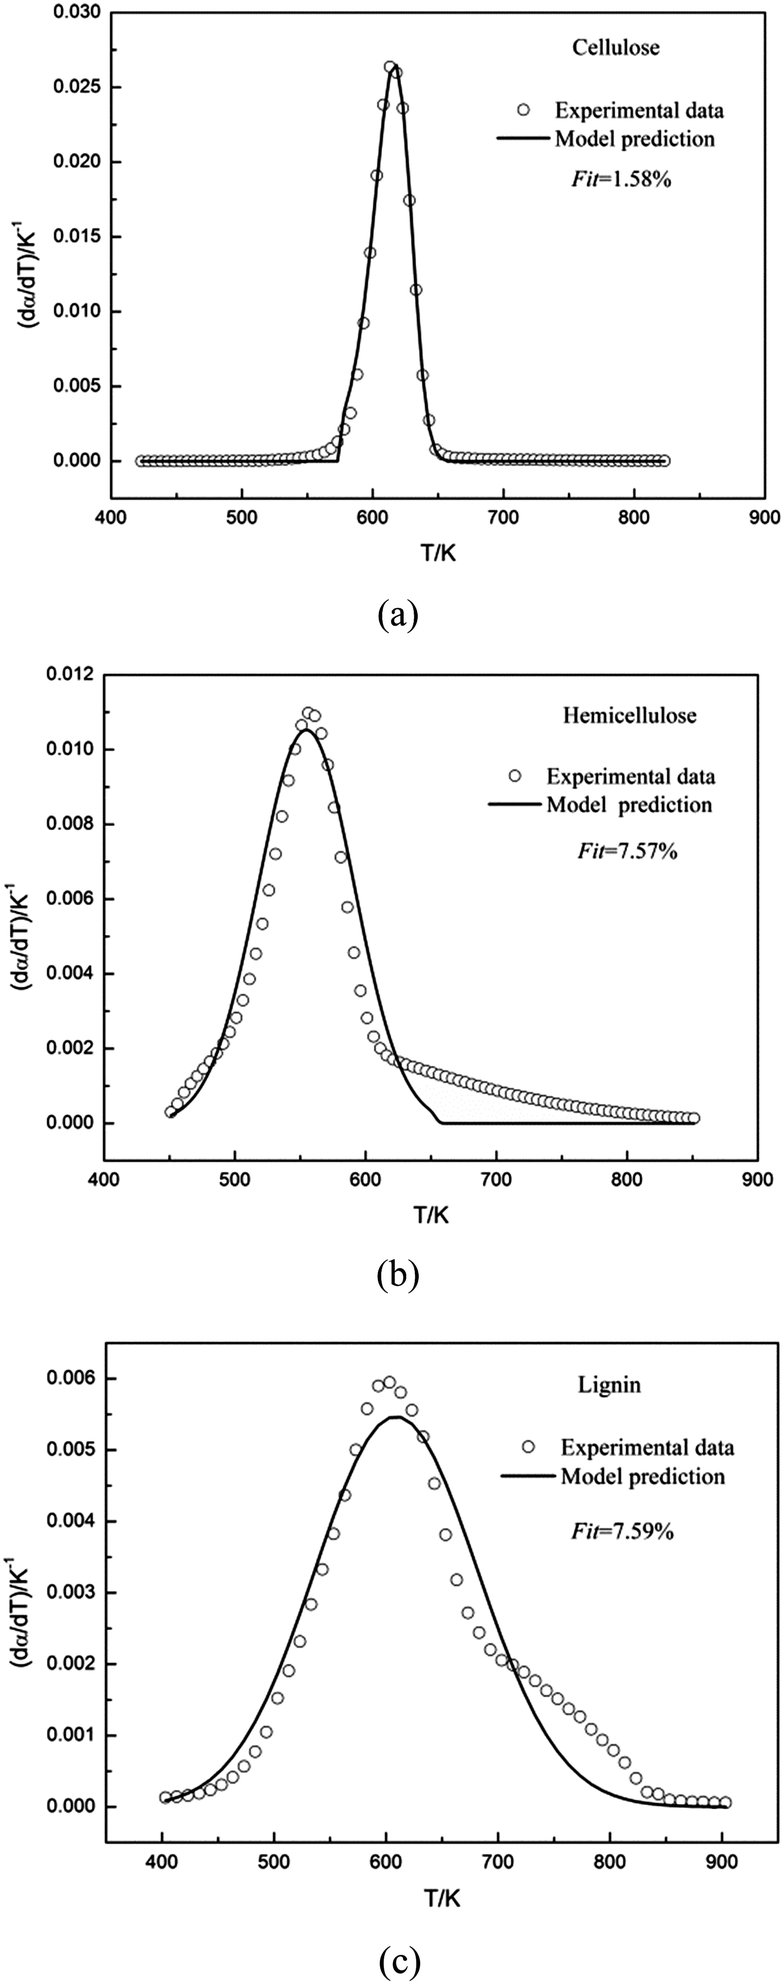 | ||
| Fig. 2 Experimental and calculated DTG curves of cellulose, hemicellulose and lignin using the single Gaussian-DAEM-reaction model. | ||
| Sample | k0,j/s−1 | E0,j/kJ mol−1 | σj/kJ mol−1 | Fit (%) |
|---|---|---|---|---|
| Cellulose | 2.612 × 10¹⁸ | 240.23 | 2.366 | 1.58 |
| Hemicellulose | 6.137 × 10¹⁴ | 179.84 | 10.815 | 7.57 |
| Lignin | 8.511 × 10¹¹ | 165.61 | 19.307 | 7.59 |
![[thin space (1/6-em)]](https://www.rsc.org/images/entities/char_2009.gif) 000 (200 xylopyra-nose units).21 Xylan was used as the sample of hemicellulose in this study.
000 (200 xylopyra-nose units).21 Xylan was used as the sample of hemicellulose in this study.It can be seen from Fig. 1b that hemicellulose started decomposing earlier than cellulose, and the weight loss mainly happened at 460–690 K. Possible reasons are that hemicellulose is amorphous and has a lower degree of polymerisation compared with cellulose.
The kinetic parameters obtained from the fitting procedure using the single Gaussian-DAEM-reaction model were listed in Table 1. It can be seen that the kinetic parameters were k0 = 6.137 × 10¹⁴ s−1 and E0 = 179.84 kJ mol−1 for hemicellulose. As was shown in Table 1, the value of Fit for hemicellulose reached up to 7.57%, which was higher than the acceptable range (Fit < 4% is generally acceptable). Predicted results from the optimum kinetic parameters were compared with the experimental data for hemicellulose. Fig. 2b showed that there existed obvious deviations in the whole range of temperatures between the calculated data and experimental data.
The kinetic parameters obtained from the fitting procedure using the single Gaussian-DAEM-reaction model were listed in Table 1. It can be seen that the kinetic parameters were k0 = 8.511 × 10¹¹ s−1 and E0 = 165.61 kJ mol−1 for lignin. It was shown that the value of Fit for hemicellulose was 7.59%, which went beyond the acceptable range. The results of the fitting procedure using the single Gaussian-DAEM-reaction model for hemicellulose were reported in Fig. 2c. It can be observed from Fig. 2c that the prediction model was not able to describe the experimental data correctly, because obvious deviations were found, especially for higher temperatures.
3.2 Double Gaussian-DAEM-reaction model
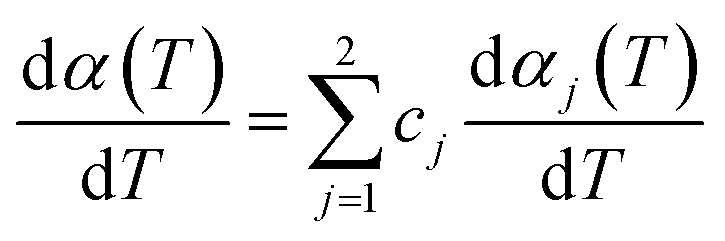
Multi-peaks method in the origin lab was first utilized in this work to fit multiple peaks to a DTG curve by Gaussian functions using the Levenberg–Marquardt algorithm. The DTG curves of hemicellulose and lignin based on Gaussian distribution were shown in Fig. 3. It can be observed form Fig. 3 that two Gaussian distribution models could fit the DTG curves of hemicellulose and lignin very well since the coefficient correlation (R2) was equal to 0.99475 and 0.99705, respectively (R2 > 0.99 is generally acceptable). Accordingly in this work, a double Gaussian-DAEM-reaction model based on multi-peaks method was developed to describe the pyrolysis processes of hemicellulose and lignin. In the double Gaussian-DAEM-reaction model, the global dα(T)/dT is the linear combinations of dαj(T)/dT as shown in eqn (8).
 | (8) |
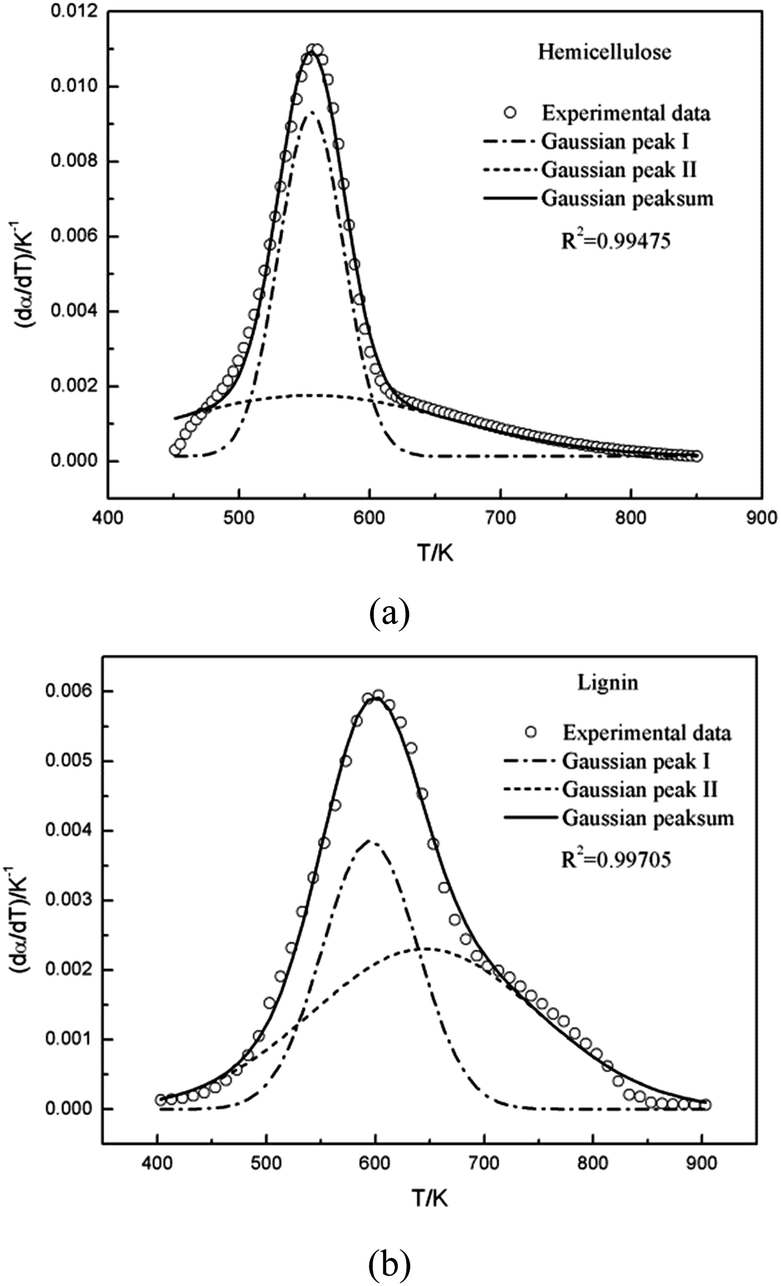 | ||
| Fig. 3 DTG curves of hemicellulose and lignin based on multi-peaks method. | ||
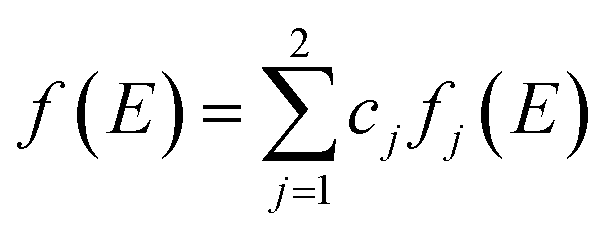
Similarly, the global f(E) is the linear combinations of fj(E) as shown in eqn (9).
 | (9) |
In both eqn (8) and (9), cj represents the fraction of volatiles produced by the jth partial reaction.
The model estimated parameters using the double Gaussian-DAEM-reaction model based on the multi-peaks method for hemicellulose and lignin were listed in Table 2.
| Sample | cj | k0,j/s−1 | E0,j/kJ mol−1 | σj/kJ mol−1 | Fit (%) |
|---|---|---|---|---|---|
| Hemicellulose | 2.04 | ||||
| Reaction I | 0.5983 | 6.501 × 10¹⁴ | 180.00 | 6.650 | |
| Reaction II | 0.4017 | 2.495 × 10⁸ | 114.45 | 22.787 | |
| Lignin | 2.43 | ||||
| Reaction I | 0.4179 | 5.559 × 10¹¹ | 159.59 | 10.448 | |
| Reaction II | 0.5821 | 6.109 × 10¹¹ | 174.19 | 27.448 |
The double Gaussian-DAEM-reaction model was used to study the pyrolysis kinetics of hemicellulose. The results of the fitting procedure were shown in Fig. 4a. It can be seen from Fig. 4a that there was a close agreement between the prediction model and the experimental data for the higher temperatures, and negligible deviations were found for the lower temperatures. The single Gaussian-DAEM-reaction model was generally used to investigate the pyrolysis process of hemicellulose.40 Compared with the single Gaussian-DAEM-reaction model, the value of Fit in eqn (7) using the double Gaussian-DAEM-reaction model decreased to 2.04% from 7.57%. It can be observed that double Gaussian-DAEM-reaction model offered a more reliable method for prediction of the pyrolysis behaviour of hemicellulose. The kinetic parameters obtained from the fitting procedure were listed in Table 2. It was found that for hemicellulose the kinetic parameters of partial reaction I were k0,1 = 6.501 × 10¹⁴ s−1, E0,1 = 180 kJ mol−1 and σ1 = 6.65 kJ mol−1; and the kinetic parameters of partial reaction II were k0,2 = 2.495 × 10⁸ s−1, E0,2 = 114.45 kJ mol−1 and σ2 = 22.787 kJ mol−1. In consideration of method concluding two partial reactions, similar results have been obtained from the research of hemicellulose by Várhegyi et al. using the competitive reaction model (k0,1 = 3.2 × 10⁵ s−1, E0,1 = 84 kJ mol−1; k0,2 = 1.0 × 10¹⁷ s−1, E0,2 = 193 kJ mol−1) with a heating rate of 10 K min−1.32 These data indicates that the description of hemicellulose pyrolysis through the double Gaussian-DAEM-reaction model is valid.
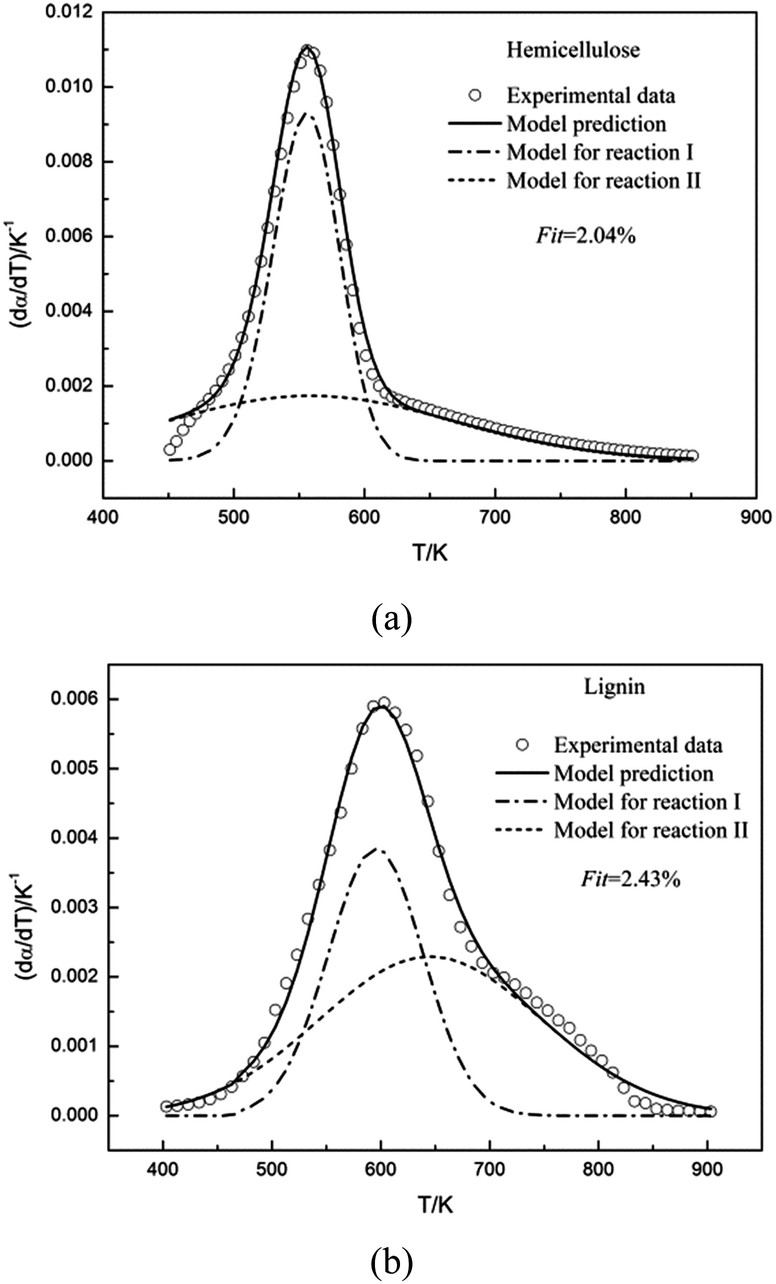 | ||
| Fig. 4 Experimental and calculated DTG curves of hemicellulose and lignin. | ||
The double Gaussian-DAEM-reaction model for hemicellulose can be explained by two partial reactions in terms of chemistry.38 Partial reaction I was fast and was characterized by a high volatile release and the formation of a solid product. Partial reaction I was mainly ascribed to cleavage of the glycosidic bonds, polymerization of the glycosyl units, and the decomposition of the sugar moiety within a narrow range of temperature (500–600 K). Partial reaction II was assigned to the fragmentation of other depolymerized units (xylan units), involving the slow charring process of the solid product which gave rise to a solid charred residual and further volatile formation.
The double Gaussian-DAEM-reaction model considering that two partial reactions take place with different activation energies was employed to fit the DTG curve of lignin. Predicted results from the optimum kinetic parameters have been compared with the experimental data. As is shown Fig. 4b, the double Gaussian-DAEM-reaction model predicts the experimental data very well for lignin. In Table 1 the kinetic parameters obtained from the fitting procedure for lignin pyrolysis were reported (E0,1 = 159.39 kJ mol−1, E0,2 = 174.19 kJ mol−1). According to reported literature,9 the single Gaussian-DAEM-reaction model was generally used to investigate the pyrolysis process of hemicellulose. Mahinpey9 studied the kinetic pyrolysis of lignin using the single Gaussian-DAEM-reaction model reaction model, and found the maximum activation energy in the range of 158–170 kJ mol−1, which was close to the values of the kinetic parameters for lignin using the double Gaussian-DAEM-reaction model in this study. However, as stated earlier in part 3.1.3, the single Gaussian-DAEM-reaction model resulted in larger deviations than the double Gaussian-DAEM-reaction model. Besides, the calculated value of Fit in eqn (7) (Fit = 7.57%) was much larger than the double Gaussian-DAEM-reaction model (Fit = 2.04%). Therefore, the pyrolysis kinetics of lignin could be described more accurately using the double Gaussian-DAEM-reaction model than traditional single Gaussian-DAEM-reaction model. Base above analysis, it can be concluded that the double Gaussian-DAEM-reaction model is an effective tool for determining the pyrolysis profiles of lignin.
Várhegyi et al.32 reported that lignin pyrolysis resulted in 30–35% char and a large amount of low molecular mass volatiles. The two partial reactions proposed in this study could describe the thermal decomposition behavior of lignin. Partial reaction I was attributed to the formation of low molecular mass products, corresponding to the scission of various oxygen functional groups exited in lignin. Since different oxygen functionalities having different thermal stability, their scission takes place at different temperatures (500 to 700 K). Partial reaction II was assigned to the complex charring forming process involving the complete rearrangement of the carbon skeleton and the release of gas products.
3.3 α(T) curves
From a mathematical point of view, the α(T) and the DTG curves are not equivalent. Accordingly, we also tested how effective the model is to predict the α(T) curves with the same parameters obtained from the evaluation of the DTG curves. In theory, the model could describe the changes of the degree of conversion as a function of temperature by integrating the calculated DTG curve. Fig. 5 showed that this approach resulted in a good fit for cellulose based on the parameters obtained from the single Gaussian-DAEM-reaction model, and for hemicellulose and lignin based on the parameters obtained from the double Gaussian-DAEM-reaction model.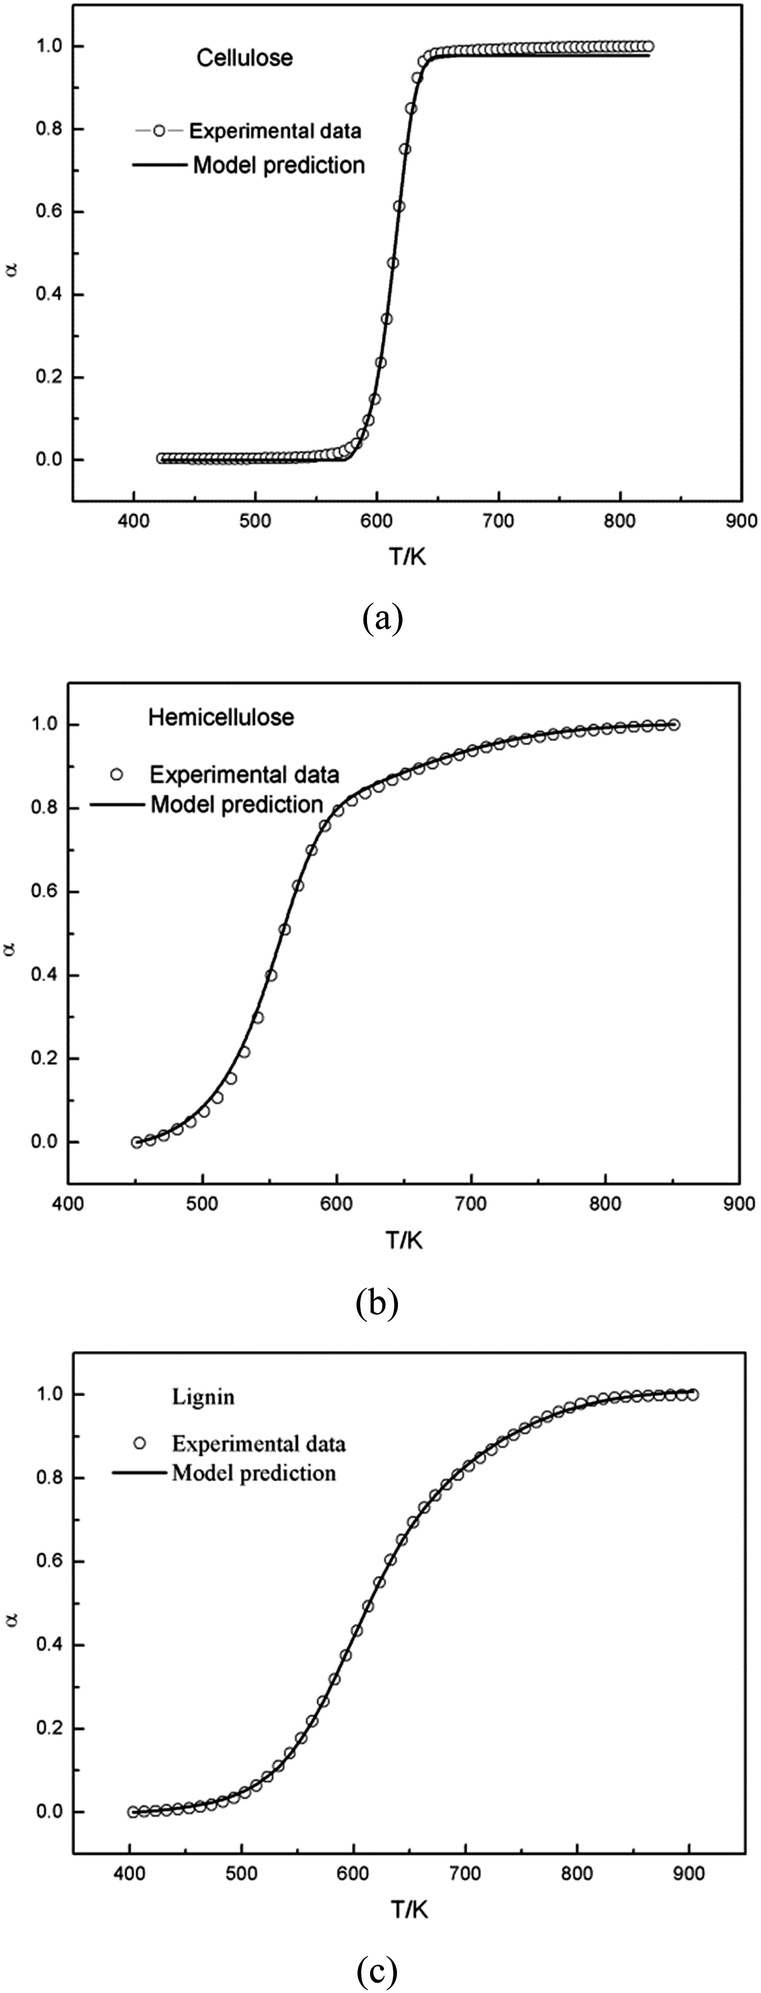 | ||
| Fig. 5 Experimental and calculated α(T) curves of cellulose, hemicellulose and lignin by integrating the calculated DTG curve. | ||
3.4 f(E) curves
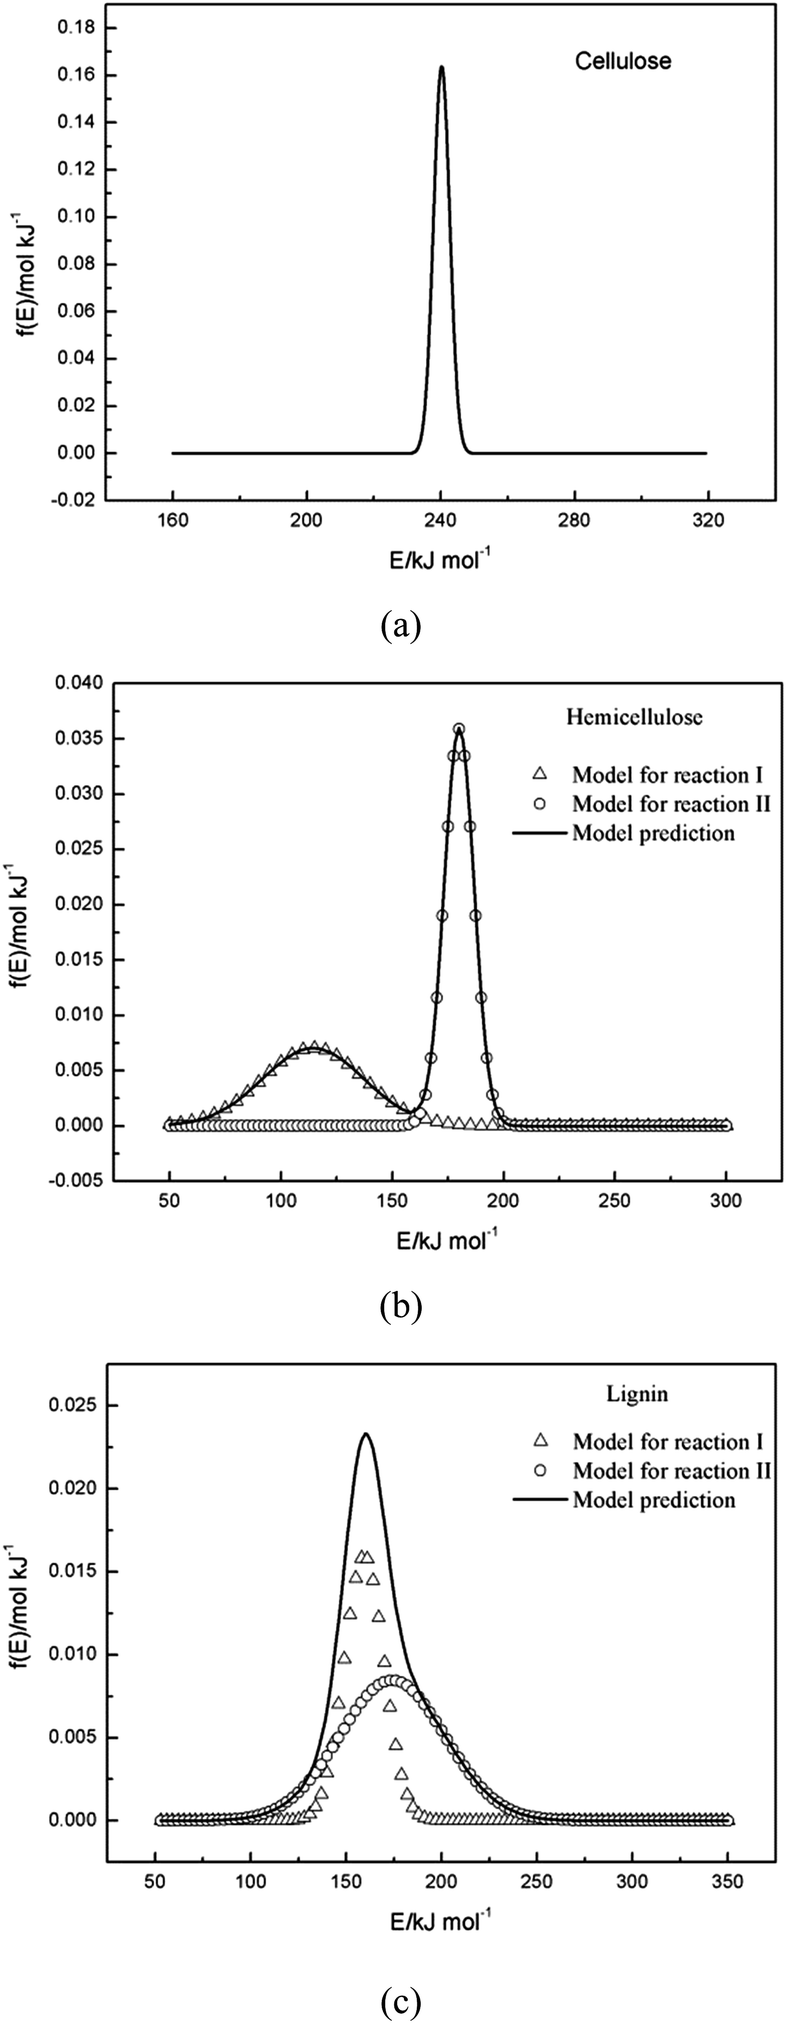 | ||
| Fig. 6 The f(E) curves estimated for cellulose, hemicellulose and lignin. | ||
4. Conclusions
The pyrolysis processes of cellulose, hemicellulose and lignin were investigated by TGA in N2 atmosphere with a nonisothermal temperature program. The single Gaussian-DAEM-reaction model could describe the data of cellulose very well, while it could not describe the data of hemicellulose or lignin correctly. In order to describe the thermal decompositions of hemicellulose and lignin more accurately, a novel double Gaussian-DAEM-reaction model considering two partial reactions was developed and used for the pyrolysis kinetics of hemicellulose and lignin. Calculated results from determined kinetic parameters provided a good fit for the DTG data of hemicellulose and lignin. The ranges of activation energies for cellulose, hemicellulose and lignin were 230–250 kJ mol−1, 90–200 kJ mol−1 and 100–230 kJ mol−1, respectively. Results from the modeling procedure indicated that the novel double Gaussian-DAEM-reaction model reported in this study is an effective and accurate at determining the pyrolysis behaviour of hemicellulose and lignin.Acknowledgements
Financial support from the National Basic Research Program of China (973 program, Grant no. 2011CB201502), National Natural Science Foundation of China through contract (Grant no. 11375249) and the “Strategic Priority Research Program” of Chinese Academy of Sciences (Grant no. XDA07010303) are greatly acknowledged.Notes and references
- L. Gašparovič, J. Labovský and J. Markoš, Chem. Biochem. Eng. Q., 2012, 26, 45 Search PubMed.
- Z. Li, C. Liu and Z. Chen, Bioresour. Technol., 2009, 100, 948 CrossRef CAS PubMed.
- T. Faravelli, A. Frassoldati and G. Migliavacca, Biomass Bioenergy, 2010, 34, 290 CrossRef CAS PubMed.
- F. Y. Ma, Y. L. Zeng and J. J. Wang, Bioresour. Technol., 2013, 128, 417 CrossRef CAS PubMed.
- S. Yaman, Energy Convers. Manage., 2004, 45, 651 CrossRef CAS.
- M. Balat, Energy Sources, Part A, 2008, 30, 620 CrossRef CAS.
- P. Giudicianni, G. Cardone and R. Ragucci, J. Anal. Appl. Pyrolysis, 2013, 100, 213 CrossRef CAS PubMed.
- S. Chu, A. V. Subrahmanyam and G. W. Huber, Green Chem., 2013, 15, 125 RSC.
- T. Mani, P. Murugan and N. Mahinpey, Ind. Eng. Chem. Res., 2009, 48, 1464 CrossRef CAS.
- J. Cho, S. Chu and P. J. Dauenhauer, Green Chem., 2012, 14, 428 RSC.
- P. Tiwari and M. Deo, AIChE J., 2012, 58, 505 CrossRef CAS.
- G. Varhegyi, H. Chen and S. Godoy, Energy Fuels, 2009, 23, 646 CrossRef CAS.
- J. A. Caballero and J. A. Conesa, J. Anal. Appl. Pyrolysis, 2005, 73, 85 CrossRef CAS PubMed.
- P. Budrugeac, J. Therm. Anal. Calorim., 2002, 68, 131 CrossRef CAS.
- A. Coats and J. Redfern, Nature, 1964, 201, 69 CrossRef.
- A. Soria-Verdugo, N. Garcia-Hernando and L. M. Garcia-Gutierrez, Energy Convers. Manage., 2013, 65, 239 CrossRef CAS PubMed.
- T. Sonobe and N. Worasuwannarak, Fuel, 2008, 87, 414 CrossRef CAS PubMed.
- K. Miura, Energy Fuels, 1995, 9, 302 CrossRef CAS.
- K. Miura and T. Maki, Energy Fuels, 1998, 12, 864 CrossRef CAS.
- M. Güneş and S. Güneş, Thermochim. Acta, 1999, 336, 93 CrossRef.
- H. Zhou, Y. Q. Long and A. H. Meng, Thermochim. Acta, 2013, 566, 36 CrossRef CAS PubMed.
- J. J. M. Orfão, F. J. A. Antunes and J. L. Figueiredo, Fuel, 1999, 78, 349 CrossRef.
- M. J. Antal, G. Várhegyi and E. Jakab, Ind. Eng. Chem. Res., 1998, 37, 1267 CrossRef CAS.
- J. M. Cai, W. X. Wu and R. H. Liu, Bioresour. Technol., 2013, 132, 423 CrossRef CAS PubMed.
- Z. Q. Li, W. M. Zhao, B. Hong and C. Liu, Bioresour. Technol., 2008, 99, 7616 CrossRef CAS PubMed.
- T. J. Chen, J. L. Wu and J. Z. Zhang, Bioresour. Technol., 2014, 153, 223 CrossRef CAS PubMed.
- T. J. Chen, C. Wu and R. H. Liu, Bioresour. Technol., 2011, 102, 6178 CrossRef CAS PubMed.
- J. H. Flynn and L. A. Wall, J. Res. Natl. Bur. Stand., 1966, 70, 487 CrossRef CAS.
- C. D. Doyle, J. Appl. Polym. Sci., 1961, 5, 285 CrossRef CAS.
- J. M. Cai and L. Q. Ji, J. Math. Chem., 2007, 42, 547 CrossRef CAS.
- V. B. Várhegyi, B. Z. Bobály and E. Jakab, Energy Fuels, 2010, 25, 24 CrossRef.
- G. Várhegyi, M. J. Antal Jr and E. Jakab, J. Anal. Appl. Pyrolysis, 1997, 42, 73 CrossRef.
- B. B. Uzun, E. Apaydin-Varol and F. Ateş, Fuel, 2010, 89, 176 CrossRef CAS PubMed.
- P. R. Patwardhan, R. C. Brown and B. H. Shanks, ChemSusChem, 2011, 4, 1629 CrossRef CAS PubMed.
- P. R. Patwardhan, R. C. Brown and B. H. Shanks, ChemSusChem, 2011, 4, 636 CrossRef CAS PubMed.
- P. R. Patwardhan, J. A. Satrio and R. C. Brown, Bioresour. Technol., 2010, 101, 4646 CrossRef CAS PubMed.
- J. M. Cai, S. Y. Yang and T. Li, Bioresour. Technol., 2011, 102, 3642 CrossRef CAS PubMed.
- C. Font Palma, Appl. Energy, 2013, 111, 129 CrossRef CAS PubMed.
- D. Ferdous, A. K. Dalai and S. K. Bej, Energy Fuels, 2002, 16, 1405 CrossRef CAS.
- J. M. Cai, W. X. Wu and R. H. Liu, Green Chem., 2013, 15, 1331 RSC.
| This journal is © The Royal Society of Chemistry 2014 |