 Open Access Article
Coherent state switching using vibrational polaritons in an asymmetric double-well potential†
Loïse
Attal
 a,
Florent
Calvo
 b,
Cyril
Falvo
 ab and
Pascal
Parneix
 *a
*a
aUniversité Paris-Saclay, CNRS, Institut des Sciences Moléculaires d'Orsay, 91405 Orsay, France. E-mail: pascal.parneix@universite-paris-saclay.fr
bUniversité Grenoble Alpes, CNRS, LIPhy, 38000 Grenoble, France
First published on 25th January 2024
Abstract
The quantum dynamics of vibrational polaritonic states arising from the interaction of a bistable molecule with the quantized mode of a Fabry–Perot microcavity is investigated using a generic asymmetric double-well potential as a simplified one-dimensional model of a reactive molecule. After discussing the role of the light–matter coupling strength in the emergence of avoided crossings between polaritonic states, we investigate the possibility of using these crossings to trigger a dynamical switching of these states from one potential well to the other. Two schemes are proposed to achieve this coherent state switching, either by preparing the molecule in an appropriate vibrational excited state before inserting it into the cavity, or by applying a short laser pulse inside the cavity to obtain a coherent superposition of polaritonic states. The respective influences of dipole moment amplitude and potential asymmetry on the coherent switching process are also discussed.
1 Introduction
Over the recent years, confining molecular systems inside small Fabry–Perot (FP) cavities has been suggested as a way to control their physical and chemical properties.1–10 Polaritonic chemistry, which exploits the quantization of the electromagnetic field inside such cavities and the resulting hybrid states that arise due to strong light–matter interactions, was first investigated using electronic transitions1–3 before being extended to vibrational degrees of freedom.4,5,8,11–14 The so-called polaritonic states could in principle enable greater control over chemical processes such as photoisomerization or reactivity, provided that the entanglement of the light–matter degrees of freedom survives on time scales longer than both the photon lifetime in the cavity and the molecular coherence time.So far, the changes in the molecular properties caused by vibrational strong coupling (VSC) in a cavity have been probed using various spectroscopy methods, including linear infrared (IR) spectroscopy,14,15 Raman spectroscopy11,16–18 as well as 2D-IR spectroscopy.19–21 Among the various properties that could be altered under VSC, energy transport, photochemical reactivity and thermally driven ground-state chemical reactions have been scrutinized.15,22–26 However, the difficulties inherent to these experiments27 have raised a number of controversies regarding their reproducibility28,29 and interpretation.27,30
From a general perspective, and since the vacuum field amplitude E0 of a confined light mode with frequency ωc and mode volume Vc is proportional to  strong coupling requires the FP cavity to be small, e.g. electronic polaritons typically require nanoscale cavities. For vibrational polaritons, since transitions occur in a prescribed electronic state, ωc typically lies in the range of 102–103 cm−1, leading to a cavity length L ≈ 1–10 μm. As shown by the Tavis-Cummings model,31 the light–matter coupling strength depends on the number N of molecules in the cavity and scales as
  motivating the use of dense media in most experimental studies so far. However, the formation of rovibrational polaritons of gaseous methane confined in a FP microcavity was very recently suggested.14 Besides allowing larger cavity volumes, diluted media enable much longer photon lifetimes, in excess of the nanosecond for the aforementioned work on methane.
The experimental results on vibrational polaritons have opened a number of fundamental questions that stimulated the interest of the theoretical community,32–43 aimed at clarifying the role of dissipative effects in the cavity, the importance of dark states and the role of relaxation processes such as intramolecular vibrational relaxation. For single molecules, vibrational polaritons have been extensively studied using simplified models such as Morse potentials32,34,35,37–39 or symmetric double-well potentials.37,44 Rovibrational polaritons have also been explored by including two cavity modes with orthogonal polarisation,41 and particular interest for the possibilities offered by multi-mode cavities has recently emerged.22,45,46 The case of an assembly of confined molecules interacting with each other was also studied, and the importance of dark states on the properties of the polaritonic states was specifically emphasized.36,42,43,47 However, with the exception of very recent efforts to treat polyatomic molecules fully coupled to the cavity at an ab initio level using cavity Born–Oppenheimer models,48,49 most theoretical studies have relied on quite simplified and low-dimensional models of the molecular systems used in experiments. Such approaches notably struggle to take into account the effects of the environment and the interaction mechanisms between polaritons.
In the present work, and building upon earlier efforts from Triana, Hernandez and coworkers,34,35,38 we consider a generic one-dimensional asymmetric double-well potential as a simplified model of the electronic ground state of a molecule undergoing a chemical reaction. Under sufficient coupling between the vibrational mode of the molecule and the electromagnetic mode of the cavity, stationary vibrational polaritonic states are formed. These hybrid light–matter states exhibit avoided crossings at specific values of the coupling strength that are used to trigger a coherent state switching between the two wells of the asymmetric potential. The localization of some polaritonic states in one potential well or the other is made possible by the asymmetry of the potential, which lifts the symmetry constraints that prevented the localization of the eigenstates in symmetric potentials. Different ways of altering the polaritonic states to induce coherent switching are considered, either by preparing the molecule in a specific vibrational state before inserting it into the cavity or by exposing the hybrid system to an external picosecond laser pulse. An efficient coherent state switching between vibrational polaritons located in each potential well is numerically observed for suitable values of the light–matter coupling strength.
In Section 2, the theoretical framework used to describe the one-dimensional model system and its interaction with the microcavity is presented, and some computational details are provided. The computational results are presented and discussed in Section 3, first for stationary states and then under the two out-of-equilibrium aforementioned conditions. Section 4 concludes the article by summarizing the main results and opening some perspectives for future efforts.
2 Theory
2.1 Hamiltonian
We consider a single molecule (N = 1) described by a simple one-dimensional model with coordinate q and momentum p, in vibrational strong coupling with a single-mode FP microcavity. The Pauli–Fierz Hamiltonian50 describing such a molecule interacting with the quantized electromagnetic mode of the cavity is given by| H = Hcav + Hmol + Hint, | (1) |
 | (2) |
The single-mode cavity Hamiltonian, which is characterized by its mode frequency ωc, can be written using the creation and annihilation operators as
| Hcav = ωca†a. | (3) |
 and on the dipole moment d of the molecule. In the following, the rotation of the molecule is neglected, and the dipole moment vector is assumed to be aligned with the polarization vector of the cavity mode. This allows us to only consider scalar quantities in the coupling Hamiltonian. By taking into account both the dipolar interaction and the dipole self-energy contribution,37 the molecule-light interaction can be written as
 | (4) |
 | (5) |
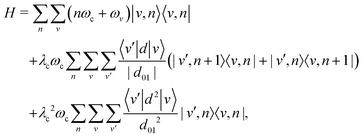
Using the vibrational eigenstates |v〉 of the free molecule and the cavity mode Fock states |n〉, the Pauli–Fierz Hamiltonian can be expressed in the uncoupled basis set |v,n〉 = |v〉⊗|n〉 as
 | (6) |
2.2 Asymmetric double-well potential
The vibrational Hamiltonian assumes the following asymmetric double-well potential mimicking a bistable molecule| V(q) = α0q4 − α1q2 + α2q, | (7) |
 . As we are mainly interested in the phenomenology of polaritonic chemistry, we have chosen to use values for these quantities that are not related to any particular chemical system but yield molecular positions, transition frequencies, and depths of the potential wells that are in the same orders of magnitude as realistic molecules, namely Angströms, hundreds of cm−1, and fractions of eVs. These values, reported in Table 1, yield the potential energy curve represented in Fig. 1(a). The discrete variable representation (DVR)51,52 was used to solve the 1D time-independent Schrödinger equation and determine the first bound states of the double-well asymmetric potential, assuming the same reduced mass of μ = 1.43 amu as employed by Triana et al.35 With the current parameters, the vibrational frequency ω01 of the deepest well is found at 557 cm−1, the second well having a lower fundamental frequency of 422.5 cm−1. The bound states of the asymmetric potential are also depicted in Fig. 1(a) with different colors for the two wells. Following this representation, the two wells will be referred to as left (
![[small script l]](https://www.rsc.org/images/entities/char_e146.gif) ) and right (r). The vibrational states corresponding to the left (resp. right) well will be denoted as v
) and right (r). The vibrational states corresponding to the left (resp. right) well will be denoted as v![[small script l]](https://www.rsc.org/images/entities/char_e146.gif) (resp. vr). With the current parameters, the left well is the deepest one and supports N
(resp. vr). With the current parameters, the left well is the deepest one and supports N![[small script l]](https://www.rsc.org/images/entities/char_e146.gif) = 6 vibrational states, while the right well contains Nr = 2 states. Higher vibrational states spread over the barrier and are not exclusively confined to either well. The cavity mode being in resonance with the first allowed vibrational transition, it corresponds to the transition between the two first levels of the left well, i.e. ωc = ω01 = 557 cm−1.
= 6 vibrational states, while the right well contains Nr = 2 states. Higher vibrational states spread over the barrier and are not exclusively confined to either well. The cavity mode being in resonance with the first allowed vibrational transition, it corresponds to the transition between the two first levels of the left well, i.e. ωc = ω01 = 557 cm−1.
![[small script l]](https://www.rsc.org/images/entities/char_e146.gif) and Nr of vibrational states localized in the two wells of the potential are also reported
and Nr of vibrational states localized in the two wells of the potential are also reported
| α 0 (a.u.) | α 1 (a.u.) | α 2 (a.u.) | ω 01 (cm−1) |
N
![[small script l]](https://www.rsc.org/images/entities/char_e146.gif)
|
N r |
|---|---|---|---|---|---|
| 1/2048 | 1/256 | 2 × 10⁻³ | 557 | 6 | 2 |
| γ 1 (a.u.) | δ 1 (a.u.) | γ 2 (a.u.) | δ 2 (a.u.) |
|---|---|---|---|
| 1 | 2 | 1 | 2 |
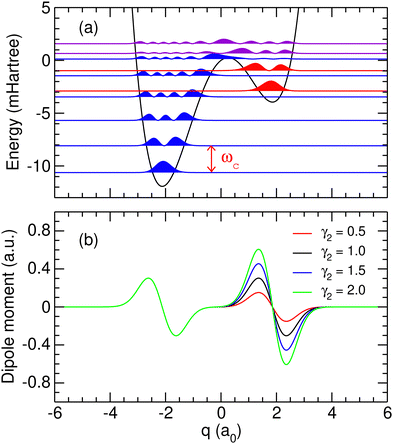 | ||
| Fig. 1 (a) Potential energy curve and probability densities of the ten lowest molecular eigenstates obtained using the parameters given in Table 1. Probability densities located in the left or right well are represented in blue and red, respectively, while the densities spreading over the barrier are represented in purple; (b) dipole moment functions obtained using the parameters given in Table 1 and several values of γ2 given in atomic units. | ||
2.3 Dipole moment function
To describe the light–matter interaction, we assume for simplicity that the molecule is non-polar in both wells and extend the work of Hernandez and Herrera34 to a double well-potential to obtain the empirical dipole moment function| d(q) = −γ1(q − q1)e−δ1(q−q1)2 − γ2(q − q2)e−δ2(q−q2)2, | (8) |
2.4 Polaritonic state properties
The hybrid light–matter polaritonic states |Pi〉 are obtained by diagonalization of the total Hamiltonian H using a finite number of vibrational states Nv and photonic states Np. These states can be written in the uncoupled basis set |v,n〉 as | (9) |
| 〈q〉i = 〈Pi|q|Pi〉, | (10) |
| 〈np〉i = 〈Pi|a†a|Pi〉. | (11) |
![[small script l]](https://www.rsc.org/images/entities/char_e146.gif) or r) is obtained from the value of 〈q〉i. For a symmetric well, the top of the barrier separating the two wells is at q = 0; therefore, the left well is characterized by 〈q〉 < 0 and the right one by 〈q〉 > 0. This remains essentially true for the asymmetric well considered here as the top of the barrier is only shifted by about 0.26 bohr. The sign of 〈q〉i will thus be used to determine the localization of the associated polariton |Pi〉.
or r) is obtained from the value of 〈q〉i. For a symmetric well, the top of the barrier separating the two wells is at q = 0; therefore, the left well is characterized by 〈q〉 < 0 and the right one by 〈q〉 > 0. This remains essentially true for the asymmetric well considered here as the top of the barrier is only shifted by about 0.26 bohr. The sign of 〈q〉i will thus be used to determine the localization of the associated polariton |Pi〉.
2.5 Infrared spectroscopy
The strength of the radiative coupling between two polaritonic states |Pi〉 and |Pj〉 can be characterized by | (12) |
At thermal equilibrium, the state of the confined system can be probed using IR spectroscopy. Denoting by β = 1/kBT, the inverse temperature (with kB the Boltzmann constant), the linear absorption intensity obtained with a laser excitation at frequency ω and characterized by a Gaussian spectral profile can be estimated by
 | (13) |
2.6 Polaritonic state evolution
The time evolution of an initial non-stationary state, denoted as |Ψ(t = 0)〉, can be obtained by solving the time-dependent Schrödinger equation (TDSE) at a given value of the coupling parameter λc. From a unitary transformation, the initial wavepacket can be decomposed linearly over the polaritonic states as | (14) |
 | (15) |
3 Results and discussion
All results presented below were obtained for a single molecule (N = 1) with a maximum number of Nv = 40 vibrational states and Np = 40 photons. These values ensure convergence for the polaritonic states studied here. Unless otherwise specified, the parameters used for the potential function are those reported in Table 1, notably γ2 = γ1 = 1.0 a.u.3.1 Avoided crossings and polariton localization
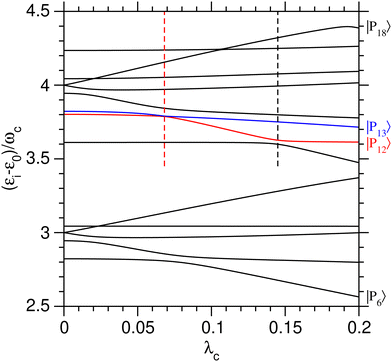
The role of the coupling parameter λc on vibrational polaritonic states is first discussed, with Fig. 2 showing the variations of their eigenenergies (relative to the ground polaritonic state) with increasing values of λc. At each value of the coupling parameter, the polaritonic states |Pi〉 are ordered by increasing energy. Since the investigated system features some true crossings, the label i associated with a given physical state may change depending on the value of λc. To study the coherent switching between the two wells, we focus on the energy range where both potential wells exist, while remaining below the barrier. As seen from Fig. 1(a), this typically corresponds to energies between 3ωc and 4ωc above the ground state. As shown by the corresponding assignments in Table 2, at λc = 0, five polaritonic states (|Pi〉 for i = 6–10) are located near 3ωc, while eight states (i = 11–18) reside near 4ωc. In this range, the eigenenergies of the polaritonic states are found to be generally sensitive to λc, with neighboring states often exhibiting avoided crossings.![[small script l]](https://www.rsc.org/images/entities/char_e146.gif) and r correspond to vibrational states localized in the left and right potential wells, respectively
and r correspond to vibrational states localized in the left and right potential wells, respectively
| Polariton | ε i − ε0 ∼ 3ωc | ε i − ε0 ∼ 4ωc |
|---|---|---|
| |Pi〉 | |v,n〉 | |v,n〉 |
| |P6〉 | |3![[small script l]](https://www.rsc.org/images/entities/char_e146.gif) ,0〉 ,0〉 |
|
| |P7〉 | |2![[small script l]](https://www.rsc.org/images/entities/char_e146.gif) ,1〉 ,1〉 |
|
| |P8〉 | |1![[small script l]](https://www.rsc.org/images/entities/char_e146.gif) ,2〉 ,2〉 |
|
| |P9〉 | |0![[small script l]](https://www.rsc.org/images/entities/char_e146.gif) ,3〉 ,3〉 |
|
| |P10〉 | |0r,0〉 | |
| |P11〉 | |4![[small script l]](https://www.rsc.org/images/entities/char_e146.gif) ,0〉 ,0〉 |
|
| |P12〉 | |1r,0〉 | |
| |P13〉 | |3![[small script l]](https://www.rsc.org/images/entities/char_e146.gif) ,1〉 ,1〉 |
|
| |P14〉 | |2![[small script l]](https://www.rsc.org/images/entities/char_e146.gif) ,2〉 ,2〉 |
|
| |P15〉 | |1![[small script l]](https://www.rsc.org/images/entities/char_e146.gif) ,3〉 ,3〉 |
|
| |P16〉 | |0![[small script l]](https://www.rsc.org/images/entities/char_e146.gif) ,4〉 ,4〉 |
|
| |P17〉 | |0r,1〉 | |
| |P18〉 | |5![[small script l]](https://www.rsc.org/images/entities/char_e146.gif) ,0〉 ,0〉 |
As seen in Fig. 2, several polaritonic states are doubly degenerated at λc = 0, as the consequence of the exact resonance condition between ωc and the first vibrational transition of the left potential well being met. As an example, |P8〉 and |P9〉 share the same energy at λc = 0 as they correspond to |0![[small script l]](https://www.rsc.org/images/entities/char_e146.gif) ,3〉 and |1
,3〉 and |1![[small script l]](https://www.rsc.org/images/entities/char_e146.gif) ,2〉, respectively (see Table 2). Note that the energies of states |2
,2〉, respectively (see Table 2). Note that the energies of states |2![[small script l]](https://www.rsc.org/images/entities/char_e146.gif) ,1〉 and |3
,1〉 and |3![[small script l]](https://www.rsc.org/images/entities/char_e146.gif) ,0〉 are shifted from the doubly degenerated value due to the anharmonicity of the potential well, which causes a detuning between the cavity mode frequency and the vibrational hot bands. A similar degeneracy occurs between |P15〉 and |P16〉, which, respectively, correspond to |0
,0〉 are shifted from the doubly degenerated value due to the anharmonicity of the potential well, which causes a detuning between the cavity mode frequency and the vibrational hot bands. A similar degeneracy occurs between |P15〉 and |P16〉, which, respectively, correspond to |0![[small script l]](https://www.rsc.org/images/entities/char_e146.gif) ,4〉 and |1
,4〉 and |1![[small script l]](https://www.rsc.org/images/entities/char_e146.gif) ,3〉 at λc = 0.
,3〉 at λc = 0.
Several avoided crossings are also visible in Fig. 2. As discussed in ref. 34, they occur when the main contributions in the |v,n〉 basis set of the two polaritonic states involved are characterized by |Δn| = 1. Near 3ωc, avoided crossings involve the (|P6〉, |P7〉) pair at λc ≃ 0.08, as well as the (|P7〉, |P8〉) pair at λc ≃ 0.02. The decomposition of these three polaritonic states in the uncoupled basis set shows that they only involve vibrational states sitting in the left potential well (〈q〉i < 0 for all values of λc), making those avoided crossings unsuitable to achieve coherent a switching between the two wells.
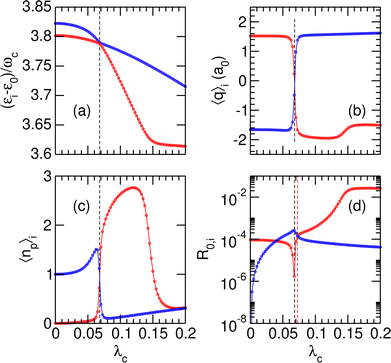
Two other avoided crossings can be found around 4ωc: between |P12〉 and |P13〉 at λc = 0.068 and between |P11〉 and |P12〉 at λc = 0.145. Fig. 3 focuses on the (|P12〉, |P13〉) pair and shows the variations of several properties associated with these two polaritonic states when λc increases, starting with their relative energies in Fig. 3(a). The corresponding variations of the average position 〈q〉i and photon number 〈np〉i are represented in panels (b) and (c) of the same figure. The first avoided crossing occurs at λcrit = 0.068 where the energy difference between |P12〉 and |P13〉 is as small as Δεcrit/ωc ≈ 3 × 10⁻³. As seen in Fig. 3(b), the system effectively switches between the two wells near this avoided crossing, with simultaneous switching of |P12〉 from the right well (〈q〉12 > 0 for λc < λcrit) to the left well (〈q〉12 < 0 for λc > λcrit) and of |P13〉 from left to right. The avoided crossing also strongly alters the average number of photons 〈np〉 in the two polaritonic states with |P12〉 suddenly gaining two photons and |P13〉 losing one photon.
The avoided crossing between |P11〉 and |P12〉 at λc = 0.145 induces only a minor shift in the energy and average position of the |P12〉 state [see Fig. 3(a) and (b)]. In particular, the system does not switch between the two wells at this value of the coupling strength (〈q〉12 does not change sign) as both |P11〉 and |P12〉 reside in the left well when approaching λc = 0.145. Only the photon number varies significantly near λc = 0.145, thus suggesting that this avoided crossing is due to a photon exchange between |P11〉 and |P12〉 rather than a coherent switching between the two wells.
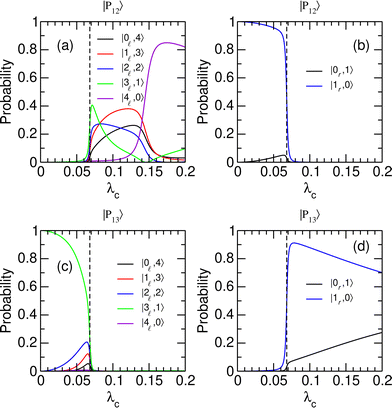
To better understand the evolution of the system near the avoided crossing at λcrit = 0.068, which is the only one leading to a switching between the two wells, we consider the decomposition of polaritonic states |P12〉 and |P13〉 in the |v,n〉 basis set. The weights of |P12〉 and |P13〉 on different uncoupled states are given in Fig. 4 as a function of λc. The distribution of the polaritonic states among the two potential wells is found to vary abruptly near λcrit, highlighting the extreme sensitivity of the coherent switching process to the strength of the light–matter coupling. As λc crosses λcrit from below, the polaritonic state |P12〉, which mostly involves the first excited state of the right well with no additional photon (|1r,0〉), turns into a mixture of vibrationally excited states of the left well with v![[small script l]](https://www.rsc.org/images/entities/char_e146.gif) = 0–4 and a complementary number np = 4 − v
= 0–4 and a complementary number np = 4 − v![[small script l]](https://www.rsc.org/images/entities/char_e146.gif) of photons [see Fig. 4(a) and (b)]. The significant weights carried by states with np > 1 explain the sudden increase in the average number of photons of |P12〉 found in Fig. 3(c). Concomitantly, the polaritonic state |P13〉 that occupied the left well in its third vibrationally excited state with one photon in the cavity (|3
of photons [see Fig. 4(a) and (b)]. The significant weights carried by states with np > 1 explain the sudden increase in the average number of photons of |P12〉 found in Fig. 3(c). Concomitantly, the polaritonic state |P13〉 that occupied the left well in its third vibrationally excited state with one photon in the cavity (|3![[small script l]](https://www.rsc.org/images/entities/char_e146.gif) ,1〉) is entirely transferred to the right well as a superposition of states |1r,0〉 and |0r,1〉 [see Fig. 4(c) and (d)]. This superposition is first dominated by the |1r,0〉 state while state |0r,1〉 gains in weight as λc increases. This trend is consistent with the evolution of the average number of photons in |P13〉 reported in Fig. 3(c).
,1〉) is entirely transferred to the right well as a superposition of states |1r,0〉 and |0r,1〉 [see Fig. 4(c) and (d)]. This superposition is first dominated by the |1r,0〉 state while state |0r,1〉 gains in weight as λc increases. This trend is consistent with the evolution of the average number of photons in |P13〉 reported in Fig. 3(c).
Considering the strong sensitivity of this phenomenon with respect to the coupling strength, the influence of the dipole moment function was also addressed by changing the value of γ2 in eqn (8), leaving the other parameters unaffected. The same phenomenology was obtained for all the studied values of γ2, and the critical coupling strengths λcrit computed for γ2 varying in the range 0.5–2.0 a.u. are given in Table 3. Since γ2 governs the dipole moment amplitude in the right well, the states |0r,1〉 and |1r,0〉 become increasingly coupled as this parameter increases. For small values of the coupling strength (λc < λcrit), the state |1r,0〉 is the main component of polariton |P12〉 [see Fig. 4(b)] and |0r,1〉 is a major component of |P17〉. The increasing coupling between these two states leads them to repel one another, and since |P17〉 has a higher energy than |P12〉, this stabilizes |P12〉 by lowering its energy. In contrast, the polaritonic state |P13〉 remains mostly unaffected as it lies in the left well. As seen in Table 3, this leads to an increase in the critical value λcrit of the avoided crossing upon increasing γ2. We also find that the energy difference Δεcrit at the critical coupling strength decreases with increasing values of γ2. Above the avoided crossing (λc > λcrit) |P12〉 and |P13〉 switch between wells, hence for larger coupling strengths |P12〉 is no longer affected by the value of γ2 while |P13〉 is stabilized when this parameter increases.
| γ 2 (a.u.) | λ crit (×10−3) | Δεcrit/ωc (×10−3) | λ R (×10−3) | ΔεR/ωc (×10−3) |
|---|---|---|---|---|
| 0.50 | 61.9 | 2.8 | 67.8 | 7.7 |
| 0.75 | 64.4 | 2.8 | 69.7 | 7.0 |
| 1.00 | 68.1 | 2.7 | 72.5 | 6.2 |
| 1.25 | 72.5 | 2.6 | 76.3 | 5.3 |
| 1.50 | 78.1 | 2.4 | 81.3 | 4.6 |
| 1.75 | 85.0 | 2.2 | 87.2 | 3.7 |
| 2.00 | 92.8 | 2.1 | 94.4 | 3.0 |
Finally, the radiative coupling R0,i between the polaritonic ground state |P0〉 and a given |Pi〉 (i = 12, 13) state is displayed in Fig. 3(d) as a function of increasing coupling strength λc. In the limit of small values of λc, the radiative coupling ratios R0,12 and R0,13 converge toward the values in the free molecule, namely |〈0![[small script l]](https://www.rsc.org/images/entities/char_e146.gif) |d|1r〉|2/|〈0
|d|1r〉|2/|〈0![[small script l]](https://www.rsc.org/images/entities/char_e146.gif) |d|1
|d|1![[small script l]](https://www.rsc.org/images/entities/char_e146.gif) 〉|2 ≃ 10−4 for the |P12〉 state and 〈0r,0|d|3
〉|2 ≃ 10−4 for the |P12〉 state and 〈0r,0|d|3![[small script l]](https://www.rsc.org/images/entities/char_e146.gif) ,1〉 = 〈0r|d|3
,1〉 = 〈0r|d|3![[small script l]](https://www.rsc.org/images/entities/char_e146.gif) 〉 × 〈0|1〉 = 0 for the |P13〉 state.
〉 × 〈0|1〉 = 0 for the |P13〉 state.
At higher values of λc, and especially near the critical coupling strength λcrit, the variations of the radiative coupling are quite strong [notice the logarithmic scale in Fig. 3(d)]. Another interesting feature is found for λc = 0.0725 = λR at which the two states |P12〉 and |P13〉 share the same radiative coupling strength. This particular value of λc is important since it allows the system to be prepared as a coherent superposition of these two polaritonic states, thus allowing some manipulation with a laser field. This possibility will be explored further and discussed in Section 3.2.2. The values of λR and the corresponding energy gaps ΔεR are also reported in Table 3 as a function of increasing γ2. As is the case with λcrit, λR increases with γ2, owing to greater resulting coupling in the right well. The associated energy gap ΔεR is found to decrease when γ2 increases, which we speculatively interpret as the consequence of the avoided crossing becoming increasingly sharper with increasing transition dipole moment.
3.2 Coherent state switching
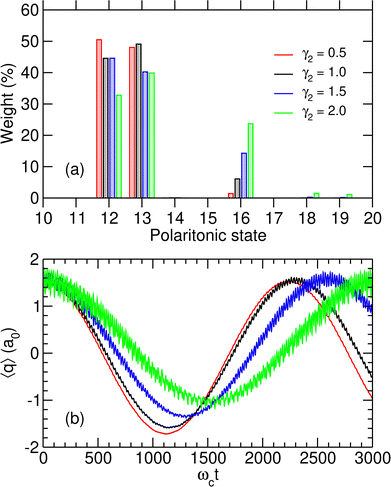
The time evolution of the wavepacket in the initially photon-less cavity is then followed by numerically solving the TDSE, starting from |1r,0〉. The effects of inserting the molecule in the microcavity at λc = λcrit are particularly spectacular with the system alternatively switching between the two wells with a period ranging from around 2200 to 3000 ωct, which using the parameters of Table 1 corresponds to 20–30 ps, depending on the value of γ2. This can be seen from the variations of 〈q〉(t) displayed in Fig. 5(b). Note that when varying γ2, the values of the coupling strength were adjusted to the corresponding critical values λcrit as given in Table 3.
By increasing γ2, the switching becomes less efficient and is associated with a longer period, as well as more significant fluctuations that are a manifestation of the importance of polaritonic states other than |P12〉 and |P13〉 in the decomposition of the initial state. The histogram of Fig. 5(a) reveals that these additional contributions are mostly due to state |P16〉, which plays an important role when γ2 increases and thus contributes to the additional high-frequency oscillations seen in Fig. 5(b). At λc = 0, |P16〉 is referred to as |P17〉 due to the true crossing occurring between λc = 0 and λcrit and corresponds to the uncoupled state |0r,1〉. However, it progressively gains weight on state |1r,0〉 as λc increases. The coupling between these two states being stronger when the dipole moment in the right well increases, the weight of polaritonic state |P16〉 in the decomposition of the initial state |1r,0〉 increases with γ2.
The situation considered here of the specific preparation of the system as it enters the microcavity is experimentally challenging, as it would typically require the molecules to be prepared in a uniformly excited flow perpendicular to the cavity axis. However, such experiments could be used to prepare molecules in either well of a bistable potential by adjusting their interaction time with the confined light. This could be done, e.g., by tuning the velocity of the molecular flow in order to synchronize the interaction time with the polaritonic oscillation period, and might enable a higher degree of control of the system state at the output of the cavity. As far as photon lifetimes are concerned, the switching period found with this model system would be far too long for liquid phase experiments but is compatible with measurements in the gas phase.14
 | (16) |
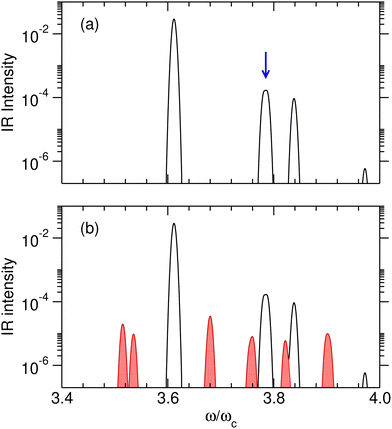
However, efficient switching requires strict control of this initial state, which may be difficult to achieve at high temperatures. Temperature effects were investigated specifically by calculating the IR absorption spectra at two temperatures T such that kBT/ωc = 0.05 and 0.15, corresponding to about 40 and 120 K, respectively. Calculations were conducted with the set of parameters reported in Table 1, including γ2 = 1.0 a.u., and at the coupling strength λc = λR. The relative IR absorption intensities obtained from eqn (13) and normalized by the intensity of the v = 0![[small script l]](https://www.rsc.org/images/entities/char_e146.gif) → 1
→ 1![[small script l]](https://www.rsc.org/images/entities/char_e146.gif) transition of the free molecule are shown in Fig. 6 at these two temperatures. At T = 0.05ωc/kB, only transitions starting from the ground polaritonic state can be distinguished. The most intense transition is found at ω/ωc ≈ 3.6 and corresponds to the overtone transition v = 0
transition of the free molecule are shown in Fig. 6 at these two temperatures. At T = 0.05ωc/kB, only transitions starting from the ground polaritonic state can be distinguished. The most intense transition is found at ω/ωc ≈ 3.6 and corresponds to the overtone transition v = 0![[small script l]](https://www.rsc.org/images/entities/char_e146.gif) → 4
→ 4![[small script l]](https://www.rsc.org/images/entities/char_e146.gif) that connects the ground polaritonic states |P0〉 to the excited state |P11〉. The two transitions leading from |P0〉 to either |P12〉 or |P13〉, which are nearly degenerate at this value of the coupling strength, appear as a unique feature around ω/ωc ≈ 3.78. At T = 0.15ωc/kB, extra lines appear as the signature of hot bands. In particular, three transitions arise at ω/ωc = 3.75 (|P2〉 → |P23〉), 3.76 (|P2〉 → |P24〉) and 3.82 (|P1〉 → |P21〉), near the targeted transition at 3.78ωc interest, and may interfere with the preparation of the desired initial superposition, making it difficult to prepare the system at this temperature. Hence, for this model system, kBT/ωc = 0.15 appears as an approximate upper limit below which the polaritonic states |P12〉 and |P13〉 can be superimposed in a coherent way, and above which other polaritonic states coming from hot bands would compromise this coherence.
that connects the ground polaritonic states |P0〉 to the excited state |P11〉. The two transitions leading from |P0〉 to either |P12〉 or |P13〉, which are nearly degenerate at this value of the coupling strength, appear as a unique feature around ω/ωc ≈ 3.78. At T = 0.15ωc/kB, extra lines appear as the signature of hot bands. In particular, three transitions arise at ω/ωc = 3.75 (|P2〉 → |P23〉), 3.76 (|P2〉 → |P24〉) and 3.82 (|P1〉 → |P21〉), near the targeted transition at 3.78ωc interest, and may interfere with the preparation of the desired initial superposition, making it difficult to prepare the system at this temperature. Hence, for this model system, kBT/ωc = 0.15 appears as an approximate upper limit below which the polaritonic states |P12〉 and |P13〉 can be superimposed in a coherent way, and above which other polaritonic states coming from hot bands would compromise this coherence.
The IR spectra shown in Fig. 6 are convoluted with a Gaussian function having a width at half maximum of 4 cm−1 (≈7.10−3ωc) to mimic the spectral width of a 15 ps laser. Under such conditions, the contributions of polaritonic states |P12〉 and |P13〉 cannot be distinguished and both states are therefore excited by the laser pulse. This is consistent with the very small energy gap between these states at λc = λR (with the present choice of parameters ΔεR ≈ 3.5 cm−1). Therefore, at low temperatures and for an IR excitation using a laser pulse with a spectral width on the order of ΔεR, the initial wavepacket |Ψ(t = 0)〉 can be prepared as  . Since R0,12 = R0,13 when λc = λR, the initial wavepacket |Ψ(t = 0)〉 can be rewritten as a coherent superposition,
  .
.
The TDSE was numerically solved using this initial condition for γ2 = 1.0 a.u. as well as other values of γ2 ranging from half to twice this value, with λc being adjusted to the new λR according to the values given in Table 3. γ2 is found to have only little influence on the spectral properties of the polaritonic system; therefore, the above discussion concerning the preparation of the initial state remains valid for other values of this parameter. The resulting time variations of the projected position 〈q〉 are represented in Fig. 7. Since only two polaritonic states are involved in the initial wavepacket, the time evolution of the system follows a Rabi oscillation. Coherent switching of the wavepacket between the two wells is clearly visible, with a period of about 920 to 2290 ωct, i.e. 8 to 20 ps, depending on the value of γ2. The period and the amplitude of the oscillation between the two potential wells both increase with this parameter, as a consequence of the decrease of the energy gap ΔεR between the two polaritonic eigenstates (see Table 3).
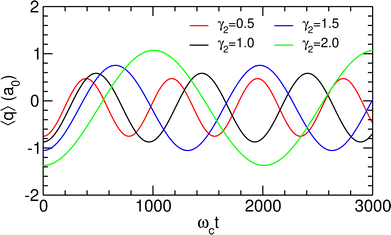 | ||
| Fig. 7 Projected position 〈q〉 as a function of time, as obtained for λc = λR assuming the initial wavepacket |Ψ(t = 0)〉 given in eqn (16), for different values of γ2 given in atomic units. | ||
For a molecule having different reactivity properties in the left and right wells, the preparation of such a superposition of polaritonic states near an avoided crossing could be efficiently used to control the outcome of the reaction. However, to exploit such features, experiments would have to be performed at low temperatures and would require damping processes to be minimized on the picosecond time scale, including photon loss inside the cavity and radiative or non-radiative relaxation processes of the molecules.
3.3 Influence of the potential asymmetry
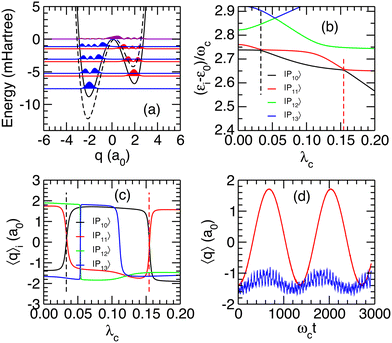
The robustness of the previous analysis was finally investigated by addressing the role of the asymmetry of the double-well potential, which is contained in parameter α2 of eqn (7). Leaving parameters α0 and α1 unchanged, α2 is divided by 4, leading to a potential with N![[small script l]](https://www.rsc.org/images/entities/char_e146.gif) = 4 and Nr = 3 bound states in the left and right parts of the potential, respectively. This alternative potential and the probability densities of its first bound states obtained from solving the Schrödinger equation are depicted in Fig. 8(a). Fixing γ2 = 0.5 a.u. throughout this section, the eigenenergies of the polaritonic states were determined as a function of the coupling strength λc. Partial results represented in Fig. 8(b) highlight the polaritonic states |P10〉 and |P11〉, which undergo two avoided crossings at λ(1)crit = 0.033 and λ(2)crit = 0.154. As shown from the average positions 〈q〉i in Fig. 8(c), these avoided crossings are both connected to transitions in which the system switches between the left and right wells of the potential.
= 4 and Nr = 3 bound states in the left and right parts of the potential, respectively. This alternative potential and the probability densities of its first bound states obtained from solving the Schrödinger equation are depicted in Fig. 8(a). Fixing γ2 = 0.5 a.u. throughout this section, the eigenenergies of the polaritonic states were determined as a function of the coupling strength λc. Partial results represented in Fig. 8(b) highlight the polaritonic states |P10〉 and |P11〉, which undergo two avoided crossings at λ(1)crit = 0.033 and λ(2)crit = 0.154. As shown from the average positions 〈q〉i in Fig. 8(c), these avoided crossings are both connected to transitions in which the system switches between the left and right wells of the potential.
In the limit of vanishing couplings, the polaritonic states |P10〉 and |P11〉 can be assigned to the |3![[small script l]](https://www.rsc.org/images/entities/char_e146.gif) ,0〉 and |1r,1〉 states, respectively, while in the vicinity of the two avoided crossings, |P10〉 and |P11〉 are mainly decomposed on the uncoupled states |3
,0〉 and |1r,1〉 states, respectively, while in the vicinity of the two avoided crossings, |P10〉 and |P11〉 are mainly decomposed on the uncoupled states |3![[small script l]](https://www.rsc.org/images/entities/char_e146.gif) ,0〉, |0r,2〉 and |1r,1〉. Preparing the system in the excited state v = 3
,0〉, |0r,2〉 and |1r,1〉. Preparing the system in the excited state v = 3![[small script l]](https://www.rsc.org/images/entities/char_e146.gif) before entering an initially photon-less cavity, leading to an initial state |3
before entering an initially photon-less cavity, leading to an initial state |3![[small script l]](https://www.rsc.org/images/entities/char_e146.gif) ,0〉, can thus be expected to produce the polaritonic states involved in these avoided crossings. The weights Wi = |〈Pi|3
,0〉, can thus be expected to produce the polaritonic states involved in these avoided crossings. The weights Wi = |〈Pi|3![[small script l]](https://www.rsc.org/images/entities/char_e146.gif) ,0〉|2 of this initial state on the four polaritonic states |Pi〉, i = 10–13 are reported in Table 4 for the two values of λcrit. As can be seen in this table, at λ(1)crit = 0.033, the two polaritonic states |P10〉 and |P11〉 together represent over 99% of the |3
,0〉|2 of this initial state on the four polaritonic states |Pi〉, i = 10–13 are reported in Table 4 for the two values of λcrit. As can be seen in this table, at λ(1)crit = 0.033, the two polaritonic states |P10〉 and |P11〉 together represent over 99% of the |3![[small script l]](https://www.rsc.org/images/entities/char_e146.gif) ,0〉 wavepacket, indicating that it can effectively be considered as a linear combination of the polaritonic states |P10〉 and |P11〉 alone:
,0〉 wavepacket, indicating that it can effectively be considered as a linear combination of the polaritonic states |P10〉 and |P11〉 alone:
 | (17) |
![[small script l]](https://www.rsc.org/images/entities/char_e146.gif) ,0〉 on the four polaritonic states |Pi〉 with i = 10–13, near the two avoided crossings. Σ corresponds to the sum of these four weights
,0〉 on the four polaritonic states |Pi〉 with i = 10–13, near the two avoided crossings. Σ corresponds to the sum of these four weights
| λ crit | W 10 | W 11 | W 12 | W 13 | Σ |
|---|---|---|---|---|---|
| 0.033 | 55.0% | 44.3% | — | 0.5% | 99.8% |
| 0.154 | 6.6% | 5.5% | 78.1% | 7.5% | 97.7% |
For the second avoided crossing at λ(2)crit = 0.154, the |3![[small script l]](https://www.rsc.org/images/entities/char_e146.gif) ,0〉 state is no longer a superposition of the polaritonic states |P10〉 and |P11〉 as it now mainly involves |P12〉 and has a non negligible weight on |P13〉. In the limit of vanishing couplings, the polaritonic states |P12〉 and |P13〉 can be assigned to the |0r,2〉 and |2
,0〉 state is no longer a superposition of the polaritonic states |P10〉 and |P11〉 as it now mainly involves |P12〉 and has a non negligible weight on |P13〉. In the limit of vanishing couplings, the polaritonic states |P12〉 and |P13〉 can be assigned to the |0r,2〉 and |2![[small script l]](https://www.rsc.org/images/entities/char_e146.gif) ,1〉 states, respectively. However, near λ(2)crit, the energy of |P12〉 approaches the energy of the initially prepared |3
,1〉 states, respectively. However, near λ(2)crit, the energy of |P12〉 approaches the energy of the initially prepared |3![[small script l]](https://www.rsc.org/images/entities/char_e146.gif) ,0〉 state, therefore explaining the large weight of this state on |P12〉. The average positions of |P12〉 and |P13〉 displayed in Fig. 8(c) show that both polaritonic states reside in the left well near λ(2)crit (〈q〉i < 0 for i = 12, 13). Hence, it is not surprising that no significant switching between the wells is found near this avoided crossing, as confirmed by the temporal evolution of 〈q〉(t) in Fig. 8(d).
,0〉 state, therefore explaining the large weight of this state on |P12〉. The average positions of |P12〉 and |P13〉 displayed in Fig. 8(c) show that both polaritonic states reside in the left well near λ(2)crit (〈q〉i < 0 for i = 12, 13). Hence, it is not surprising that no significant switching between the wells is found near this avoided crossing, as confirmed by the temporal evolution of 〈q〉(t) in Fig. 8(d).
4 Conclusion and perspectives
The strong interaction between a one-dimensional potential mimicking a bistable molecular system and a single-mode Fabry–Perot microcavity, leading to the formation of quantum polaritonic states, was computationally investigated using simple double-well potential and dipole moment models. Although largely phenomenological in nature, the present model aims to describe a flexible molecule or a reactive system undergoing intramolecular rearrangement such as proton transfer and is rather generic in this respect.Considering a cavity in resonance with the first vibrational transition, a rich phenomenology of polaritonic states was suggested by tuning the light–matter coupling strength around polaritonic avoided crossings, thereby exploring the idea of vacuum-modified chemistry. The possibility of coherently switching the molecular system between the two potential wells near avoided crossings that involve polaritonic states located in either well of the potential was theoretically demonstrated.
Two possible ways of inducing coherent state switching were considered. First with the preparation of the free molecule in a specific vibrational state before its insertion inside a cavity not containing any photon, as it could be achieved using a molecular beam perpendicular to the cavity. Alternatively, and assuming that (non-interacting) molecules are in thermal equilibrium inside the cavity, a suitable excitation by a picosecond laser of a wavepacket mixing two polaritonic states could also lead to coherent switching and produce a Rabi-like oscillation between the left and right wells. The robustness of these results with respect to the potential asymmetry and dipole parameters has been thoroughly studied.
The switching time was found to depend significantly on the details of the system, including the potential itself but also the dipole moment function. Although the focus was on non-polar states, the dipole moment function plays a key role in polaritonic chemistry35,38 and it would be worth extending the model to the cases where either of the states, if not both, are polar. More generally, the model could be made more realistic with the goal of opening more perspectives toward the measurement of some of the predicted effects and contributing to addressing the somewhat controversial field of polaritonic chemistry. One natural extension would be to focus on polyatomic molecules, starting with the triatomic case, and explore the possibility of transferring energy across vibrational modes by selectively playing on some polaritonic avoided crossings. Since the reactivity of polyatomic molecules might be enhanced when specific vibrational modes are excited, the coupling of the molecule with the confined light of the microcavity could lead to controlled reactivity.
Author contributions
Loïse Attal: conceptualization (equal), investigation (supporting), software (supporting), validation (equal), writing – original draft (lead), writing – review & editing (equal); Florent Calvo: conceptualization (equal), validation (equal), visualization (supporting), writing – original draft (supporting), writing – review & editing (equal); Cyril Falvo: conceptualization (equal), validation (equal), writing – original draft (supporting), writing – review & editing (equal); Pascal Parneix: conceptualization (equal), investigation (lead), software (lead), supervision (lead), validation (equal), visualization (lead), writing – original draft (lead), writing – review & editing (equal).Conflicts of interest
There are no conflicts to declare.Acknowledgements
The authors acknowledge financial support from GDR EMIE 3533. L. A. acknowledges financial support from MESRI through a PhD fellowship granted by the EDOM doctoral school.Notes and references
- T. Schwartz, J. Hutchison, C. Genet and T. Ebbesen, Phys. Rev. Lett., 2011, 106, 196405 CrossRef CAS PubMed.
- J. Hutchison, T. Schwartz, C. Genet, E. Devaux and T. Ebbesen, Angew. Chem., Int. Ed., 2012, 6, 1592–1596 CrossRef PubMed.
- S. Wang, A. Mika, J. A. Hutchison, C. Genet, A. J. M. W. Hosseini and T. Ebbesen, Nanoscale, 2014, 6, 7243–7248 RSC.
- J. P. Long and B. S. Simpkins, ACS Photonics, 2015, 2, 130–136 CrossRef CAS.
- B. S. Simpkins, K. Fears, W. Dressick, B. T. Spann, A. Dunkelberger and J. C. Owrutsky, ACS Photonics, 2015, 2, 1460–1467 CrossRef CAS.
- J. Flick, N. Rivera and P. Nareng, Nanophotonics, 2018, 7, 1479–1501 CrossRef CAS.
- R. F. Ribeiro, L. A. Martinez-Martinez, M. Du, J. Campos-Gonzalez-Angulo and J. Yuen-Zhou, Chem. Sci., 2018, 9, 6325–6339 RSC.
- A. Thomas, L. Lethuillier-Karl, K. Nagarajan, R. M. A. Vergauwe, J. George, T. Chervy, A. Shalabney, E. Devaux, C. Genet, J. Moran and T. W. Ebbesen, Science, 2019, 363, 615–619 CrossRef CAS PubMed.
- T. E. Li, A. Nitzan and J. E. Subotnik, Angew. Chem., 2021, 133, 15661–15668 CrossRef.
- X. Li, A. Mandal and P. Huo, J. Phys. Chem. Lett., 2021, 12, 6974–6982 CrossRef CAS PubMed.
- A. Shalabney, J. George, H. Hiura, J. A. Hutchison, C. Genet, P. Hellwig and T. Ebbesen, Angew. Chem., Int. Ed., 2015, 54, 7971–7975 CrossRef CAS PubMed.
- A. Thomas, J. George, A. Shalabney, M. Dryzhakov, S. Varma, J. Moran, T. Chervy, X. Zhong, E. Devaux, C. Genet, J. Hutchison and T. W. Ebbesen, Angew. Chem., 2016, 128, 11634–11638 CrossRef.
- W. M. Takele, F. Wackenhut, L. Piatkowski, A. J. Meixner and J. Waluk, J. Phys. Chem. B, 2020, 124, 5709–5716 CrossRef CAS PubMed.
- A. D. Wright, J. C. Nelson and M. L. Weichman, J. Am. Chem. Soc., 2023, 145, 5982–5987 CrossRef CAS PubMed.
- J. George, A. Shalabney, J. A. Hutchison, C. Genet and T. W. Ebbesen, J. Phys. Chem. Lett., 2015, 6, 1027–1031 CrossRef CAS PubMed.
- J. del Pino, J. Feist and F. J. Garcia-Vidal, J. Phys. Chem. C, 2015, 119, 29132–29137 CrossRef CAS.
- A. Strashko and J. Keeling, Phys. Rev. A, 2016, 94, 023843 CrossRef.
- W. Ahn and B. S. Simpkins, J. Phys. Chem. C, 2021, 125, 830–835 CrossRef CAS.
- P. Saurabh and S. Mukamel, J. Chem. Phys., 2016, 144, 124115 CrossRef PubMed.
- B. Cohn, S. Sufrin and L. Chuntonov, J. Chem. Phys., 2022, 156, 121101 CrossRef CAS PubMed.
- X. Xiong, Acc. Chem. Res., 2023, 56, 776–786 CrossRef PubMed.
- J. George, T. Chervy, A. Shalabney, E. Devaux, H. Hiura, C. Genet and T. W. Ebbesen, Phys. Rev. Lett., 2016, 117, 153601 CrossRef PubMed.
- M. Muallem, A. Palatnik, G. D. Nessim and Y. Tischler, J. Phys. Chem. Lett., 2016, 7, 2002–2008 CrossRef CAS PubMed.
- R. M. A. Vergauwe, J. George, T. Chervy, J. A. Hutchison, A. Shalabney, V. Y. Torbeev and T. W. Ebbesen, J. Phys. Chem. Lett., 2016, 7, 4159–4164 CrossRef CAS PubMed.
- O. Kapon, R. Yitzhari, A. Palatnik and Y. R. Tischler, J. Phys. Chem. C, 2017, 121, 18845–18853 CrossRef CAS.
- S. Takahashi, K. Watanabe and Y. Matsumoto, J. Chem. Phys., 2019, 151, 074703 CrossRef PubMed.
- B. S. Simpkins, A. D. Dunkerberger and J. C. Owrutsky, J. Phys. Chem. C, 2021, 125, 19081–19087 CrossRef CAS.
- M. V. Imperatore, J. B. Asbury and N. C. Giebink, J. Chem. Phys., 2021, 154, 191103 CrossRef CAS PubMed.
- G. D. Wiesehan and W. Xiong, J. Chem. Phys., 2021, 155, 211103 CrossRef PubMed.
- P. A. Thomas, W. J. Tan, V. G. Kravets, A. N. Grigorenko and W. L. Barnes, Adv. Mater., 2023, 2309393 Search PubMed , in press.
- M. Tavis and F. W. Cummings, Phys. Rev., 1968, 170, 379–384 CrossRef.
- G. Groenhof and J. J. Toppari, J. Phys. Chem. Lett., 2018, 9, 4848–4851 CrossRef CAS PubMed.
- R. F. Ribeiro, A. D. Dunkelberger, B. Xiang, W. Xiong, B. Simpkins, J. Owrutsky and J. Yuen-Zhou, J. Phys. Chem. Lett., 2018, 9, 3766–3771 CrossRef PubMed.
- F. J. Hernandez and F. Herrera, J. Chem. Phys., 2019, 151, 144116 CrossRef PubMed.
- J. F. Triana, F. J. Hernandez and F. Herrera, J. Chem. Phys., 2020, 152, 234111 CrossRef CAS PubMed.
- F. Herrera and J. Owrutsky, J. Chem. Phys., 2020, 152, 100902 CrossRef CAS PubMed.
- E. W. Fischer and P. Saalfrank, J. Chem. Phys., 2020, 154, 104311 CrossRef PubMed.
- J. F. Triana and J. L. Sanz-Vicario, J. Chem. Phys., 2021, 154, 094120 CrossRef CAS PubMed.
- T. E. Li, A. Nitzan and J. E. Subotnik, J. Chem. Phys., 2021, 154, 094124 CrossRef CAS PubMed.
- D. S. Wang and S. F. Yelin, ACS Photonics, 2021, 8, 2818–2826 CrossRef CAS.
- E. W. Fischer and P. Saalfrank, J. Chem. Phys., 2022, 157, 034305 CrossRef CAS PubMed.
- A. Mandal, X. Li and P. Huo, J. Chem. Phys., 2022, 156, 014101 CrossRef CAS PubMed.
- J. A. Gòmez and O. Vendrell, J. Phys. Chem. A, 2023, 127, 1598–1608 CrossRef PubMed.
- E. W. Fischer, J. Anders and P. Saalfrank, J. Chem. Phys., 2022, 156, 154305 CrossRef CAS PubMed.
- M. Balasubrahmaniyam, C. Genet and T. Schwartz, Phys. Rev. B, 2021, 103, L241407 CrossRef CAS.
- A. Mandal, D. Xu, A. Mahajan, J. Lee, M. Delor and D. R. Reichman, Nano Lett., 2023, 23, 4082–4089 CrossRef CAS PubMed.
- I. S. Ulusoy, J. A. Gomez and O. Vendrell, J. Phys. Chem. A, 2019, 123, 8832–8844 CrossRef CAS PubMed.
- T. Schnappinger, D. Sidler, M. Ruggenthaler, A. Rubio and M. Kowalewski, J. Phys. Chem. Lett., 2023, 14, 8024–8033 CrossRef CAS PubMed.
- T. Schnappinger and M. Kowalewski, J. Chem. Theory Comput., 2023, 19, 9278–9289 CrossRef CAS PubMed.
- W. Pauli and M. Fierz, Nuovo Cimento, 1938, 15, 167–188 CrossRef CAS.
- J. V. Lill, G. A. Parker and J. Light, Chem. Phys. Lett., 1982, 89, 483–489 CrossRef CAS.
- J. V. Lill, G. A. Parker and J. Light, J. Chem. Phys., 1985, 85, 900–910 CrossRef.
Footnote |
| † Electronic supplementary information (ESI) available. See DOI: https://doi.org/10.1039/d3cp05568j |
| This journal is © the Owner Societies 2024 |

