 Open Access Article
Creative Commons Attribution 3.0 Unported Licence
Swelling-induced patterning in soft microchannels†
Haolin
Li
 a,
Aidan
Retallick
 b,
Anne
Juel
 a,
Matthias
Heil
 b and
Draga
Pihler-Puzović
 *a
*a
aDepartment of Physics & Astronomy and Manchester Centre of Nonlinear Dynamics, University of Manchester, Oxford Road, Manchester M13 9PL, UK. E-mail: draga.pihler-puzovic@manchester.ac.uk
bDepartment of Mathematics and Manchester Centre of Nonlinear Dynamics, University of Manchester, Oxford Road, Manchester M13 9PL, UK
First published on 12th October 2023
Abstract
We study the effect of inflation on the swelling-induced wrinkling of thin elastic membranes in a set-up that is commonly used to create microchannels in lab-on-chip applications. Using a combination of experiments and associated numerical simulations, we demonstrate that the out-of-plane deformation of the inflated membrane and the resulting anisotropic stress lead to two distinct instabilities as the swelling progresses. The membrane first develops small-amplitude wrinkles that retain the cross-channel symmetry. Their wavelength depends on the pressure and is set in a process similar to the axisymmetric buckling of pressurised, uni-axially compressed cylindrical shells. As swelling increases, the membrane undergoes a secondary instability during which the wrinkles coarsen into large-amplitude folds whose morphology can be controlled by the degree of pre-inflation. We elucidate the fundamental mechanisms responsible for this behaviour and explain how inflation can be used as a control mechanism in the manufacture of microchannels.
1 Introduction
Soft structures, such as polymeric membranes and biological tissues, readily undergo deformations due to mechanical actuation and intermolecular interactions.1–6 The stresses induced by these deformations can initiate buckling instabilities which are particularly common if the structure is thin and becomes subject to in-plane compression. In many engineering applications buckling is undesired and its occurrence indicates mechanical failure. However, constructive use of such instabilities has recently brought an explosion of their applications in robotics,7 surface science (in wetting,8 adhesion,9 and friction10), electronics,11 renewable energy,12 bio-13,14 and nano-sciences.15–17The current study is motivated by the use of buckling instabilities for manufacturing patterned microchannels. In many lab-on-chip-type applications, the shape of the microchannels is important because it affects the flow and can therefore be used to enhance mixing,18,19 focus flow, and guide and sort particles.20–22 For example, compared to smooth-walled microchannels, the length scale of mixing can be reduced by an order of magnitude by introducing moderate amplitude corrugations to the wall shape.18 One way of manufacturing patterned microchannels is to exploit buckle delamination due to swelling of a thin surface layer.23 The swelling creates internal stresses which cause the layer to detach from an underlying substrate along regions of weakened adhesion created by a preparatory surface treatment. Takahashi et al.23 performed a comprehensive experimental study to classify the different channel morphologies which can be produced by this procedure, using a thin hydrogel layer. They have found that, generally, the layer tends to detach from the low-adhesion regions by initially creating a microchannel with an axially uniform, symmetric cross-section. However, upon further swelling, the detached surface layer evolves via symmetry-breaking into worm-like patterns, characterised by the crest snaking between channel sides. This simultaneously breaks axial and cross-channel symmetries of the system, resulting in patterns with axial wavelengths comparable to the width of the low-adhesion regions. At even larger levels of swelling, such shapes become subject to further period doubling instabilities in which individual wrinkles merge with their neighbours, creating multiscale hierarchical structures of coarsened folds.24 The resulting microchannels are delicate, but could be stabilised by adding a second tougher layer on top of the swollen channel, thus creating a “layer-stack device” capable of conveying fluids at large pressures.25
Once delaminated, the behaviour of the detached surface layer studied in ref. 23 is similar to that of a horizontally pre-stressed, but otherwise unsupported membrane. Indeed, theoretical studies of a membrane's response to increasing in-plane stresses26,27 confirmed the experimental observations by ref. 23, predicting the same sequence of symmetry breaking instabilities observed in their experiments.
In this paper we demonstrate that the inflation of the membrane prior to the onset of swelling provides additional control over its ultimate shape. Specifically, pressurisation is shown (i) to systematically reduce the primary axial wavelength of the buckling pattern and (ii) to change the sequence of symmetry breaking instabilities which alter the buckling patterns in swelling membranes. This allows the manufacture of varicose microchannels, which have undulations only along the axial direction of the channel. Similar patterns were predicted by ref. 26 for small Poisson's ratios, but were not previously attainable for the incompressible materials typically used in microfluidics applications. At a larger degree of the swelling, we also observe cross-channel symmetry breaking instabilities which create worm-like morphologies; they arise via a period doubling of the pattern created during the initial instability. At larger pressures, however, the onset of this symmetry breaking instability is delayed, and instead large-amplitude symmetric folds which span the entire width of the channel are formed. Our theoretical analysis allows us to draw parallels between the initial wrinkling in our swelling membranes and pressurised elastic shells under uniaxial compression.28 When subjected to such compression, cylindrical shells are known to undergo pattern transitions,29–31e.g. from varicose wrinkling into diamond-like modes. Curvature-induced buckling transitions were explored extensively for the fabrication of hierarchical surface patterns in soft bilayer systems, in which thin stiffer films topped softer (cylindrical and planar) substrates.32–34 In our experiments, we observe related, but distinct pattern transitions induced by the membrane inflation; our numerical simulations elucidate the underlying physical mechanisms.
2 Methods
2.1 Experimental methods
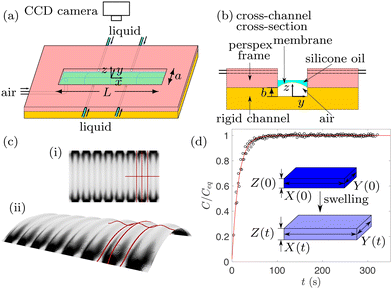
An ultra-thin spin-coated PDMS membrane of thickness h0 = 26.98 ± 0.16 μm was bonded onto a rigid rectangular base channel of length L = 48.62 ± 0.01 mm, width a = 4.93 ± 0.01 mm and depth b = 99.94 ± 3.23 μm made from the same PDMS to form a soft microchannel shown schematically in Fig. 1(a) and (b). The PDMS (Sylgard 184 silicone elastomer) was prepared by mixing PDMS monomer and curing agent in a 10![[thin space (1/6-em)]](https://www.rsc.org/images/entities/char_2009.gif) :
:![[thin space (1/6-em)]](https://www.rsc.org/images/entities/char_2009.gif) 1 weight ratio, resulting in the Young's modulus E = 1.99 ± 0.04 MPa and Poisson's ratio ν = 0.495,35 which stay approximately constant even after swelling. During microchannel manufacturing, the PDMS was heated to 85 °C to speed up cross-linking of the polymers and then cooled down to room temperature, resulting in a tensile pre-stress in the membrane. Prior to each experiment, the membrane was inflated by supplying a constant air pressure P between 150 Pa and 1800 Pa via a pressure controller (OB1 MK3+ Flow controller) which was independently calibrated using an ultralow pressure sensor (Honeywell 164PC01D37). The inflated membrane was then swollen by depositing 0.5 mL of 20 cSt silicone oil (Basildon Chemicals) using a syringe pump, so that the liquid completely covered the inflated membrane within 2 s. The reproducibility of results was tested by repeating experiments three times at the same parameter values, each time in a freshly fabricated microchannel. Note that the microchannel in ref. 23 and 25 consisted entirely of the delaminated void, while we refer to the whole structure in Fig. 1(a) and (b) as the “microchannel”; however, the depth b of the rectangular base does not affect the behavior reported below and can be set independently for any practical applications.
1 weight ratio, resulting in the Young's modulus E = 1.99 ± 0.04 MPa and Poisson's ratio ν = 0.495,35 which stay approximately constant even after swelling. During microchannel manufacturing, the PDMS was heated to 85 °C to speed up cross-linking of the polymers and then cooled down to room temperature, resulting in a tensile pre-stress in the membrane. Prior to each experiment, the membrane was inflated by supplying a constant air pressure P between 150 Pa and 1800 Pa via a pressure controller (OB1 MK3+ Flow controller) which was independently calibrated using an ultralow pressure sensor (Honeywell 164PC01D37). The inflated membrane was then swollen by depositing 0.5 mL of 20 cSt silicone oil (Basildon Chemicals) using a syringe pump, so that the liquid completely covered the inflated membrane within 2 s. The reproducibility of results was tested by repeating experiments three times at the same parameter values, each time in a freshly fabricated microchannel. Note that the microchannel in ref. 23 and 25 consisted entirely of the delaminated void, while we refer to the whole structure in Fig. 1(a) and (b) as the “microchannel”; however, the depth b of the rectangular base does not affect the behavior reported below and can be set independently for any practical applications.
In order to visualise the wrinkling patterns of the transparent PDMS membrane covered by silicone oil, the microchannel was back lit with LEDs; the pattern evolution resulting from swelling was captured by a top-view CMOS camera (Teledyne Dalsa CR-GM00-H1400, resolution 1400 × 1024 pixels) at 10 frames per second. Schematics in Fig. 1(c) show a typical top view of wrinkles in panel (i), and the corresponding vertical deflection of the membrane in panel (ii), with lines highlighting periodic peaks and valleys of the wrinkling pattern. The spatial variation in light refraction through the PDMS and then the silicone oil results in regions of the membrane appearing darker or brighter where the local slope of the membrane deformation is larger or smaller, respectively. Both peaks and valleys of the undulating pattern are therefore bright, and are connected by darker regions.
The swelling continued until the equilibrium swelling state was reached at ≈2 min from the start of the experiment. The evolution of isotropic swelling was quantified by a one-dimensional swelling ratio  where the membrane has length X(t), width Y(t) and height Z(t) at time t (see the inset in Fig. 1(d)). We measured it in experiments with a PDMS membrane floating freely in 20 cSt silicone oil. The swelling ratio C was found to be well described by an exponentially evolving function of t, i.e.
 | (1) |
The membrane profiles before swelling and once the equilibrium swelling states were reached, were measured using a one-point profilometer (ConfocalDT 2421 measuring system with IFS2405-3 sensor, Micro-Epsilon) mounted on a 3D translation platform that translated at a speed of 2 mm s−1. The relative accuracy of these measurements is comprised of a positional accuracy related to the translation stage and a depth accuracy related to the confocal device, each estimated to be 1 μm. To measure the equilibrium swelling profiles, the excess oil covering the membrane had to be removed.
For more experimental details, see the ESI.†
2.2 Theoretical model
Following,26 we model the membrane deformation using the Föppl–von Kármán (FvK) equations | (2) |
 | (3) |
 | (4a) |
 | (4b) |
 | (4c) |
 | (5a) |
 | (5b) |
 | (5c) |
The model (2)–(5) is quasi-steady, and the membrane deformation for different values of P and C was obtained by numerical continuation. This was facilitated by the introduction of viscous forces of the form −μwt to the left hand side of eqn (2), where μ is a small positive damping factor. Starting from the steady solution of eqn (2)–(5) for given values of the parameters P and C, we incremented these parameters by a small amount and then time-stepped the equations until the kinetic energy of the membrane had become sufficiently small. The solution obtained by this procedure was then used as the initial guess for the solution of the steady equations, i.e. for μ = 0.
3 Results & discussion
3.1 Deformation prior to buckling
Prior to the onset of wrinkling instabilities, the membrane deformation in the central part of the channel is relatively simple (see Fig. 2(a)) and approximately independent of the axial coordinate, x. If bending effects are neglected and the inflation/swelling of the membrane is assumed to induce a constant cross-channel tension, σyy, the membrane's cross section deforms into a circular arc, defined by a radius, R, and an opening angle θ. The axial and cross-channel strains in the membrane are then given by| exx = (1 − ν2)σ0/E − C and eyy = Rθ/a − 1 − C, | (6) |
 | (7) |
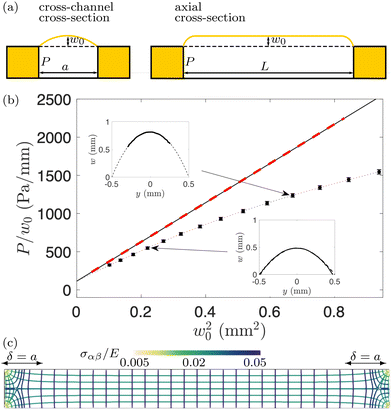 | ||
| Fig. 2 (a) Schematic diagram of the membrane shape prior to swelling. (b) The ratio of P/w0 for C = 0, plotted as a function of w02, as suggested by the bulge model (7). The symbols, connected by a dotted line, show the experimental data, with error bars indicating the standard deviation of measurements at different x-positions along the microchannel and from different microchannels; the solid black line shows the fit of eqn (7) with C = 0 to the experimental data; the red dashed line shows the results from the FvK model. The insets show representative experimental profiles (solid lines); the dashed lines are circular arcs, drawn to confirm that the shape of the membrane is indeed approximately circular. (c) Tension field of the inflated membrane computed using the FvK model for P = 493 Pa, C = 0. The lines show the direction of principal stresses, the colours indicate their magnitude. | ||
In the limit of small vertical deflections, we can also approximate the two principal stresses as
 | (8) |
For C = 0, eqn (7) simplifies to the standard form of the bulge model which suggests that a plot of P/w0 as a function of w02 should yield a straight line where the intercept with the vertical axis is a measure of the pre-stress, σ0.38Fig. 2(b) shows the plot of P/w0versus w02 for our membrane prior to swelling: the circular symbols with error bars represent the experimental data. Given the material properties of PDMS from Section 2.1, a fit of eqn (7) to the experimental data in the small displacement regime yielded a pre-stress of σ0 = 12.8 kPa. The fit is shown by the solid line and agrees well with the red dashed line which shows the corresponding data obtained from the numerical solution of the FvK equations. Both lines remain close to the experimental data up to pressures of P ≈ 500 Pa; beyond this value constitutive and geometric nonlinearities appear to play an increasingly important role.
The insets of Fig. 2(b) show typical transverse membrane profiles measured using the confocal device (solid curves). Note that the measurements proved to be difficult in regions where the membrane had a large slope. As a result, in the top left inset only the data in the central part of the membrane was accessible. The dashed lines are circular arcs fitted to the experimentally measured profiles, from which the vertical displacements w0 plotted in Fig. 2(b) were extracted. The plot confirms our assumption that the shape of the membrane's cross section resembles a circular arc.
The direction and the magnitude of the principal stresses obtained from the numerical solution of the FvK equations for P = 493 Pa are shown in Fig. 2(c). It confirms that the stress field in the central part of the channel is consistent with the assumptions made in the derivation of the bulge model and shows that end effects are restricted to a region of length δ ≈ a from the ends of the channel. Henceforth, we will focus on the central region of the channel which excludes any end effects, i.e. x ∈ [−L/2 + δ, L/2 − δ]. The results in Fig. 2(c) also show that, prior to swelling, the inflated membrane is stretched in all directions: the combination of the pre-stress, σ0, and the tension induced by the pressurisation of the membrane creates anisotropic tensile principal stresses, σyy > σxx > 0, i.e., the stress is larger in the cross-channel direction (along the y-axis).
3.2 Pattern evolution during swelling
Fig. 3 illustrates the deformation of the swelling membrane, pre-inflated by a pressure of P = 493 Pa, obtained experimentally (Fig. 3(a)) and in the corresponding numerical simulations (Fig. 3(b) and (c)). Here and in all remaining figures, top view images are cropped around the geometrical centre of the channel. Moving vertically down the columns, Fig. 3 shows that an increase in swelling leads to a transition between three distinct states: initially the membrane is inflated uniformly, with a symmetric vertical deflection across the channel and no variation along its length. The membrane then wrinkles in a varicose pattern, which breaks the axial uniformity but retains the cross-channel symmetry. As swelling increases, the amplitude of the initial wrinkles increases until a new coarser periodic pattern which breaks the cross-channel symmetry emerges. The agreement between the experimental observations and the numerical results is pleasing, though it is noticeable that the axial wavelength predicted by the computations is slightly smaller than that observed in the experiments.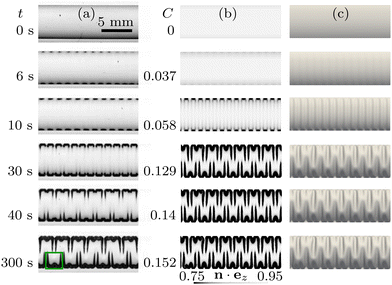 | ||
| Fig. 3 Top view of (a) the time-evolving buckling patterns in the experiment, and (b) and (c) the corresponding evolution of the patterns with increasing swelling ratio C in the numerical simulations, when P = 493 Pa. The swelling ratio C is related to time t from the start of the experiment viaeqn (1). The data in (b) and (c) is identical, except the colours in (b) are chosen to resemble experimental images and correspond to a grayscale contour plot of the vertical component of the unit normal n to the membrane, n·ez, so that darker regions indicate larger membrane slopes, while the shading in (c) corresponds to illumination of the membrane by ambient light. A close-up of the region enclosed by the green box in column (a) is shown in Fig. 4(a). | ||
The green box in Fig. 3 identifies the smallest repeating unit in the final pattern obtained in the experiments. Fig. 4(a) provides a zoomed-in version of this region to show that the pattern has a hierarchical structure: the axial wavelength of the coarsened pattern, λfold, is equal to two wavelengths of the original wrinkling pattern, λfold = 2λwrinkle, but we also observe the formation of shorter wrinkles close to the boundary. To illustrate the spatial distribution of these patterns, we extracted the wavelength λ of the coarsened pattern at different y-coordinates (i.e. across the channel), as shown with the arrows in Fig. 4(a), and averaged this data along the channel length. The resulting wavelengths are shown in Fig. 4(b) where the error bars represent the standard deviation of the data. We observe intervals of approximately constant wavelength, connected by shorter intervals within which the wavelength adjusts from one generation of wrinkles to the next (see, e.g., the data in the vicinity of y/a = −0.3). Three distinct plateaus in the value of λ emerge and are shown with gray shading to encompass data from repeated experimental runs. All plateau values are closely related to the wrinkling wavelength λwrinkle observed in the varicose pattern in Fig. 3(a). Fig. 4(b) also shows wavelengths extracted from the numerical simulation shown in Fig. 3(b) and (c). It is again noticeable that the axial wavelength predicted by the computations is slightly smaller than that observed in the experiments.
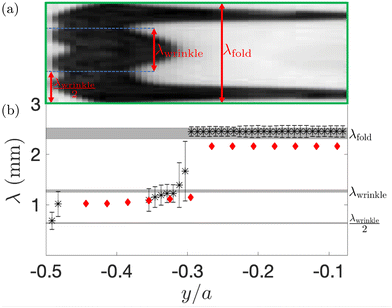 | ||
| Fig. 4 (a) Hierarchical wrinkling within the smallest repeating unit of the “alternating folds” pattern, identified by the green box in Fig. 3, aligned with (b) the corresponding axial wavelength λ, plotted as a function of the cross-channel coordinate y; data in (b) is obtained from experiments (stars) and the FvK model (diamonds). | ||
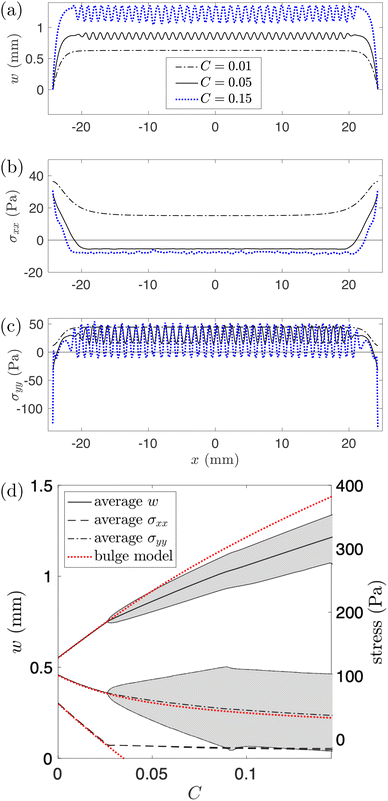
The transition between the three states in Fig. 3 can be understood by looking at the variation of three key quantities along the channel centreline: the vertical deflection, w, and the axial and cross-channel components of the membrane stress, σxx and σyy, respectively. Fig. 5(a)–(c) show a plot of these quantities, computed using the FvK model, for the same value of the pressure as in Fig. 3; different lines correspond to different values of C. In Fig. 5(d) we also show the maximum, minimum and average of these three centreline quantities over the central channel region for varying C, along with the corresponding predictions from the bulge model (eqn (7) and (8); dotted red lines).
Before the onset of wrinkling, the membrane deformation is well described by our bulge model (see Fig. 5(d)): as the swelling increases, the membrane's deflection becomes larger, leading to an increase in its transverse curvature. Since the pressure P is kept constant, Laplace's law (8) implies a reduction in the transverse stress, σyy, with an increase in C. Note that this mechanism for the reduction in σyy is different from the mechanism that operates in a flat membrane (i.e. for P = 0, the case analysed in ref. 26). In the latter case an increase in C leads to a linear reduction in σyy because swelling directly releases the pre-stress σ0; for inflated membranes, the reduction in stress is indirect and leads to a different functional relation between σyy and C. In particular, prior to the onset of wrinkling, σyy always remains positive.
The change in axial stress σxx arises through a combination of the Poisson effect and the reduction in the axial strain exx due to the increase in swelling (see eqn (6)). This leads to an overall reduction in σxx with an increase in C.
As swelling increases, both principal stresses are therefore reduced and for a sufficiently large value of C the axial stress becomes negative. Once the axial compression is sufficiently strong the membrane wrinkles and thus reduces the compressive stress to a small, approximately uniform value; see the solid lines in Fig. 5(a)–(c) which show the three centreline quantities at C = 0.05, just past the onset of wrinkling. The initial wrinkling retains the cross-channel symmetry, resulting in the varicose pattern observed in Fig. 3. The axial variations in the vertical displacement, w, are directly translated into variations in the cross-channel membrane stress, σyy, because, compared to a uniformly inflated membrane, the membrane becomes more/less stretched along the peaks/valleys of the wrinkling pattern. Beyond the onset of wrinkling the average deflection and the axial stress deviate from the bulge model, with the latter remaining approximately constant with a further increase in C; see Fig. 5(d). Conversely, the average of the cross-channel stress σyy, shown by the dash-dotted line in Fig. 5(d) remains close to the predictions from the bulge model, implying that, on average, the force balance in the membrane is still well described by Laplace's law.
Further swelling leads to an increase in the amplitude of the wrinkles. Thus the variation in the cross-channel stress increases until the minimum of σyy becomes negative, creating cross-channel compressive stresses in the valleys of the wrinkling pattern. Once these compressive stresses are sufficiently strong, they induce a secondary symmetry-breaking instability in which the compressed material in the valleys of the primary wrinkling pattern buckles in the transverse direction, thus breaking the cross-channel symmetry. Consecutive valleys buckle in opposite directions and remain separated by the peaks of the wrinkling pattern which retain their cross-channel symmetry, resulting in the coarsened patterns shown in Fig. 3, which we refer to as “alternating folds”.
3.3 Controlling patterns by varying pressure
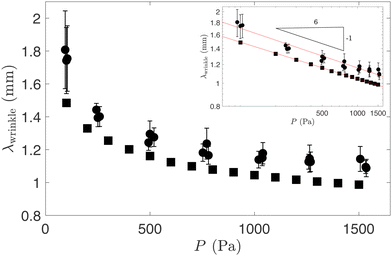
We will now show that changes to the level of pre-inflation can be used to alter the wavelength and morphology of the buckling patterns.For this purpose, we show in Fig. 6 a plot of the axial wavelength, λwrinkle, at the onset of wrinkling as a function of the pressure, P. The experimental data (indicated by circular symbols) was obtained by averaging the distance measured between consecutive valleys in the wrinkling pattern, with the vertical error bars representing the standard deviations of the data within each experiment, and repeated experiments shown as clusters of points. The corresponding numerical data is represented by the square symbols. Although the numerical predictions systematically underestimate the wavelength of the wrinkling pattern, the log–log plot of the same data in the inset shows that experiments and simulations both suggest a power-law behaviour for the dependence of the wrinkling wavelength on the pressure, with larger pressures resulting in shorter wavelengths.
To explain this, we exploit that, as demonstrated in Fig. 2, at the onset of wrinkling, the central part of the membrane resembles a sector of an axisymmetric circular cylindrical shell, subject to a compressive axial stress (equivalent to σxx) and a tensile hoop stress (equivalent to σyy). In the classical literature on axisymmetric buckling of cylindrical shells under this load,28 the wavelength of buckling λ[shell]buckle is shown to depend on their radius R
 | (9) |
| λwrinkle ∼ P−1/6, | (10) |
Next we analyse the effect of varying the pressure on the transition between the different buckling patterns. For this purpose we introduce the quantities Mx and My, where
 | (11) |
 | (12) |
In Fig. 7 we plot M = Mx + My, computed from the numerical solution of the FvK equations, as a function of C for various pressures. Initially both Mx and My are zero but as swelling increases, Mx increases sharply when we reach the primary wrinkling instability (at the points marked by the square symbols) which induces axial variations throughout the length of the membrane. Following the onset of the primary instability, Mx continues to increase as the amplitude of the wrinkling pattern grows. My is initially zero but then increases sharply when the secondary cross-channel symmetry-breaking instability occurs (at the points marked by the circular symbols). Given the inevitable imperfections it is difficult to establish unambiguously at which point the transition between the three patterns occurs in the experiments. However, the insets in Fig. 7 show that the experimentally observed patterns fall into the ranges of C predicted by the FvK equations.
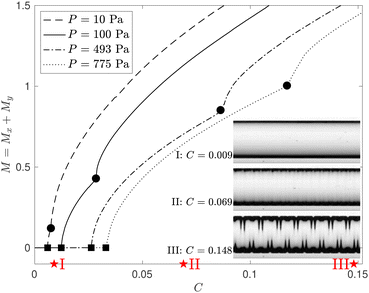 | ||
| Fig. 7 The combined norm, M = Mx + My, where Mx and My are defined in eqn (11) and (12), respectively, as a function of the level of swelling, C, for four different pressures, P. The onset of wrinkling and the secondary symmetry-breaking instability are identified by square and circular markers, respectively. The insets show experimental images at P = 775 Pa for three values of C, as marked with stars on the C-axis. | ||
To explain how variations in pressure affect the value of C at which the instabilities that cause the transition between the different patterns arise, we recall that if the membrane is subjected to a larger pressure, the associated pre-swelling tensile membrane stresses increase like σxx ∼ σyy ∼ P/w0 ∼ P/P1/3 ∼ P2/3 (see eqn (8)). Wrinkling only occurs when swelling has reduced the axial membrane stress σxx in the central part of the membrane to just below zero; see Fig. 5(a). Hence, an increase in P will delay the onset of the wrinkling instability to larger values of C. This is consistent with the observations in Fig. 7. The same applies to the onset of the secondary instability, and hence an increase in P results in an increasing separation between the two critical points in Fig. 7. Conversely, a reduction in pressure implies that both instabilities not only occur at smaller values of C but that their onsets approach each other. As P → 0 we therefore recover the behaviour described in ref. 26: without pre-inflation the initial wrinkling pattern breaks the axial uniformity and the cross-channel symmetry simultaneously.
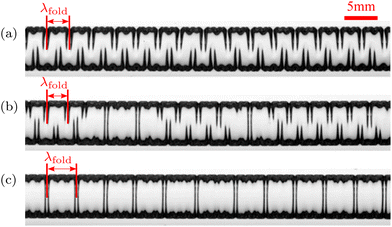
An increase in pressure not only delays the onset of the secondary instability but it also affects the coarsened patterns that emerge. This is illustrated in Fig. 8 where we show experimental observations of the final, fully-swollen membranes at three different values of the pressure. For P = 493 Pa we obtain the alternating folds, which we already discussed in detail. However, for a larger pressure of P = 1020 Pa, we observe the appearance of isolated “connected folds” which develop when one of the valleys in the initial wrinkling pattern grows inwards while relaxing the amplitude of the adjacent wrinkles. For this value of the pressure, the connected folds occur randomly within the remaining alternating folds, so we refer to such patterns as “mixed folds”. For yet larger pressures, e.g. P = 1259 Pa in Fig. 8, the connected folds completely replace the alternating pattern. Their axial spacing is not random: since they emerge from the initial wrinkling pattern, the distance between any two subsequent connected folds is close to an integer multiple of λwrinkle.
The transition between the alternating and connected fold regimes is quantified in Fig. 9 where we plot the ratio λfold/λwrinkle as a function of the pressure. The wavelengths were measured as in Fig. 4, except for the mixed folds regime, for which they were measured separately in the regions of connected and alternating folds. For smaller pressures, we obtain λfold ≈ 2λwrinkle, characteristic of the period doubling underlying the formation of the alternating folds. For larger pressures we find that the dominant wavelength of the coarsened pattern, which corresponds to the average distance between two connected folds, is about three wavelengths of the original wrinkling pattern.
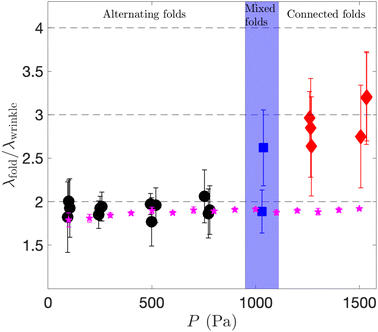 | ||
| Fig. 9 The wavelength ratio λfold/λwrinkle as a function of the pressure P for different types of coarsened patterns obtained experimentally, and the alternating folds obtained numerically (stars). | ||
Interestingly, we were not able to reproduce the connected folds in our numerical simulations. For the pressures for which connected folds are observed in the experiments, the FvK-based computations show that the induced cross-channel stress σyy is so large that the development of alternating folds is delayed to values of C that exceed the equilibrium value Ceq. The computations therefore result in a finite-amplitude wrinkling pattern whose wavelength remains close to λwrinkle, without any coarsening. This suggests that the instability that leads the development of the connected folds involves constitutive and/or geometrical non-linearities that are not represented in our theoretical model. It would be possible to account for those rationally using a more complicated plate model, such as the Koiter-Steigmann model,39,40 but this is beyond the scope of our paper. For the alternating folds formed in the numerical simulations, we find λfold ≈ 2λwrinkle at all values of P, see Fig. 9. (The error bars, which correspond to the standard deviation of the data, quantify mesh-induced perturbations to the wavelengths).
All the results presented so far were obtained by allowing the membrane to swell to its saturation while keeping the pressure constant; the value of the pressure determined the morphology of the final pattern that arises from this process.
Fig. 10(a) demonstrates that it is possible to initiate the transition between the different coarsened regimes by adjusting the pressure a posteriori, i.e. after the membrane has reached its fully-swollen state. The figure shows a sequence of membrane shapes, starting with the alternating folds state which was reached after swelling the membrane at a constant pressure of 263 Pa (top left). A slow increase in pressure (down the left column) leads to a quasi-steady transition to mixed folds, and ultimately to the connected folds pattern (at P = 1768 Pa). A subsequent reduction in pressure (upwards along the right column) then returns the deformation back to an alternating folds pattern. Comparison of the inflation/deflation phases indicates the presence of hysteresis: the pressure at which the mixed fold pattern appears during pressurisation is larger than the pressure at which it disappears during deflation; furthermore, during deflation, localised frustrated patterns (highlighted by red boxes) are formed. Both are likely to be consequences of the patterns representing local minima in strain energy in a highly nonlinear system that, for a given pressure, has many alternative nearby equilibria. However, overall the results in Fig. 10 suggest that swelling and inflation can be considered as approximately independent processes – consistent with the assumptions of our theoretical model, where we have ignored any feedback to the swelling from the sheet deformation.
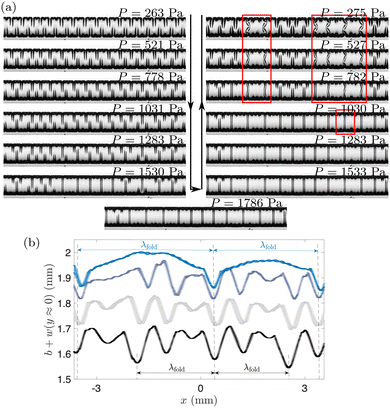 | ||
| Fig. 10 Transition from alternating folds to connected folds and back in experiments with a membrane that is fully swollen at P = 263 Pa and subjected to increasing (arrow down) and then decreasing (arrow up) pressure. Red rectangular boxes identify regions of frustrated patterns not seen in Fig. 8. (b) The axial cross-sectional profiles of the membrane during the transition from alternating to connected folds, characterised by the wavelength λfold as indicated, for P = 240 Pa, 750 Pa, 1241 Pa and 1488 Pa (bottom to top) in experiments equivalent to (a). | ||
We note that the patterns formed in these experiments are visibly imperfect. For example, the profiles in Fig. 10(b) near the channel centreline, measured in experiments analogous to the ones in Fig. 10(a), show the membrane deflection along the channel length for various P, for which the patterns change from alternating (P = 240 Pa) to connected folds (P = 1488 Pa). While λfold is still identifiable in all the data, undulations of higher wavenumber are also seen in the alternating folds patterns; these are caused by the rearrangement of hierarchical structures with increasing pressure. By contrast, the centreline profiles associated with connected folds appear to be more regular. For this pattern, valleys are connected by bulging regions of the membrane, which relax some of the wrinkles observed at smaller values of the pressure. The position of the valleys stays approximately the same in all experiments irrespective of the value of P, once again illustrating the importance of localisation during this pattern development.
4 Conclusion
We have studied the pattern formation in pre-inflated swelling membranes mounted on the upper boundary of a microchannel. We showed that the inflation creates a disparity in the magnitudes of the principal stresses which leads to the occurrence of two distinct instabilities as the swelling increases while keeping the pressure constant: the uniformly inflated membrane first becomes unstable to regular small-amplitude varicose wrinkling, which is analogous to the axisymmetric buckling of pressurised, uni-axially compressed cylindrical shells.28 As the swelling increases further, the initial wrinkling pattern is coarsened via a secondary instability. We showed that variations in pressure not only allow us to control the axial wavelength of the emerging patterns (an increase in pressure reduces the wavelength by nearly a factor of two in the range of studied pressures), but that the pressure also determines the coarsened patterns that emerge in the secondary instability: for modest pressures, the initial wrinkling pattern undergoes a transition to an “alternating folds” pattern which breaks the cross-channel symmetry; at larger pressures the wrinkling pattern coarsens into “connected folds” which retain the cross-channel symmetry. This behaviour is different from that observed in initially flat incompressible membranes for which the instability that breaks the axial non-uniformity also breaks the cross-channel symmetry, see, e.g. ref. 26. Therefore, inflation of the membrane prior to swelling allows control over the wavelength and morphology of the emerging patterns, providing a useful additional tool in designing and manufacturing soft microchannels and augmenting methods explored by ref. 23 and 25 for flat unpressurised membranes. Using the techniques from ref. 25, our microchannels could be stabilized to create layer-stack devices, which are capable of conveying fluids at large pressures, and are therefore useful in mixing, flow focusing and particle sorting applications.18–22 Earlier works have already demonstrated benefits of using swelling for designing and manufacturing of patterned microchannels over more traditional methods in which the channel shape is ‘frozen’ early in the production. Our study suggests new opportunities for robustly producing corrugated microchannels by providing a pathway to a range of patterns that are otherwise inaccessible.Author contributions
H. L., A. J. and D. P.-P. designed research; H. L., A. R., M. H. and D. P.-P. performed research; and H. L., A. R., A. J., M. H. and D. P.-P. wrote the paper.Conflicts of interest
There are no conflicts to declare.Acknowledgements
The authors would like to acknowledge Martin Quinn for his technical support. The work was funded by the EPSRC [Grant No. EP/R045364/1]. H. L. would like to thank the China Scholarship Council [Grant No. 201906020184] for supporting him. For the purpose of open access, the authors have applied a Creative Commons Attribution (CC BY) licence to any Author Accepted Manuscript version arising.Notes and references
- J. Dervaux and M. Ben Amar, Annu. Rev. Condens. Matter Phys., 2012, 3, 311–332 CrossRef CAS.
- C. de Las Heras Alarcon, S. Pennadam and C. Alexander, Chem. Soc. Rev., 2005, 34, 276–285 RSC.
- D. Roy, J. N. Cambre and B. S. Sumerlin, Prog. Polym. Sci., 2010, 35, 278–301 CrossRef CAS.
- M. A. Stuart, W. T. Huck, J. Genzer, M. Muller, C. Ober, M. Stamm, G. B. Sukhorukov, I. Szleifer, V. V. Tsukruk, M. Urban, F. Winnik, S. Zauscher, I. Luzinov and S. Minko, Nat. Mater., 2010, 9, 101–113 CrossRef PubMed.
- M. Wei, Y. Gao, X. Li and M. J. Serpe, Polym. Chem., 2017, 8, 127–143 RSC.
- S. Gao, G. Tang, D. Hua, R. Xiong, J. Han, S. Jiang, Q. Zhang and C. Huang, J. Mater. Chem. B, 2019, 7, 709–729 RSC.
- Y. Lee, W. J. Song and J. Y. Sun, Mater. Today Phys., 2020, 15, 100258 CrossRef.
- P. Ragesh, V. Anand Ganesh, S. V. Nair and A. S. Nair, J. Mater. Chem. A, 2014, 2, 14773–14797 RSC.
- Y. Rahmawan, C. M. Chen and S. Yang, Soft Matter, 2014, 10, 5028–5039 RSC.
- H. Yuan, K. Wu, J. Zhang, Y. Wang, G. Liu and J. Sun, Adv. Mater., 2019, 31, e1900933 CrossRef PubMed.
- B. Xu, D. Chen and R. C. Hayward, Adv. Mater., 2014, 26, 4381–4385 CrossRef CAS PubMed.
- J. B. Kim, P. Kim, N. C. Pégard, S. J. Oh, C. R. Kagan, J. W. Fleischer, H. A. Stone and Y.-L. Loo, Nat. Photonics, 2012, 6, 327–332 CrossRef CAS.
- J. Y. Chung, A. J. Nolte and C. M. Stafford, Adv. Mater., 2011, 23, 349–368 CrossRef CAS PubMed.
- S. Nagashima, H. D. Ha, D. H. Kim, A. Kosmrlj, H. A. Stone and M. W. Moon, Proc. Natl. Acad. Sci. U. S. A., 2017, 114, 6233–6237 CrossRef CAS PubMed.
- M. Müller, M. Karg, A. Fortini, T. Hellweg and A. Fery, Nanoscale, 2012, 4, 2491–2499 RSC.
- B. H. Kim, Y. Choi, J. Y. Kim, H. Shin, S. Kim, S. W. Son, S. O. Kim and P. Kim, Adv. Mater., 2014, 26, 4665–4670 CrossRef CAS PubMed.
- Y. Li, G. Huang, X. Zhang, L. Wang, Y. Du, T. J. Lu and F. Xu, Biotechnol. Adv., 2014, 32, 347–365 CrossRef CAS PubMed.
- A. D. Stroock, S. K. W. Dertinger, A. Ajdari, I. Mezić, H. A. Stone and G. M. Whitesides, Science, 2002, 295, 647–651 CrossRef CAS.
- M. Moon, S. Chung, K. Lee, K. H. Oh, H. A. Stone and J. W. Hutchinson, Int. J. Mater. Res., 2007, 98, 1203–1208 CrossRef CAS.
- S. Chung, J. H. Lee, M. Moon, J. Han and R. D. Kamm, Adv. Mater., 2008, 20, 3011–3016 CrossRef CAS.
- C.-H. Hsu, D. D. Carlo, C. Chen, D. Irimia and M. Toner, Lab Chip, 2009, 8, 2128–2134 RSC.
- W. C. Shields IV, C. D. Reyes and G. P. López, Lab Chip, 2015, 15, 1230–1249 RSC.
- R. Takahashi, H. Miyazako, A. Tanaka and Y. Ueno, ACS Appl. Mater. Interfaces, 2019, 11, 28267–28277 CrossRef CAS PubMed.
- F. Brau, H. Vandeparre, A. Sabbah, C. Poulard, A. Boudaoud and P. Damman, Nat. Phys., 2010, 7, 56–60 Search PubMed.
- R. Takahashi, H. Miyazako, A. Tanaka, Y. Ueno and M. Yamaguchi, Lab Chip, 2021, 21, 1307–1317 RSC.
- B. Audoly and Y. Pomeau, Elasticity and Geometry: From Hair Curls to the Non-linear Response of Shells, OUP, Oxford, 2010 Search PubMed.
- B. Audoly, Phys. Rev. Lett., 1999, 83, 4124–4127 CrossRef CAS.
- J. Hutchinson, AIAA J., 1965, 3, 1461–1466 CrossRef.
- N. Yamaki, Elastic stability of circular cylindrical shells, North-Holland, Amsterdam, Netherlands, 1984 Search PubMed.
- Y. Yang, H. H. Dai, F. Xu and M. Potier-Ferry, Phys. Rev. Lett., 2018, 120, 215503 CrossRef CAS PubMed.
- E. Virot, T. Kreilos, T. M. Schneider and S. M. Rubinstein, Phys. Rev. Lett., 2017, 119, 224101 CrossRef PubMed.
- Y. Zhao, Y. Cao, X.-Q. Feng and K. Ma, J. Mech. Phys. Solids, 2014, 73, 212–227 CrossRef.
- N. Stoop, R. Lagrange, D. Terwagne, P. M. Reis and J. Dunkel, Nat. Mater., 2015, 14, 337–342 CrossRef CAS.
- Z.-C. Shao, Y. Zhao, W. Zhang, Y. Cao and X.-Q. Feng, Soft Matter, 2016, 12, 7977–7982 RSC.
- A. Müller, M. C. Wapler and U. Wallrabe, Soft Matter, 2019, 15, 779–784 RSC.
- M. Heil and A. L. Hazel, Fluid-Structure Interaction: Modelling, Simulation, Optimisation, 2006, pp. 19–49 Search PubMed.
- D. Robinson, PhD thesis, University of Manchester, 2019.
- J. Vlassak and W. Nix, J. Mater. Res., 1992, 7, 3242–3249 CrossRef CAS.
- W. T. Koiter, Proc. Kon. Ned. Ak. Wet. B, 1966, 69, 1–54 Search PubMed.
- D. Steigmann, Math. Mech. Solids, 2012, 18, 103–112 CrossRef.
Footnote |
| † Electronic supplementary information (ESI) available. See DOI: https://doi.org/10.1039/d3sm01008b |
| This journal is © The Royal Society of Chemistry 2023 |

