 Open Access Article
Frontiers in 19F-MR imaging: nanofluorides and 19F-CEST as novel extensions to the 19F-MRI toolbox
Andrea
Galisova
 ab and
Amnon
Bar-Shir
 *a
*a
aDepartment of Molecular Chemistry and Materials Science, Weizmann Institute of Science, Herzl Street 234, Rehovot, Israel. E-mail: amnon.barshir@weizmann.ac.il
bInstitute for Clinical and Experimental Medicine, Videnska 1958/9, Prague, Czech Republic
First published on 12th April 2023
Abstract
Fluorine-containing materials have enriched the field of molecular and cellular MRI with unambiguous and quantitative detection capabilities. The background-free “hot-spot” display and the large range of chemical shifts of the broad palette of 19F-formulations are now used for a variety of applications. The common features of these formulations are: (i) they are based on organic molecular backbones (i.e., organofluorines); and (ii) their 19F-MRI detectability relies on a well-defined and clearly observed 19F-MR signal. During the last few years, our lab aimed to expand the 19F-MR toolbox with new capabilities that were, thus far, not used in molecular and cellular 19F-MRI. This Feature Article summarizes our developments and implementations in the field of 19F-MRI emphasizing (i) the introduction of ultrasmall inorganic fluoride-based nanocrystals (nanofluorides) as nano-sized (<10 nm) agents for 19F-MRI, and (ii) the use of Chemical Exchange Saturation Transfer (CEST) in the 19F-MRI framework to indirectly amplify 19F-MR signals of otherwise-undetected fluorinated entities.
Introduction
From the early days of magnetic resonance imaging (MRI), fluorine-19-containing materials have attracted much interest due to their favorable MR properties, which has led to the revolution of the field of 19F-MRI, featuring several advantages over 1H-MRI.1 The very similar sensitivity of 19F-MR (ca. 83%) to that of 1H-MR, the need for only minimal hardware adjustments, and the negligible amounts of 19F-content in soft tissues all make fluorinated compounds very attractive for molecular and cellular MRI applications. The unambiguous and quantitative detection capabilities of 19F-rich materials provide 19F-MRI with “background-free” readouts that are frequently presented as “hot spots” over high-resolution 1H-MRI maps that represent anatomical views of the same studied subject. In addition, the very wide range of 19F-NMR chemical shifts, which span over 350 ppm, enables the mapping of multiple fluorinated probes simultaneously and the display of these probes as artificial MRI “colors” for multi-target imaging purposes.Throughout the years, with the development of the field of molecular and cellular MR imaging, and, in parallel to the extensive progress in the design and implementation of both paramagnetic and super-paramagnetic agents for a wide range of applications, 19F-agents became appealing. In that regard, numerous types of 19F-probes were developed, including small molecules,2,3 metal complexes,4,5 and macromolecules and polymers.6,7 Widely used and clinically applied perfluorocarbons (PFCs)8 with a high fluorine-19 content have revolutionized 19F-MR research, leading to broad applications in cellular imaging.9–17 In addition to the 19F-MR signal, several probes offer targetability toward specific molecular signatures of pathological tissues, such as entities displayed on the surface of cancer cells or acidic pH and the altered redox environment in tumors,18–20 enabling precise diagnosis, and therefore, accurate therapy of diseases.21,22 Activatable 19F-MRI probes that respond to various types of stimuli were designed. For example, activable probes to sense metal ions,23e.g. Zn2+,24 Cu2+,25 Mn2+![[thin space (1/6-em)]](https://www.rsc.org/images/entities/char_2009.gif) 26 and enzymes,2,27 or to detect alterations in the local environment, such as redox,7,28,29 pH,30–32 and temperature,33,34via changes in the 19F-MR signal. Due to their signal specificity, stimuli-triggered probes have a wide range of applications and are particularly useful for quantifying parameters that influence their response.
26 and enzymes,2,27 or to detect alterations in the local environment, such as redox,7,28,29 pH,30–32 and temperature,33,34via changes in the 19F-MR signal. Due to their signal specificity, stimuli-triggered probes have a wide range of applications and are particularly useful for quantifying parameters that influence their response.
The growth of fluorinated molecular probes and their applications in 19F-MRI continues and many of the developments are beyond the scope of this Feature Article and can be found in other reviews.35–39 Interestingly, although there are diverse types of probes, the vast majority (if not all) of the used 19F-probes developed and used are based on organofluorines with a centered carbon–fluorine bond, with no demonstration of the inorganic fluoride-based formulations used for 19F-MRI. In addition, the MRI signals of these organofluorine formulations rely on the ability to directly detect their well-defined 19F-MR readout at a specific resonance frequency. This prevents 19F-MRI from being used to study very low concentrations of biological targets—those which can be found at levels that cannot be detected just by applying a stronger magnetic field or increasing the signal averaging. In the last several years, we aimed to expand the 19F-MRI toolbox with tools that were not accessible at the time. This includes the introduction of inorganic fluoride-based nanocrystals (namely nanofluorides) and the ability to detect very low levels of targets with 19F-MRI (through the implementation of the chemical exchange saturation transfer—the CEST strategy—into the 19F-MRI framework) as summarized in Table 1.
| Detection principle | Applications | Merits | Limitations | Ref. | |
|---|---|---|---|---|---|
| Nanofluorides | 19F-UTE | Mapping inflammation | Very small 19F-nanoformulations | Very short T2 | 44, 51–53 |
| Mapping neuroinflammation | Established nanocrystals chemistry | Broad linewidths | |||
| “Multicolor” MRI | Straightforward surface modification | ||||
| Wide range of chemical shifts | |||||
| iCEST | 19F-CEST | Mapping metal ions | Using 19F-ligands with very low ion affinity | Detecting 19F-MR signal reduction (saturation transfer) | 73–76 |
| Detection of low ion concentrations (μM range) | |||||
| Highly specific (frequency specificity) | |||||
| GEST | 19F-CEST | “Multicolor” MRI | Amplifying 19F-MR signals of targets (μM range) | Detecting 19F-MR signal reduction (saturation transfer) | 77–79, 83, 84 |
| Mapping low concentrations of targets (μM level) | Using anesthetics as 19F-MR agents | Requires the delivery of both the host and the guest entities to the region of interest | |||
| Wide range of chemical shifts (paraGEST) | |||||
This Feature Article summarizes our recent contributions in the field of 19F-MRI, emphasizing the aim to expand the currently available 19F-MRI toolbox with capabilities that were thus far applicable for molecular probes developed for 1H-MRI. We describe the array of 19F formulations developed in our lab, such as ultrasmall inorganic nanofluorides, fluorinated ligands, and host–guest supramolecular pairs. We also discuss how the principles of the CEST methodology can be implemented for 19F-MRI studies by exemplifying this with different molecular architectures.
Nanofluorides for 19F-MRI
Inorganic nanocrystals (NCs) have been extensively studied in biomedical research for decades. Their well-defined and adjustable properties (size, colloidal stability, etc.),40,41 controlled inorganic content composition,42 and their surface modifiability43 are just a few examples of the attractiveness of inorganic NCs for diverse needs. Despite their obvious advantages and the ability to load a large fluoride content into their cores, inorganic NCs were not used in 19F-MRI studies until very recently. More surprisingly, and probably due to the restricted mobility of the elements (i.e., fluoride content) in their crystalline core, such NCs were not studied with liquid-state high-resolution 19F-NMR.In 2018, our group synthesized water-soluble and MR-trackable nanofluorides (NFs) for the first time.44 Due to their very small size (∼5 nm, Fig. 1a and b), the homonuclear dipolar interactions expected in solids, and thus in NFs, were found to be averaged out, allowing their detection by liquid-state 19F-NMR. The first type of NFs, i.e., citrate-coated CaF2 NFs, show a single and stable 19F-NMR peak while being dispersed in water (Fig. 1d). This singlet 19F-NMR peak is expected for materials with a magnetically equivalent 19F content. Indeed, the X-ray diffraction (XRD) pattern of CaF2 NFs features a typical cubic-phase, fluorite-type, face-centered cubic (fcc) structure, as reflected by the first coordination sphere scheme (Fig. 1c). Thus, all fluorides in CaF2 NFs have an identical position in a cell unit, which is manifested by a singlet 19F-NMR peak. Note here that other NF formulations, LaF3 NFs, for example, even synthesized as very small NCs and dispersed in solutions, did not give rise to a singlet and sharp 19F-NMR peak as their fluoride content is distributed between different, not-magnetically equivalent positions in their crystal.
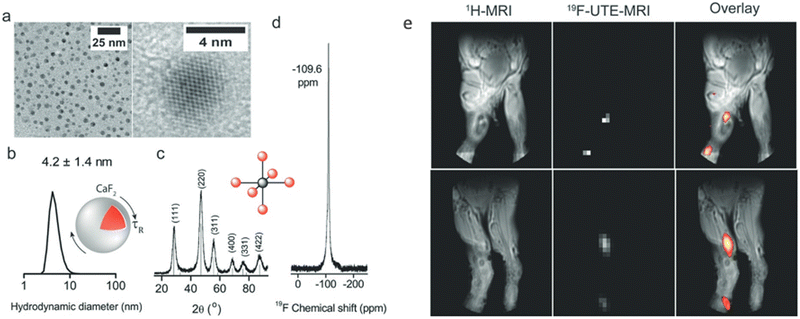 | ||
| Fig. 1 19F-NMR and 19F-MRI of water-soluble CaF2 NFs. (a) TEM images and (b) size distribution measured by DLS. (c) XRD pattern with a schematic of the Ca2+ first coordination sphere. (d) High-resolution 19F-NMR in water. (e) In vivo imaging of PEGylated CaF2 showing anatomical 1H-MRI for two representative mice (left) and matched 19F-MRI (middle) shown as pseudo-color maps overlaid on 1H-MRI (right). Modified with permission from ref. 44. | ||
For subsequent biological applications, CaF2 NFs were coated with polyethylene glycol (PEG) to improve their biocompatibility and enhance their retention time in vivo. To demonstrate that their 19F-MR signal is preserved in a complex system and to examine their 19F-MRI signal in vivo, PEG-coated CaF2 NFs were injected into the inflamed footpads of mice. As shown in Fig. 1e, a clear 19F-MR signal could be detected at the injection site, as well as in the region of draining lymph nodes one hour after injection, away from the location at which the NFs were introduced. Such an observation is in good agreement with the accumulation of imaging NCs of similar size45 in the lymph nodes after their uptake by macrophages. These results proved that our proposed NFs are suitable nanoformulations for in vivo19F-MR visualization of biological events, such as inflammation.
Nanofluorides with enhanced relaxation properties
Increasing the sensitivity of 19F-MRI is of paramount interest, as the concentrations of 19F-entities at a given voxel of an MR image are limited. Several strategies have been developed toward this goal, such as: (i) increasing the number of 19F atoms for a given imaging agent by synthesizing highly-fluorinated agents when possible;31,46 (ii) shortening the T1 relaxation of the fluorine-19 content to allow an increased number of signal averages at a given scan time;47,48 or (iii) the use of special techniques, such as hyperpolarized 19F-MRI.49 The use of highly dense materials, such as NFs (3.18 g mL−1 for CaF2),44 results in the maximization of the 19F-spins/volume possible and exceeds that obtained by organofluorines. Nevertheless, the relatively long T1 of the fluoride content in NF, which is generally 10–15 s for NCs at the 5–10 nm size, limits the use of signal averaging to increase the signal-to-noise ratio (SNR) of the 19F-MRI data, as this may require unreasonably long experiment times.Paramagnetic relaxation enhancement (PRE)
Indeed, the applicability of NFs for dynamic studies is restricted due to their relatively long relaxation times (>10 s), which require long scan times to obtain robust 19F-MRI data. One possible solution to this obstacle could be the introduction of paramagnetic relaxation enhancement (PRE), in which paramagnetic elements are incorporated into the crystal of NFs (Fig. 2a). The unpaired electrons of paramagnetic metal ions, for example, induce a PRE effect to the neighboring nuclear spins, such as those of fluorides in NFs, which results in shorter relaxation times (both T1 and T2). In this regard, as shortening of T1 is desirable, drastic shortening of the T2 of the neighboring fluorides may result in “blind spheres”50 and the elimination of 19F-NMR signals. Therefore, both the type of the introduced paramagnetic element and its amount should be carefully considered when preparing paramagnetic NFs with a short T1. For example, we have shown that doping CaF2 NFs with different paramagnetic elements (i.e., Sm3+, Ce3+, and Gd3+) leads to a 19F-NMR line-broadening that is dependent on the PRE capabilities of the dopant, with the most severe effect obtained, as expected, for Gd3+ (Fig. 2b). When Sm3+ ions (the lanthanide ion with lower PRE capabilities) were introduced to the crystal of CaF2 NFs to obtain Sm:CaF2, a 200-fold shortening of the T1 of the fluorides was obtained (Fig. 2c).51 The resultant ultrashort T1 relaxation time of 70 ms led to an eight-fold enhancement of the 19F-MR signal at a given scan time when compared to that obtained with undoped CaF2 or those NFs doped with a diamagnetic lanthanide, La3+ (Fig. 2d and e).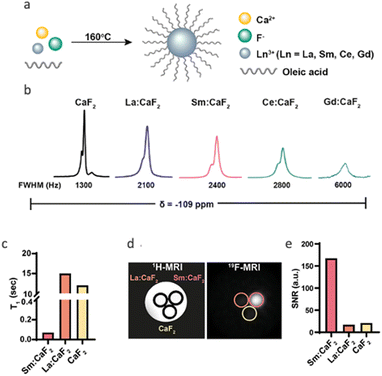 | ||
| Fig. 2 Paramagnetically doped nanofluorides. (a) Schematic representation of the synthetic route for CaF2 coated with oleic acid (OA) and doped with a lanthanide (Ln3+). (b) 19F-NMR spectra of OA-Ln:CaF2 NCs with different Ln3+ dopants. All 19F-NMR peaks resonate at δ = −109 ppm. (c) T1 values of Sm:CaF2, La:CaF2, and CaF2 NCs. (d) 19F-MRI of phantoms composed of La:CaF2, Sm:CaF2, and CaF2 (70 mM of 19F per sample) dispersed in water. (e) 19F-MRI signal-to-noise ratios (SNRs) of the studied solutions shown in (d). Modified with permission from ref. 51. | ||
Nanocrystalline defects relaxation enhancement (NDRE)
PRE effects induced by paramagnetic elements, although very efficient and widely used, have raised concerns about lanthanide biocompatibility and the difficulty of precise quantification of 19F-MR signals due to line-broadening and “blind-spheres” induction. Inspired by the ability to control the pathway through which CaF2 NFs are formed and identifying the linkage between different growth pathways and the crystal structure of CaF2 formulations,52 we proposed an alternative to PRE. This approach is based on the synthetic induction of crystallographic defects in NFs using phosphate-headed capping ligands that replaced the carboxylate-headed ligands used in previous studies. To shorten the T1 of the fluorides in CaF2 without the aid of paramagnetic elements, NFs were synthesized with oleyl phosphate (OP) as the capping ligand rather than with oleic acid (OA) to obtain either OP-CaF2 or OA-CaF2, respectively. High-resolution TEM of the two types of NFs (Fig. 3a and b) revealed a pronounced difference in the crystal architecture of NFs, with OA-CaF2 exhibiting a well-ordered, highly crystalline lattice, while OP-CaF2 crystals showed crystal defects at the type of grain boundaries (Fig. 3a). Importantly, both types of NCs exhibited similar 19F-NMR spectra with identical chemical shifts (−109 ppm) and comparable line widths. Interestingly, the T1 value of the fluorides in OP-CaF2 was found to be 10 times shorter (1 s) compared to that of the fluorides in OA-CaF2 (11 s, Fig. 3c). This difference allows a dramatic shortening of the repetition time (TR) of 19F-MRI acquisitions, essentially leading to an increase in the number of signal averages for a given scan time. The resultant four-fold improvement in the SNR of 19F-MRI data demonstrated that the introduced crystallographic defects make the obtained NFs sensitive paramagnetic-free nanoprobes for 19F-MR detection, even in vivo (Fig. 3d). This finding, which we termed nanocrystalline-defect relaxation enhancement (NDRE),53 should be further explored to study other types of defects in NCs,54 beyond the so-called grain boundaries obtained for OP-CaF2.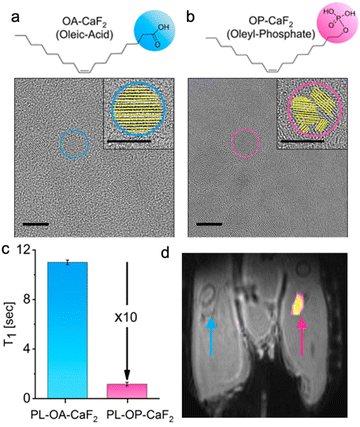 | ||
| Fig. 3 NDRE enhancement of the 19F-MRI signal. Chemical structures and the corresponding HR-TEM images (scale bar 10 nm, in inset 5 nm) of (a) OA-CaF2 and (b) OP-CaF2 NCs. (c) T1 relaxation times of OA- and OP-modified CaF2. (d) In vivo19F-MRI of injected crystalline OA-CaF2 (left leg, blue arrow) and defective OP-CaF2 NCs (right leg, pink arrow). 19F-MRI shown as a pseudo-color map overlaid on the anatomical 1H-MR image of a live mouse. Modified with permission from ref. 53. | ||
Targeted nanofluorides
In addition to improving the relaxation and imaging properties of NFs, we have engineered their surface to grant them new properties and thus make them suitable for a wider range of biological functions. For example, we fabricated nanofluorides with a phospholipid coating to obtain a tunable platform for noninvasive MRI mapping of specific biological events. As a demonstration, we designed immune-cell-targeted NFs, which display sugar-functionalized phospholipids for enhanced recognition and receptors.55,56 For this purpose, we modified the surface of paramagnetic Sm:CaF2 NFs with lactose entities to obtain paramagnetic glyconanofluorides, and applied them to visualize neuroinflammatory activity in the central nervous system (CNS) following ischemic stroke.51 The synthetic glyconanofluorides were preferentially taken up by activated immune cells when compared to non-modified nanofluorides (Fig. 4a and b) and accumulated in a stroke region that corresponded to the presence of immune cells, as shown by the 19F-MR signal (Fig. 4d–f). Our demonstration of enhanced immune targetability in a clinically relevant model of neuropathology opens new routes for other biological targets and applications of nanofluorides in medicine.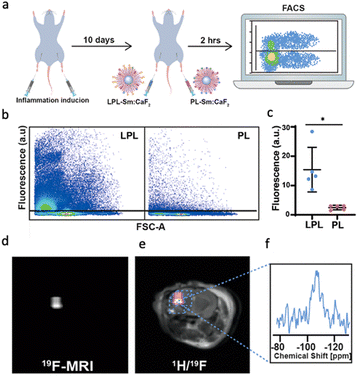 | ||
| Fig. 4 Immunotargeting of glyconanofluorides in vivo. (a) Schematic illustration of the in vivo experimental setup used for the injection of both PL-Sm:CaF2 (nanofluorides, i.e., PL) or LPL-Sm:CaF2 (glyconanofluorides, i.e., LPL) NCs into inflamed mice footpads (20 μL of 25 mg mL−1 NCs). (b) Representative dot blots of FACS analysis of cells excised from lymph nodes 2 h post-injection of LPL-Sm:CaF2 or PL-Sm:CaF2 NCs. (c) Quantitative analysis of the FACS data (rhodamine) obtained from five different mice (N = 5, Student's t-test, * represents a p value <0.05). (d) In vivo19F-MRI and (e) 1H/19F-MRI overlay of a representative mouse 14 days after stroke induction. (f) Localized 19F-NMR spectrum acquired from the area of the ischemic lesion (marked by a dashed-lined box). Modified with permission from ref. 51. | ||
Multiplexed visualization of nanocrystals
The heterogeneity of molecular signatures in pathological diseases mandates a method capable of identifying spatial and temporal fingerprints of these processes simultaneously. 19F-MRI is an attractive technique for this, as two or more fluorine-containing probes can be imaged at the same time using the same approach and device. If the different probes contain a 19F-entity that is surrounded by different chemical environments, they will be manifested by different 19F-NMR chemical shifts, and thus, be monitored simultaneously, allowing for multiplexed analysis and a multicolor display.12,57,58 To demonstrate the multiplex imaging capabilities of NFs, two different formulations, consisting of different cations (CaF2vs. SrF2) were examined. Specifically, the NFs consisting of CaF2 cores and those consisting of SrF2 cores showed characteristic 19F-NMR peaks resonating at −109 ppm and −88 ppm, respectively.To demonstrate the multiplex imaging capabilities, the CaF2 formulation was decorated with lactose-modified phospholipids (LPL-Sm:CaF2) to obtain glyconanofluorides for immune cell targetability (as shown in Fig. 4). In contrast, SrF2 formulations were decorated with unmodified phospholipids (PL-Sm:SrF2) and used as control formulations that were not recognized by activated immune cells. Targeted and non-targeted NFs were injected as a mixture into a mouse footpad following inflammation induction (Fig. 5a–c). After the injection, the targeted glyconanofluorides (LPL-Sm:CaF2, shown as the light blue 19F-MRI signal in Fig. 5d–f) were found at significantly higher levels in the closer lymph node (LN). The two-fold higher 19F-MRI signal of the targeted LPL-Sm:CaF2 demonstrates the ability to spatially map the targetability of nanofluorides and present them in an artificial color MRI display. Importantly, the targeting moiety can be easily replaced to monitor additional biological events of interest in the future.
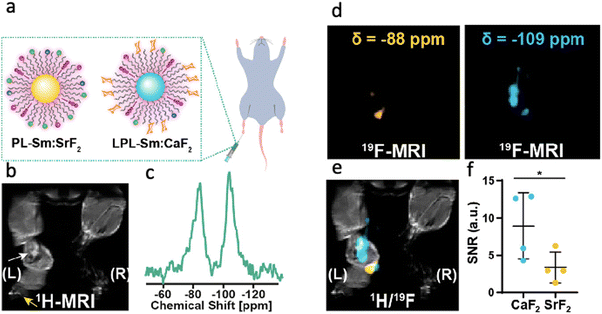 | ||
| Fig. 5 Multiplexed visualization of immunotargeting by nanofluorides. (a) Schematic representation of nonglycosylated PL-Sm:SrF2 and glycosylated LPL-Sm:CaF2 NFs injected as a mixture to the inflamed footpad of a mouse. (b) 1H-MRI of the inflamed footpad; the white arrow indicates the inflamed LN, and the yellow arrow represents the injection site. (c) In vivo19F-NMR spectrum acquired from the whole volume of the RF coil averaging all of the 19F-NMR signals of the administered material (total injected PL-Sm:SrF2 and LPL-Sm:CaF2). (d) 19F-MRI acquired with the center of frequency offset set at either −88 ppm (left, yellow) or −109 ppm (right, light blue). (e) Representative 1H/19F-MRI showing the higher accumulation of LPL-Sm:CaF2 NCs in the LN. (f) Dot graph presenting the 19F-MRI signal of either PL-Sm:SrF2 or LPL-Sm:CaF2 in the LN ROI (N = 4, Student's t-test, * represents a p value <0.05). Modified with permission from ref. 51. | ||
19F-MR CEST
Developed in the 1960s,59 the chemical exchange saturation transfer (CEST) NMR approach was “rediscovered” in the early 2000s when proposed as a contrast mechanism for MRI.60 Currently, diamagnetic CEST (diaCEST) agents are frequently used in molecular and cellular MR imaging and cover a wide range of applications.61–65 In CEST-MRI, a contrast is generated by the transfer of (saturated) magnetization from an exchangeable proton (of a solute, or a contrast agent) to that of water protons. Capitalizing on relatively fast exchange rates between exchangeable protons of the solute with water, even low-concentrated CEST agents (∼mM concentration) can be detected via changes in surrounding water magnetization (∼110 M of 1H). The proton transfer ratio (PTR), which is manifested by magnetization transfer asymmetry (MTRasym) or the CEST contrast can be simplified through eqn (1):66| PTR = xs·α·ksw·T1w(1 − e−tsat/T1w), | (1) |
 | (2) |
The establishment of 19F-CEST opened a new avenue for the design of MRI sensors, since it exploits the benefits of both methodologies, i.e., (i) the amplification effect of the CEST mechanism, and, because of the use of heteronuclear spins; (ii) the large Δω (several hundreds of ppm for non-proton spins); (iii) the high sensitivity of the obtained Δω to the local environment; and (iv) the lack of the background signal.
Metal-ion sensing using 19F-CEST
In recent years, MRI has emerged as a method capable of mapping metal ions, with a distinct advantage over fluorescent-based methods in that it is able to provide spatial localization of the ions of interest in deep tissues. Paramagnetic “smart contrast agents” were designed to sense a range of metal ions with biological importance, with some exciting demonstrations for in vivo mapping of dynamic changes in the levels of labile Zn2+![[thin space (1/6-em)]](https://www.rsc.org/images/entities/char_2009.gif) 69,70 and Ca2+
69,70 and Ca2+![[thin space (1/6-em)]](https://www.rsc.org/images/entities/char_2009.gif) 71,72 after pathological or physiological stimuli. We had extended the arsenal of such MRI smart agents with those that are based on fluorinated ligands capable of reversibly binding metal ions to generate 19F-CEST contrast (or ion CEST, iCEST).73
71,72 after pathological or physiological stimuli. We had extended the arsenal of such MRI smart agents with those that are based on fluorinated ligands capable of reversibly binding metal ions to generate 19F-CEST contrast (or ion CEST, iCEST).73
With the proposal of iCEST,73 we first showed that a combination of 19F-MRI and CEST can be used to spatially monitor Ca2+ ions with high specificity, capitalizing on the dynamic exchange between the ion-bound and -free 19F-ligand, and the shift in the Δω value of 19F in 19F-NMR upon ion binding (Fig. 6). Specifically, upon binding of the fluorinated ligand 1,2-bis(o-aminophenoxy)ethane-N,N,N′,N′-tetraacetic acid (5F-BAPTA) to Ca2+, a Δω value of 6.2 ppm between the chemical shifts of free 5F-BAPTA and of the complex Ca2+-5F-BAPTA was obtained in the 19F-NMR spectrum. Since these two states of 5F-BAPTA are in a dynamic exchange, the 19F-NMR signal of the Ca2+-5F-BAPTA complex can be transferred to that of free 5F-BAPTA through saturation transfer, and thus, indirectly detect low Ca2+ concentrations. Importantly, competitive ions, such as Mg2+ or Zn2+, which either do not bind (Mg2+) or bind very strongly (Zn2+) to 5F-BAPTA (Fig. 6b), cannot be detected with iCEST, making this approach highly specific (Fig. 6c–f). Using the tetrafluorinated derivative of the BAPTA (TF-BAPTA) chelate, a 19F-probe for iCEST with enhanced specificity for Zn2+ and Fe2+ ions was obtained.74
 | ||
| Fig. 6 The iCEST approach. (a) The dynamic exchange process between free 5F-BAPTA and M2+-bound [M2+-5F-BAPTA]. (b) 19F NMR spectra of 5F-BAPTA in the presence of Mg2+, Zn2+, or Ca2+. (c–e) Shown are 19F-iCEST Z-spectra of solutions containing 10 mM 5F-BAPTA and 50 μM M2+. (f) 1H-MRI, 19F-MRI, and iCEST (Δω = 6.2) of M2+ solutions. Reproduced with permission from ref. 73. | ||
Using TF-BAPTA as an iCEST MRI sensor for Zn2+, an MRI-based strategy was developed for the detection of prostate cancer.75 In that study, the authors showed that iCEST MRI is able to differentiate between normal and malignant prostate cells with a several-fold difference in the iCEST effect following glucose-stimulated zinc secretion both in vitro and in vivo. The iCEST effect of TF-BAPTA decreased dramatically following the transition of normal prostate epithelial cells to cancer cells, showing the potential of this approach for the early diagnosis of prostate cancer in the future, before the appearance of commonly detected physiological and morphological changes.
However, this demonstration of the tight binding of Zn2+ to TF-BAPTA (Kd in the nM range) may deviate from the basal cationic levels at high concentrations of the ligand, which are required for 19F-MRI. In addition, the relatively slow ion-chelate dissociation rate (koff = kex ∼ 20 s−1) leads to a low iCEST contrast. To overcome these limitations, we rationalized a new fluorinated ligand for iCEST studies of labile Zn2+, as shown in Fig. 7a. This 19F-probe aimed to loosen the binding of Zn2+ through the elongation of the distance between the two pyridine rings of the binding entity to obtain a very weak ion-chelate affinity (Kd = 5.5 ± 0.5 × 10⁻³ M) and a very fast dissociation rate (koff = 845 ± 35 s−1).76 Benefitting from the fast koff for MRI signal amplification (through the CEST principles), we were able to detect a wide range of cation concentrations (0.5–50 μM) using a single imaging probe. Relying on the chemical-shift specificity of NMR (Δw = +3.2 ppm), we demonstrated the frequency-specificity of the approach to exclusively map Zn2+, compared to competitive cations (Fig. 7b).
 | ||
| Fig. 7 19F-iCEST for mapping labile Zn2+ pools. (a) The molecular structure of the ultimate 19F-iCEST probe designed for mapping labile Zn2+ and the obtained 19F-iCEST effect (Δω = 3.2 ppm) of 3 mM probe and 30 μM Zn2+. (b) 19F-iCEST effect (Δω = 3.2 ppm) of 3 mM probe and 30 μM s-block (Na+, K+, Mg2+, Ca2+) and d-block (Mn2+, Fe2+, Co2+, Ni2+, Cu2+, Zn2+) metal ions obtained at 37 °C using a 9.4 T NMR spectrometer. (c) In vivo19F-iCEST maps of labile Zn2+ pools in the mouse brain. The results are shown for two regions of the brain: CA3 in the hippocampus (zinc-rich ROI, upper row) or the thalamus (TH, zinc-poor ROI, lower row). From left to right are the schematic illustrations of the setup used to deliver a zinc-responsive probe to either CA3 or TH, 1H-MRI, 19F-MRI obtained with saturation pulse applied “off-resonance” (Δω = −3.2 ppm), 19F-MRI obtained with saturation pulse applied “on resonance” (Δω = +3.2 ppm), the 19F-iCEST map (Zn2+ map) obtained from subtracting 19F-MRI S+3.2 ppm from 19F-MRI S−3.2 ppm overlaid on the 1H-MRI. Modified with permission from ref. 76. | ||
This ultimate 19F-iCEST probe was used for in vivo mapping of labile Zn2+ pools. For this purpose, two different regions of the brain, which are known for their different endogenous labile Zn2+ levels, were targeted. The CA3 region of the hippocampus was chosen as a region of interest (ROI) that is rich with labile Zn2+, and the thalamus (TH) as an ROI with very low levels of labile Zn2+. The 19F-iCEST maps were derived following the delivery of the probe to the ROI and showed a significant 19F-iCEST effect only in the CA3 region (Fig. 7c). When the very same probe was delivered at the same concentrations to a region that was not expected to have high levels of labile Zn2+ (TH), no 19F-iCEST was observed. This approach should be further extended for the monitoring of dynamic changes in Zn2+ levels upon chemical or physiological stimulation to underline the role of this ion in appropriate brain function and brain-related diseases. Nevertheless, the fast washout of 19F-iCEST from the imaging region and the need for its continuous infusion throughout the imaging session mandates additional development. One solution could be the use of smart imaging agents that self-assemble into large architectures under physiological conditions.33 Using this strategy, we demonstrated a prolonged 19F-MRI signal of an injectable probe even 20 hours after its delivery without the need for continuous infusion. These principles can be generalized and implemented for other types of imaging agents, which require prolonged imaging times or cannot tolerate fast washout rates.
19F-guest exchange saturation transfer (19F-GEST)
Capitalizing on the dynamic interactions in host–guest supramolecular assemblies and adopting the CEST principles, we proposed a novel approach termed GEST (guest exchange saturation transfer), which offers new possibilities for 19F-MRI. In 19F-GEST MRI, two pools of exchangeable fluorinated entities, A (free guest) and B (guest@host), experience different chemical shifts in the NMR spectrum (Fig. 8a). Similar to any CEST experiment, a pre-saturation pulse is applied at the frequency offset of pool B (set at a very low concentration, Fig. 8b), followed by a saturation transfer to reduce the 19F-MRI signal of pool A (set at a relatively high and 19F-MRI-detectable concentration, Fig. 8b). If the exchange process between A and B is fast enough, a significant change in the intensity of the 19F-MRI signal of the fluorinated agent represented by pool A is detected, allowing the detection, indirectly, of very low concentrations of a bound guest represented as pool B.77–79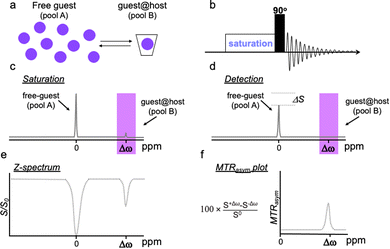 | ||
| Fig. 8 Schematic illustration of GEST NMR principles. (a) A system containing a much higher concentration of the free guest (pool A) than that of the bound guest (guest@host complex, pool B) is studied. (b) A frequency-selective pre-saturation RF pulse is introduced prior to the excitation pulse in a 1D-NMR experiment. While the pre-saturation RF pulse (c, saturation) is applied at the frequency offset of the guest@host, a reduction in the signal of the free guest, ΔSI, is detected (d, detection). (e) The NMR signal intensity of the free guest (pool A) is plotted as a function of the frequency offset of the applied pre-saturation RF pulse, to obtain the z-spectrum (or CEST spectrum). (f) The MTRasym plot calculated from the z-spectrum in (e). Reproduced with permission from ref. 79. | ||
As mentioned above, the frequency encodability of 19F-MRI agents had been used for the development of artificial MRI colors for multiplexed mapping of biological targets, mimicking the capabilities of multicolor luminescent probes.12,57,80 Although they have a relatively large chemical shift range, which can span over 200 ppm, and can be further expanded using paramagnetic shift elements,81,82 the need for their direct visualization in 19F-MRI prevents their use for multiplexed mapping of multiple targets at very low levels. In this regard, 19F-GEST MRI may offer an alternative. Capitalizing on different chemical shifts of the complexed 19F-guest (pool B) as a result of the properties of the molecular host, the GEST approach can be used for multi-target imaging with 19F-MRI. This can be applied with diamagnetic molecular hosts based on the natural difference of their inner cavity properties83 or with paramagnetic hosts, which are designed to induce a pseudo contact shift (PCS) to an exchanging 19F-guest, in the same manner used by paramagnetic CEST agents.84
Diamagnetic 19F-GEST
One major challenge in implementing GEST for 19F-MRI studies is the need to deliver both the host and the 19F-guest to the imaging region. To overcome this limitation, we took advantage of the natural properties of commonly used fluorinated anesthetics to be distributed in the brain through inhalation, thus providing a homogenous distribution of the 19F-guest in the tissues.83One specific fluorinated anesthetic, namely fluroxene (Fig. 9a), led to a pronounced 19F-GEST contrast in the presence of two different molecular hosts, i.e., cucurbit[7]uril (H2) and octa-acid (H7) with two opposite Δω values, either downfield (Δω = +1.6 ppm, represented as magenta in the GEST map), or upfield (Δω = −2.2 ppm, represented as the green color of the GEST contrast) relative to the chemical shift of unbound fluroxene (Fig. 9b–e). Examining the 19F-GEST effect in a localized spectroscopy manner showed the same observation (Fig. 9f and g). Here, two 19F-NMR spectra were acquired followed by the subtraction of the 19F-NMR spectrum obtained using the “on-resonance” pre-saturation pulse from that obtained when the pre-saturation pulse was applied “off-resonance.” The obtained 19F-GEST effect was clearly detected even in the presence of only 5 μM of either of the molecular hosts.83
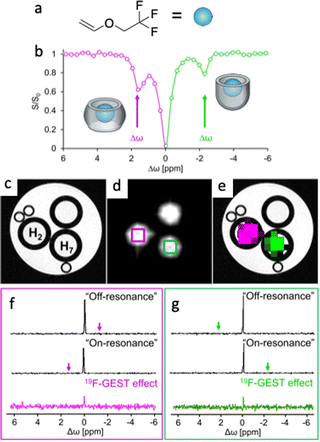 | ||
| Fig. 9 Diamagnetic GEST: (a) the chemical structure of the fluorinated anesthetic fluroxene used as an inhalable 19F-guest. (b) 19F-GEST z-spectrum obtained from an aqueous solution containing a mixture of cucurbit[7]uril (H2) and dimeric octa acid (H7). The sample contained 5 mM fluroxene and 10 μM of each host. (c) 1H-MRI, (d) 19F-MRI, and (e) 19F-GEST map of a three-tube phantom containing 5 mM fluroxene and 5 μM of either cucurbit[7]uril (H2) or octa acid (H7). A tube with 5 mM fluroxene only was used as a control. (f and g) Localized 19F-GEST spectroscopy data of two voxels acquired from the tubes containing (f) H2:fluroxene (magenta) or (g) H7:fluroxene (green). The 19F-GEST spectra represent the subtraction of the 19F-NMR spectra obtained when the saturation pulse was applied “on-resonance” from the 19F-NMR spectra obtained when the saturation pulse was applied “off-resonance.” Data were acquired with a 9.4 T MRI scanner with B1 = 2.5 μT/2 s. For fluroxene@H2, “on-resonance” was Δω = +1.6 ppm and “off-resonance” was Δω = −1.6 ppm. For fluroxene@H7, “on-resonance” was Δω = −2.2 ppm and “off-resonance” was Δω = +2.2 ppm. Modified with permission from ref. 83. | ||
Following the demonstration that a single fluorinated guest can be used to obtain two specific 19F-GEST effects (Fig. 9), and to benefit from the fact that this guest can be used as an inhalable anesthetic, it was delivered to the mouse brain through inhalation using a dedicated system (Fig. 10a). The homogenous distribution of the inhaled 19F-guest in the mouse brain was confirmed by 19F-MRI (ultrashort TE-based scheme, Fig. 10d and e). The two different molecular hosts, either cucurbit[7]uril or octa acid, were delivered intracranially to two contralateral hemispheres of the examined mouse brain. Localized 19F-GEST NMR data sets were acquired and clear in vivo19F-GEST effects were detected. These 19F-GEST effects were obtained at opposite Δω relative to that of the fluroxene (set at 0.0 ppm), i.e., downfield (Δω = +1.6 ppm, Fig. 10f) for the H2-fluroxene complex and upfield (Δω = −2.2 ppm, Fig. 10g) for the H7-fluroxene complex. This demonstration provided a foundation for the development of novel molecular architectures detectable at low concentrations by 19F-MRI. In future experiments, the molecular hosts for fluorine anesthetics can be modified in various ways. For example, molecular hosts can be fabricated to recognize and bind neuropathological features (e.g., brain tumors or amyloid plaques in Alzheimer's disease) and thus serve as highly-sensitive diagnostic tools for the detection of brain pathologies.
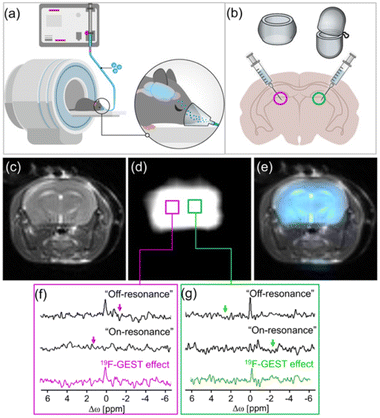 | ||
| Fig. 10 In vivo 19F-GEST of the anesthetic. (a and b) Schematic illustration of the in vivo experimental setup showing the delivery of the anesthetic to the mouse brain via inhalation (a) and the intracranial injection of the hosts (b). (c) 1H-MRI, (d) UTE-19F-MRI, and (e) 19F-MRI signal overlaid on the 1H-MRI of a live mouse anesthetized with 4% fluoroxene. (f and g) Localized 19F-GEST spectroscopy data of two voxels acquired from the regions injected with H2 (magenta) and (g) H7 (green). The 19F-GEST spectra represent the subtraction of the 19F-NMR spectra obtained when the saturation pulse was applied “on-resonance” from the 19F-NMR spectra generated when the saturation pulse was applied “off-resonance.” The “off-resonance” frequencies were Δω = −1.6 ppm for H2-fluoroxene and Δω = +2.2 ppm for H7-fluoroxene, and the “on-resonance” frequencies were Δω = +1.6 ppm for H2-fluoroxene and Δω = −2.2 ppm for H7-fluoroxene. Reproduced with permission from ref. 83. | ||
Paramagnetic GEST using paramagnetic cavitands
Despite the successful demonstration of 19F-GEST in vivo83 (Fig. 10), diamagnetic 19F-GEST is limited to a relatively low spectral separation between a host-bound and -free fluorinated agent (Δw values of only a few ppm). This limitation restricts not just the 19F-GEST spectral resolution and the ability to differentiate between different artificial 19F-colors, but also the number of such colors that could be designed. Moreover, the Δw > kex condition, which stands for 1H-CEST, as well as for 19F-GEST, mandates the use of host–guest molecular systems that experience relatively slow exchange dynamics. To overcome these limitations, we adopted the principles of paramagnetic CEST agents67,68 to introduce paramagnetic 19F-GEST (paraGEST).84 As a first step, we synthesized a library of paramagnetic α-cyclodextrins (para-CDs, Fig. 11a) as the putative paramagnetic hosts. Then, the essential structural characteristics of the 19F-guest were studied, which necessitated a benzylamine backbone for paraGEST observation, with the position of the fluorine substituent affecting the observed Δw of the paraGEST effect.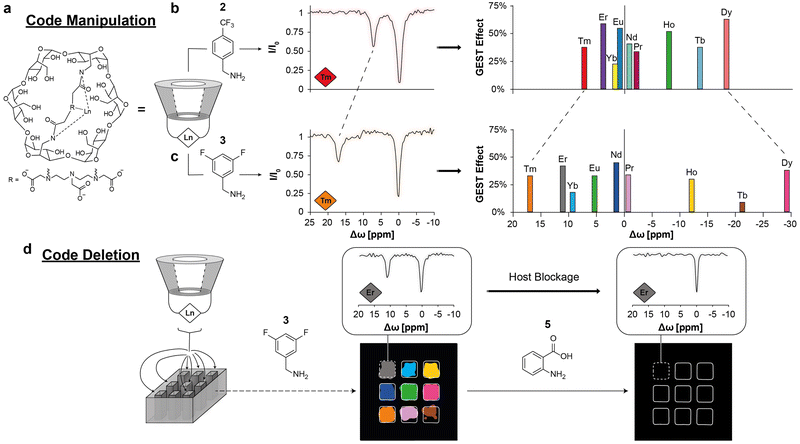 | ||
| Fig. 11 The CODE-HD method based on paraGEST. (a) The molecular structure of the paramagnetic host Ln-CD. The principles for code manipulation are shown in (b) and (c). The obtained z-spectra of a solution of thulium-cyclodextrin (Tm-CD, red and orange diamonds) in the presence of either 2 (b) or 3 (c), and plots showing the obtained chemical shift offset (Δω) values from paraGEST experiments with different Ln-CDs as the hosts and either 2 (b) or 3 (c) as the guest, and the assigned colors for each host–guest pair. (d) Code deletion. CODE-HD color map obtained from different pairs of Ln-CD and 3, which is deleted upon anthranilic acid (5) addition to each one of the wells. The z-spectra obtained from the well containing erbium-cyclodextrin (Er-CD, gray diamond) before and after the addition of 5 is shown in the insets. Modified with permission from ref. 84. | ||
Having established the paraGEST principles for a single host–guest pair, we used this approach for multiplexed 19F-MR imaging based on paramagnetic supramolecular systems. We termed the generation of artificial colors for MR images the Color Display by Exploiting Host–guest Dynamics (CODE-HD), which was demonstrated by nine host–guest pairs. Using 4-(trifluoromethyl)benzylamine as the fluorinated guest (guest 2 at Fig. 11b) and different para-CDs, an array of single and well-defined paraGEST effects were obtained for all examined pairs. Each host–guest pair showed a characteristic Δω value, which depends on the identity of the lanthanide (Tm, Er, Yb, Eu, Nd, Pr, Ho, Tb, or Dy) at the paraCD host (or Ln-CD). Assigning each Δω value a color provided us with nine artificial paraGEST colors that could be displayed as an MRI map (Fig. 11b). In contrast to other luminescent colors and, even in relation to 1H-CEST colors, the color palette of paraGEST can be easily converted to a different one by replacing the fluorinated guest. For example, using 3,5-difluorobenzylamine as the guest (guest 3) resulting in a different characteristic Δω value with each of the paraCD hosts (Fig. 11c). Using a competitor (non-fluorinated) guest (guest 5, Fig. 11d), which bound to the paraCD host much more tightly, resulting in the elimination of the paraGEST effect (Fig. 11d), a unique feature that is not applicable for luminescence-based colors and may be considered in the future for advanced applications.
Summary and future perspectives
The growing interest in quantitative methods for in vivo imaging with a reduced level of false-positive results had led to the expansion of the available fluorinated probes for background-free molecular and cellular 19F-MRI studies. Indeed, these demonstrations continue to stimulate the development of more advanced agents for improved performances and diverse capabilities that were not demonstrated in the field of 19F-MRI just a few years ago. In that regard, our development summarized here expands the 19F-MRI toolbox available today, not just with new molecular architectures, but also with novel concepts for future designs of fluorinated probes. The use of nanofluorides as imaging agents of 19F-MRI offers to combine the advantages of ultrasmall inorganic NCs with the merits of background-free imaging, and thus, proposes an alternative to metal-oxide NCs. For example, nanofluorides can be used to label and track extracellular vesicles (EVs), which garnered much interest recently in a variety of fields. The ca. 100–120 nm size of EVs requires their labeling with relatively small inorganic NCs, such as iron oxide NCs for MRI studies,85,86 thus making nanofluorides very attractive for background-free MRI of EVs. The implementation of the CEST contrast mechanism for 19F-MRI studies opens new opportunities to detect very low concentrations of the target that were otherwise undetectable. Shown for several metal ions, 19F-iCEST probes should now be further developed for additional metal ions with biological relevance. 19F-GEST MRI opens new directions through which multiple targets at very low concentrations could be monitored and mapped in a multicolor way.The 19F-MRI toolbox is continuously expanding with additional developments by others, beyond those summarized in this Feature Article. For example, the recent implementation of hyperpolarization techniques to amplify 19F-MRI signals is very promising49,87 in light of the revolution made by hyperpolarized 13C-MRI.88 Another example is the use of fluorinated ionic liquids, which were developed to undergo phase transition upon exposure to environmental stimulation, and which, therefore, could be used as “turn-on” 19F-MRI-responsive agents.27,80 The recent developments in hardware allow the use of cryogenic RF coils for improved SNRs of 19F-MRI data,89 and advanced acquisition schemes are being implemented to improve the performance of 19F-MRI studies.90,91 In light of these developments, the collaboration of MR physicists, chemists, radiologists, and scientists from other fields should be encouraged to advance 19F-MRI to new frontiers that are as yet inaccessible to this background-free imaging approach.
Conflicts of interest
There are no conflicts to declare.Acknowledgements
A. G. research was supported by the Czech Science Foundation (GACR) – Grant no. 22-13334I. A. B.-S. research was supported by the Israel Science Foundation (ISF 1329/20), the Minerva Foundation, and the Clore Institute for High Field Magnetic Resonance Spectroscopy and Imaging.References
- G. N. Holland, P. A. Bottomley and W. S. Hinshaw, J. Magn. Reson., 1977, 28, 133–136 CAS.
- S. Mizukami, R. Takikawa, F. Sugihara, Y. Hori, H. Tochio, M. Wälchli, M. Shirakawa and K. Kikuchi, J. Am. Chem. Soc., 2008, 130, 794–795 CrossRef CAS PubMed.
- J.-X. Yu, V. D. Kodibagkar, R. R. Hallac, L. Liu and R. P. Mason, Bioconjug. Chem., 2012, 23, 596–603 CrossRef CAS PubMed.
- M. Yu, B. S. Bouley, D. Xie and E. L. Que, Dalton Trans., 2019, 48, 9337–9341 RSC.
- K. Srivastava, E. A. Weitz, K. L. Peterson, M. Marjańska and V. C. Pierre, Inorg. Chem., 2017, 56, 1546–1557 CrossRef CAS PubMed.
- O. Sedlacek, D. Jirak, A. Galisova, E. Jager, J. E. Laaser, T. P. Lodge, P. Stepanek and M. Hruby, Chem. Mater., 2018, 30(15), 4892–4896 CrossRef CAS.
- C. Fu, S. Herbst, C. Zhang and A. K. Whittaker, Polym. Chem., 2017, 8, 4585–4595 RSC.
- E. Ahrens, B. Helfer, C. F. O’Hanl and C. Schirda, Magn. Reson. Med., 2014, 72, 1696–1701 CrossRef CAS PubMed.
- E. Swider, A. H. J. Staal, N. van Riessen, L. Jacobs, P. B. White, R. Fokkink, G.-J. Janssen, E. van Dinther, C. G. Figdor, I. J. de Vries, O. Koshkina and M. Srinivas, RSC Adv., 2018, 8, 6460–6470 RSC.
- M. Srinivas, P. A. Morel, L. A. Ernst, D. H. Laidlaw and E. T. Ahrens, Magn. Reson. Med., 2007, 58, 725–734 CrossRef CAS PubMed.
- A. Gálisová, V. Herynek, E. Swider, E. Sticová, A. Pátiková, L. Kosinová, J. Kříž, M. Hájek, M. Srinivas and D. Jirák, Mol. Imaging Biol., 2019, 21, 454–464 CrossRef PubMed.
- U. Flögel, S. Temme, C. Jacoby, T. Oerther, P. Keul, V. Flocke, X. Wang, F. Bönner, F. Nienhaus, K. Peter, J. Schrader, M. Grandoch, M. Kelm and B. Levkau, Nat. Commun., 2021, 12, 5847 CrossRef PubMed.
- E. T. Ahrens, R. Flores, H. Xu and P. A. Morel, Nat. Biotechnol., 2005, 23, 983–987 CrossRef CAS PubMed.
- U. Flögel, Z. Ding, H. Hardung, S. Jander, G. Reichmann, C. Jacoby, R. Schubert and J. Schrader, Circulation, 2008, 118, 140–148 CrossRef PubMed.
- P. Boehm-Sturm, L. Mengler, S. Wecker, M. Hoehn and T. Kallur, PLoS One, 2011, 6, e29040 CrossRef CAS PubMed.
- T. Nakamura, F. Sugihara, H. Matsushita, Y. Yoshioka, S. Mizukami and K. Kikuchi, Chem. Sci., 2015, 6, 1986–1990 RSC.
- J. Gaudet, E. Ribot, Y. Chen, K. Gilbert and P. Foster, PLos, 2015, 10, e0118544 CrossRef PubMed.
- K. Cai, L. Zhang, J. Myerson, W. Huang, S. D. Caruthers, G. M. Lanza, S. A. Wickline and P. M. Winter, J. Cardiovasc. Magn. Reson., 2009, 11, T6 CrossRef.
- X. Xu, Y. Yan, F. Liu, L. Wu, M. Shao, K. Wang, X. Sun, Y. Li, E. S. W. Beinpuo and B. Shen, J. Magn. Reson. Imaging, 2018, 48, 1617–1625 CrossRef PubMed.
- H. Zhang, Q. Yu, Y. Li, Z. Yang, X. Zhou, S. Chen and Z.-X. Jiang, Chem. Commun., 2020, 56, 3617–3620 RSC.
- H. Zhang, S. Bo, K. Zeng, J. Wang, Y. Li, Z. Yang, X. Zhou, S. Chen and Z.-X. Jiang, J. Mater. Chem. B, 2020, 8, 4469–4474 RSC.
- T. Wu, K. Chen, M. Jiang, A. Li, X. Peng, S. Chen, Z. Yang, X. Zhou, X. Zheng and Z.-X. Jiang, Org. Biomol. Chem., 2022, 20, 1299–1305 RSC.
- D. Xie, M. Yu, R. T. Kadakia and E. L. Que, Acc. Chem. Res., 2020, 53, 2–10 CrossRef CAS PubMed.
- M. Yu, D. Xie, R. T. Kadakia, W. Wang and E. L. Que, Chem. Commun., 2020, 56, 6257–6260 RSC.
- D. Xie, T. L. King, A. Banerjee, V. Kohli and E. L. Que, J. Am. Chem. Soc., 2016, 138, 2937–2940 CrossRef CAS PubMed.
- A. Sarkar, I. E. Biton, M. Neeman and A. Datta, Inorg. Chem. Commun., 2017, 78, 21–24 CrossRef CAS.
- X. Zhu, X. Tang, H. Lin, S. Shi, H. Xiong, Q. Zhou, A. Li, Q. Wang, X. Chen and J. Gao, Chem, 2020, 6, 1134–1148 CAS.
- R. Zhang, Q. Ma, G. Hu and L. Wang, Anal. Chem., 2022, 94, 3727–3734 CrossRef CAS PubMed.
- A. Li, X. Luo, L. Li, D. Chen, X. Liu, Z. Yang, L. Yang, J. Gao and H. Lin, Anal. Chem., 2021, 93, 16552–16561 CrossRef CAS PubMed.
- X. Huang, G. Huang, S. Zhang, K. Sagiyama, O. Togao, X. Ma, Y. Wang, Y. Li, T. C. Soesbe, B. D. Sumer, M. Takahashi, A. D. Sherry and J. Gao, Angew. Chem., Int. Ed., 2013, 52, 8074–8078 CrossRef CAS PubMed.
- K. Wang, H. Peng, K. J. Thurecht, S. Puttick and A. K. Whittaker, Polym. Chem., 2013, 4, 4480–4489 RSC.
- X. Tang, X. Gong, A. Li, H. Lin, C. Peng, X. Zhang, X. Chen and J. Gao, Nano Lett., 2020, 20, 363–371 CrossRef CAS PubMed.
- N. D. Tirukoti, L. Avram, R. Mashiach, H. Allouche-Arnon and A. Bar-Shir, Chem. Commun., 2022, 58, 11410–11413 RSC.
- O. Sedlacek, D. Jirak, A. Galisova, E. Jager, J. E. Laaser, T. M. Lodge, P. Stepanek and M. Hruby, Chem. Mater., 2018, 30, 4892–4896 CrossRef CAS.
- J. Salaam, M. Minoshima and K. Kikuchi, Anal. Sens., 2022, e202200081 Search PubMed.
- I. Tirotta, V. Dichiarante, C. Pigliacelli, G. Cavallo, G. Terraneo, F. B. Bombelli, P. Metrangolo and G. Resnati, Chem. Rev., 2015, 115, 1106–1129 CrossRef CAS PubMed.
- C. Zhang, K. Yan, C. Fu, H. Peng, C. J. Hawker and A. K. Whittaker, Chem. Rev., 2022, 122, 167–208 CrossRef CAS PubMed.
- M. H. Cho, S. H. Shin, S. H. Park, D. K. Kadayakkara, D. Kim and Y. Choi, Bioconjug. Chem., 2019, 30, 2502–2518 CrossRef CAS PubMed.
- S. Temme, F. Bönner, J. Schrader and U. Flögel, Wiley Interdiscip. Rev.: Nanomed. Nanobiotechnol., 2012, 4, 329–343 CAS.
- J. Park, E. Lee, N.-M. Hwang, M. Kang, S. C. Kim, Y. Hwang, J.-G. Park, H.-J. Noh, J.-Y. Kim, J.-H. Park and T. Hyeon, Angew. Chem., Int. Ed., 2005, 44, 2872–2877 CrossRef CAS PubMed.
- Z. Zhao, Z. Zhou, J. Bao, Z. Wang, J. Hu, X. Chi, K. Ni, R. Wang, X. Chen, Z. Chen and J. Gao, Nat. Commun., 2013, 4, 2266 CrossRef PubMed.
- J.-H. Lee, Y.-M. Huh, Y. Jun, J. Seo, J. Jang, H.-T. Song, S. Kim, E.-J. Cho, H.-G. Yoon, J.-S. Suh and J. Cheon, Nat. Med., 2007, 13, 95–99 CrossRef CAS PubMed.
- R. Weissleder, K. Kelly, E. Y. Sun, T. Shtatland and L. Josephson, Nat. Biotechnol., 2005, 23, 1418–1423 CrossRef CAS PubMed.
- I. Ashur, H. Allouche-Arnon and A. Bar-Shir, Angew. Chem., Int. Ed., 2018, 57, 7478–7482 CrossRef CAS PubMed.
- O. L. Gobbo, K. Sjaastad, M. W. Radomski, Y. Volkov and A. Prina-Mello, Theranostics, 2015, 5, 1249–1263 CrossRef CAS PubMed.
- C. Chirizzi, C. Morasso, A. A. Caldarone, M. Tommasini, F. Corsi, L. Chaabane, R. Vanna, F. B. Bombelli and P. Metrangolo, J. Am. Chem. Soc., 2021, 143, 12253–12260 CrossRef CAS PubMed.
- M. Srinivas, A. Heerschap, E. T. Ahrens, C. G. Figdor and I. J. M. de Vries, Trends Biotechnol., 2010, 28, 363–370 CrossRef CAS PubMed.
- E. Matei and A. M. Gronenborn, Angew. Chem., Int. Ed., 2016, 55, 150–154 CrossRef CAS PubMed.
- J. Bernarding, F. Euchner, C. Bruns, R. Ringleb, D. Müller, T. Trantzschel, J. Bargon, U. Bommerich and M. Plaumann, Chem. Phys. Chem., 2018, 19, 2453–2456 CrossRef CAS PubMed.
- W. Li, Q. Zhang, J. J. Joos, P. F. Smet and J. Auf der Günne, Phys. Chem. Chem. Phys., 2019, 21, 10185–10194 RSC.
- D. Cohen, R. Mashiach, L. Houben, A. Galisova, Y. Addadi, D. Kain, A. Lubart, P. Blinder, H. Allouche-Arnon and A. Bar-Shir, ACS Nano, 2021, 15, 7563–7574 CrossRef CAS PubMed.
- R. Mashiach, H. Weissman, L. Avram, L. Houben, O. Brontvein, A. Lavie, V. Arunachalam, M. Leskes, B. Rybtchinski and A. Bar-Shir, Nat. Commun., 2021, 12, 229 CrossRef CAS PubMed.
- R. Mashiach, D. Cohen, L. Avram, T. Harris, I. Pinkas, L. Houben, H. Allouche-Arnon and A. Bar-Shir, Nano Lett., 2020, 20, 7207–7212 CrossRef CAS PubMed.
- R. Xu, F. Meng, Y. Liu, D. Duosiken, K. Sun, S. Pan and K. Tao, Chem. Commun., 2021, 57, 9148–9151 RSC.
- J. L. Betker and T. J. Anchordoquy, J. Pharm. Sci., 2020, 109, 1573–1580 CrossRef CAS PubMed.
- M. Rabyk, A. Galisova, M. Jiratova, V. Patsula, L. Srbova, L. Loukotova, J. Parnica, D. Jirak, P. Stepanek and M. Hruby, J. Mater. Chem. B, 2018, 6(17), 2584–2596 RSC.
- K. Akazawa, F. Sugihara, T. Nakamura, H. Matsushita, H. Mukai, R. Akimoto, M. Minoshima, S. Mizukami and K. Kikuchi, Angew. Chem., Int. Ed., 2018, 57, 16742–16747 CrossRef CAS PubMed.
- C. Chirizzi, D. De Battista, I. Tirotta, P. Metrangolo, G. Comi, F. B. Bombelli and L. Chaabane, Radiology, 2019, 291, 351–357 CrossRef PubMed.
- S. Forsén, J. Chem. Phys., 1963, 39, 2892 CrossRef.
- K. M. Ward, A. H. Aletras and R. S. Balaban, J. Magn. Reson., 2000, 143, 79–87 CrossRef CAS PubMed.
- A. Bar-Shir, J. W. M. Bulte and A. A. Gilad, ACS Chem. Biol., 2015, 10, 1160–1170 CrossRef CAS PubMed.
- K. W. Y. Chan, M. T. McMahon, Y. Kato, G. Liu, J. W. M. Bulte, Z. M. Bhujwalla, D. Artemov and P. C. M. van Zijl, Magn. Reson. Med., 2012, 68, 1764–1773 CrossRef CAS PubMed.
- Z. Han, Y. Li, J. Zhang, J. Liu, C. Chen, P. C. van Zijl and G. Liu, Cancer Res., 2019, 79, 2775–2783 CrossRef CAS PubMed.
- D. L. Longo, A. Busato, S. Lanzardo, F. Antico and S. Aime, Magn. Reson. Med., 2013, 70, 859–864 CrossRef CAS PubMed.
- H. Allouche-Arnon, O. Khersonsky, N. D. Tirukoti, Y. Peleg, O. Dym, S. Albeck, A. Brandis, T. Mehlman, L. Avram, T. Harris, N. N. Yadav, S. J. Fleishman and A. Bar-Shir, Nat. Biotechnol., 2022, 40, 1143–1149 CrossRef CAS PubMed.
- P. C. M. van Zijl and N. N. Yadav, Magn. Reson. Med., 2011, 65, 927–948 CrossRef CAS PubMed.
- S. Aime, D. Delli Castelli, F. Fedeli and E. Terreno, J. Am. Chem. Soc., 2002, 124, 9364–9365 CrossRef CAS PubMed.
- S. Zhang, R. Trokowski and A. D. Sherry, J. Am. Chem. Soc., 2003, 125, 15288–15289 CrossRef CAS PubMed.
- A. J. M. Lubag, L. M. De Leon-rodriguez, S. C. Burgess and A. D. Sherry, Proc. Natl. Acad. Sci. U. S. A., 2011, 108, 18400–18405 CrossRef CAS PubMed.
- V. Clavijo Jordan, C. D. G. Hines, L. T. Gantert, S. Wang, S. Conarello, C. Preihs, S. Chirayil, M. Klimas, J. L. Evelhoch and A. D. Sherry, Front. Endocrinol., 2021, 12, 641722 CrossRef PubMed.
- T. Savić, G. Gambino, V. S. Bokharaie, H. R. Noori, N. K. Logothetis and G. Angelovski, Proc. Natl. Acad. Sci. U. S. A., 2019, 116, 20666–20671 CrossRef PubMed.
- A. Barandov, B. B. Bartelle, C. G. Williamson, E. S. Loucks, S. J. Lippard and A. Jasanoff, Nat. Commun., 2019, 10, 897 CrossRef PubMed.
- A. Bar-Shir, A. A. Gilad, K. W. Y. Chan, G. Liu, P. C. M. van Zijl, J. W. M. Bulte and M. T. McMahon, J. Am. Chem. Soc., 2013, 135, 12164–12167 CrossRef CAS PubMed.
- A. Bar-Shir, N. N. Yadav, A. A. Gilad, P. C. M. van Zijl, M. T. McMahon and J. W. M. Bulte, J. Am. Chem. Soc., 2015, 137, 78–81 CrossRef CAS PubMed.
- Y. Yuan, Z. Wei, C. Chu, J. Zhang, X. Song, P. Walczak and J. W. M. Bulte, Angew. Chem., Int. Ed., 2019, 58, 15512–15517 CrossRef CAS PubMed.
- N. D. Tirukoti, L. Avram, T. Haris, B. Lerner, Y. Diskin-Posner, H. Allouche-Arnon and A. Bar-Shir, J. Am. Chem. Soc., 2021, 143, 11751–11758 CrossRef CAS PubMed.
- L. Avram, A. D. Wishard, B. C. Gibb and A. Bar-Shir, Angew. Chem., Int. Ed., 2017, 56, 15314–15318 CrossRef CAS PubMed.
- L. Avram, M. A. Iron and A. Bar-Shir, Chem. Sci., 2016, 7, 6905–6909 RSC.
- L. Avram and A. Bar-Shir, Org. Chem. Front., 2019, 6, 1503–1512 RSC.
- X. Zhu, H. Xiong, S. Wang, Y. Li, J. Chi, X. Wang, T. Li, Q. Zhou, J. Gao and S. Shi, Adv. Healthc. Mater., 2022, 11, e2102079 CrossRef PubMed.
- M. Yu, B. S. Bouley, D. Xie, J. S. Enriquez and E. L. Que, J. Am. Chem. Soc., 2018, 140, 10546–10552 CrossRef CAS PubMed.
- J. Kretschmer, T. David, M. Dračínský, O. Socha, D. Jirak, M. Vít, R. Jurok, M. Kuchař, I. Císařová and M. Polasek, Nat. Commun., 2022, 13, 3179 CrossRef CAS PubMed.
- R. Shusterman-Krush, N. D. Tirukoti, A. K. Bandela, L. Avram, H. Allouche-Arnon, X. Cai, B. C. Gibb and A. Bar-Shir, Angew. Chem., Int. Ed., 2021, 60, 15405–15411 CrossRef CAS PubMed.
- E. Goren, L. Avram and A. Bar-Shir, Nat. Commun., 2021, 12, 3072 CrossRef CAS PubMed.
- A. Galisova, J. Zahradnik, H. Allouche-Arnon, M. I. Morandi, P. Abou Karam, M. Fisler, O. Avinoam, N. Regev-Rudzki, G. Schreiber and A. Bar-Shir, ACS Nano, 2022, 16, 12276–12289 CrossRef CAS PubMed.
- Z. Han, S. Liu, Y. Pei, Z. Ding, Y. Li, X. Wang, D. Zhan, S. Xia, T. Driedonks, K. Witwer, R. Weiss, P. Zijl, J. Bulte, L. Cheng and G. Liu, J. Extracell. vesicles, 2021, 10, e12054 CAS.
- J. Bernarding, C. Bruns, I. Prediger and M. Plaumann, Appl. Magn. Reson., 2022, 53, 1375–1398 CrossRef CAS.
- K. Golman, J. H. Ardenkjaer-Larsen, J. S. Petersson, S. Mansson and I. Leunbach, Proc. Natl. Acad. Sci. U. S. A., 2003, 100, 10435–10439 CrossRef CAS PubMed.
- S. Waiczies, J. M. Millward, L. Starke, P. R. Delgado, T. Huelnhagen, C. Prinz, D. Marek, D. Wecker, R. Wissmann, S. P. Koch, P. Boehm-Sturm, H. Waiczies, T. Niendorf and A. Pohlmann, Sci. Rep., 2017, 7, 9808 CrossRef PubMed.
- L. Starke, A. Pohlmann, C. Prinz, T. Niendorf and S. Waiczies, Magn. Reson. Med., 2020, 84, 592–608 CrossRef PubMed.
- J. Chen, P. Pal and E. T. Ahrens, NMR Biomed., 2022, 35, e4725 CAS.
| This journal is © The Royal Society of Chemistry 2023 |

