 Open Access Article
Creative Commons Attribution 3.0 Unported Licence
Post aerobic digestion (PAD) is a solids sidestream nutrient removal process that utilizes native carbon: performance and key operational parameters from two full-scale PAD reactors
Patrick
McNamara
 ab,
Fabrizio
Sabba
 a,
Eric
Redmond
a,
Patrick
Dunlap
a,
Thomas
Worley-Morse
a,
Eric
Redmond
a,
Patrick
Dunlap
a,
Thomas
Worley-Morse
 c,
Christopher
Marks
 d and
Leon
Downing
*a
aBlack & Veatch, Water Technology Group, USA. E-mail: Patrick.mcnamara@marquette.edu; DowningL@BV.com
bMarquette University, Dept of Civil, Construction & Environmental Engineering, Milwaukee WI, USA
cMetro Water Recovery, Denver CO, USA
dCity of Boulder Utilities, Boulder CO, USA
First published on 21st April 2022
Abstract
Nutrient management is a critical issue for Water Resource Recovery Facilities, and sidestream treatment technologies to reduce nutrient loads often focus on liquid sidestreams and require external carbon sources. Post aerobic digestion (PAD), whereby an aerobic digester follows an anaerobic digester, treats a solids stream (i.e., anaerobic digester effluent) to reduce nitrogen loads. Volatile solids reduction occurs in this process with residual organic compounds serving as a native carbon source for denitrification. While this process has been evaluated at the lab-scale, information on operational parameters that affect full-scale performance is limited. We evaluated two separate full-scale PAD reactors to determine process performance and key operational parameters. During healthy operation, ammonia removal was greater than 90%, total inorganic nitrogen removal was greater than 80%, and volatile solids reduction was approximately 10%. Low SRT values of 7–10 days, pH ranges of 6.0–7.5, temperatures from 29–38 °C (85–100 °F), and negative ORP values resulted in good performance.
Environmental significanceExcess nutrients can have dire consequences on surface water quality. As a result, regulations have tightened on the effluent nutrient loads permitted from water resource recovery facilities. Nutrient removal has often focused on the liquid stream and can be a costly process. The addition of an aerobic digestion process following anaerobic digestion (PAD) can remove nutrients from the wastewater solid streams. The PAD process does not require additional carbon sources and can reduce the total nutrient burden through biological conversion of ammonia to nitrogen gas. |
1 Introduction
Nitrogen and phosphorus are key nutrients for all forms of life. Paradoxically, elevated nutrient concentrations can lead to unwanted growth of algae and microbes, leading to eutrophication.1 The removal of these nutrients is of increasing concern for Water Resource Recovery Facilities (WRRFs), and removal via novel methods can be costly.2 Nutrient removal at WRRFs has primarily focused on mainstream liquid phase removal.3–5 Nitrification has been applied for decades in aeration basins to convert ammonia to nitrate.6 Denitrification, whereby nitrate is reduced to nitrogen gas, has been applied as a mainstream nutrient removal treatment process at WRRFs that need to remove total nitrogen, and denitrification also occurs at WWTPs that implement enhanced biological phosphorus removal (EBPR).7,8 EBPR – a biological process involving anaerobic and aerobic zones – is a mainstream nutrient removal process that has been implemented at WRRFs that discharge to phosphorus sensitive waters.9Mainstream nutrient removal for both nitrogen and phosphorus is typically driven by, and limited by, carbon availability.10 Achieving low effluent nutrient limits for both nitrogen and phosphorus requires sufficient native carbon to serve as a carbon source and/or electron donor.11 When this carbon is not available, external carbon sources (or other types of electron donors) are required. For example, acetic acid, glycerin, and methanol are commonly used as an external carbon source and electron donor. Recent research has investigated alternative electron donors for denitrification to help mitigate the costs of external carbon addition,12–14 and carbon expenses associated with mainstream nutrient removal has led to alternative approaches for nutrient removal, such as sidestream treatment.
Sidestream liquid treatment processes for nitrogen and phosphorus removal can significantly improve mainstream performance and reduce carbon requirements in the mainstream treatment process by reducing the burden of the sidestream nutrient load on the main process.15–17 Deammonification systems, for example, employ the use of anammox bacteria to reduce oxygen and carbon requirements while removing nitrogen.18,19 Sidestream enhanced biological phosphorus removal (S2EBPR) has been investigated as a liquid sidestream treatment process to remove phosphorus while minimizing the need for external carbon.17,20 Most nutrient removal processes have focused on liquid streams employing biological treatment processes not requiring carbon (e.g. deammonification) or chemical precipitation processes such as struvite production.21 Biosolids also contain a substantial amount of nutrients and native carbon sources. The anaerobic digestion process causes ammonia levels to increase in the soluble phase,22 and this ammonia is often returned to the head of the plant after dewatering. Solids handling processes that reduce ammonia would mitigate the burden from recycled, nutrient-heavy streams on mainstream nutrient removal processes. In general, nutrient removal options for biosolids handling processes are limited. One area less leveraged is biosolids treatment as a sidestream treatment technology for nitrogen removal.
Following anaerobic digestion with an aerobic digestion process is referred to as post-aerobic digestion (PAD). This under-studied, under-used process offers an effective way to break sidestream nutrient recycling and to increase volatile solids destruction. The soluble biodegradable carbon leaving a conventional anaerobic digester is low, but in PAD aerobic endogenous decay occurs, resulting in additional volatile solids destruction.23,24 An additional benefit is that some solids are theorized to only be digestible under aerobic conditions so combining anaerobic and aerobic digestion allows for a wider degradation of solids.25 Indeed, the addition of PAD following anaerobic digestion increased volatile solids reduction from 50% to 62% at the lab scale.26 This finding was corroborated by others who found that PAD provided an additional 11% volatile solids reduction.27 Improved degradation can also be achieved via pre-treatment of the biomass. Recent work from Wang et al. (2016) highlighted that free nitrous acid pretreatment of anaerobically digested sludge prior to PAD could also improve biodegradation of solids.28 Additionally, ultrasonic pretreatment of anaerobically digested sludge prior to PAD has also been shown to improve solids removal.29
The solids content of PAD is high compared to a mainstream process and therefore the higher oxygen uptake rates result in low or non-detectable oxygen concentrations within the reactor, depending on location within the PAD reactor (i.e., dissolved oxygen varies across both macro- and micro-environments). These conditions result in nitrogen removal without the need to provide an external carbon source and was postulated to be to the result of simultaneous nitrification and denitrification.30
Biological processes, such as anaerobic digestion, have a known range of healthy operating conditions and loading capacities, it is necessary to identify important operational parameters for PAD to understand capability, design, and trouble-shooting approaches. Moreover, full-scale analysis is required to know real-world process capabilities for nutrient loading and removal. The PAD process has been previously documented at the lab-scale,27,31,32 but limited information is available on operational parameters for the PAD process at full-scale.23 Thus, future design parameters and current understanding of operational parameters that drive this process are not well documented or understood.
The main goal of this research was to analyze two different full-scale PAD operations to determine key operational parameters and process function capabilities. The PAD process has been a critical component of overall nitrogen removal at the Northern Treatment Plant (NTP) for the Metro Water Recovery in Denver and at Boulder's WRRF. Multiple years of data were analyzed that included periods of healthy operation and process upset. The process upset data allowed for insight into key operational parameters that impact the process. The specific objectives of this work were to (1) determine the range of nitrogen removal rates observed in healthy operating full-scale PAD reactors, (2) determine volatile solids reduction (VSR), (3) determine the impact of ammonia loading rate on ammonia removal rate, and (4) elucidate the impacts of changing key operational parameters (SRT, pH, temperature, dissolved oxygen, alkalinity) on performance. To the best of our knowledge, this is the first publication reporting on how these operational parameters impact full-scale PAD operation and can serve as a cornerstone to develop foundational understanding of PAD for improving nitrogen and solids removal.
2 Materials and methods
Analysis of full-scale data from the NTP in Denver and the WRRF in Boulder was conducted. The average influent flow at NTP is approximately 5.6 MGD. The NTP mainstream secondary treatment is a variation of the 5-stage Bardenpho process with step feed for both total nitrogen and total phosphorus removal. Nutrient removal is supported with internally produced carbon from the unified fermentation and thickening process, external carbon, and alum to meet effluent nutrient limits of 1 mgP L−1 and 10 mgN L−1 for total phosphorus and combined nitrite/nitrate, respectively. Primary and secondary sludges are mixed, after thickening, and fed to a mesophilic anaerobic digester at an approximate ratio of 50% primary/50% secondary sludge, and the average SRT of the anaerobic digester is 65 days. The effluent from the anaerobic digester is the influent to the PAD reactor. Denver instituted PAD in 2016 as a biosolids treatment solution to reduce sidestream nutrient loads including both nitrogen and phosphorus. The Denver PAD reactor has a maximum depth of 22 feet and a diameter of 72 feet. The PAD reactor is supplemented with calcium hydroxide (lime) for additional alkalinity and phosphorus precipitation. The data used for the healthy operation periods at NTP was from 722 days of operation. Lime was added for 340 days.The Boulder WRRF has an average influent flow of 12.3 MGD. The mainstream secondary treatment is a nitrifying/denitrifying activated sludge process in a 4-stage Bardenpho configuration. Primary and secondary sludges, after thickening, are mixed and fed into two mesophilic anaerobic digesters at an average ratio of 55% primary/45% secondary sludge; the anaerobic digesters are operated in series with a combined average SRT of 46 days. Effluent from the anaerobic digester can be sent to the PAD reactor or bypassed around it, with typical operation being to feed approximately 80% of the anaerobically digested sludge to the PAD reactor. Boulder implemented PAD in 2017 as part of a retrofit into existing tank volume. Alkalinity addition to PAD is not required at Boulder. PAD aeration is controlled based on pH which balances alkalinity changes due to nitrification and denitrification. The data used for the healthy operation periods at Boulder WWTP were from 484 days of operation.
Data collected by operators and automatic sensors were used for analysis of both plants. All data were analyzed together to understand variability of the PAD process across treatment plants. Data were gathered from healthy operation periods to determine the range of SRT and loading rates that were observed during periods of sustained ammonia and volatile solids removal. Wastewater characteristics were determined at each plant as noted in Table 1.
| Denver | Boulder | |
|---|---|---|
| Total solids | (Modified version) of standard methods 2540 G – 1991 | Standard methods 2540 G |
| Volatile solids | (Modified version) of standard methods 2540 G – 1991 | Standard methods 2540 G |
| Ammonia | Standard methods 4500-NH3-H 2011, 22nd edition | Hach procedure 10![[thin space (1/6-em)]](https://www.rsc.org/images/entities/char_2009.gif) 277 277 |
| Tl-001 | ||
| Nitrite | Hach method 10![[thin space (1/6-em)]](https://www.rsc.org/images/entities/char_2009.gif) 207 207 |
Hach procedure 8507 |
| Nitrate | Hach method 10![[thin space (1/6-em)]](https://www.rsc.org/images/entities/char_2009.gif) 206 206 |
Standard methods 4500-NO3-D |
| Total phosphorus | ASTM D 515–88 (1990), test method B | Standard methods 4500-P E |
| Hach procedure 8190 | ||
| Soluble phosphorus | Standard methods 4500-P H-2011, 22nd edition | Standard methods 4500-P E |
| Hach procedure 8048 | ||
| Alkalinity | Standard methods 2320 B–2011, 23rd edition | Standard methods 2320B |
| pH | (Modified version) of standard methods 4500-H + B-2011, 22nd edition and E&H probe | E&H probe |
| O.R.P. | E&H probe | N/A |
| TIC | Hach document ID TE7913 | N/A |
3 Results & discussion
3.1 Reactor performance
| Plant | SRT | Anaerobic digester effluent (PAD Influent) | PAD effluent | VSR | NH4 Rem. | TIN Rem. | Amm loading rate | Ammonia removal rate | TIN removal | ||||||||||||
|---|---|---|---|---|---|---|---|---|---|---|---|---|---|---|---|---|---|---|---|---|---|
| days | NH4 mgN L−1 | NO2 mgN L−1 | NO3 mgN L−1 | TIN mgN L−1 | TS% | VS% | NH4 mgN L−1 | NO2 mgN L−1 | NO3 mgN L−1 | TIN mgN L−1 | TS% | VS% | % | %* | % | kgN per m3 per day | kgN per m3 per day | mg per kg−1 VS per day | kgN per m3 per day | mg per kg per VSS per day | |
| Denver | 17.1 | 1649 | NA | NA | 1649 | 2.95 | 2.13 | 142.4 | 1.80 | 4.09 | 145.01 | 3.00 | 1.95 | 10.3% | 91% | 91% | 0.098 | 0.0871 | 5.5 | 86.7 | 5.33 |
| Boulder | 11.9 | 1587 | NA | NA | 1587 | 2.32 | 1.71 | 253.7 | 57.7 | 7.0 | 318.3 | 2.2 | 1.5 | 9.9% | 84% | 80% | 0.18 | 0.143 | 9.1 | 178 | 11.17 |
While the average ammonia and TIN removals were similar between the two plants, the ammonia loading rate and the ammonia rate of removal were much greater at Boulder. Boulder operated at a lower SRT and consequently had an ammonia loading rate to the PAD reactor that was double the loading rate at Denver. The ammonia removal rate per volume of reactor and per kg VS was nearly double in the Boulder reactor compared to the Denver reactor. One reason why Boulder had lower TIN removal might have been because they did not add alkalinity (which can limit PAD as discussed in Section 3.2.6). These data represent the first published data set on two full-scale PAD operations and indicate that PAD can operate well over a wide range of feed rates and SRT values.
3.2 Operational and design parameters
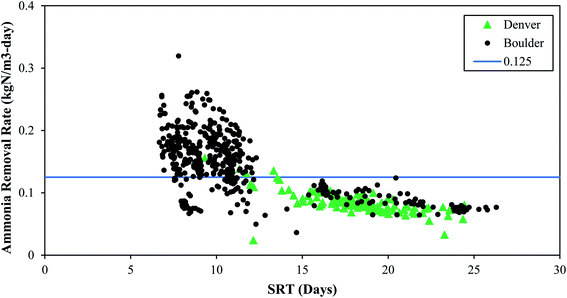 | ||
| Fig. 1 The impact of SRT on ammonia removal rates. The blue line is 0.125 kgN m−3-day and is used to distinguish between “low” and “high” ammonia removal rates. | ||
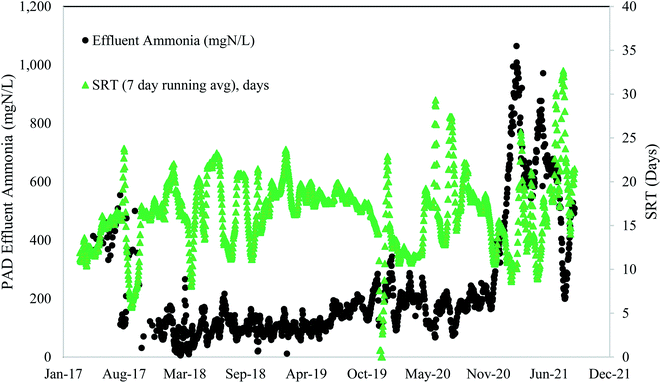
These full-scale PAD reactors were not operated with SRT value of 5 days or less, indicating that they could potentially have even more capacity. However, maintaining consistent SRT over time, and ensuring any changes in SRT occur gradually over extended time periods, is of critical importance. The PAD reactor is a biologically driven reactor that relies on a stable and healthy functioning microbial community. Rapid shifts in SRT values can dramatically shift the microbial community structure and subsequent function. Indeed, the PAD reactor in Denver had a sustained reduction in ammonia removal following a rapid decrease in SRT (Fig. 2) and temperature (discussed in Section 3.2.3). Furthermore, a mechanical failure of the aeration system header and clogging of the jet aeration nozzles contributed to the sustained PAD upset. Prior to the reduction in nitrogen removal performance, the microbial community had become acclimated to operating with SRT values higher than 15 days. This long SRT value would have selected for slow growing microbes that process substrate slowly. As the SRT dropped, two things happened. First, the slow growing microbes did not have sufficient time for ammonia oxidation. Second, the slow growing microbes were likely washed out due to their slower growth rates. While the NTP PAD reactor did not have SRT values below what has been shown to work in a lab setting (i.e., 5 days), the rapid change in SRT to the biological system limited the ability of the process to remove nitrogen.
Based on the data in Fig. 1, higher ammonia removal rates were observed at the low SRT range (7–10 days). These data do not provide the lower limit of SRT, and lab-scale reactors have shown successful operation at and below SRT values of 5 days. It is clear from Fig. 1 that a range of SRT values can be used and still maintain function in a PAD reactor for ammonia removal. From Fig. 2 though, it is also apparent that rapid changes to SRT should be avoided – which is like general guidelines for other biological systems such as anaerobic digesters or activated sludge tanks. Attempts to operate at SRT values of 5 days, as has been shown in lab-scale studies, should be done by slowly increasing flows. In general, longer SRT values result in lower ammonia removal rates.
The SRT values discussed here represent the total SRT in the PAD reactor. Boulder has implemented continuous aeration with changes to the aeration rate based on pH interlocks. Denver has experimented with several aeration cycle controls, ranging from 50% aerobic/50% anoxic cycling on a four-hour scale to continuous aeration, and Denver ultimately established a continuous aeration strategy for PAD operation. However, from an SRT standpoint, the values documented here for nitrification should be considered minimum aerobic SRT values.
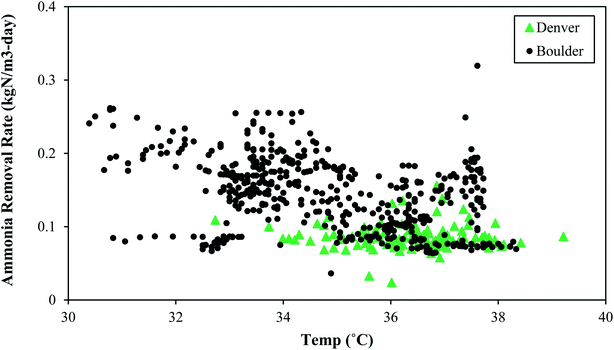
Like SRT, maintaining a constant temperature is also an important consideration. A microbial community that has been selected and acclimated to a given temperature range would likely suffer if temperature dropped or increased. Thermophilic bacterial and archaeal communities are rather impacted by non-gradual changes in temperature, and these thermophilic communities differ from the communities operating under mesophilic conditions. Therefore, a change in temperature can affect both microbial community composition and overall reactor performance.39Fig. 5 depicts the change in process performances that occurred as temperatures dropped at Denver NTP. Short term temperature drops coincided with short-term process performance variations, but the system rebounded. The longer-term temperature drops near the end of 2020 coincided with a major process decline. The temperature change from 35–36 °C (mid-90 °F) to 29–30 °C (mid-80 °F) was a perturbation that likely contributed to the biological upset.
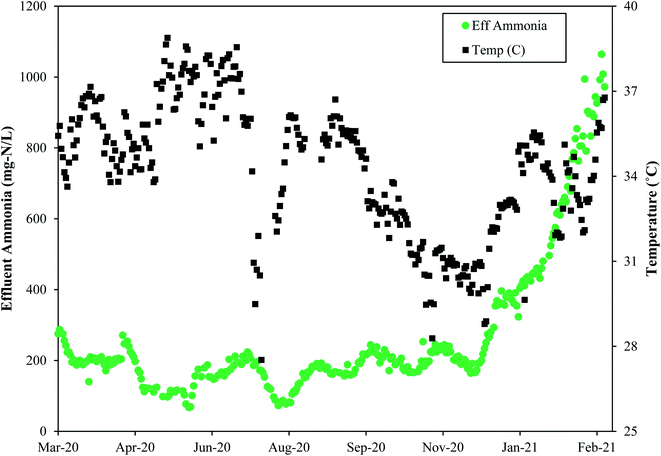 | ||
| Fig. 5 The temperature drops near the end of 2020 preceded the major process upset as evidenced by the rise in effluent ammonia concentrations at the Denver NTP. | ||
In general, a decline in temperature would require a longer SRT because growth of the microbial community slows down as temperature drops. If both the temperature and the SRT decrease, a process decline would almost surely arise because the microbial community needs more time under lower temperatures. Washout of key microbes can occur with drops in temperature concomitant with SRT drops. As seen in Fig. 5, a decline in temperature preceded a loss in function. In this scenario the microbes had less time when they needed more time. In summary, temperature and SRT are both important parameters that need to remain constant to minimize the risk of a process upset. Operational temperatures for PAD should be 29–38 °C (85–100 °F) and consistent.
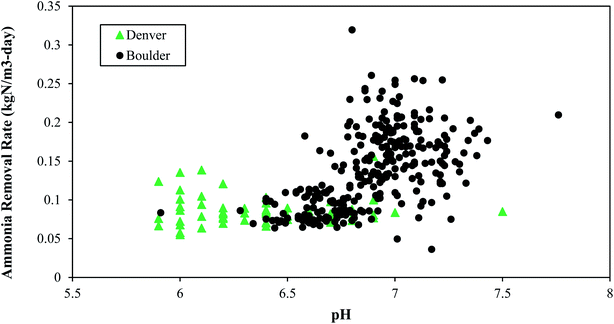
Boulder typically operated at pH values near neutral while Denver operated at pH values below neutral (Fig. 6). Higher pH values (e.g., above 8) can result in more free ammonia, which inhibits nitrifiers. Furthermore, elevated levels of free ammonia can result in a negative feedback loop for nitrogen removal, because as nitrification becomes inhibited, total ammonia accumulates and consequently there would be more toxic free ammonia. This downward spiral could continue unless pH is dropped artificially.
Based on the data shown in Fig. 6 and on lab studies, healthy operation occurs at pH values from 6.0–7.5. PAD reactors operated at pH values near neutral or below neutral are also reported in literature.26,30,45 High pH values at Denver (pH of approximately 8.0) caused by excess lime addition for phosphorus removal were associated with decreased performance, indicating a potential inhibition from ammonia toxicity, when the free ammonia was greater than 10 mgN L−1.
The different relationships between ammonia removal rate and pH at the two different plants might also be explained by potential differences in microbial community composition and their relative response to pH shifts.46 If the microbial communities are distinct then it would be reasonable to conclude that they might respond differently to pH and alkalinity. Ammonia oxidizing bacteria have been shown to be impacted by pH and alkalinity with consequences on ammonia removal rates.47 For example, higher ammonium oxidation has been shown to occur in acidic aerobic digestion conditions when the acid-tolerant ammonia-oxidizing bacterium, ‘Candidatus Nitrosoglobus’ was present.48 Characterization of microbial community structure in PAD reactors is a key next step for future research.
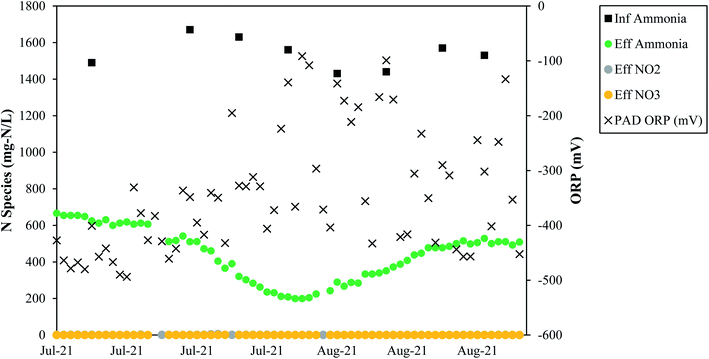
Full-scale data from Denver corroborate that low measured ORP values support TIN removal (Fig. 7). From July 2021 to early September 2021 ORP measurements were taken at the Denver treatment plant, and the ORP values were always negative. During this time, average TIN removal was 73%, and the average concentrations of nitrite and nitrate were 0.75 mgN L−1 and 0.03 mgN L−1, respectively, supporting the theory that nitrogen removal in a PAD reactor can occur through simultaneous nitrification and denitrification at low ORP/DO levels. In summary, the full-scale data from Denver confirm what has been reported in literature: negative ORP values correspond to nitrification and denitrification. Low DO is not only feasible, but it is ostensibly required for simultaneous nitrification and denitrification.44 It is noted that Denver observed TIN removal employing continuous aeration or intermittent aeration. While continuous aeration is not required from a biological standpoint for nitrogen removal, intermittent aeration can pose operational challenges, such as blower cycling and system pressure surges. More research on the specific impacts of aeration rates on nitrogen removal during PAD is needed.
In addition to alkalinity being required as part of the chemical reaction, inorganic carbon, i.e., carbonate alkalinity, is required as biological carbon source. AOB oxidize ammonia as their electron donor and reduce oxygen as their electron acceptor, neither of which is their carbon source. Both AOB and NOB require inorganic carbon, i.e., carbonate alkalinity, as their carbon source, and inorganic carbon can be a limiting factor for nitrifiers.54,55 Low carbonate alkalinity concentrations (<100 mg L−1 as CaCO3) have been shown to inhibit nitrification rates, and as carbonate concentration increases so does nitrification.56 Since nitrifiers specifically require carbonate alkalinity, alkalinity needs to be present in a carbon form and not just as phosphates or hydroxide.
Denver NTP tracked dissolved inorganic carbon (DIC) usage from May 2021–August 2021 and found that ammonia removal trends coincided with DIC usage trends (Fig. 8). These data indicate that DIC is important for ammonia removal. The ratio of DIC consumed to ammonia removed averaged 0.57, which is much lower than the ratio of 3.57 mg L−1 of alkalinity per 1 mgN/L needed for nitrification-denitrification, indicating that DIC does not need to be the entire source of alkalinity.
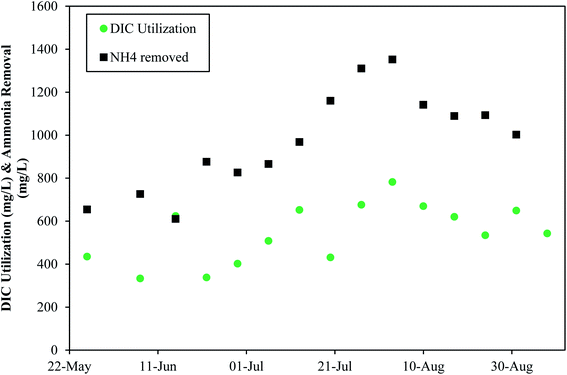 | ||
| Fig. 8 The impact of dissolved inorganic carbon consumption and alkalinity consumption on ammonia removal at Denver NTP. | ||
Typically, anaerobic digester effluents have high amounts of alkalinity, but in the event where alkalinity levels are low, alkalinity would need to be added to sustain simultaneous nitrification and denitrification. The NTP feeds lime to support nitrification, and an ancillary benefit of providing additionally alkalinity in the form of lime is that PAD can also be used for phosphorus removal. Added lime increases the pH and converts the carbon dioxide to dissolved carbonate, and calcium precipitates with phosphorus so that dissolved phosphorus is removed from the liquid stream instead of being recirculated to the head of the plant. In summary, alkalinity is a requirement for simultaneous nitrification and denitrification in PAD, and it is important to understand alkalinity speciation because non-carbonate alkalinity does not help the nitrifying community meet their carbon source needs.
3.3 Comparison to sidestream deammonification
Sidestream deammonification that employs anaerobic ammonium oxidation (annammox) is another sidestream treatment technology used to reduce N that would otherwise be recycled back to the head of the plant. One similarity between these processes is that supplemental carbon is not required. While deammonification and PAD both aim to reduce N recycled back to the head of the plant, they are fundamentally different processes used for different process flows (solids vs. liquids). Advantages for PAD include beneficial conditioning such as volatile solids reduction, final biosolids odor reduction via removal of ammonia and dissolved sulfide, and the potential for soluble phosphorus removal and improved dewaterability. Annamox treats liquid flows from thickening or dewatering. Annamox for example could be used to handle the filtrate following thermal hydrolysis that is high in N.57 Annamox process advantages include a reduction in energy demand and volume requirements.583.4 Summary of key findings, design parameters, and other considerations for PAD
Several key findings and design parameter guidelines for PAD reactors are as follows:• TIN removal (ostensibly stemming from simultaneous nitrification and denitrification) above 90% occurred at full-scale.
• VSR of 9 to 10% was achieved at full-scale.
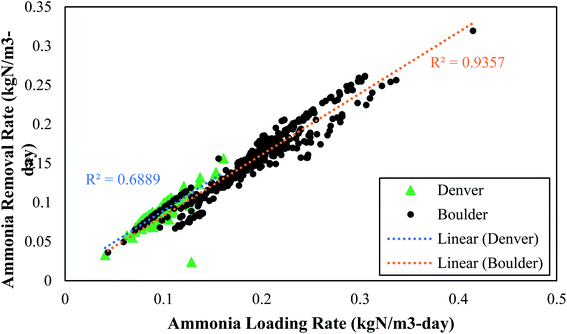
• Ammonia removal rates of up to 0.300 kgN m−3-day were achieved and these rates were strongly correlated to nitrogen loading rate.
• Sludge Retention Time (SRT): higher removal rates were observed at lower SRTs (7–10 days). Lab-scale studies revealed successful operation at SRT values of 5 days. Changes to SRT at the full-scale should be done slowly to avoid sudden shifts in the microbial community.
• Like SRT, consistent temperature is important to the microbial community and major swings (>10 °F) should be avoided. Healthy operation was observed from 29–38 °C (85–100 °F).
• Ammonium removal was successfully achieved at a pH range of 6 to 7.5. Higher pH ranges should be avoided because increases in NH3 can be toxic to nitrifiers.
• Negative ORP values were reported during TIN removal. These data indicate that (a) continuous aeration is not required, and (b) periods of low DO are helpful for supporting TIN removal through denitrification.
• Depending on the nitrogen removal goals, supplemental alkalinity may be required, and inorganic carbon is necessary to support autotrophic growth.
PAD may offer other benefits not discussed in detail here, including improved dewaterability, reduction of odorous compounds, and removal of pathogens and micropollutants.31,33,59,60 These aspects will be important to study at the full-scale as well. Additionally, research is needed on the microbial communities in full-scale systems to understand the key microbes and their potential to resist perturbations. Finally, insights into the mechanisms of nitrogen removal will be helpful to determine the extent at which, if any, NO and N2O or other intermediates are produced or accumulate in this system, as well as getting a better understanding of the aeration requirements.
4 Conclusions
This is the first peer-reviewed study to compare performance and operational parameters at multiple full-scale PAD reactors. Information on PAD reactors, even at the lab-scale, is scarce in literature. This technology, though, can be readily applied at WRRFs that have available tanks for nutrient removal (nitrogen and phosphorus) and improved VSR removal. The data presented can be used to help determine how much additional nitrogen removal could be achieved via PAD systems. This work also provides a range of healthy operational values similar to what the field has for anaerobic digestion.Author contributions
PJM – formal analysis, visualization, writing – original draft, writing – review & editing; FS – formal analysis, visualization, writing – review & editing; ER – conceptualization, data curation, investigation, validation, writing -review & editing; PD – writing – review & editing; TWM – methodology, resources, writing – review & editing; CM – methodology, resources, writing – review & editing; LD – conceptualization, investigation, project administration, validation, writing – review & editing.Conflicts of interest
The authors have no conflict of interest to declare.References
- B. E. Rittmann, B. Mayer, P. Westerhoff and M. Edwards, Capturing the lost phosphorus, Chemosphere, 2011, 84(6), 846–853, DOI:10.1016/j.chemosphere.2011.02.001.
- K. Venkiteshwaran, P. J. McNamara and B. K. Mayer, Meta-analysis of non-reactive phosphorus in water, wastewater, and sludge, and strategies to convert it for enhanced phosphorus removal and recovery, Sci. Total Environ., 2018, 644, 661–674, DOI:10.1016/j.scitotenv.2018.06.369.
- B. Ma, W. Qian, C. Yuan, Z. Yuan and Y. Peng, Achieving Mainstream Nitrogen Removal through Coupling Anammox with Denitratation, Environ. Sci. Technol., 2017, 51(15), 8405–8413 CrossRef CAS PubMed.
- W. J. Ma, G. F. Li, B. C. Huang and R. C. Jin, Advances and challenges of mainstream nitrogen removal from municipal wastewater with anammox-based processes, Water Environ. Res., 2020, 92(11), 1899–1909 CrossRef CAS PubMed.
- C. M. López-Vázquez, C. M. Hooijmans, D. Brdjanovic, H. J. Gijzen and M. C. M. van Loosdrecht, Factors affecting the microbial populations at full-scale enhanced biological phosphorus removal (EBPR) wastewater treatment plants in The Netherlands, Water Res., 2008, 42(10–11), 2349–2360 CrossRef PubMed.
- H. Wild, C. Sawyer and T. C. McMahon, Factors affecting nitrification kinetics, J. Water Pollut. Control Fed., 1971, 43(9), 1845–1854 CAS.
- A. B. Lanham, A. Oehmen, G. Carvalho, A. M. Saunders, P. H. Nielsen and M. A. M. Reis, Denitrification activity of polyphosphate accumulating organisms (PAOs) in full-scale wastewater treatment plants, Water Sci. Technol., 2018, 78(12), 2449–2458 CrossRef CAS.
- V. N. Srinivasan, G. Li, D. Wang, N. B. Tooker, Z. Dai and A. Onnis-hayden, et al., Oligotyping and metagenomics reveal distinct Candidatus Accumulibacter communities in side-stream versus conventional full-scale enhanced biological phosphorus removal (EBPR) systems, Water Res., 2021, 206, 117725, DOI:10.1016/j.watres.2021.117725.
- Y. Yang, X. Shi, W. Ballent and B. K. Mayer, Biological Phosphorus Recovery: Review of Current Progress and Future Needs, Water Environ. Res., 2017, 89(12), 2122–2135 CrossRef CAS PubMed.
- J. Guerrero, A. Guisasola and J. A. Baeza, The nature of the carbon source rules the competition between PAO and denitrifiers in systems for simultaneous biological nitrogen and phosphorus removal, Water Res., 2011, 45(16), 4793–4802, DOI:10.1016/j.watres.2011.06.019.
- N. Majed and A. Z. Gu, Phenotypic dynamics in polyphosphate and glycogen accumulating organisms in response to varying in fl uent C/P ratios in EBPR systems, Sci. Total Environ., 2020, 743, 140603, DOI:10.1016/j.scitotenv.2020.140603.
- Y. Wang, C. Bott and R. Nerenberg, Sulfur-based denitrification: Effect of biofilm development on denitrification fluxes, Water Res., 2016, 100, 184–193 CrossRef CAS PubMed.
- F. Sabba, A. Devries, M. Vera, G. Druschel, C. Bott and R. Nerenberg, Potential use of sulfite as a supplemental electron donor for wastewater denitrification, Rev. Environ. Sci. Bio/Technol., 2016, 15 DOI:10.1007/s11157-016-9413-y.
- F. Di Capua, F. Pirozzi, P. N. L. Lens and G. Esposito, Electron donors for autotrophic denitrification, Chem. Eng. J., 2019, 362(3), 922–937, DOI:10.1016/j.cej.2019.01.069.
- D. Qin, L. Straka, J. A. Kozak, E. W. Podczerwinski and L. Downing. Preliminary evaluation of sidestream enhanced biological phosphorus removal for sustainable phosphorus removal from highly variable wastewater with low carbon. In: 93rd Water Environment Federation Technical Exhibition and Conference. 2020. pp. 3318–34 Search PubMed.
- P. Roots, F. Sabba, A. F. Rosenthal, Y. Wang, Q. Yuan and L. Rieger, et al. Integrated shortcut nitrogen and biological phosphorus removal from mainstream wastewater: process operation and modeling, Environ. Sci. Water Res. Technol., 2020, 566–580 RSC.
- D. Wang, N. B. Tooker, V. Srinivasan, G. Li, L. A. Fernandez and P. Schauer, et al., Side-stream enhanced biological phosphorus removal (S2EBPR) process improves system performance – A full-scale comparative study, Water Res., 2019, 167, 115109, DOI:10.1016/j.watres.2019.115109.
- B. Wett, S. M. Podmirseg, M. Gomez-Brandon, M. Hell, G. Nyhuis and C. Bott, et al., Expanding DEMON Sidestream Deammonification Technology Towards Mainstream Application, Water Environ. Res., 2015, 87(12), 2084–2089 CrossRef CAS PubMed.
- P. Izadi, P. Izadi and A. Eldyasti, Towards mainstream deammonification : Comprehensive review on potential mainstream applications and developed sidestream technologies, J. Environ. Manage., 2021, 279, 111615, DOI:10.1016/j.jenvman.2020.111615.
- J. L. Barnard, P. Dunlap and M. Steichen, Rethinking the Mechanisms of Biological Phosphorus Removal, Water Environ. Res., 2017, 89(11), 2043–2054 CrossRef CAS PubMed.
- Y. Tong, P. J. Mcnamara and B. K. Mayer, Fate and impacts of triclosan, sulfamethoxazole, and 17β-estradiol during nutrient recovery via ion exchange and struvite precipitation, Environ. Sci. Water Res. Technol., 2017, 3, 1109–1119 RSC.
- D. E. Carey, Y. Yang, P. J. McNamara and B. K. Mayer, Recovery of agricultural nutrients from biorefineries, Bioresour. Technol., 2016, 215, 186–198, DOI:10.1016/j.biortech.2016.02.093.
- V. Parravicini, K. Svardal, R. Hornek and H. Kroiss, Aeration of anaerobically digested sewage sludge for COD and Nitrogen removal : optimization at large-scale, Water Sci. Technol., 2008, 57(2), 257–264 CrossRef CAS PubMed.
- G. Zupancic and M. Ros, Aerobic and two-stage anaerobic-aerobic sludge digestion with pure oxygen and air aeration, Bioresour. Technol., 2008, 99(1), 100–109 CrossRef CAS PubMed.
- C. Park, M. M. Abu-Orf and J. T. Novak, The Digestibility of Waste Activated Sludges, Water Environ. Res., 2006, 78(1), 59–68 CrossRef CAS PubMed.
- J. T. Novak, S. Banjade and S. N. Murthy, Combined anaerobic and aerobic digestion for increased solids reduction and nitrogen removal, Water Res., 2011, 45(2), 618–624, DOI:10.1016/j.watres.2010.08.014.
- M. Ahmad, M. A. Denee, H. Jiang, C. Eskicioglu, P. Kadota and T. Gregonia, Sequential Anaerobic/Aerobic Digestion for Enhanced Carbon/Nitrogen Removal and Cake Odor Reduction, Water Environ. Res., 2016, 88(12), 2233–2244 CrossRef CAS PubMed.
- Q. Wang, X. Zhou, L. Peng, D. Wang, G. Xie and Z. Yuan, Enhancing post aerobic digestion of full-scale anaerobically digested sludge using free nitrous acid pretreatment, Chemosphere, 2016, 150, 152–158, DOI:10.1016/j.chemosphere.2016.02.035.
- K. Song, G. Xie, J. Qian, P. Bond, D. Wang and B. Zhou, et al., Improved degradation of anaerobically digested sludge during post aerobic digestion using ultrasonic pretreatment, Environ. Sci. Water Res. Technol., 2017, 5, 857–864 RSC.
- J. Kim and J. T. Novak, Combined Anaerobic/Aerobic Digestion: Effect of Aerobic Retention Time on Nitrogen and Solids Removal, Water Environ. Res., 2011, 83(9), 802–806 CrossRef CAS PubMed.
- N. Kumar, J. T. Novak and S. Murthy. Sequential Anaerobic/Aerobic Digestion for Enhanced Carbon/Nitrogen Removal and Cake Odor Reduction and nitrogen removal Anaerobic/Aerobic Digestion for Enhanced Carbon/Nitrogen Removal. in: Residuals and biosolids management conference. 2006. pp. 1064–81 Search PubMed.
- M. C. Tomei, S. Rita and G. Mininni, Performance of sequential anaerobic/aerobic digestion applied to municipal sewage sludge, J. Environ. Manage., 2011, 92(7), 1867–1873, DOI:10.1016/j.jenvman.2011.03.016.
- N. Kumar, J. T. Novak and S. Murthy, Effect of Secondary Aerobic Digestion on Properties of Anaerobic Digested Biosolids, Proc. Water Environ. Fed., 2006, 5, 6806–6829, DOI:10.2175/193864706783761527.
- S. Lackner, E. M. Gilbert, S. E. Vlaeminck, A. Joss, H. Horn and M. C. M. van Loosdrecht, Full-scale partial nitritation/anammox experiences - An application survey, Water Res., 2014, 55, 292–303, DOI:10.1016/j.watres.2014.02.032.
- G. Bowden, R. Tsuchihashi, H. D. Stensel, Technologies for Sidestream Nitrogen Removal, IWA Publishing, 2015, vol. 15, DOI:10.2166/9781780407890.
- A. Nordström and R. B. Herbert, Denitrification in a low-temperature bioreactor system at two different hydraulic residence times: laboratory column studies, Environ. Technol., 2017, 38(11), 1362–1375 CrossRef PubMed.
- A. C. Anthonisen, R. C. Loehr, T. B. S. Prakasam and E. G. Srinath, Inhibition of nitrification by ammonia and nitrous acid, J. Water Pollut. Control. Fed., 1976, 48(5), 835–852 CAS.
- E. N. Courtens, E. Spieck, R. Vilchez-Vargas, S. Bodé, P. Boeckx and S. Schouten, et al., A robust nitrifying community in a bioreactor at 50 °c opens up the path for thermophilic nitrogen removal, ISME J., 2016, 10(9), 2293–2303 CrossRef CAS PubMed.
- E. N. P. Courtens, T. Vandekerckhove, D. Prat, R. Vilchez-vargas, M. Vital and D. H. Pieper, et al., Empowering a mesophilic inoculum for thermophilic nitri fi cation : Growth mode and temperature pattern as critical proliferation factors for archaeal ammonia oxidizers, Water Res., 2016, 92(2016), 94–103, DOI:10.1016/j.watres.2016.01.022.
- J. E. Alleman, S. C. Engrg and W. Lafayette, Elevated Nitrite Occurrence in Biological Wastewater Treatment Systems, Water Sci. Technol., 1985, 17(2–3), 409–419, DOI:10.2166/wst.1985.0147.
- H. Mogens, H. Poul, J. Jes La Cour and A. Erik. Wastewater Treatment: Biological and Chemical Processes. 2nd ed. new York: Springer US; 1997. pp. 75–92 Search PubMed.
- F. Sabba, A. Terada, G. Wells, B. F. Smets and R. Nerenberg, Nitrous oxide emissions from biofilm processes for wastewater treatment, Appl. Microbiol. Biotechnol., 2018, 102(22), 9815–9829 CrossRef CAS PubMed.
- A. Kuokkanen, K. Blomberg, A. Mikola and M. Heinonen, Unwanted mainstream nitritation – denitritation causing massive N2O emissions in a continuous activated sludge process, Water Sci. Technol., 2021, 83(9), 2207–2217, DOI:10.2166/wst.2021.127.
- R. L. Meyer, R. J. Zeng, V. Giugliano and L. L. Blackall, Challenges for simultaneous nitrification, denitrification, and phosphorus removal in microbial aggregates: Mass transfer limitation and nitrous oxide production, FEMS Microbiol. Ecol., 2005, 52(3), 329–338 CrossRef CAS PubMed.
- M. C. Tomei and N. A. Carozza, Sequential anaerobic/anaerobic digestion for enhanced sludge stabilization: comparison of the process performance for mixed and waste sludge, Environ. Sci. Pollut. Res., 2015, 22(10), 7271–7279 CrossRef CAS PubMed.
- A. Princic, I. Mahne, F. Megusar and E. Paul, Effects of pH and Oxygen and Ammonium Concentrations on the Community Structure of Nitrifying Bacteria from Wastewater, Appl. Environ. Microbiol., 1998, 64(10), 3584–3590, DOI:10.1128/aem.64.10.3584-3590.1998.
- J. W. Shanahan and M. J. Semmens, Alkalinity and pH effects on nitrification in a membrane aerated bioreactor : an experimental and model analysis, Water Res., 2015, 74, 10–22, DOI:10.1016/j.watres.2014.12.055.
- Z. Wang, M. Zheng, H. Duan, G. Ni, W. Yu and Y. Liu, et al., Acidic aerobic digestion of anaerobically-digested sludge enabled by a novel ammonia-oxidizing bacterium, Water Res., 2021, 194 DOI:10.1016/j.watres.2021.116962.
- X. Wang, Y. Ma and Y. Peng, Short-cut nitrification of domestic wastewater in a pilot-scale A/O nitrogen removal plant, Bioprocess Biosyst. Eng., 2007, 30(2), 91–97, DOI:10.1007/s00449-006-0104-x.
- Q. Chen and J. Ni, Heterotrophic nitrification – aerobic denitrification by novel isolated bacteria, J. Ind. Microbiol. Biotechnol., 2011, 38(9), 1305–1310, DOI:10.1007/s10295-010-0911-6.
- M. Kampschreur, N. C. G. Tan, R. Kleerebezem, C. Picioreanu, M. S. M. Jetten and M. C. M. van Loosdrecht, Effect of Dynamic Process Conditions on Nitrogen Oxides Emission from a Nitrifying Culture, 2008, 42, (2), 429–435.
- G. T. Daigger, Oxygen and Carbon Requirements for Biological Nitrogen Removal Processes Accomplishing, 2014, 86, (3), 204–209.
- S. Rahimi, O. Modin and I. Mijakovic, Technologies for biological removal and recovery of nitrogen from wastewater, Biotechnol. Adv., 2020, 43, 107570, DOI:10.1016/j.biotechadv.2020.107570.
- J. A. Torà, J. Lafuente, J. A. Baeza and J. Carrera, Combined effect of inorganic carbon limitation and inhibition by free ammonia and free nitrous acid on ammonia oxidizing bacteria, Bioresour. Technol., 2010, 101(15), 6051–6058, DOI:10.1016/j.biortech.2010.03.005.
- A. Guisasola, S. Petzet, J. A. Baeza, J. Carrera and J. Lafuente, Inorganic carbon limitations on nitrification: Experimental assessment and modelling, Water Res., 2007, 41(2), 277–286 CrossRef CAS PubMed.
- S. Biesterfeld, G. Farmer, P. Russell and L. Figueroa, Effect of Alkalinity Type and Concentration on Nitrifying Biofilm Activity, Water Environ. Res., 2003, 75(3), 196–204, DOI:10.2175/106143003x140971.
- X. Han, S. Zhang, S. Yang, L. Zhang and Y. Peng, Full-scale partial nitritation/anammox (PN/A) process for treating sludge dewatering liquor from anaerobic digestion after thermal hydrolysis, Bioresour. Technol., 2020, 297 DOI:10.1016/j.biortech.2019.122380.
- H. Bauer, T. D. Johnson, B. R. Johnson, D. Oerke and S. Graziano, Comparison of sidestream treatment technologies: Post aerobic digestion and Anammox, Water Sci. Technol., 2016, 73(11), 2789–2803 CrossRef CAS PubMed.
- M. C. Tomei, N. A. Carozza and D. Mosca Angelucci, Post-aerobic digestion of waste sludge: performance analysis and modelling of nitrogen fate under alternating aeration, Int. J. Environ. Sci. Technol., 2016, 13(1), 21–30 CrossRef CAS.
- P. J. McNamara, C. A. Wilson, M. T. Wogen, S. N. Murthy, J. T. Novak and P. J. Novak, The effect of thermal hydrolysis pretreatment on the anaerobic degradation of nonylphenol and short-chain nonylphenol ethoxylates in digested biosolids, Water Res., 2012, 46(9), 2937–2946, DOI:10.1016/j.watres.2012.03.015.
| This journal is © The Royal Society of Chemistry 2022 |

