Considerations in applying neutron depth profiling (NDP) to Li-ion battery research†
Daniel J.
Lyons
 a,
Jamie L.
Weaver
 b and
Anne C.
Co
 *a
*a
aDepartment of Chemistry and Biochemistry, The Ohio State University, Columbus, Ohio, USA 43210. E-mail: co.5@osu.edu
bMaterial Measurement Laboratory, National Institute of Standards and Technology, Gaithersburg, Maryland, USA 20899
First published on 14th December 2021
Abstract
Li distribution within micron-scale battery electrode materials is quantified with neutron depth profiling (NDP). This method allows the determination of intra- and inter-electrode parameters such as lithiation efficiency, electrode morphology change, and Li transport. In this work, a Sn electrode was lithiated at a constant potential and in situ Li movement was monitored and quantified. This contrasts to traditional methods where Li diffusion is inferred based on the passed electrochemical charge. Diffusion constants obtained through Fick's 1st and 2nd laws using this direct detection method, ranging from 1 × 10⁻¹² cm2 s−1 to 10 × 10−12 cm2 s−1, are in good agreement with each other and reduce the range from the literature reported values for this system by over an order of magnitude. A significant difference between the electrochemical charge passed and Li incorporated into the Sn electrode as measured by NDP was detected. This indicates that NDP can be used to separate lithiation current from other parasitic currents. Advantages, challenges, improvements, and opportunities for using NDP to investigate many battery-related phenomena are presented.
Introduction
Sn, Si, and other intermetallic forming electrodes are promising anode materials for their high Li storage capacity and inherent safety attributes when compared to graphite anodes. However, these materials can experience substantial capacity losses with repeated cycling. This capacity fade is hypothesized to occur due to material volume expansion, material pulverization, and the formation of structural vacancies. For example, it has been reported that up to 80% of Li atoms can be trapped in a vacancy-rich Li7Sn3 structure,1 even when attempting to delithiate the electrode nanoparticle at a highly oxidizing potential. Such issues along with the variability of laboratory-based measurement procedures have resulted in a wide range of reported diffusion constants for Li in Sn and LixSn alloys formed during cell charging. Calculation of more accurate diffusion constants is needed to better model Li-ion cells made with Sn electrodes and to predict their performance.2 This work aims to address this need by measuring the diffusion coefficient of Li in a LixSn alloy with an analytical neutron absorption analysis method that is uniquely sensitive to Li.Knowledge of the quantity of Li moved and the amount of time to move them across a known volume are required to calculate a diffusion constant. Diffusion coefficient measurements for Li in battery materials have been traditionally executed with electrochemical methods such as potentiostatic intermittent titration (PITT3), galvanostatic intermittent titration (GITT4), current–potential transients,5 and electrochemical impedance spectroscopy.3,6 These methods can collect data within operationally realistic timescales (s, min, h), but they rely on the deduction of Li mobility through detected electrochemical signals. As a result, detected ion diffusion signals can be convoluted by signals from other electrochemical reactions concurrently occurring within a cell. These side reaction signals can be difficult to detect and separate from the desired signal(s). In contrast, nuclear magnetic resonance (NMR) is directly sensitive to both isotopes of Li (7Li and 6Li) and can be used to estimate Li diffusion coefficients. However, quantification from NMR data is complex and may require the use of a secondary, confirmatory technique.7
Li detection at relevant timescales (s, min, h) without the need for additional instrumentation for quantification can be achieved by neutron depth profiling (NDP). NDP is a neutron absorption technique that can quantify 6Li non-destructively. It is a proven tool for the study of Li containing battery materials in a variety of formats under static, in situ, and operando conditions.8,11,16,23,30 Other depth profiling methods such as X-ray photoelectron spectroscopy (XPS) and time of flight secondary ion mass spectrometry (TOF-SIMS) can have better depth resolution than NDP and can simultaneously detect a wide range of elements. SIMS has also been reported to have a better depth resolution than NDP for B as shown in Vandervorst et al.'s 1985 article on depth profiling of B through Si oxide interfaces.9 However, the sampling dimensions of XPS and SIMS are smaller than NDP, making results locally relevant but not representative of a whole cell unless completed in replicates across a sample's surface. NDP data provides the average Li concentration across the area of the aperture, which in this study is very close to the size of the Sn electrode. XPS and SIMS depth resolutions are dependent on the sputtering conditions; these can be difficult to calibrate due to the heterogeneity of battery electrodes containing both soft (e.g., a polymer binder or SEI) and hard materials (e.g., an electrode material). Both XPS and TOF-SIMS are destructive due to this sputtering requirement. In contrast, NDP is, as stated above, a non-destructive method and enables the measurement of Li movements in real-time (operando). Current TOF-SIMS and XPS methods are not capable of operando depth measurements.
Despite these advantages of NDP, obtaining reliable NDP measurements on operating Li-ion cells is non-trivial. Challenges of NDP include the low natural abundance and absorption cross-section of select analysable isotopes, (6Li ≈7% naturally abundant, ≈940 barns), which can require longer data collection times relative to enriched samples (e.g., h vs. s, respectively).11,30 Sample homogeneity, tortuosity, and density gradients can also influence data interpretation. High vapor pressure components within a cell must be isolated from the high vacuum inside and the NDP chamber or the atmosphere within the chamber must be exchanged with gases conducive to NDP experiments (e.g., He).10 The presence of volatile electrolytes for in situ measurements necessitates a leak-proof window during traditional, evacuated NDP experiments. Although detracting, these challenges can be overcome through careful sample and experimental design and data interpretation; several solutions to which are herein presented.
In this study high purity Sn foils were measured in situ by NDP as they were lithiated at a constant potential. A potential resulting in the production of Li2Sn5 was selected (600 mV vs. Li/Li+) to minimize the overall expansion (≈22% from original film) and disintegration of the Sn electrode. Confirmatory experiments were completed at 200 mV. Diffusion constants were calculated using Fick's 1st and 2nd laws based on the Li distributions obtained from the NDP profiles.
Experimental
Material preparation
Sn foils (9 μm, Goodfellow, 99.75% purity, 515-715-48) and Cu foils (6 μm, Goodfellow, 99.95% purity) were punched out into discs with 16 mm and 14.5 mm diameters, respectively, then soaked and rinsed in acetone, methanol, and isopropyl alcohol for 5 min each, and then dried for ≥2 h at 60 °C. Kapton tape (64 mm, CS Hyde Company, 18-1S-2-36) was punched out into rings with outer diameters of 18 mm and inner diameters of 10 mm. Li foils (Albermarle, battery grade) were punched into 12.5 mm diameter discs inside a glove box (LC Technologies). Punched foils were transferred to a cell assembly Ar-filled glove box (MBraun) in an airtight container. All coin cell parts (spacers/EQ-CR20-Spacer-02/MTI Corp, springs/EQ-CR20Be-Spring/MTI Corp, and CR2032 tops and bottoms/EQ-CR2032-CASE/MTI Corp, SS304; all were made of 304 stainless steel) were sonicated in acetone, then methanol, and then isopropyl alcohol for 5 min each and then dried for at ≥2 h at 60 °C. Celgard 2400 separators were punched into discs with 16 mm diameters and then soaked and rinsed in methanol for 15 min before drying in air. Once dried, all materials were transferred to an Ar-filled glovebox (MBraun) maintained at <0.5 μg g−1 H2O/O2 immediately. The separators were soaked in 1 M LiPF6 in ethylene carbonate (EC): dimethyl carbonate (DMC) at 1![[thin space (1/6-em)]](https://www.rsc.org/images/entities/char_2009.gif) :
:![[thin space (1/6-em)]](https://www.rsc.org/images/entities/char_2009.gif) 1 by volume LP30 electrolyte (Selectilyte) for 24 h prior to being used in coin cell assembly.
1 by volume LP30 electrolyte (Selectilyte) for 24 h prior to being used in coin cell assembly.
Modification of the CR2032 coin cell for NDP measurements
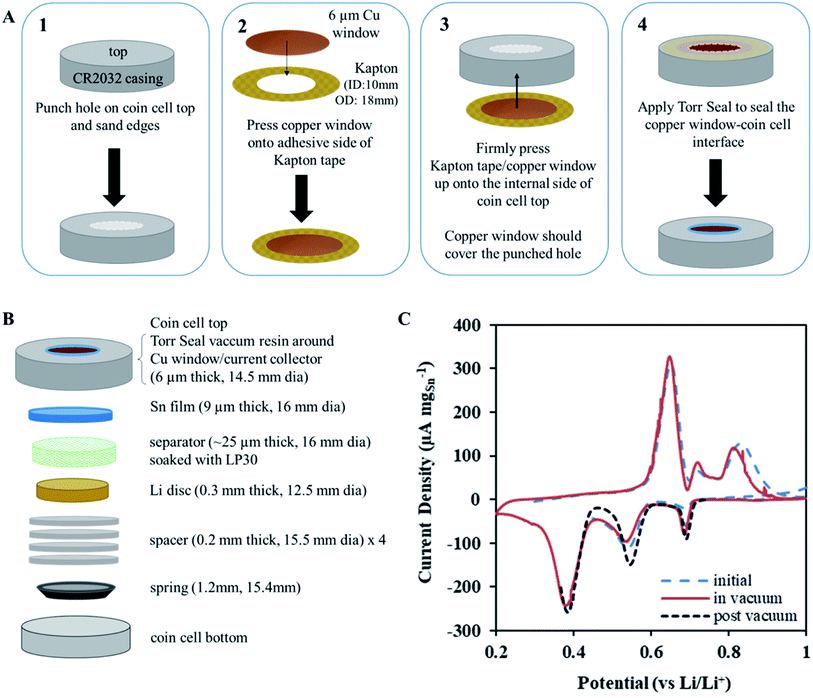
NDP measurements were acquired under ultra-high vacuum (≈10−7 Pa) and required special cell preparation to ensure operation comparable to that measured under atmospheric conditions. To achieve this, a portion of the top of a CR2032 coin cell casing was replaced with a 6 μm thin Cu foil serving as both a current collector and a thin window. This allows triton (3H) particles to escape the cell surface and be detected by the NDP Si barrier detector (Ametek, AB-018-150-150). Fig. 1A shows the schematic of the modified CR2032 cell. A 9.5 mm diameter hole was punched through the top of the coin cell (panel 1 in Fig. 1A). To eliminate rough metal edges, which could lacerate the Cu window, the sides of the hole was sanded using a diamond-studded drill bit and power drill. These punched and sanded tops were cleaned using the same steps as described above for the coin cells. The Cu windows were pressed by hand onto the sticky side of the Kapton tape rings so that the outer edges of the Kapton tape were unobstructed and available to stick to the coin cell casing (panel 2 in Fig. 1A). This piece was then pushed onto the internal side of the coin cell top gently by hand so that the Cu window was in contact with the coin cell top and the outer edges of the Kapton tape adhered to the internal side of the coin cell top (panel 3 in Fig. 1A). Torr Seal vacuum epoxy (Torr Seal-Hysol, IC A-B, TS10) was applied with a spatula to the external side of the coin cell top around the edges of the punched hole to seal the interface between the coin cell top and the Cu window (panel 4 in Fig. 1A). It is imperative that the Cu window be gently pressed (using the middle or index finger) from the internal side against the hole in the coin cell top such that it was flush with the external coin cell top surface during the application of the Torr Seal epoxy. Finally, a razor was used to remove excess Torr Seal from the external surface of the coin cell top so that after curing (2 h, 60 °C, in air) the surface was free of bumps. The surface of the coin cell top needed to be relatively flat so that when it was compressed in the coin cell crimper there was uniform crimping pressure applied across the entire top surface. If this is not done the differential in pressure between the coin cell top and the Cu window may cause the window to tear, rendering the cell useless. Fig. 1C shows that this modification does not affect the typical electrochemical behaviour of the active Sn foil.Coin cell assembly
Appropriate internal pressure and good contact between layers were achieved by adding one spring and four spacers to each cell. 10 μL of LP30 electrolyte were added to the separator during the assembly to ensure wetting of the Sn electrode. The cells were crimped at 2.8 MPa to 4.1 MPa in a crimper (MTI, MSK-110). All cells were visually inspected for tears or droplets of electrolyte that may seep through the edges of the Cu window. The cells were then held under vacuum in the glove box antechamber (≈0.1 Pa) for about 30 min after fabrication and then reinspected. Fig. 1B depicts the expanded view of the contents of each coin cell. Selected cells were tested for leaks under vacuum at 10−4 Pa for a few days to a week. Following the leak test, these cells were cycled under normal conditions to ensure expected performance.The process of optimizing the NDP cells was iterative whereby the “normal” electrochemical behaviour of the Sn foils was reproduced in standard CR2032 coin cells, and the internal setup for the NDP cells was modified until the same electrochemical behaviour was observed in CR2032 cells with and without the Cu windows. Because of the delicate nature and multiple failure routes (incorrect internal pressure, window tearing, poor current collector-Sn foil contact, excessive electrolyte consumption) of the NDP coin cell set-up, failure rates for these cells are quite high (50–90%). Once the configuration described in this section had been optimized failure rates dropped to 10–20%. Most cells using the optimized preparation method performed as expected, exhibiting reproducible cyclic voltammograms (as shown in Fig. 1C) as well as current transients as compared to the same material cycled in a standard, non-modified CR2032. This suggests that the cells were well sealed, and the internal contents isolated from the NDP vacuum. Eleven cells were made for the experiments reported in this manuscript. Seven were pre-cycled before being exposed to the NDP chamber, one of which failed during the pre-cycling. All cells from this group (pre-cycled and fresh) that were analysed by NDP exhibited typical Sn electrochemical behaviour.
NDP facility and measurements
The relevant nuclear reaction for 6Li analysis by NDP is:12| 63Li + 10n → 31H (2727.92 keV) + 42He (2055.55 keV) |
A Li concentration vs. depth profile plot for a material can be constructed by collecting the quantity and energy distribution of the emitted particles. In this study the triton particles  were measured and analysed. This is because the alpha
  particles are stopped more readily than triton particles as their masses and charges are relatively higher. Alpha particles are, therefore, ill-suited for this in situ study that included a leak-proof Cu window that either stopped or shifted emitted alpha particles to low, difficult to evaluate energies.
Neutron depth profiling experiments were carried out at the National Institute of Standards and Technology (NIST) Center for Neutron Research in Gaithersburg, Maryland (USA) using Neutron Guide 5 (NG-5). This neutron station provides a beam of cold neutrons with a peak thermal equivalent neutron fluence rate at ≈5 meV and a neutron fluence rate of ≈1.2 × 109 cm−2 s−1. Coin cells were placed in a custom-designed holder (NIST, in-house) and then mounted onto a 6 mm diameter Teflon circular aperture that was affixed to an Al metal frame. The coin cell windows were mounted and aligned normal to the line joining the sample and detector, which is normal to the surface of the main detector. All reference materials (NIST in-house concentration, 10B, and energy, 10B, 6Li, and 3He, reference materials) were run with the same aperture and configuration and used for data calibration. The holder leads were attached to electrical cables with alligator clips, which fed through the side of the chamber and connected to a CH Instruments 760D potentiostat. All spectra were corrected for detector dead time and normalized to slight variability in the neutron fluence rate. The background signal of a blank coin cell affixed to the aperture and support (all within the beam) was taken regularly and found to be negligible in the analyzed energy range. All sample spectra were binned to the approximate resolution of the detector (binned to 25 channel, ≈19 keV).
Depth calibration and concentration calibration
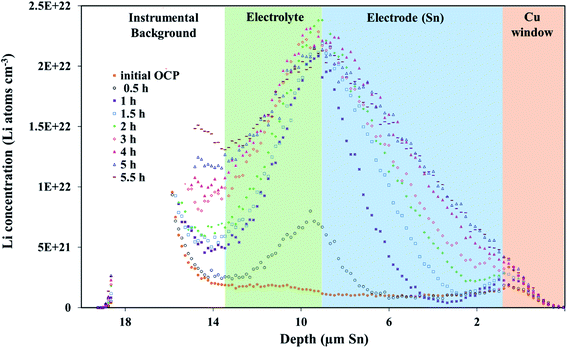
Depth scales were calculated from TRIM (transport of ions in matter) modelling results.31 TRIM simulates the transmission of particles through a substrate. Input parameters for the particle (charge, mass, initial energy) and substrate (elemental composition, density, phase) were specified and TRIM output the ranges and energy losses for the particles that escaped the material. Multiple simulations were run to calibrate the energy of the detected 3H's to the depths from which they originated in the sample. A more detailed explanation of this process can be found in the ESI† along with the energy-depth calibration equation used in this work. The orange, blue and green shaded regions represent the Cu window, Sn electrode, and electrolyte regions, respectively, in all NDP spectral plots presented.Electrochemical methods
Potential holds were carried out in the NDP chamber on a coin cell where the anode was pre-lithiated. Anodes were pre-lithiated to ensure that they will lithiate or delithiate in the NDP chamber. Pre-lithiated cells were held at 600 mV vs. Li/Li+ until 60 mA h g−1 Sn charge had passed, which took several hours. NDP spectra were collected from the cells every 60 min throughout the 29 h experiment.Diffusion constants
Diffusion constants were calculated from the difference between sets of NDP spectra using Fick's 1st and 2nd laws (listed below) where J is flux in units of Li atoms cm2 s−1, D is the diffusion coefficient in units of cm2 s−1, is the slope of the Li atomic concentration gradient within the electrode in units of Li atoms cm−4,
  is the change in Li atomic concentration over a time interval in units of Li atoms cm−3 s−1, and
  is the curvature of the Li concentration profile within the electrode in units of Li atoms cm−5.
The total number of Li atoms added to the electrode during each time increment was calculated to determine the flux across the concentration gradient for Fick's 1st Law.
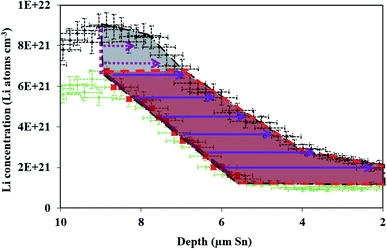
This measurement of Li transferred does not include the region in the electrolyte with changing and increased Li. It is possible that Li was in the electrode, but near the interface and it appears (in the data) to be in the electrolyte due to resolution smearing in NDP (as shown and discussed later in Fig. 4 and 6). The uncertainty resulting from Li at the interface is discussed later in this manuscript. For diffusion calculations, only the change in Li that was decided to be unequivocally residing within the electrode was considered. The relevant regions where specific changes in Li concentration were quantified were enclosed in irregular polygons shown by the red and purple dashed lines in Fig. 4A and B. The area of the irregular polygons formed by the difference in each spectrum was calculated by the shoelace method13–15 (Table S2†), and this area was related back to the integrated Li atoms associated with a unit area on the spectra as shown in Fig. 4A and B. According to the formula for the area of an irregular polygon:
In Fig. 4A, the red polygon represents a total change of 2.89 × 10¹⁸ Li atoms ± 1.26 × 10¹⁸ Li atoms within the Sn electrode over 10 h. The flux for Fick's 1st law is calculated below, where S is the cross-sectional area perpendicular to the Li flux:
The diffusion coefficient calculation associated with the gradient  and flux in the red polygon in Fig. 4A is shown below. The gradient
  was measured between 6 μm to 8.5 μm, 4.5 μm to 8 μm, and 2.5 μm to 8 μm, for the 10 h, 20 h, and 29 h data sets, respectively. Details of uncertainity calculation and propagation can be found in ref. 15:
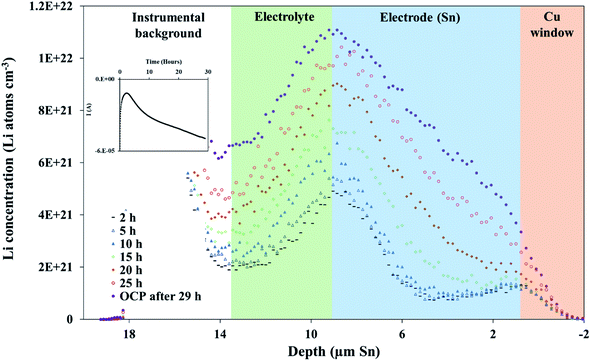
Because this method requires relatively large differences between NDP spectra, diffusion analysis was not performed for any spectra collected before 10 h into the hold as the observed changes remained within the measurement uncertainty (1σ). Table 1 lists the concentration gradients, Li fluxes, and calculated diffusion coefficient for 10 h to 20 h interval and 20 h to 29 h interval. Fick's 1st law assumes diffusion of a pre-existing gradient, and the Li integration/flux was calculated only within a region where a significant Li concentration change was observed (Fig. 6, red shading).
| Time interval (h) | Depth range (μm) | (×1021 Li atoms cm−3 μm−1) | J (×1013 Li atoms cm2 s−1) | D (×10−12 cm2 s−1) (% uncertainty, 1σ) |
|---|---|---|---|---|
| a Diffusion constants calculated from the NDP spectra derived flux and gradients according to Fick's 1st law. Calculated constants increase over time from ≈2.4 × 10⁻¹² cm2 s−1 to ≈4.2 × 10⁻¹² cm2 s−1. | ||||
| 10 to 20 | 5.60 to 8.85 | 1.61 ± 0.42 | 3.99 ± 1.74 | 2.41 ± 1.22 (51%) |
| 20 to 29 | 3.36 to 8.67 | 1.33 ± 0.22 | 5.47 ± 2.70 | 4.11 ± 2.14 (52%) |
An alternate method for calculating the diffusion constant is from Fick's 2nd law.15–17 This law relates the curvature of the Li profile to the change in the Li concentration (at a given position) over time. Again, a relatively large difference between the spectra is required to calculate  Since very little Li change is observed between the 2 h, 5 h, and 10 h profiles (Fig. 3) the diffusion constants were calculated by comparing the 10 h to 20 h, and 20 h to 29 h profiles. These are similar time scales to those used for the Fick's 1st law calculation. The diffusion calculation shown below is based on the change in Li concentration between the 10 h and 20 h profiles (Fig. 4C).
For the  values, depth values were chosen for each profile pair based on the depth range that experienced a significant Li concentration change. For the 10 h to 20 h profiles, the depths and corresponding Li changes are listed in Table 2.
![[thin space (1/6-em)]](https://www.rsc.org/images/entities/char_2009.gif) 000 sa
000 sa
| Depth (μm Sn) | ΔCLi (×1021 Li atoms cm−3) | (×1016 Li atoms cm−3 s−1) |
|---|---|---|
a Calculated  values for the depth range in the 10 h to 20 h NDP spectra pair. values for the depth range in the 10 h to 20 h NDP spectra pair.
|
||
| 8.5 | 2.85 ± 1.01 | 7.92 ± 2.81 |
| 7.1 | 3.29 ± 0.76 | 9.14 ± 2.11 |
| 6.0 | 3.45 ± 0.56 | 95.8 ± 15.4 |
| 4.0 | 2.02 ± 0.32 | 5.60 ± 0.90 |
| 1.9 | 6.80 ± 0.28 | 1.89 ± 0.77 |
A diffusion calculation was performed for each depth position as the concentration change is depth dependent.
Fig. 4E shows all diffusion constants calculated from Fick's 2nd law.
As noted, calculation of diffusion constants with Fick's 1st law requires for there to be a change in Li concentration across a measured depth. This change is not measurable at the diffusion surface as the Li population is static and at its maximum value. A concentration gradient is not required to determine constants using Fick's 2nd law, but the calculation does require that the Li profile,  , be curvilinear. Fitting of these profiles with the 2nd law becomes more challenging for less pronounced curvatures.
Uncertainty analysis
Integrated NDP profiles calculated prior to a depth calibration is quantifiable. The units of these profiles are Li atoms cm−2 (areal density) vs. keV (energy). Conversely, decisions regarding material density, morphology, and chemistry made during the setup of the TRIM calculations, which are used to move from areal density to volumetric density, can affect the concentration and depth values obtained for the final spectra (presented in units of Li atoms cm−3vs. nm or μm).16 Care has herein been taken to provide transparency of such decisions made in the processing of Sn film NDP data with more details on TRIM modelling being provided in the ESI† and in ref. 15. In the first part of this manuscript the in situ measurements were calibrated as a single-phase and as non-porous. In the discussion section the limitations and uncertainties associated with this choice are outlined and details of the effect of density gradients within the Sn on the NDP results are presented.The main contributors to the presented NDP data uncertainty are the experimental counting statistics from the samples and the depth calculations. The depth uncertainty is dependent on the TRIM modelling and the accuracy to which one knows the input parameters (e.g., material morphology, chemistry, and density). The uncertainity is not the same at all depths and spectra over time as illustrated in Fig. 4F. The uncertainty in the depth-axis propagates to the y-axis when calculating for Li concentration in units of Li atoms cm−3. As a result, the uncertainty in the calculated diffusion coefficient range is partially the result of the large uncertainty in the depth-axis (0.3–0.6 μm) of the NDP spectra.
The depth-axis uncertainty can also be dependent on the distribution of the energy of the escaping particle. Fig. S1† illustrates a TRIM model example of a triton escaping from a 1 μm thick Sn layer vs. a 9 μm Sn layer (with and without another 6 μm Cu window). The triton particle energy distribution becomes larger as it travels through a thicker or denser electrode material (aka undergoes energy broadening). This broadening is well illustrated for TRIM modelled particles traversing first the 9 μm Sn layer followed by the 6 μm Cu window/current collector (Fig. S1†). Particles passing through both layers have a noticeably larger range of exit energies compared to those passing through only the first layer. Calculated results based on these models indicate that the addition of the Cu window may increase the depth axis uncertainty by up to half a micron. The approach used herein to account for uncertainty in the measurement is not standardized across NDP practitioners and this methodology may result in an over or underestimation of the uncertainty. Uncertainty values are reported 1σ unless stated otherwise.
Results
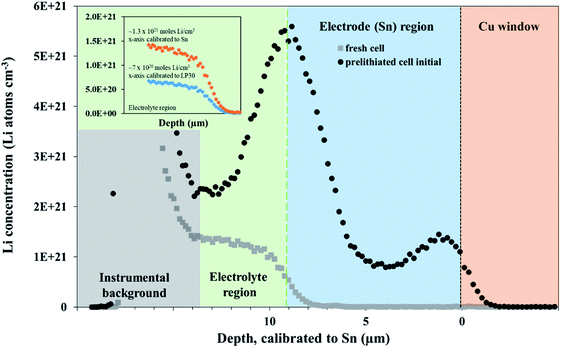
An NDP spectrum of a fresh, unlithiated cell was collected to establish where the electrolyte, Sn electrode, and Cu window regions are located before cycling and to verify the parameters used for the depth calibration. The volumetric Li concentration vs. depth of an unlithiated cell and the initial profile of a pre-lithiated cell at 600 mV, calibrated to the triton escape depth in Sn, are shown in Fig. 2.The depth calibration in Fig. 2 confirms that the Sn foil is 9 μm thick. The Sn electrode region (0 μm to 9 μm) of a fresh cell (grey squares in Fig. 2) gave no Li signal, consistent with a pristine Sn electrode. Without an applied potential, the flat plateau in the electrolyte-separator region (from 9 μm to 14 μm in Fig. 2) is consistent with a constant Li concentration in the electrolyte. The Li concentration shown in Fig. 2 in the fresh cell “electrolyte” plateau region is ≈1 × 10²¹ Li atoms cm−3. This is higher than the theoretical value of 6 × 10²⁰ Li atoms cm−3 for a 1 M LiPF6 electrolyte because the electrolyte region was modelled with the density of Sn. The plateau in the electrolyte region for a fresh cell gave the expected concentration of 6 × 10²⁰ Li atoms cm−3 once the same region was calibrated with a TRIM model consisting of a LP30 layer (1 M LiPF6 in 1![[thin space (1/6-em)]](https://www.rsc.org/images/entities/char_2009.gif) :
:![[thin space (1/6-em)]](https://www.rsc.org/images/entities/char_2009.gif) 1 vol EC
1 vol EC![[thin space (1/6-em)]](https://www.rsc.org/images/entities/char_2009.gif) :
:![[thin space (1/6-em)]](https://www.rsc.org/images/entities/char_2009.gif) DMC, i.e., LP30; see inset in Fig. 2).
DMC, i.e., LP30; see inset in Fig. 2).
The Li signal at the electrode–electrolyte interface region (at ca. 10 μm in Fig. 2) is a combination of Li in the solid electrolyte interphase layer (SEI) deposited during the pre-lithiation step as well the interfacial Li–Sn alloy formed. A small peak at the Sn–Cu window interface (0 μm to 3 μm) is likely the result of small amounts of the electrolyte seeping around the Sn electrode into the Sn–Cu interface during assembly. This results in a limited amount of lithiation from the electrode-window side of the electrode during the pre-lithiation step. Increased Li in this area during the first 10 h of in situ lithiation was not observed, suggesting that the electrolyte does not continue to seep into this region.
A 600 mV potential hold was performed in situ on the pre-lithiated cell, the current transient of which is shown as an inset in Fig. 3. NDP spectra were collected at every 5th hour because of the low current and relatively low amount of mobile Li involved in the 600 mV holds (see Fig. 3). Ours and other groups' previous work report that the lithiation of Sn to its first intermetallic phase, Li2Sn5, starts at ≈700 mV. The second intermetallic phase, LiSn, is formed at potentials negative of <600 mV. Therefore, a 600 mV hold ensures that only Li2Sn5 phases are thermodynamically favourable, and that the maximum expansion of the volume of the Sn unit cell does not exceed 22% (Table S1†).
Diffusion from Fick's 1st law (600 mV hold)
As described in the Experimental section, Fick's 1st law, , is obtained by fitting a model to the linear Li gradients in each spectrum (Fig. 4A and B) and converting the depth unit from μm to cm to obtain a slope in units of Li atoms cm−4. Typically, one would assume the flux (J) used in Fick's 1st law to be the electronic current passed during the hold following the assumption that every electron (e) transfer in or out of the active material is accompanied by a Li addition or subtraction in the material. However, it is well established that electrons can also react with the electrolyte forming an SEI layer,18,19 and, therefore, a significant amount of parasitic losses are observed during the first few cycles of anodes,21 including with Sn.20 The formation of an SEI layer is evident in both Fig. 2 and 3 where the electrolyte region of a lithiated cell (9 μm to 14 μm) has significantly higher Li counts compared to a fresh unlithiated cell. In this work, we observed the continued formation of SEI layers on Sn, even on a pre-lithiated cell.
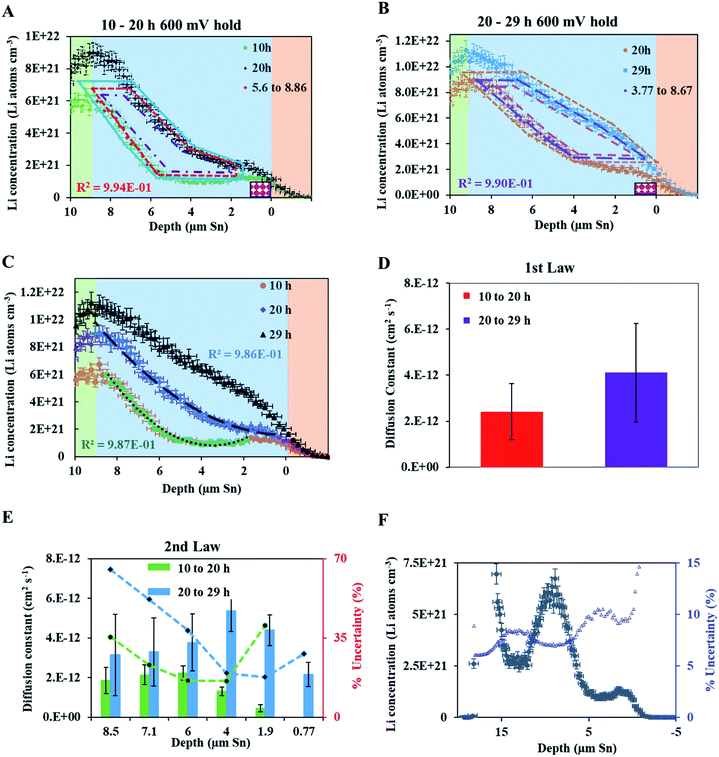 | ||
| Fig. 4 (A) NDP spectra at 10 h (green circles) and 20 h (black triangles) into the 600 mV potential hold. One region of the 10 h spectra is linearly fitted (Fig. S3†) to provide dCLi dx−1 values for Fick's 1st Law. The Li flux (Li atoms cm2 s−1) is calculated from the integrated Li concentration difference within the polygon (red dashed lines) between the spectra. The upper and lower limits of the uncertainty in this area are shown enclosed by the cyan and maroon polygons. The pink patterned square represents a unit area on this plot. (B) NDP spectra at 20 h (orange circles) and 29 h (blue squares) into the 600 mV potential hold. One region of the 20 h spectra is linearly fitted (Fig. S4†) to provide dCLi dx−1 values for Fick's 1st Law. The Li flux (Li atoms cm2 s−1) is calculated from the integrated Li concentration difference within the polygon (purple dashed lines) between the spectra. Upper and lower uncertainty limits of the uncertainty in this area are shown enclosed by the orange and pink polygons. The pink patterned square represents a unit area on this plot. (C) NDP spectra 10 h (orange circles), 20 h (purple diamonds), and 29 h (black triangles) into the 600 mV hold. The 10 h (green squares/black dotted curve) and 20 h (blue crosses/black dashed curve) spectra are fitted with a second-order polynomial. (D) Diffusion constants obtained from Fick's 1st law and figures (A) and (B). Values range from 2 × 10⁻¹² Li atoms cm2 s−1 to 4 × 10⁻¹² Li atoms cm2 s−1. Uncertainty is high (≈50%) due to large slope uncertainty in the fitted dCLi dx−1 regions as shown in the ESI (Fig. S3 and S4†). (E) Diffusion constants with total uncertainty bars at various depths calculated from each NDP spectra pair in C. Values range from 1 × 10⁻¹² Li atoms cm2 s−1 to 6 × 10⁻¹² Li atoms cm2 s−1. Uncertainty ranges from 20% to 65%. (F) NDP spectrum (grey circles) 10 h into the 600 mV hold with associated total concentration and depth position uncertainty bars. Percent concentration uncertainty (blue triangles, right-hand axis) is shown and ranges between 5% and 10% within the relevant range. | ||
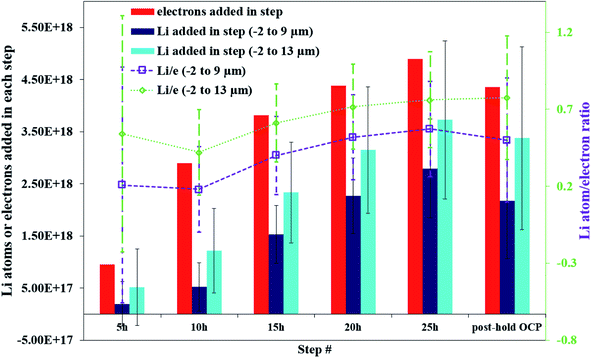
Fig. 5 illustrates that there can be as much as 4× the number of electrons added to the Sn as there are total Li atoms added into or alloyed with the electrode. This depends on the region of the spectra integrated for total Li count (Fig. 6). Quantifying the amount of Li within the Sn region of 2 μm to 9 μm gives a Li e−1 ratio of 0.25 to 0.5, signifying a 75% to 50% parasitic loss.15–17,21 These parasitic losses appear to decrease with time. In comparison, a Li e−1 value range from 0.5 to 0.75 was calculated when the Li at the electrode–electrolyte interface was also included in the quantification calculation (region spanning −2 μm to 13 μm). This ratio value range suggests that some electrons are being consumed and causing the formation of non-Li containing species in the SEI or species are re-dissolving into the bulk electrolyte, especially during the early parts of the hold. Based on this observation a higher J value (from Fick's 1st law) than what is estimated by NDP would be calculated from the current transient. Use of the current transient data only would result in a 4× higher diffusion constant than estimated from the NDP data.
Diffusion coefficients at the 200 mV hold
A fresh cell was lithiated with an applied potential of 200 mV to form the thermodynamically favoured intermetallic phase of Li7Sn2. Sn must undergo transitions from Sn to Li2Sn5, LiSn, Li7Sn3, Li5Sn2, Li13Sn5, and Li7Sn2 to reach Li7Sn2.1 Diffusion coefficient calculations were attempted for each listed phase using NDP results. How these coefficients were calculated are presented first, followed by a discussion of the challenges in assigning Li diffusion to a specific intermetallic phase in the presence of a density gradient.Fig. 7 shows spectra collected during a 200 mV hold. 1 h into this hold the Li concentration at the interfacial region (9 μm) reached a maximum. The interface region was observed to extend further into the electrolyte region as the hold persisted. This is consistent with an interfacial region that might be forming a more highly lithiated LixSn intermetallic with a larger unit cell volume, which can potentially expand up to 300% of the initial Sn volume. The presence of an expanded interface was independently verified by scanning electron microscopy (SEM) as there was a measurable expansion as Sn was lithiated to a Li-concentrated LixSn phase. This resulted in cracking of the Sn foil during a 200 mV hold. Using the same methodology described for the 600 mV hold, the diffusion constant near the interfacial region was calculated to range between 2 × 10⁻¹¹ cm2 s−1 to 4 × 10⁻¹¹ cm2 s−1 (Fig. 8). In the bulk of the electrode (0 μm to 4 μm), where the Li concentration is low, the constants associated with the bulk diffusion were found to be lower with values between 8 × 10⁻¹² cm2 s−1 to 15 × 10−12 cm2 s−1 (Fig. 7 through 9).
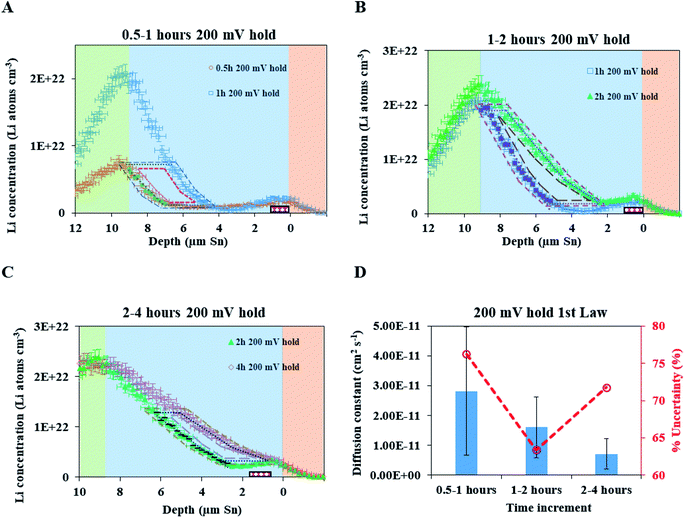 | ||
| Fig. 8 (A) NDP spectra at 0.5 h (orange open circles) and 1 h (blue open squares) into the 200 mV potential hold. One region of the 0.5 h spectra is linearly fitted (green circles) to provide dCLi dx−1 values (Fig. S5†) for Fick's 1st Law. The Li flux (Li atoms cm−2 s−1) is calculated from the integrated Li concentration difference within the polygon (green dotted lines) between the spectra. Upper and lower uncertainty limits of the uncertainty in this area are shown by polygons enclosed by the dark blue and red polygons. The pink patterned rectangle represents a unit area on this plot. (B) NDP spectra at 1 h (blue open squares) and 2 h (green triangles) into the 200 mV potential hold. One region of the 1 h spectra is linearly fitted (purple squares) to provide dCLi dx−1 (Fig. S6†) values for Fick's 1st Law. The Li flux is calculated from the integrated Li concentration difference within the polygon (purple dashed lines) between the spectra. Upper and lower uncertainty limits in this area is shown by polygons enclosed by the pink and brown polygons. The pink patterned rectangle represents a unit area on this plot. (C) NDP spectra at 2 h (green triangles) and 4 h (open red diamonds) into the 200 mV potential hold. One region of the 2 h spectra is linearly fitted (black dashes) to provide dCLi dx−1 (Fig. S7†) values for Fick's 1st law. The Li flux is calculated from the integrated Li concentration difference within the polygon (black dashed lines) between the spectra. Upper and lower uncertainty limits in this area are shown by polygons enclosed by the orange and violet polygons. The pink patterned rectangle represents a unit area on this plot. (D) Diffusion constants obtained from Fick's 1st law and figures (A–C). Values range from 2.5 × 10⁻¹¹ cm2 s−1 to 8 × 10⁻¹² cm2 s−1. Uncertainty is high (60–75%) due to large slope uncertainty in the fitted dCLi dx−1 regions as shown in the ESI (Fig. S5–S7†), as well as large polygon area uncertainties. | ||
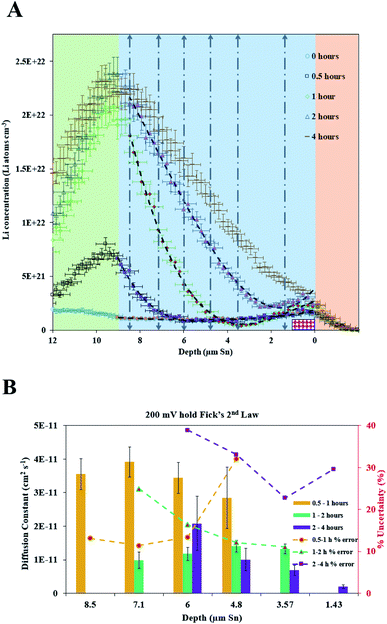 | ||
| Fig. 9 (A) NDP spectra 0 h (open blue circles), 0.5 h (open black squares), 1 h (open green diamonds), 2 h (open blue triangles), and 4 h (brown dashes) into the 200 mV hold. The 0 h (orange circles), 0.5 h (purple squares), 1 h (red diamonds), and 2 h (pink triangles) spectra are fitted with polynomials (black dashed curves). The vertical grey dashed arrows mark the depth positions at which diffusion constants were calculated. The pink patterned rectangle represents a unit area on this plot. Polynomial fits for the 0 h, 0.5 h, 1 hour, and 2 h spectra are found in Table S3.† (B). Diffusion constants with total uncertainty bars at various depths calculated from each NDP spectra pair in C. Values range from 4 × 10⁻¹¹ cm2 s−1 to 1 × 10⁻¹² cm2 s−1. Uncertainty values ranges from 10% to 40%. | ||
Discussion
The analysis and interpretation of collected results are influenced by how uncertainties were computed, and a short discussion of uncertainty calculation methodology is warranted. Other assumptions, e.g., the role of Li migration, are also discussed.Uncertainty from NDP cell window
The 3H particle energy distribution becomes larger as it travels through a thicker or denser electrode material (aka undergoes energy broadening). A significant broadening of the distribution results in larger uncertainty in the energy axis (x-axis). Although not logistically feasibly, if the Cu window were to be completely removed the uncertainty values would reduce by 30 to 40%. One way to reduce this uncertainty is either by decreasing the thickness of the Cu window or replacing it with a lower stopping power material. Coating Kapton films with Cu is another possible solution, although this requires no pinholes in the Kapton film.11 If studying a cathodic material, Al would be a good window material due to its lower density (2.7 g cm−3).Exclusion of Li migration
It is possible that the applied potential could affect Li transport within the Sn electrode through migration. Migration was assumed negligible for all experiments performed in this study as Li within the Sn electrode must be charged or have some positive character for migration to occur. XPS data, which can indicate charge state, was collected from Sn at various stages of lithiation. Binding energy results indicate that both species were elemental. This suggests that the migration of Li within the Sn matrix may be negligible, and is assumed so, for the 600 mV and 200 mV potential hold treatments in this manuscript.Assumed alloy resistivity
Van der Marel et al.32 reports that the resistivity increases up to 850 μΩ cm for a liquid Li–Sn alloy of composition 80% Li and 20% Sn, from an initial resistivity of ≈50 μΩ cm for pure Sn liquid. This work suggests that the alloy analysed here should have remained an electrical conductor under given experimental conditions. However, the lithiated Sn electrode in this work is not in the liquid phase (as utilized in the cited study), which may make its composition-based conductivity deviate from the reported liquid alloy values. No other conductivity data on the Li–Sn alloy was found in the literature.Chemical changes and NDP depth uncertainty estimation
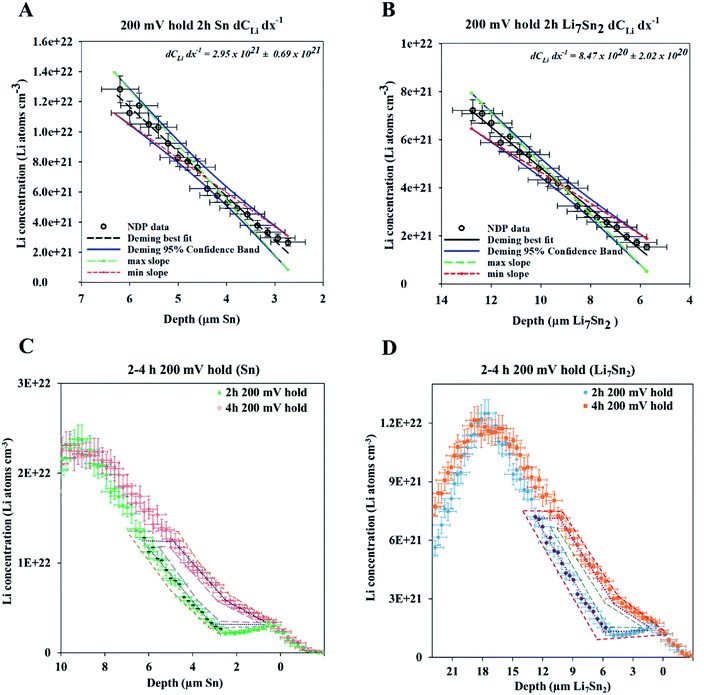
As previously mentioned, the energy of the escaping 3H was first calibrated to the density of pure Sn for simplicity. This calibration is most appropriately applied to the uncycled Sn sample NDP profiles but can provide misleading Li volumetric density values if applied to electrodes with varying gradients across. For example, Fig. 7–10 show that when potential is held at 200 mV, sufficient current flows such that the Li concentration at the interface reaches a maximum within 2 h of lithiation. At this potential, it is thermodynamically favourable to form Li7Sn2, where the theoretical concentration per unit volume equals 1.09 × 10²² Li atoms cm−3. When the NDP spectra were initially calibrated to the Sn density the interface concentration of Li for the 200 mV hold is ≈2.5 × 10²² Li atoms cm−3. The same spectra calibrated to the density of Li7Sn2 gave a Li interfacial concentration of ≈1.2 × 10²² Li atoms cm−3 (Fig. 7 and 10). This supports previously reported observations1,25 that Li7Sn2 phase is formed at 200 mV.It is important to note that the 200 mV data is much more complex than presented above. At 200 mV, the thermodynamically favoured intermetallic phase is Li7Sn2. However, our group as well as others have previously shown that Li undergoes a serial transition from being first dissolved as a solid solution in Sn, then to the formation of Li2Sn5, to LiSn, to Li7Sn3, to Li5Sn2, to Li13Sn5, to Li7Sn2 (Table S1†). Therefore, while the Li concentration found at the interface of the 200 mV data implies the presence of Li7Sn2, the gradient suggests the possible presence of a mixture of LixSn intermetallic. This mixture has a density range from 6.2 g cm−3 to 2.9 g cm−3 (Table S1†).
The profile from the 600 mV hold experiment provides another example of the data calibration issue. The thermodynamically favourable Li intermetallic phase at this potential is Li2Sn5. As such, the Li gradient observed, and the diffusion coefficient calculated from the NDP data could reflect the changing Li concentration dissolved in a matrix of Sn or the diffusion of Li2Sn5 in a matrix of Sn. It is not possible to determine which phase is being measured by NDP at a given depth based on the NDP results alone. In previous work, however, it was shown that the formation of the Li2Sn5 structure is observed as positive as 720 mV.1
As illustrated by these examples, a main uncertainty for the estimated diffusion coefficient is the variability of the material's density as a function of depth. In this work, the diffusion coefficients are calculated based on depth calibration using the density of Sn (7.3 g cm−3). However, highly lithiated phases of Sn have a corresponding lattice expansion, resulting in a lower density, e.g., Li7Sn2 (2.9 g cm−3). Fig. 10 shows NDP spectra of the 200 mV data, calibrated to the Sn and Li7Sn2 densities, respectively. Profile calculations using less dense Li7Sn2 result in a lower stopping power for a 3H, which affects both the depth calibration and volumetric concentration calculation. This issue can be overcome by focusing calculations on the integration of the total Li in a region. Doing so from the areal density NDP profiles (Li atoms cm−2vs. keV) makes the final values independent of material density assumptions. This method is used in the remainder of this manuscript.
These findings underline the need for depth calibrations that use depth-dependent density functions to accurately model an electrode of non-uniform density. This is a difficult calculation to execute with TRIM in the software's current form and will require accurate parameter input values. The Li depth calibration is ultimately limited by the need to know the true composition and form of the material(s) within the system, which is extremely difficult as the chemistry evolves dynamically. Such parameters could be obtained with in situ X-ray reflectometry for very thin and flat samples22 or in situ X-ray diffraction for thicker, rougher samples.26 Execution of NDP data processing using this methodology will provide more robust Li concentration values for use in the calculation of the needed diffusion coefficients.
Li diffusion constants for 600 mV and 200 mV potential holds
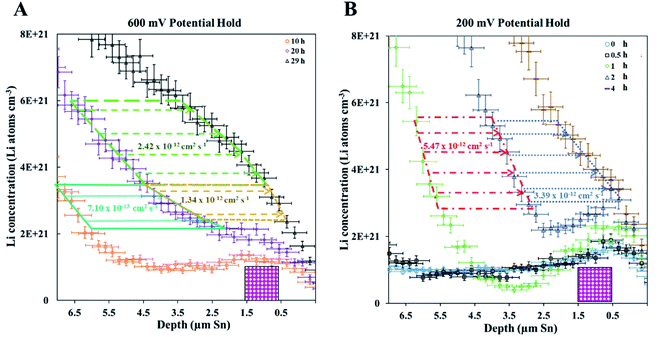
A direct comparison between the 600 mV and 200 mV hold experiments can still be made despite the uncertainties in modelling the 3H escape depth as outlined above. Using the above-described methodology that relies on the areal density of NDP profiles it is observed that both 600 mV and 200 mV electrodes have similar Li content between 0 μm and 7 μm when calibrated with the density of pure Sn (Fig. 11, focusing on a region with less than 6 × 10²¹ Li atoms cm−3). Diffusion constants obtained from both electrodes within this region should be reliable due to the region being far from the interface where the composition, especially for 200 mV, could be a complex mixture of LixSn intermetallics with densities varying between 2 g cm−3 to 7 g cm−3. The concentration of Li required to form the first intermetallic phase, Li2Sn5, is 6 × 10²¹ Li atoms cm−3. Below this value it is assumed that there are no higher lithiated phases beyond Li2Sn5, and that the distribution of Li reflects either dissolved Li in a matrix or nucleated Li2Sn5 in a matrix of Sn. This region is here referred to as the “low Li content region”. The diffusion coefficient values obtained in this region were found to be comparable, ranging from 1 × 10⁻¹² cm2 s−1 to 6 × 10⁻¹² cm2 s−1. This contrasts with the higher Li concentration region in the 200 mV data set where the diffusion coefficient obtained near the interface is an order of magnitude higher (≈10−11 cm2 s−1) and then decreases in the bulk region.Comparison with literature results
Literature reports on the diffusion constant for Li in Sn range from 10−10 cm2 s−1 to 10−16 cm2 s−1 (Table 3). These measurements were predominantly measured using electrochemical methods such as potentiostatic intermittent titration (PITT) and galvanostatic intermittent titration (GITT) at varying states of charge and degrees of aging. Li diffusion measurements on a highly complex material such as Sn can be quite challenging; a factor that can be compounded using these indirect detection methods. It is for this reason that a direct Li detection method, such as NDP, can be preferable. The diffusion constants calculated from the presented NDP results fall within the range of previously published values. The small range of values for the diffusion constant is a noted difference between the NDP calculated range, which accounts for the estimated uncertainty associated with the measurements and data processing methodology, and the range of values reported in the literature. From both data sets it is apparent that the overall Li diffusion in Sn is relatively slow. Therefore, at potentials negative enough to form highly lithiated Li7Sn5 phases, the slow Li diffusion results in a mixture of LixSn intermetallics. This is consistent with the interpretations made for the observed Li gradient changes in the NDP profiles.| Author, year | Technique | D obtained (cm2 s−1) | Notes |
|---|---|---|---|
| Pridatko, 2006 (ref. 26) | GITT run at multiple temperatures. Sn thickness about 1 μm | 1 × 10⁻¹⁰ to 1 × 10⁻¹⁴ | Potential dependent, faster diffusion below 0.4 V. Temperate dependence is non-linear |
| Churikov et al., 2006 (ref. 27) | EIS, multiple equivalent circuits analyzed. Sn thickness was 0.1 to 1 μm | 1 × 10⁻⁹ to 1 × 10⁻¹⁴ | Potential dependent, faster diffusion below 0.4 V. EIS is significantly affected by the conditioning of the Sn electrode |
| Besenhard et al., 1999 (ref. 28) | Coulometric titration | 1 × 10⁻¹⁰ (polycrystalline), 4 × 10⁻¹² (nanocrystalline) | Polycrystalline SnSb alloys and thin-film nano-crystalline SnSb |
| Fok et al., 2013 (ref. 24) | GITT of electrodeposited Sn films (1 μm thickness) | 1 × 10⁻¹³ to 1 × 10⁻¹⁵ | Potential dependent |
| Wang et al., 1986 (ref. 33) | GITT of Li–Sn alloy | 1 × 10⁻⁷ to 1 × 10⁻⁸ | Room temperature diffusion was obtained for the Li0.7Sn and Li2.33Sn alloys |
| Xie et al., 2010 (ref. 29) | GITT | 1 × 10⁻¹⁴ to 1 × 10⁻¹⁶ | — |
Conclusions
In situ lithiation of micron-scale Sn foils at two different potentials was monitored via NDP using a robust, customized Li-ion coin cell design that provides reproducible cycling data and is compatible with NDP operating conditions. Based on the time and position-dependent Li concentration changes, diffusion constants were calculated using Fick's 1st and 2nd laws. The NDP spectra obtained revealed electrodes with large, continuous Li concentration gradients, but without definable, mono-phasic regions. This feature made NDP data processing and interpretation complex, requiring final Li diffusion constants to be calculated from NDP areal density profiles and utilizing select, known chemistry regions of the NDP spectra. Calculated Li diffusion coefficients fell within the range of literature reported values, albeit with a smaller range. Herein reported NDP results and previously published studies indicate that Li diffusion in Sn is slow and progresses through the formation of multiple LixSn phases. This study provides further evidence of the benefit of using NDP to measure lithiation phenomena in situ to operating Li-ion cells. Executing improvements suggested for NDP data processing and Li-ion cell designs may extend NDP utility in the field of Li-ion battery research.Author contributions
DJL and JLW contributed to data curation and methodology development. DJL contributed to the investigation and wrote the original draft. ACC contributed to the conceptualization, funding acquisition, and project administration. All three authors contributed to the formal analysis, visualization, review and editing of the manuscript.Conflicts of interest
There are no conflicts to declare.Acknowledgements
This work was supported by the Department of Chemistry and Biochemistry at The Ohio State University and the Alfred P. Sloan Foundation. The authors would also like to thank the National Institute of Standards and Technology (NIST) for the use of neutron depth profiling facility at the NIST Center for Neutron Research (NCNR). The authors thank Dr R. Gregory Downing and Dr Joe Dura from NIST for useful discussions on NDP and in situ experimental methods, the support from staff at The Ohio State University Nuclear Reactor Laboratory, and Dr Lei Cao for discussions on NDP calibration. Certain commercial equipment, instruments, or materials (or suppliers, or software) are identified in this paper to foster understanding. Such identification does not imply recommendation or endorsement by the National Institute of Standards and Technology, nor does it imply that the materials or equipment identified are necessarily the best available for the purpose.References
- J. L. Lorie Lopez, P. J. Grandinetti and A. C. Co, Phase transformations and capacity fade mechanism in LixSn nanoparticle electrodes revealed by operando 7Li NMR, J. Mater. Chem. A, 2019, 7, 10781–10794, 10.1039/C9TA03345A
.
- G. B. Less, J. H. Seo, S. Han, A. M. Sastry, J. Zausch, A. Latz, S. Schmidt, C. Wieser, D. Kehrwald and S. Fell, Micro-Scale Modeling of Li-Ion Batteries: Parameterization and Validation, J. Electrochem. Soc., 2012, 159, A697, DOI:10.1149/2.096205jes/
.
- J. Xie, N. Imanishi, T. Zhang, A. Hirano, Y. Takeda and O. Yamamoto, Li-ion diffusion in amorphous Si films prepared by RF magnetron sputtering: a comparison of using liquid and polymer electrolytes, Mater. Chem. Phys., 2010, 120(2–3), 421–425, DOI:10.1016/j.matchemphys.2009.11.031
.
- N. Ding, J. Xu, Y. X. Yao, G. Wegner, X. Fang, C. H. Chen and I. Lieberwirth, Determination of the diffusion coefficient of lithium ions in nano-Si, Solid State Ionics, 2009, 180, 222–225, DOI:10.1016/j.ssi.2008.12.015
.
- C. J. Wen, B. A. Boukamp, R. A. Huggins and W. Weppner, Thermodynamic and mass transport properties of “LiAl”, J. Electrochem. Soc., 1979, 126(12), 2258, DOI:10.1149/1.2128939
.
- M. D. Levi, G. Salitra, B. Markovsky, H. Teller, D. Aurbach, U. Heider and L. Heider, Solid-State Electrochemical Kinetics of Li-Ion Intercalation into Li1−xCoO2: Simultaneous Application of Electroanalytical Techniques SSCV, PITT and EIS, J. Electrochem. Soc., 1999, 146, 1279–1289, DOI:10.1149/1.1391759
.
- Y. C. Hsieh, J. H. Thienenkamp, C. J. Huang, H. C. Tao, U. Rodehorst, B. J. Hwang, M. Winter and G. Brunklaus, Revealing the Impact of Film-Forming Electrolyte Additives on Lithium Metal Batteries via Solid-State NMR/MRI Analysis., J. Phys. Chem. C, 2021, 125(1), 252–265, DOI:10.1021/acs.jpcc.0c09771
.
- J. Wang, D. X. Liu, M. Canova, R. G. Downing, L. R. Cao and A. C. Co, Profiling lithium distribution in Sn anode for lithium-ion batteries with neutrons, J. Radioanal. Nucl. Chem., 2014, 301, 277–284, DOI:10.1007/s10967-014-3102-5
.
- W. Vandervorst, F. R. Shepherd and R. G. Downing, High resolution SIMS and neutron depth profiling of boron through oxide–silicon interfaces., J. Vac. Sci. Technol., A, 1985, 3(3), 1318–1321, DOI:10.1116/1.573057
.
- F. Linsenmann, M. Trunk, P. Rapp, L. Werner, R. Gernhäuser, R. Gilles, B. Märkisch, Z. Revay and H. Gasteiger, A Liquid Electrolyte-Based Lithium-Ion Battery Cell Design for Operando Neutron Depth Profiling., J. Electrochem. Soc., 2020, 167, 100554, DOI:10.1149/1945-7111/ab9b20
.
- L. Y. Beaulieu, K. W. Eberman, R. L. Turner, L. J. Krause and J. R. Dahn, Colossal Reversible Volume Changes in Lithium Alloys, Electrochem. Solid-State Lett., 2001, 4, A137, DOI:10.1149/1.1388178
.
- S. C. Nagpure, R. G. Downing, B. Bhushan, S. S. Babu and L. Cao, Neutron depth profiling technique for studying aging in Li-ion batteries, Electrochim. Acta, 2011, 56(13), 4735–4743, DOI:10.1016/j.electacta.2011.02.037
.
-
A. L. F. Meister, Generalia de genesi figurarum planarum et inde pendentibus earum affectionibus, Nov. Com. Gött, 1769, vol. 1, p. 144 Search PubMed
.
- B. Braden, The Surveyor’s Area Formula, Coll. Math. J., 1986, 17(4), 326–337, DOI:10.1080/07468342.1986.11972974
.
-
D. J. Lyons, Application and Challenges of Neutron Depth Profiling to In Situ Battery, Measurements, PhD thesis, Ohio State University, 2021, pp. 1–142
.
- D. X. Liu, J. Wang, K. Pan, J. Qiu, M. Canova, L. R. Cao and A. C. Co,
In Situ Quantification and Visualization of Lithium Transport with Neutrons, Angew. Chem., Int. Ed., 2014, 53, 9498–9502, DOI:10.1002/ange.201404197
.
- D. X. Liu and A. C. Co, Revealing Chemical Processes Involved in Electrochemical (De)Lithiation of Al with in Situ Neutron Depth Profiling and X-ray Diffraction, J. Am. Chem. Soc., 2016, 138, 231–238, DOI:10.1021/jacs.5b10295
.
- S. Hong, M. H. Choo, Y. H. Kwon, J. Y. Kim and S. W. Song, Mechanisms for Stable Solid Electrolyte Interphase Formation and Improved Cycling Stability of Tin-Based Battery Anode in Fluoroethylene Carbonate-Containing Electrolyte, Adv. Mater. Interfaces, 2016, 3, 1–9, DOI:10.1002/admi.201600172
.
- A. Wang, S. Kadam, H. Li, S. Shi and Y. Qi, Review on modeling of the anode solid electrolyte interphase (SEI) for lithium-ion batteries, npj Comput. Mater., 2018, 4, 1–26, DOI:10.1038/s41524-018-0064-0
.
- I. T. Lucas, E. Pollak and R. Kostecki,
In situ AFM studies of SEI formation at a Sn electrode, Electrochem. Commun., 2009, 11, 2157–2160, DOI:10.1016/j.elecom.2009.09.019
.
- J. E. Owejan, J. P. Owejan, S. C. DeCaluwe and J. A. Dura, Solid Electrolyte Interphase in Li-Ion Batteries: Evolving Structures Measured In situ by Neutron Reflectometry, Chem. Mater., 2012, 24, 2133–2140, DOI:10.1021/cm3006887
.
- E. D. Rus and J. A. Dura,
In Situ Neutron Reflectometry Study of Solid Electrolyte Interface (SEI) Formation on Tungsten Thin-Film Electrodes, ACS Appl. Mater. Interfaces, 2019, 11, 47553–47563, DOI:10.1021/acsami.9b16592
.
- X. Zhang, T. W. Verhallen, F. Labohm and M. Wagemaker, Direct Observation of Li-Ion Transport in Electrodes under Nonequilibrium Conditions Using Neutron Depth Profiling, Adv. Energy Mater., 2015, 5(15), 1–8, DOI:10.1002/aenm.201500498
.
- E. C. W. Fok and J. D. Madden, Measurement of the Diffusion Coefficient of Lithium in Tin Thin Films Including Phase Transformation Effects, ECS Trans., 2013, 53, 131–142, DOI:10.1149/05330.0131ecst
.
- T. Hatchard and J. Dahn,
In Situ XRD and Electrochemical Study of the Reaction of Lithium with Amorphous Silicon, J. Electrochem. Soc., 2004, 151, A838, DOI:10.1149/1.1739217
.
- K. I. Pridatko, Electrochemical insertion of lithium in thin tin films, Russ. J. Electrochem., 2006, 42, 63–70, DOI:10.1134/S1023193506010113
.
- A. V. Churikov, K. I. Pridatko, A. V. Ivanishchev, I. A. Ivanishcheva, I. M. Gamayunova, K. V. Zapsis and V. O. Sycheva, Impedance spectroscopy of lithium–tin film electrodes, Russ. J. Electrochem., 2008, 44, 550–557, DOI:10.1134/S1023193508050078
.
- J. O. Besenhard, M. Wachtler, M. Winter, R. Andreaus, I. Rom and W. Sitte, Kinetics of Li insertion into polycrystalline and nanocrystalline `SnSb’ alloys investigated by transient and steady state techniques, J. Power Sources, 1999, 81–82, 268–272, DOI:10.1016/S0378-7753(99)00199-8
.
- J. Xie, N. Imanishi, A. Hirano, Y. Takeda, O. Yamamoto, X. B. Zhao and G. S. Cao, Li-ion diffusion behavior in Sn, SnO and SnO2 thin films studied by galvanostatic intermittent titration technique, Solid State Ionics, 2010, 181, 1611–1615, DOI:10.1016/j.ssi.2010.09.006
.
- J. F. M Oudenhoven, F. Labohm, M. Mulder, R. A. H. Niessen, F. M. Mulder and P. Notten,
In situ neutron depth profiling: a powerful method to probe lithium transport in micro-batteries., Adv. Mater., 2011, 23(35), 4103–4106, DOI:10.1002/adma.201101819
.
- J. F. Ziegler, M. D. Ziegler and J. P. Biersack, SRIM–The stopping and range of ions in matter, Nucl. Instrum. Methods Phys. Res., Sect. B, 2010, 268(11–12), 1818–1823, DOI:10.1016/j.nimb.2010.02.091
.
- C. van der Marel, A. B. van Oosten, W Gertsma and W van der Lugt, The electrical resistivity of liquid Li–Sn, Na–Sn and Na–Pb alloys: strong effects of chemical interactions, J. Phys. F: Met. Phys., 1982, 12, 2349–2361, DOI:10.1088/0305-4608/12/10/024
.
- J. Wang, I. D. Raistrick and R. A. Huggins, Behavior of Some Binary Lithium Alloys as Negative Electrodes in Organic Solvent-Based Electrolytes, J. Electrochem. Soc., 1986, 133, 457–460, DOI:10.1149/1.2108601
.
Footnote |
| † Electronic supplementary information (ESI) available. See DOI: 10.1039/d1ta09639g |
| This journal is © The Royal Society of Chemistry 2022 |

