Sillén–Aurivillius phase bismuth niobium oxychloride, Bi4NbO8Cl, as a new oxide-ion conductor†
Maksymilian
Kluczny
c,
Jun Tae
Song
 ab,
Taner
Akbay
 d,
Eiki
Niwa
 a,
Atsushi
Takagaki
 ab and
Tatsumi
Ishihara
 *abc
*abc
aInternational Institute for Carbon Neutral Energy Research (WPI-I2CNER), Kyushu University, Motooka 744, Nishiku, Fukuoka, 819-0395, Japan. E-mail: ishihara@cstf.kyushu-u.ac.jp
bDepartment of Applied Chemistry, Faculty of Engineering, Kyushu University, Motooka 744, Nishiku, Fukuoka, 819-0395, Japan
cDepartment of Automotive Sciences, Graduate School of Integrated Frontier Sciences, Kyushu University, Motooka 744, Nishiku, Fukuoka, 819-0395, Japan
dDepartment of Materials Science and Nanotechnology Engineering, Yeditepe University, Turkey
First published on 20th December 2021
Abstract
Sillén–Aurivillius phase Bi4NbO8Cl consists of Bi2O2+/NbO3−/Bi2O2+/Cl− layers and oxide-ion conduction is expected to occur in its Bi2O2+ layer. Here, we report the influence of partial substitutions of Bi with Ca2+, Sr2+, Ba2+, La3+, Ga3+ and Sn4+ on the electrical properties. It was found that substitution with low valence cations is effective for increasing electrical conductivity, and in particular, Sr2+ substitution is the most effective for this purpose. The dependence of electrical conductivity on the oxygen partial pressure of a Sr-doped sample is quite low (PO2−0.015) and the optimized amount of Sr doping is x = 0.1 in Bi4−xSrxNbO8−δCl. The electromotive force of N2/O2 gas concentration cell is 90% of the theoretical value and the tracer diffusion constant (D) estimated by 18O2 diffusion almost corresponds with that estimated from conductivity. Considering the activation energy of the D value, oxide-ion conductivity in Sillén–Aurivillius phase Bi4NbO8Cl mainly occurs along the Bi2O22+ layer, which indicates that Bi4NbO8Cl is a new family of fast oxide-ion conductors.
1. Introduction
Oxide-ion conductors are important functional materials that are widely used in various electrochemical devices, such as solid oxide fuel cells, high temperature electrolyzers, gas sensors, and oxygen separating membranes.1–4 Most oxide-ion conducting materials, regardless of their conduction mechanism,5,6 show oxide ion conductivity though oxygen vacancies or interstitial oxide ions. In order to achieve fast oxide ion conductivity, dopants are generally used for introducing oxygen vacancies or interstitial oxygen into materials. Typical fast oxide-ion conductors are based on perovskite-type LSGM (La0.9Sr0.1Ga0.8Mg0.2O3−δ) oxides,7 fluorite-type oxides of yttria stabilized ZrO2, (typically Y0.08Zr0.92O2−δ, YSZ) or doped CeO2 (Ce0.8Gd0.2O2, GDC)8 or pseudo fluorite oxides of doped Bi2O3 (typically ESB, Bi1.8Er0.2O3−δ).9 Among them, the doped Bi2O3 family has been attracting attention because of its high oxide-ion conductivity. The stabilization of the high-diffusivity of oxide ions in the δ-Bi2O3 phase can be achieved down to 978–1013 K by the substitution of bismuth with rare-earth dopants (such as Y, Dy or Er) and their combinations with higher-valency cations such as W or Nb. In particular, it has been reported that Bi2O3 doped with Y2O3 shows the highest oxide ion conductivity in a high partial pressure of oxygen (PO2) range among the doped Bi2O3 family (log![[thin space (1/6-em)]](https://www.rsc.org/images/entities/char_2009.gif) σ (S cm−1) = 0.47 at 1073 K in air). On the other hand, c-Bi4V2O11 (parent of the so-called BIMEVOX materials), which belongs to the Aurivillius series, also shows high oxide-ion conductivity and Bi2V0.7Sb0.3O5.5 shows the highest conductivity among the BIMEVOX materials,10,11 with one of the highest oxide-ion conductivities ever reported, reaching 1 × 10⁻¹ S cm−1 at 773 K. Recently, Dion–Jacobson phase CsBi2Ti2NbO10−δ, with its perovskite-like layers containing bismuth, was also reported as a new oxide-ion conductor12 reaching almost log(σ/S cm−1) = −1.7 at 1174 K. As a result, the doped Bi2O3 family has shown the highest oxide-ion conductivity to date, however, Bi2O3-based materials exhibit a number of disadvantages, including thermodynamic instability under a reducing atmosphere, volatilization of bismuth at moderate temperatures, high corrosion activity and low mechanical strength. Due to these limitations, the applicability of these Bi2O3 oxides in electrochemical cells is considerably limited. Using an samarium doped ceria (Ce1−xSmxO2−δ, SDC) coating to prevent the reduction of Bi2O3, Wachsman13et al. reported the high power density of solid oxide fuel cells featuring an Er-doped Bi2O3/SDC bilayer electrolyte, therefore showing that Bi2O3-based systems hold potential as electrolytes for low-temperature operating solid oxide fuel cells.
σ (S cm−1) = 0.47 at 1073 K in air). On the other hand, c-Bi4V2O11 (parent of the so-called BIMEVOX materials), which belongs to the Aurivillius series, also shows high oxide-ion conductivity and Bi2V0.7Sb0.3O5.5 shows the highest conductivity among the BIMEVOX materials,10,11 with one of the highest oxide-ion conductivities ever reported, reaching 1 × 10⁻¹ S cm−1 at 773 K. Recently, Dion–Jacobson phase CsBi2Ti2NbO10−δ, with its perovskite-like layers containing bismuth, was also reported as a new oxide-ion conductor12 reaching almost log(σ/S cm−1) = −1.7 at 1174 K. As a result, the doped Bi2O3 family has shown the highest oxide-ion conductivity to date, however, Bi2O3-based materials exhibit a number of disadvantages, including thermodynamic instability under a reducing atmosphere, volatilization of bismuth at moderate temperatures, high corrosion activity and low mechanical strength. Due to these limitations, the applicability of these Bi2O3 oxides in electrochemical cells is considerably limited. Using an samarium doped ceria (Ce1−xSmxO2−δ, SDC) coating to prevent the reduction of Bi2O3, Wachsman13et al. reported the high power density of solid oxide fuel cells featuring an Er-doped Bi2O3/SDC bilayer electrolyte, therefore showing that Bi2O3-based systems hold potential as electrolytes for low-temperature operating solid oxide fuel cells.
Recently, Li et al. reported that bismuth-based oxide NBT (Na0.5Bi0.5TiO3−δ)14 shows fast oxide ion conductivity, in particular, at low temperature. However, due to its low stability under a reducing atmosphere and also high chemical reactivity, bismuth-containing materials have still not been studied thoroughly as oxide ion conductors up to now. Sillén–Aurivillius-type oxychlorides, which are layered compounds containing perovskite layers sandwiched between bismuth oxide layers and halide layers, as shown in Fig. 1, were initially explored for their photocatalytic properties15,16 as only the closely related Aurivillius-type oxides,17 such as the metal-doped bismuth vanadium system BIMEVOX, have been explored.18,19
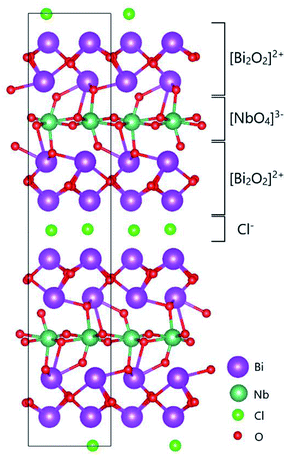 | ||
| Fig. 1 Two-dimensional crystal structure model of the Sillén–Aurivillius phase, bismuth niobium oxychloride Bi4NbO8Cl, as reported by Ackerman.20 The image of the structure was drawn using VESTA.21 | ||
In this study, we measured the conductivity of Bi4NbO8Cl, a Sillén–Aurivillius oxychloride material, and attempted to substitute trivalent Bi3+ into the [Bi2O2]2+ layers in Bi4NbO8Cl using di-, tri- and tetravalent cations to increasing its oxide ion conductivity through the introduction of interstitial oxygen or oxygen vacancies, with the aim of developing a potential new intermediate-temperature oxide-ion conductor. The diffusivity of the oxide-ion conductivity in this Bi4NbO8Cl was further studied using 18O tracer diffusion techniques.
2. Experimental
A solid-state synthesis method was used to prepare the material to obtaining dense samples using Bi2O3 (99.9% purity, Chameleon Reagent), BiOCl (99.9% purity, Kojundo), Nb2O5 (99,9% purity, Kojundo), and the desired dopant in the form of either oxide or carbonate as starting materials. The list of dopants studied is summarized in Table S1.† The synthesis method was a solid-state reaction according to the procedure reported by Nakada et al.,22 which is a two-step synthesis method. First, an intermediate oxide, Bi3−xMxNbO7−δ, was prepared from stoichiometric amount of the powdered reagents. After mixing the mixture of powders in an Al2O3 pestle and mortar, the resulting powdered mixture was calcined at 1073 K for 5 h. After subsequent grinding and mixing with BiOCl, which was introduced in 10 mol% excess, the powder was then uniaxially pressed into disk-shaped pellets of 20 mm in diameter, followed by cold isostatic pressing (CIP) under a pressure of 300 MPa for 30 min. The resulting yellow ceramic pellets were then encapsulated in silica tubes and finally sintered in a tube furnace at 1173 K for 48 h. Densities of the bulk samples were measured using the Archimedes method and were estimated to be 96.4% of the theoretical density by improving the original two-step synthesis method. The chemical composition and density estimated for the prepared sample are summarized in Table S2 in the ESI.† The density of the samples was higher than 60% of the theoretical density, however, using a two-step synthesis, the density of the sample was increased to 96.4% of the theoretical density. Analysis of the chemical composition of Bi3.9Sr0.1NbO8Cl was carried out and was found to be almost the same as the objective composition, Bi![[thin space (1/6-em)]](https://www.rsc.org/images/entities/char_2009.gif) :
:![[thin space (1/6-em)]](https://www.rsc.org/images/entities/char_2009.gif) Sr
Sr![[thin space (1/6-em)]](https://www.rsc.org/images/entities/char_2009.gif) :
:![[thin space (1/6-em)]](https://www.rsc.org/images/entities/char_2009.gif) Nb
Nb![[thin space (1/6-em)]](https://www.rsc.org/images/entities/char_2009.gif) :
:![[thin space (1/6-em)]](https://www.rsc.org/images/entities/char_2009.gif) Cl = 3.87
Cl = 3.87![[thin space (1/6-em)]](https://www.rsc.org/images/entities/char_2009.gif) :
:![[thin space (1/6-em)]](https://www.rsc.org/images/entities/char_2009.gif) 0.11
0.11![[thin space (1/6-em)]](https://www.rsc.org/images/entities/char_2009.gif) :
:![[thin space (1/6-em)]](https://www.rsc.org/images/entities/char_2009.gif) 1
1![[thin space (1/6-em)]](https://www.rsc.org/images/entities/char_2009.gif) :
:![[thin space (1/6-em)]](https://www.rsc.org/images/entities/char_2009.gif) 1.05. It was also noted that there was no change in the TGA measurements in air up to 873 K, meaning that the sample is stable up to 873 K.
1.05. It was also noted that there was no change in the TGA measurements in air up to 873 K, meaning that the sample is stable up to 873 K.
To determine the phase of the resulting samples, XRD measurements were performed using an X-ray diffractometer (Rigaku Rint 2500) employing CuKα radiation (λ = 0.1540562 nm) in the 2θ range of 10° to 80°. XRD patterns were recorded on powders obtained from crushed disk samples after sintering. The total conductivity of the polycrystalline ceramic sample was determined using a DC four-probe technique and was recorded between 873 and 573 K in air, and the oxygen dependence of the conductivity was measured at 773 K in an oxygen partial pressure range of between 1 and 10−19 atm. The ionic conductivity of the samples was also measured using a two-probe AC impedance technique (EIS) at a temperature of between 873 and 573 K in air. The EIS spectra were recorded using the Zplot software (Scribner Associates) combined with a frequency response analyzer (Solartron 1260) and a chemical interface (Solartron 1296) across a frequency range of 1 MHz to 10 mHz under an applied potential of 100 mV. In both DC and AC measurements, platinum electrodes were used. In the DC measurements, platinum wires were attached using Pt paste, while in the AC measurements, Pt mesh was attached using Pt paste. For both types of measurements, the electrodes were calcined at 1073 K for 30 min under an Ar flow of 100 cm3 min−1. The transference number of the oxide ions was measured using a gas concentration cell employing N2 and O2. Electromagnetic field (EMF) measurements were performed from high to low temperature, therefore gas leakage became more significant with decreasing temperature.
Oxygen tracer diffusivity measurements were performed using a sample cut from a 20 mm in diameter disk, with one of its surfaces polished down to 0.05 μm using diamond paste and cleaned with acetone, DI water and isopropanol in an ultrasonic bath. For the isotope exchange experiments, the sample was placed in a quartz reactor and annealed natural aboundance of isotope for 1 h and 200 mmHg at the same temperature for diffusion treatment. After cooling to room temperature, the sample was evacuated and then heated quickly to temperature for the 18O diffusion treatment. Commercial 18O2 with 99% atomic purity was used for diffusion treatment at 200 mmHg at the same temperature as that of the oxygen annealing. After quenching, the sample was cut and 18O diffusion profiles on the fractured surface were analyzed using secondary ion mass spectrometry (SIMS, Atomika Analytical 4100). The diffusion profiles were fit to Fick's diffusion equation according to the Crank's solution method23 and the self-diffusion constant (D) from the bulk conductivity was estimated using the Nernst–Einstein equation.
3. Results and discussion
3.1 Effects of dopants on electrical conductivity
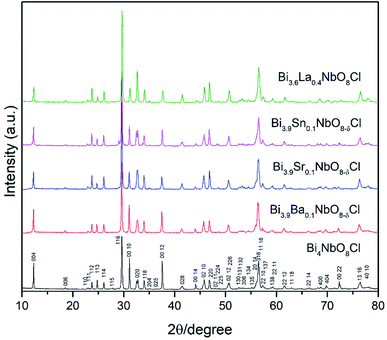
Fig. 2 shows the XRD patterns of the doped Bi4NbO8Cl prepared in this study. As shown in Fig. 2, for all the compositions of Bi4−xMxNbO8Cl where either a divalent, trivalent, or tetravalent cation was substituted, the Sillén–Aurivillius phase was obtained with orthorhombic symmetry, as previously reported.20,24 The peaks were indexed to a standardized card (COD No. 1529527). The crystallographic refinement of the lattice parameters was performed using the Rietveld profile fitting method to a P21cn space group employing the FullProf Suite software (version 30 April 2021). All the refined cell parameters as well as the unit cell volume are summarized in Table S3.†As shown in Fig. 2, all of the diffraction peaks in the XRD patterns of Bi4−xMxNbO8−δCl were assigned to Bi4NbO8Cl, with a slight shift observed in the diffraction angles, so all dopants seemed to substitute the lattice positions of Bi4NbO8Cl, except for a weak peak in the case of the Sn-doped sample at 29°. In order to further analyze the partial substitution, the lattice parameters of the sample were estimated by refinement and are summarized in Table S3.† The fitting results of the Sr-doped sample are also shown in Fig. S1.† The estimated lattice constant increased upon the substitution of the larger ionic sized Ba2+, Sr2+, and La3+, and decreased when smaller ions of Sn4+ were substituted (see Fig. S2 in the ESI†). As a result, these cations partially substituted for Bi3+ in Bi4NbO8Cl. Upon introducing humidified oxygen, the conductivity did not increase, but slightly decreased by around 5% on average, which excludes the possibility of proton conductivity occurring in the sample.
Effects of the partial substitution of Bi sites on the electrical conductivity of Bi4NbO8Cl were measured using a DC 4-probe method. Fig. 3 shows the temperature dependence of the electrical conductivity of Bi4−xMxNbO8−δCl (M = Ca, Sr, Ba, La, Sn) (0 ≤ x ≤ 1) in the temperature range from 573 to 873 K in air as well as oxygen partial pressures of 0 ≥ log![[thin space (1/6-em)]](https://www.rsc.org/images/entities/char_2009.gif) PO2 ≥ −19 at 773 K (Fig. 3(b)). The electrical conductivity was decreased upon the substitution of Bi3+ with La3+ and Sn4+, whereas it increased with lower valence cations, i.e., Ba2+ and Sr2+. Since it is expected that interstitial oxygen is introduced through the substitution of a higher valence cation and vacancy by a lower valence cation, it is expected that the increased electrical conductivity is oxide-ion conductivity that arises through the introduction of an oxygen vacancy that occurs upon Ba2+ or Sr2+ substitution. The ionic size of six coordinate Bi3+ is 0.103 nm, and those of La3+, Sr2+, Ba2+, and Sn4+ are 0.1032, 0.118, 0.135, and 0.069 nm, respectively.25 Since it is known that dopants with similar ionic radii have the most positive effects on oxide ion conductivity, doping with Sr2+ shows the most positive effects because of a lower valence number (introduction of oxygen vacancies) and its similar ionic size to that of Bi3+. The electrical conductivity of Bi4−xMxNbO8−δCl (M = Ca, Sr, Ba, La, Sn), as shown in Fig. 3(b), has a low dependence on PO2 over a wide PO2 range, therefore it is reasonable to assume that oxide-ion conductivity may be dominant in the measured samples. Among the examined dopants, the highest electrical conductivity was obtained by Sr doping, so in the following section further details of Sr doping effects will be discussed.
PO2 ≥ −19 at 773 K (Fig. 3(b)). The electrical conductivity was decreased upon the substitution of Bi3+ with La3+ and Sn4+, whereas it increased with lower valence cations, i.e., Ba2+ and Sr2+. Since it is expected that interstitial oxygen is introduced through the substitution of a higher valence cation and vacancy by a lower valence cation, it is expected that the increased electrical conductivity is oxide-ion conductivity that arises through the introduction of an oxygen vacancy that occurs upon Ba2+ or Sr2+ substitution. The ionic size of six coordinate Bi3+ is 0.103 nm, and those of La3+, Sr2+, Ba2+, and Sn4+ are 0.1032, 0.118, 0.135, and 0.069 nm, respectively.25 Since it is known that dopants with similar ionic radii have the most positive effects on oxide ion conductivity, doping with Sr2+ shows the most positive effects because of a lower valence number (introduction of oxygen vacancies) and its similar ionic size to that of Bi3+. The electrical conductivity of Bi4−xMxNbO8−δCl (M = Ca, Sr, Ba, La, Sn), as shown in Fig. 3(b), has a low dependence on PO2 over a wide PO2 range, therefore it is reasonable to assume that oxide-ion conductivity may be dominant in the measured samples. Among the examined dopants, the highest electrical conductivity was obtained by Sr doping, so in the following section further details of Sr doping effects will be discussed.
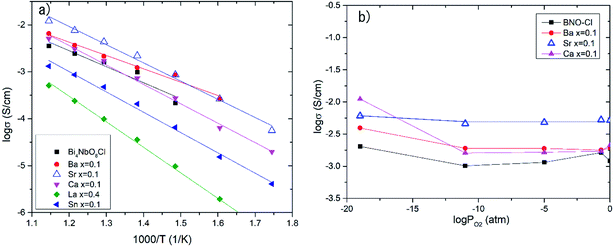 | ||
| Fig. 3 (a) Temperature dependences and (b) PO2 dependence of electrical conductivity at 773 K of doped Bi4−xMxNbO8Cl. | ||
3.2 Strontium doping effects on oxide-ion conductivity
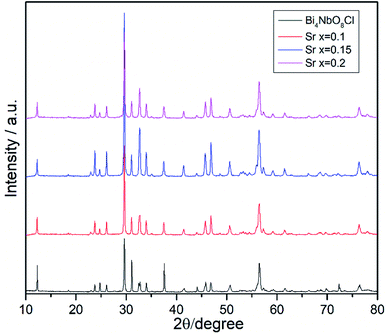
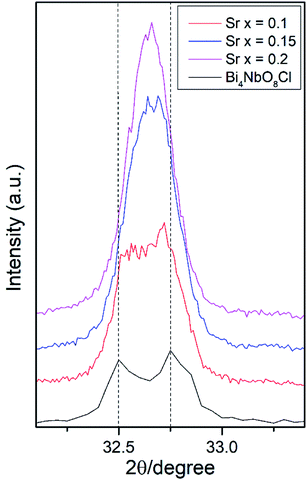
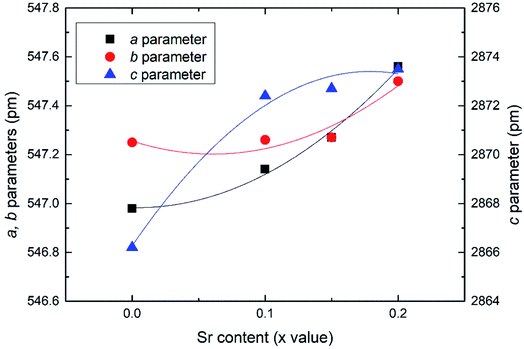
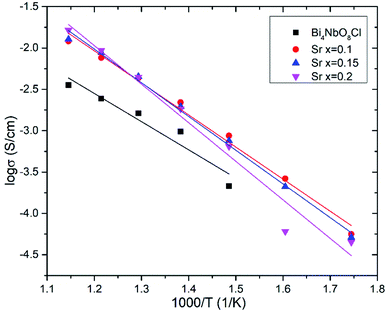
Effects of the Sr2+ doping amount on both the crystal structure and electrical conductivity were studied, i.e., Bi4−xSrxNbO8−δCl (x = 0, 0.1, 0.15, 0.2). Fig. 4 shows XRD patterns of Bi4−xSrxNbO8−δCl (x = 0, 0.1, 0.15, 0.2). No new peaks that could be attributed to impurities or a secondary phase were detected upon doping Sr up to x = 0.2, however introducing Sr above x = 0.1 had a negative impact on sample stability, to the point that the sample with the doping amount x = 0.2 decomposed after prolonged exposure to a gaseous atmosphere with an oxygen content of around log(PO2/atm) = −10. Due to this instability, samples with a higher amount of Sr doping were not prepared even though no secondary phase was observed up to x = 0.2. From this result, it seems that a solubility limit of Sr exists at a further increase in the concentration. Fig. 5 shows the narrow scan results of the XRD peak at around 2θ = 33°. The broad peak at around 33° due to the 020 index sharpened and strengthened upon increasing the amount of Sr. This suggests that the symmetry of the crystal structure increases. The initial orthorhombic structure changes to a pseudo-tetragonal structure upon increasing the amount of Sr, because the lattice parameter of a is almost the same as b, however, a slight difference was observed. Based on this, we refer to this increased symmetry phase as pseudo-tetragonal in the following part. These changes are reflected in the observed XRD patterns, as two peaks at 2θ = 32.4° and 2θ = 33° merge due to the high symmetry of the pseudo-tetragonal structure. Although the crystal structure slightly changes, the doped Sr2+ may partly substitute for Bi in Bi4NbO8Cl up to x = 0.2. Fig. 6 shows the lattice unit volume of Sr-doped Bi4NbO8Cl as a function of the amount of Sr. The lattice parameters a, b, and c increase in line with an increase in the unit lattice volume. Since Sr2+ is a larger cation than Bi3+, we concluded that Sr2+ successfully substitutes for Bi in Bi4NbO8Cl.The electrical conductivity of Bi4NbO8Cl doped with Sr was also measured with different amounts of Sr. Fig. 7 shows the electrical conductivity of Bi4NbO8Cl doped with different amounts of Sr. In spite of the increased number of oxygen vacancies upon increasing the amount of Sr, the electrical conductivity barely changed. However, an increase in the strontium content above x = 0.1 resulted in an increase in the temperature dependence, i.e., a small increase in the activation energy from 0.70 ± 0.01 eV at x = 0.1 to 0.92 ± 0.07 eV at x = 0.2. This increase in activation energy may be related to a phase change from orthorhombic to pseudo-tetragonal with a higher amount of Sr doping. In general, an increase in the symmetry of the crystal lattice is effective in decreasing the activation energy of the oxide-ion conductivity, however, in the case of Bi4NbO8Cl, the influence of a Cl layer in which the transport of oxide ions may be inhibited because the negatively charged layer seems to be significant results in increased activation energy for oxide-ion transport.
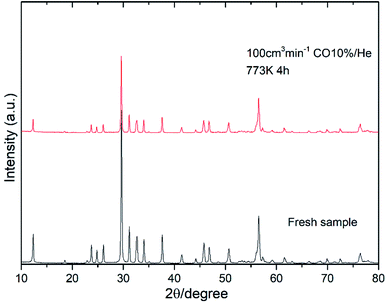
Fig. 8 shows the oxygen partial pressure dependence of the electrical conductivity of Bi4−xSrxNbO8−δCl up to x = 0.2. In the case of non-doped Bi4NbO8Cl, the electrical conductivity decreases with a decrease in PO2, however, it increases again upon a further lowering of the PO2, therefore, partial hole and electron conductivity seem to be observed at high and low PO2. Moreover, the dependency of electrical conductivity on the oxygen partial pressure is low in all samples with Sr doping, and almost independent in the case of Bi3.9Sr0.1NbO8−δCl. The PO2 dependence of this sample was as low as PO2−0.015, and so the dominant charge carrier was the oxide ion. From the increased conductivity at PO2 = 10−19 atm compared with that in air, the partial electronic conduction is estimated to be ca. 15%, so the transport number of oxide ions in the low PO2 range may be around 0.85, and, as discussed later, oxide-ion conductivity increases upon Sr doping, with the introduction of oxygen vacancies. As discussed, the electrical conductivity does not significantly change in a Sr content range of x = 0.1–0.2. Since the number of oxygen vacancies could be increased upon increasing the amount of Sr, the determining step in the oxide-ion conductivity of Bi4NbO8Cl might be the diffusion of oxide ions though the Cl layer, and so, the introduction of oxygen vacancies in the Bi–O and Nb–O layers is simply not effective in increasing the oxide-ion conductivity. The formation of the pseudo-tetragonal phase is another reason for increased oxide-ion conductivity upon the doping of Sr. The stability in the low PO2 region decreased upon an increase in the amount of Sr (see Fig. S3 in the ESI†). A strontium content of x = 0.1 significantly increased the stability of Bi4NbO8Cl. This improved stability of the crystal lattice might be related to the phase change from orthorhombic to pseudo-tetragonal due to an increase in the number of oxygen vacancies. As shown in Fig. 8, electrical conductivity was stably exhibited at a PO2 of down to PO2 = 10−19 atm (under a CO atmosphere), and so compared with Bi-based oxides such as BIMEVOX, Bi4NbO8Cl is highly stable against reduction, which is a great advantage of this oxychloride. This high stability at low PO2 was additionally measured by performing an additional calcination under a flow of 10% CO. XRD patterns of Bi3.9Sr0.1NbO8−δCl before and after calcination at 773 K are shown in Fig. 9. After exposing the sample to 10% CO (He base) gas flow (100 ml min−1) for 4 h (log(PO2/atm) ≈-19), which is a period of around four times longer than that of the conductivity measurements, no decomposition was observed, as no changes in the XRD patterns were observed. The high stability of the compounds under a reducing atmosphere may be assigned to the stabilizing of Bi3+ by chlorine. Considering the PO2 dependence of the electrical conductivity, it seems that oxide-ion conductivity is dominant in Bi4−xSrxNbO8−δCl and that the optimized amount of the Sr dopant is x = 0.1.
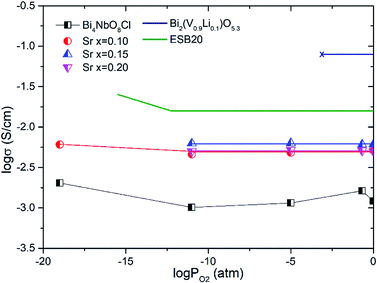 | ||
| Fig. 8 Oxygen partial pressures dependence of the conductivities of Bi4−xSrxNbO8−δCl (0 ≤ x ≤ 0.2) at 773 K. (Bi0.8Er0.2)2O3 (ESB20)26 and Bi2(V0.9Li0.1)O5.3 (ref. 27) are shown for comparison. | ||
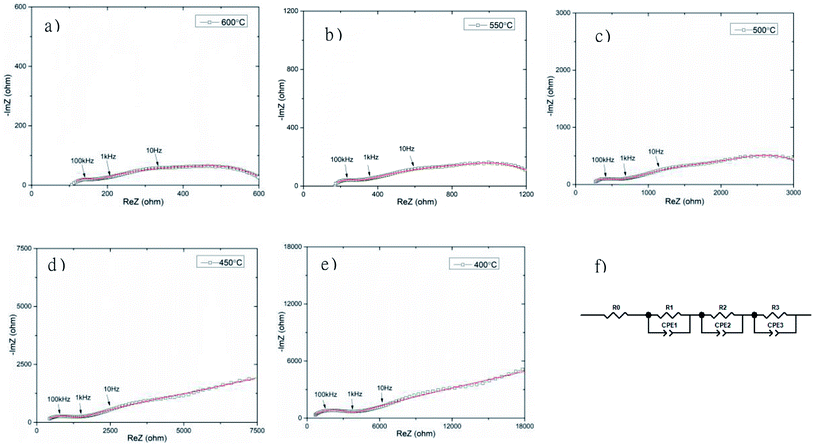
The total electrical conductivity of the Bi3.9Sr0.1NbO8−δCl sample was investigated by carrying out AC impedance measurements in a temperature range from 673 to 873 K, as shown in Fig. 10. Three semi-circles can be observed in the complex impedance plot. Upon a decrease in the temperature, the impedance arc at lower frequency became significantly larger, and at a temperature of lower than 723 K the impedance semi-circle increased with decreasing frequency, with no x-axis intercept at low frequency. Considering the frequency and shape of the impedance, this semi-circle at the lowest frequency was assigned to the electrode process and the two semi-circles at higher frequency were assigned to the grain and the grain boundary resistance. To estimate the grain and grain boundary conductivities, fitting of the equivalent circuit was performed, with the results shown in Fig. 10 (f). As shown in Fig. 10, the fitting results were indicated as solid lines and reasonable fitting of the equivalent circuit from Fig. 10 (f) to the observed impedance spectrum was achieved. The circuit parameter estimated by the fitting of the impedance arcs is summarized in Table S4.† Fitting of the equivalent circuit to the measurement data shows slight deviation, in particular, at low frequency at 673 and 723 K, however, fitting at higher frequency was reasonably achieved. Since ion conductivity is observed at high frequency in impedance plots and electrode-related phenomena at low frequency, deviation in the fitting was observed at low frequency. Therefore, the estimated ionic conductivities of the grain and grain boundary were reliably estimated. Since the impedance arc at low frequency was much larger than that at high frequency, the electrode activity of the Pt electrode was not high enough. In addition, several other semicircles were observed at a temperature of lower than 723 K, which suggests a more complicated electrode reaction occurs at low frequency. Pt exhibits generally good electrode activity, however, it reacts with Bi, therefore reaction at the interface between Bi4NbO8Cl and Pt is thought to occur, and this will be investigated in detail in a future study.
Fig. 11 shows the temperature dependence of the grain (from R2) and grain boundary (from R3) conductivities of Bi3.9Sr0.1NbO8−δCl estimated by fitting the equivalent circuit to the experimental data. In this figure, the total conductivity estimated using the DC 4-probe method is also shown. As expected, the conductivity estimated from the DC 4-probe measurements is almost the same as the grain conductivity estimated from the impedance, except for a slight difference in activation energy. Considering the low activation energy for grain boundary conductivity, this slight deviation between the grain and total conductivities can be explained by the influence in grain boundary conductivity. Considering the PO2 dependency and bulk conductivity estimated from the impedance measurements, the oxide-ion conductivity in Bi3.9Sr0.1NbO8−δCl seems to be dominant and reaches a value of 2.99 × 10⁻² and 3.84 × 10⁻⁴ S cm−1 at 873 and 673 K, respectively.
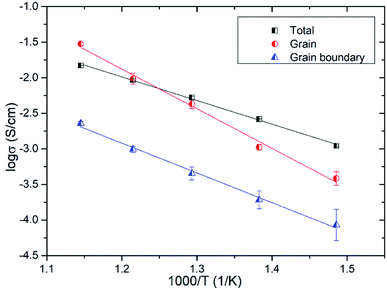 | ||
| Fig. 11 Grain, grain boundary, and total conductivities of Bi3.9Sr0.1NbO8−δCl as a function of temperature. | ||
3.3 Gas concentration cell and tracer diffusion measurements
The oxide ion transference number was estimated using a gas concentration symmetrical cell employing Bi3.9Sr0.1NbO8−δCl disk and La0.6Sr0.5CoO3−δ electrodes in a temperature range from 673 to 873 K. The open-circuit voltage (OCV) of the gas concentration cell of O2/N2 was recorded over a couple of days and is shown in Fig. 12. As shown in Fig. 12, an OCV of the cell of higher than 100 mV was observed, which monotonically increased with temperature. The PO2 in the used N2 was estimated using a YSZ oxygen sensor and the transport number was estimated based on the Nernst equation. The temperature dependence of the transport number of oxide ions in Bi3.9Sr0.1NbO8−δCl estimated is also shown in Fig. 11. At a temperature of higher than 773 K, the estimated transport number was around 90%, however, it decreased slightly with decreasing temperature to 78 and 72% at 723 and 673 K, respectively. Since molten Pyrex glass was used for sealing gas in the apparatus, one reason for this is a small gas leakage as the measurements were performed from high to low temperature, and another reason is insufficient electrode activity. This might be the reason for the decrease in the oxide-ion transport number. From EMF measurements on an oxygen concentration cell, oxide ions seem to be the dominant charge carrier species in Bi3.9Sr0.1NbO8−δCl, and the slight deviation from the theoretical OCV could be assigned to hole conduction being the minor carrier, which was also suggested from the low PO2 dependence in the high PO2 range.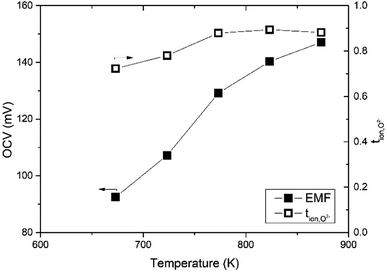 | ||
| Fig. 12 Temperature dependence of the OCV and the transport number of the Bi3.9Sr0.1NbO8−δCl on N2/O2 gas concentration cell. | ||
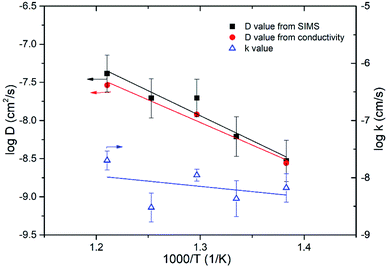
18O tracer diffusion measurements were further performed to confirm dominant oxide-ion conductivity in Bi3.9Sr0.1NbO8−δCl over a temperature range from 823 to 723 K. 18O Diffusion profiles measured with SIMS, as well as their respective fitted results, are shown in Fig. S4 in the ESI.† Diffusion of 18O was confirmed by SIMS and reasonable fitting was achieved. Fig. 12 shows the temperature dependence of the estimated self-diffusion coefficient (D) and surface exchange coefficient (k) values. As shown in Fig. 12, the D value was also calculated from the grain conductivity shown in Fig. 10 using the Nernst–Einstein equation, assuming the correlation factor between the tracer diffusion coefficient and self-diffusion coefficient was 1, and plotted for comparison. The self-diffusion coefficient estimated by tracer diffusion appears to be in good agreement with the bulk conductivity data, while the D value at 723 K is slightly lower than the value estimated from the conductivity. The estimated surface exchange coefficient is also shown in Fig. 13 as a function of temperature. It can be seen that Bi3.9Sr0.1NbO8−δCl shows low surface activity towards oxygen dissociation compared with Fe- or Co-based perovskites, however, comparable to those of LSGM or GDC oxide-ion conductors. It is reported that the surface exchange coefficient (k) of Gd0.1Ce0.9O2 (GDC10) at 723 K is 2.5 × 10⁻⁹ (cm s−1)28 and of LSGM (9182) is 2.5 × 10⁻⁹ (cm s−1) at 798 K.29 The low k value of Bi3.9Sr0.1NbO8−δCl may be related to the small number of free electrons used for charge transfer to achieve oxygen dissociation. Considering the low k value at 723 K, the slightly low diffusion constant D may be explained by the surface limitation of oxygen diffusion. In any case, tracer diffusion measurements confirmed that oxide-ion conductivity is dominant in the Bi3.9Sr0.1NbO8−δCl grain. The activation energy for tracer diffusion was estimated from the slope of the plots in Fig. 11 for comparison. The estimated activation energy for oxygen diffusion was 1.29 ± 0.19 eV for Bi3.9Sr0.1NbO8−δCl, which is close to δ-Bi2O3 (1.30 eV)30 and slightly higher than that of pure Bi2O3 (0.79 eV).30 Therefore, the activation energy of oxygen diffusivity in Bi3.9Sr0.1NbO8−δCl suggests that oxygen diffusion occurs along the [Bi2O2]2+ layers in the Sillén–Aurivillius phase and that a number of oxygen vacancies will be introduced in the Bi2O22+ block upon Sr substitution, resulting in increased oxide-ion conductivity. From this result, it can be said that oxide-ion conductivity will occur along the a–b planes in Bi3.9Sr0.1NbO8−δCl. The diffusion route of oxide ions in Bi3.9Sr0.1NbO8−δCl was further investigated using DFT calculations and also by carrying out neutron diffraction measurements, the results of which will be reported in the future.
Fig. 14 shows the comparison of the oxide-ion conductivity of Bi3.9Sr0.1NbO8−δCl with that of a conventional oxide-ion conductor. As expected, the highest oxide-ion conductivity is achieved for Er-doped Bi2O3, however, it is well-known that this oxide is easily reduced, resulting in its decomposition under a reducing atmosphere. In contrast, Bi3.9Sr0.1NbO8−δCl shows stable oxide-ion conductivity over a wide PO2 range, as shown in Fig. 8, and its conductivity is comparable to that of LSGM, which has a much higher oxide-ion conductivity than that of YSZ. Consequently, this study revealed that the Sillén–Aurivillius phase bismuth niobium oxychloride Bi4NbO8Cl represents a new family of fast oxide-ion conductors.
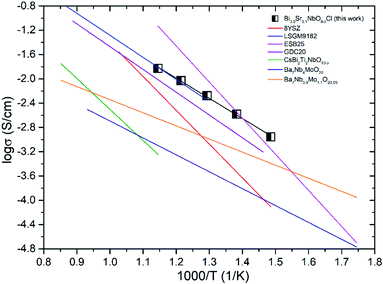 | ||
| Fig. 14 Comparison of the oxide-ion conductivity in Bi-based and typical ion conductors in air (8YSZ,31 LSGM9182,32 Bi2O3,33 GDC20,34 CsBi2Ti2NbO10−δ,12 Ba7Nb4Mo1O20,35 Ba7Nb3.9Mo1.1O20.05 (ref. 36)). | ||
4. Conclusion
Oxide-ion conductivity in Sillén–Aurivillius phase bismuth niobium oxychloride (Bi4NbO8Cl) was studied. Although it is well-known that Bi-based oxides show high oxide-ion conductivity within a narrow PO2 range, it was found that Bi4NbO8Cl shows high and rather stable oxide-ion conductivity over a wide PO2 range (down to 10−19 atm) and that doping of Sr at Bi sites in Bi4NbO8Cl is effective for increasing oxide-ion conductivity among the examined dopants. Optimized oxide-ion conductivity was achieved at x = 0.1 in Bi4−xSrxNbO8−δCl. The predominant conducting species are oxide ions, as determined from AC impedance measurements, EMF measurements on a gas concentration cell, and oxygen tracer oxygen diffusion measurements. Considering the activation energy of the self-diffusion constant and grain conductivity, oxide ions may mainly diffuse along the Bi2O22+ layer and the Cl layer may interrupt the diffusion of oxide ions due to electrostatic repulsion. Therefore, oxide-ion conductivity in Bi4−xSrxNbO8−δCl could be two dimensional, however, the Cl layer in the Sillén–Aurivillius phase may contribute towards the increased stability of the compound under a reducing atmosphere. Consequently, this study reveals that Bi4NbO4Cl represents a new family of oxide-ion conductors and that the oxide-ion conductivity in the Sr-doped sample is comparable to that of LSGM.Conflicts of interest
There are no conflicts to declare.Acknowledgements
Part of this study was financially supported by Grant-in-Aid type A (No. 19H00821) from the Ministry of Education, Culture, Sports, Science and Technology (MEXT), Japan, through the Japan Society for the Promotion of Science (JSPS).References
- E. Ivers-Tiffee, A. Weber and D. Herbstritt, J. Eur. Ceram. Soc., 2001, 21, 1805–1811 CrossRef CAS.
- M. Ni, M. K. H. Leung and D. Y. C. Leung, Int. J. Hydrogen Energy, 2008, 33, 2337–2354 CrossRef CAS.
- P. Jasinski, T. Suzuki and H. U. Anderson, Sens. Actuators, B, 2003, 95, 73–77 CrossRef CAS.
- A. Petric, P. Huang and F. Tietz, Solid State Ionics, 2000, 135, 719–725 CrossRef CAS.
- D. Kuscer, J. Holc, M. Hrovat and D. Kolar, J. Eur. Ceram. Soc., 2001, 21, 1817–1820 CrossRef CAS.
- J. D. Jorgensen, B. Dabrowski, S. Pei, D. R. Richards and D. G. Hinks, Phys. Rev. B: Condens. Matter Mater. Phys., 1989, 40, 2187–2199 CrossRef CAS PubMed.
- T. Ishihara, T. Shibayama, M. Honda, H. Nishiguchi and Y. Takita, Chem. Commun., 1999, 1227–1228 RSC.
- D. W. Strickler and W. G. Carlson, J. Am. Ceram. Soc., 1965, 48, 286–289 CrossRef CAS.
- P. D. Battle, C. R. A. Catlow and L. M. Moroney, J. Solid State Chem., 1987, 67, 42–50 CrossRef CAS.
- B. Scrosati, A. Magistris, C. M. Mari and G. Mariotto, Fast Ion Transport in Solids, Springer, New York, Dordrecht, 1993 Search PubMed.
- O. Joubert, A. Jouanneaux, M. Ganne, R. N. Vannier and G. Mairesse, Solid State Ionics, 1994, 73, 309–318 CrossRef CAS.
- W. Zhang, K. Fujii, E. Niwa, M. Hagihala, T. Kamiyama and M. Yashima, Nat. Commun., 2020, 11, 1224 CrossRef CAS PubMed.
- E. D. Wachsman and K. T. Lee, Science, 2011, 334, 935–939 CrossRef CAS PubMed.
- M. Li, M. J. Pietrowski, R. A. De Souza, H. Zhang, I. M. Reaney, S. N. Cook, J. A. Kilner and D. Sinclair, Nat. Mater., 2014, 13, 31–35 CrossRef CAS PubMed.
- X. Lin, T. Huang, F. Huang, W. Wang and J. Shi, J. Mater. Chem., 2007, 17, 2145–2150 RSC.
- H. Fujito, H. Kunioku, D. Kato, H. Suzuki, M. Higashi, H. Kageyama and R. Abe, J. Am. Chem. Soc., 2016, 138, 2082–2085 CrossRef CAS PubMed.
- L. Wang, M. Gui, H.-B. Jin, X. Hu, Y. Zhao, N. M. Adan and J.-B. Li, J. Adv. Ceram., 2018, 7, 256–265 CrossRef CAS.
- K. R. Kendall, C. Navas, J. K. Thomas and H.-C. zur Loye, Chem. Mater., 1996, 8, 642–649 CrossRef CAS.
- C. K. Lee and A. R. West, Solid State Ionics, 1996, 86–88, 235–239 CrossRef CAS.
- J. F. Ackerman, J. Solid State Chem., 1986, 62, 92–104 CrossRef CAS.
- K. Momma and F. Izumi, J. Appl. Crystallogr., 2011, 44, 1272–1276 CrossRef CAS.
- A. Nakada, A. Saeki, M. Higashi, H. Kageyama and R. Abe, J. Mater. Chem. A, 2018, 6, 10909–10917 RSC.
- T. Akbay, J. A. Kilner, T. Ishihara and C. Atkinson, J. Phys. Chem. C, 2019, 123, 258–264 CrossRef CAS.
- A. M. Kusainova, S. Y. Stefanovich, V. A. Dolgikh, A. V. Mosunov, C. H. Hervoches and P. Lightfoot, J. Mater. Chem., 2001, 11, 1141–1145 RSC.
- R. D. Shannon, Acta Crystallogr., Sect. A: Cryst. Phys., Diffr., Theor. Gen. Crystallogr., 1976, 32, 751–767 CrossRef.
- H. Yamamura, M. Higasa, Y. Yagi and T. Takayama, J. Ceram. Soc. Jpn., 2009, 117(8), 887–890 CrossRef CAS.
- Y. Taninouchi, T. Uda, T. Ichitsubo, Y. Awakura and E. Matsubara, Solid State Ionics, 2010, 181, 719–723 CrossRef CAS.
- K. Kowalski, Defect Diffus. Forum, 2009, 289–292, 769–774 CAS.
- T. Ishihara, J. A. Kilner, M. Honda, N. Sakai, H. Yokokawa and Y. Takita, Solid State Ionics, 1998, 113–115, 593–600 CrossRef CAS.
- H. Cahen, T. Van Den Belt, J. De Wit and G. Broers, Solid State Ionics, 1980, 1, 411–423 CrossRef CAS.
- W. Liu, G. Ou, L. Yao, H. Nishijima and W. Pan, Solid State Ionics, 2017, 308, 34–39 CrossRef CAS.
- T. Ishihara, H. Matsuda and Y. Takita, J. Am. Chem. Soc., 1994, 116, 3801–3803 CrossRef CAS.
- H. Cahen, T. Van Den Belt, J. De Wit and G. Broers, Solid State Ionics, 1980, 1, 411–423 CrossRef CAS.
- H. Arai, T. Kunisaki, Y. Shimizu and T. Seiyama, Solid State Ionics, 1986, 20, 241–248 CrossRef CAS.
- S. Fop, K. S. McCombie, E. J. Wildman, J. M. S Skakle, J. T. S. Irvine, P. A. Connor, C. savaniu, C. Ritter and A. C. Mclaughlin, Nat. Mater., 2020, 19, 752–757 CrossRef CAS PubMed.
- M. Yashima, T. Tsujiguchi, Y. Sakuda, Y. Tasui, Y. Zhou, K. Fujii, S. Torii, T. Kamiyama and S. J. Skinner, Nat. Commun., 2021, 12, 556 CrossRef CAS PubMed.
Footnote |
| † Electronic supplementary information (ESI) available. See DOI: 10.1039/d1ta07335d |
| This journal is © The Royal Society of Chemistry 2022 |

