 Open Access Article
3D-QSAR, molecular docking, and molecular dynamics simulation study of thieno[3,2-b]pyrrole-5-carboxamide derivatives as LSD1 inhibitors†
Yongtao Xu *abc,
Zihao Heabc,
Hongyi Liuabc,
Yifan Chenabc,
Yunlong Gaoabc,
Songjie Zhangabc,
Meiting Wangabc,
Xiaoyuan Lua,
Chang Wanga,
Zongya Zhaoa,
Yan Liua,
Junqiang Zhaoa,
Yi Yua and
Min Yang*abc
aSchool of Biomedical Engineering, Xinxiang Medical University, Xinxiang, Henan 453003, China. E-mail: yxu@xxmu.edu.cn; yangmin@xxmu.edu.cn
bXinxiang Key Laboratory of Biomedical Information Research, Xinxiang, Henan 453003, China
cHenan Engineering Laboratory of Combinatorial Technique for Clinical and Biomedical Big Data, Xinxiang, Henan 453003, China
First published on 18th February 2020
Abstract
Histone Lysine Specific Demethylase 1 (LSD1) is overexpressed in many cancers and becomes a new target for anticancer drugs. In recent years, small molecule inhibitors with various structures targeting LSD1 have been reported. Here we report the binding interaction modes of a series of thieno[3,2-b]pyrrole-5-carboxamide LSD1 inhibitors using molecular docking, and three-dimensional quantitative structure–activity relationships (3D-QSAR). Comparative molecular field analysis (CoMFA q2 = 0.783, r2 = 0.944, rpred2 = 0.851) and comparative molecular similarity indices analysis (CoMSIA q2 = 0.728, r2 = 0.982, rpred2 = 0.814) were used to establish 3D-QSAR models, which had good verification and prediction capabilities. Based on the contour maps and the information of molecular docking, 8 novel small molecules were designed in silico, among which compounds D4, D5 and D8 with high predictive activity were subjected to further molecular dynamics simulations (MD), and their possible binding modes were explored. It was found that Asn535 plays a crucial role in stabilizing the inhibitors. Furthermore, ADME and bioavailability prediction for D4, D5 and D8 were carried out. The results would provide valuable guidance for designing new reversible LSD1 inhibitors in the future.
Introduction
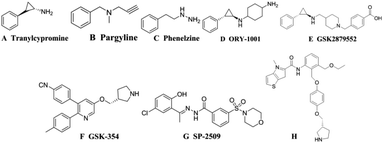
Histone modification is an important epigenetic modification including acetylation, methylation and phosphorylation.1 Gene expression is regulated by controlling the conformational transformation of chromosomes between heterochromatin with transcriptional inhibition and euchromatin with transcriptional activation.2 Histone methylation was considered to be an irreversible process until the discovery of LSD1 (also known as KDM1A) in 2004, revealing that histone methylation was a dynamically reversible process.3 LSD1 is a highly conserved flavin adenine dinucleotide (FAD) dependent amine oxidase that can specifically remove the single-dimethylation of histone lysine H3K4 and H3K9.4 LSD1 can also remove the methyl of many proteins, such as p53, DNA methyltransferase 1 (DNMT1), signal transducer and activator of transcription 3 (STAT3), E2F transcription factor 1 and so on, thereby regulating the physiological functions of downstream cell.5–9 Studies have shown that LSD1 is highly expressed in a variety of tumor cells, for example breast cancer, neuroblastoma, lung cancer, gastric cancer, acute myeloid leukemia and so on.10–14 It has been shown in many animal experiments that the use of small-molecule inhibitors to inhibit the expression of LSD1 can effectively inhibit the differentiation, proliferation, invasion and metastasis of cancer cells, as well as the growth of tumors.15–17 These studies indicated that LSD1 not only had important biological significance, but also provided a new method for cancer treatment with LSD1 small molecule inhibitors.The research on LSD1 inhibitors has attracted increasing interest since the discovery of LSD1. As a member of the monoamine oxidase (MAO) family, LSD1 has high sequences similarity with homologous protein MAOs, so MAO inhibitors can be used to inhibit the activity of LSD1.18 MAO inhibitors such as tranylcypromine (TCPA, Fig. 1A), pargyline (Fig. 1B), phenelzine (Fig. 1C) have low inhibitory activity and poor selectivity for LSD1, but a series of high activity and high selective inhibitors have been optimized or designed based on them.19 Among the TCPA-based series inhibitors, ORY-1001 (Fig. 1D) entered phase II clinical trials about acute myelogenous leukemia (AML) in 2013. GSK2879552 (Fig. 1E) also entered I period clinical used in the treatment of relapsed or refractory small cell lung cancer (SCLC).20,21 In addition to these irreversible inhibitors covalently bound with FAD, some reversible inhibitors with non-covalently bound were also designed. The IC50 of the reversible inhibitor GSK-354 (Fig. 1F) reached 90 nM.22 SP-2509 (Fig. 1G) was highly active and selective, and its IC50 value in vitro reached 13 nM.23 In 2017, thieno[3,2-b]pyrrop-5-carboxamides (Fig. 1H) class reversible inhibitors were reported. The highest IC50 value of these compounds was 7.8 nM, which displayed a remarkable effect on MLL-AF9 human leukemia cell.24,25
LSD1 has great potential in the research and development of anti-cancer drugs, and the design of LSD1 with high efficiency and selectivity has become the research goal of drug workers. At present, irreversible LSD1 inhibitors have been introduced into clinical trials. However, despite the good LSD1 inhibitory activity they have shown, there are still many defects: potential selectivity to MAO, strong side effects, and difficult synthesis. Reversible inhibitors have strong selectivity and small side effects, but no reversible inhibitors have entered clinical trials. Therefore, the design of highly effective reversible LSD1 inhibitors has become the focus of research in recent years.
In vitro activity determination of small molecule inhibitors is time-consuming and costly. The computer-aided drug design (CADD) can not only preliminarily predict the activity of inhibitors, but also save experimental costs and provide a guidance for designing more effective inhibitors by exploring the reaction mechanism of inhibitors at the molecular level.26 A series of 1,2,4-triazine derivatives as new h-HAAO inhibitors using 3D-QSAR, docking and MD and three of these inhibitors were tested in silico associated with relatively high activities.27 The 3D-QSAR method was also used to explain flavonoids inhibitors for Escherichia coli, and molecular docking was performed to predict the binding mode.28 Ma et al. analyzed pyrazolo[3,4-d]pyrimidine derivatives as the TgCDPK1 inhibitors using the 3D-QSAR, docking, dynamics simulation, and then designed some new inhibitors.29 Therefore, the application of CADD methods into the research of LSD1 inhibitors should be efficient for designing new and highly active LSD1 inhibitors.
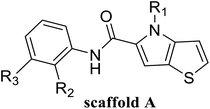
In this study, 55 small molecules were selected from a series of thieno[3,2-b]pyrrop-5-carboxamide (Fig. 1H) compounds.24,25 The crystal structures of five small molecules with LSD1 have been reported, but the binding modes of the remaining 50 small molecules with LSD1 were still uncertain. In order to explain the structure–activity relationship and explore the possible optimization direction for such inhibitors, the 3D-QSAR model was developed based on the docking poses. Contour maps could provide theoretical guidance for designing new inhibitors. According to the molecular docking results and contour maps, 8 new molecule inhibitors with high predictive activity were designed. The binding modes of 3 new molecule inhibitors with the highest activity were explored by molecular docking and molecular dynamics simulations. The present research would provide valuable guidance for the design of new LSD1 inhibitors.
Materials and methods
Data sets
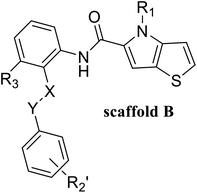
55 compounds that were previously assessed for their LSD1 inhibition activities were used as the data set (Table 1).24,25 These compounds share a common thieno[3,2-b]pyrrop-5-carboxamide scaffold and introducing a substituted chiral pyrrolidine group at the R2 position of the parent scaffold resulted in significantly improved activities, i.e. 51, 54 and 55. CoMFA30 and CoMSIA31 were used to establish 3D-QSAR models. In these two models, different molecular properties were used as independent variables to calculate the relationship between their structure and biological activities, while pIC50 (−log![[thin space (1/6-em)]](https://www.rsc.org/images/entities/char_2009.gif) IC50) was also used as the dependent variable. The range of pIC50 values was from 4.046 to 8.174 in all data sets. The data set was partitioned randomly with the following criteria: the pIC50 values of the compounds in the test set should be distributed in various orders of magnitude in proportion to the whole set. At the same time, the structures of the compounds in the test set should sufficiently represent the diversity of the whole dataset. Finally, 43 compounds (78% of total compounds) were selected as the training set for the construction of CoMFA and CoMSIA models, and the remaining 12 compounds (22% of total compounds) were selected as an independent test set for validating the reliability of the model. The distribution of pIC50 values for the whole set, the training set and test set were shown in Fig. S1.† The structures and activity data of all compounds are shown in Table 1.
IC50) was also used as the dependent variable. The range of pIC50 values was from 4.046 to 8.174 in all data sets. The data set was partitioned randomly with the following criteria: the pIC50 values of the compounds in the test set should be distributed in various orders of magnitude in proportion to the whole set. At the same time, the structures of the compounds in the test set should sufficiently represent the diversity of the whole dataset. Finally, 43 compounds (78% of total compounds) were selected as the training set for the construction of CoMFA and CoMSIA models, and the remaining 12 compounds (22% of total compounds) were selected as an independent test set for validating the reliability of the model. The distribution of pIC50 values for the whole set, the training set and test set were shown in Fig. S1.† The structures and activity data of all compounds are shown in Table 1.
| No. | R1 | R2 | R3 | IC50 (μM μM) | pIC50 | CoMFA | CoMSIA | ||
|---|---|---|---|---|---|---|---|---|---|
| Pred. | Res. | Pred. | Res. | ||||||
| a Pred. = predicted pIC50; Res. = residual; o- = ortho-, m- = meta-, p- = para-; * compounds in test set. | |||||||||
| 1* | CH3 | H | H | 25.7 | 4.590 | 4.325 | 0.27 | 4.518 | 0.07 |
| 4 | Et | H | H | 9.3 | 5.032 | 4.401 | 0.63 | 4.607 | 0.42 |
| 5 | –CH2CH2NH2 | H | H | 48.1 | 4.318 | 4.075 | 0.24 | 4.434 | −0.12 |
| 6* | Pr | H | H | 53.2 | 4.274 | 4.274 | 0.00 | 4.633 | −0.36 |
| 7 | CH3 | H | –Cl | 18.7 | 4.728 | 4.545 | 0.18 | 4.509 | 0.22 |
| 8 | CH3 | H |  |
21.5 | 4.668 | 4.850 | −0.18 | 4.753 | −0.08 |
| 9 | CH3 | H | –F | 22.2 | 4.654 | 4.439 | 0.21 | 4.526 | 0.13 |
| 10 | CH3 | H | –OCH3 | 26.5 | 4.577 | 4.611 | −0.03 | 4.637 | −0.06 |
| 11 | CH3 | H | –N(Me)2 | 29.6 | 4.529 | 4.781 | −0.25 | 4.662 | −0.13 |
| 12* | CH3 | H | –CONH2 | 97.3 | 4.012 | 4.604 | −0.59 | 4.601 | −0.59 |
| 13 | CH3 | H |  |
2.2 | 5.658 | 5.440 | 0.22 | 5.702 | −0.04 |
| 14 | CH3 | H | –CH2SMe | 7.4 | 5.131 | 4.892 | 0.24 | 4.855 | 0.28 |
| 15* | CH3 | H |  |
11.1 | 4.955 | 4.704 | 0.25 | 4.804 | 0.15 |
| 16 | CH3 | H | –CH2OMe | 13.4 | 4.873 | 4.786 | 0.09 | 4.854 | 0.02 |
| 17 | CH3 | H | –CH2N(Me)2 | 16.7 | 4.777 | 4.415 | 0.36 | 4.748 | 0.03 |
| 18 | CH3 | H |  |
25.2 | 4.599 | 4.745 | −0.15 | 4.607 | −0.01 |
| 19 | CH3 | H | –CH2OH | 52.3 | 4.281 | 4.701 | −0.42 | 4.569 | −0.29 |
| 20* | CH3 | H |  |
7.2 | 5.143 | 4.687 | 0.46 | 4.258 | 0.88 |
| 21 | CH3 | H |  |
9.4 | 5.027 | 4.765 | 0.26 | 4.903 | 0.12 |
| 22 | CH3 | H |  |
89.9 | 4.046 | 4.605 | −0.56 | 4.252 | −0.21 |
| 23 | CH3 | H |  |
0.162 | 6.790 | 7.090 | −0.30 | 6.735 | 0.05 |
| 24 | CH3 | H |  |
0.442 | 6.355 | 6.567 | −0.21 | 6.386 | −0.03 |
Molecular docking
Molecular docking and the establishment of CoMFA and CoMSIA models were completed in SYBYL-X2.0 (2.0, Tripos International, St. Louis, MS, USA). The 3D structures of 55 small molecules were obtained in the sketch module. Energy minimization was performed using Powell gradient algorithm with a maximum of 1000 iterations, the convergence criterion was limited to 0.001 kcal mol−1 Å−1. All compounds were calculated by Gasteiger–Huckel charges using the Tripos force field. The top-scored docked poses are not always the most reasonable pose for the specific system. Therefore, we selected the docked poses based on the docking scores as well as empirical criteria Essential Chemical Interactions Described for Analogue Ligands (ECIDALs),32 which is defined from previous literature or crystal structure. The reported crystal structures of LSD1 in complex with 5 ligands (compounds 25, 16, 36, 54 and 55 in Table 1) were obtained from Protein Data Bank (PDB codes: 5LGT, 5LGN, 5LGU, 5LHH and 5LHI). Complex (PDB codes: 5LHH) with the highest ligand activity was used for all 55 compounds molecular docking. The docked poses were selected consistent with orientation retrieved from ECIDALs. Crystal water, metal ions and the original ligand were removed and hydrogen atoms were added before molecular docking. Each small molecule produced 20 docking poses, and the optimal pose was selected for further study by combining ECIDALs and docking scores.Molecular alignment
The quality of molecular alignment was considered as a key factor for the robustness and predictive power of CoMFA and CoMSIA models.33 There are three major approaches to alignment based on common skeletal alignment, pharmacophore alignment and molecular docking alignment, respectively. Both of the former two methods could not reflect the ligand–receptor binding mode correctly. So we chose molecular docking alignment to build 3D-QSAR Models, the optimal docking poses of each small molecule were saved and used in the establishment of the QSAR model. The alignment result of all molecules docking-based pose was shown in Fig. 2.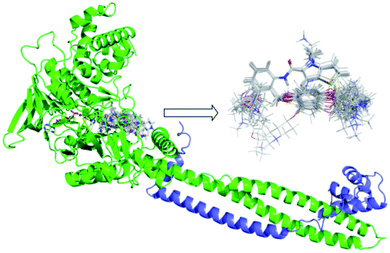 | ||
| Fig. 2 Docking results of small molecules in the active pocket and the alignment based on docking conformation for all ligands. FAD was shown in yellow and Corest was shown in blue. | ||
The alignment results of 43 training set compounds based on docking conformation are shown in Fig. S2.†
3D-QSAR studies
In CoMFA analysis, the steric field and electrostatic field were calculated by Lennard Jones and coulombic potential functions respectively. In the calculation process, the compound was placed in the spatial grids, which consists of many grids with a side length of 2 Å. In this space sp3 hybridised carbon atom is used as probe particle to calculate the structural characteristics of compound. The van der Waals radius of the probe particle was 1.52 Å and the net charge was +1.0. The energy cut-off value was set to 30 kcal mol−1 and the default value was adopted for other parameters.34 For CoMSIA, in addition to calculating the steric field and electrostatic field parameters, hydrophobic field, hydrogen bond acceptor field and hydrogen bond donor field parameters were also calculated. Therefore, for the probe particle, in addition to the van der Waals radius of 1.52 Å and the net charge of +1.0, while hydrophobic parameters, hydrogen bond acceptor parameters and hydrogen bond donor parameters also should be set to +1 for calculating the compound characteristics.35 The attenuation coefficient was set to 0.3 in default. In the CoMSIA model, Gaussian functions were used to determine the distance between molecule atoms and probe atoms.36The partial least square (PLS) method was used to analyze CoMFA and CoMSIA models. Cross-validation analysis was carried out with lease-one-out (LOO) to obtain the cross-validation coefficient q2 and the optimal number of components (ONC).37 The cross-validation coefficient q2 could be get as follows:38
 | (1) |
In the formula, PRESS represents the sum of the squares of the difference between the predicted and the actual pIC50 values and PRESS0 is the actual pIC50 value. The non-cross-validated correlation coefficient (r2), F-statistic values (F), standard error of estimate (SEE) and contributions of each field were calculated.39 The predictive correlation coefficient (rpred2) value could be obtained to measure the predictive capability of the 3D-QSAR models. It can be obtained by the formula:40
 | (2) |
In the formula, SD is the sum of the squared deviations between the pIC50 values in the test set and mean pIC50 in training set; PRESS stands for the sum of squared deviations between predicted pIC50 values and actual pIC50 values in the test set.
In order to further evaluate the true predictive abilities, external validation parameters R2, k, k′, R02,  rm2 need to be calculated. R2 is the correlation coefficient between the observed and predicted activities in the test set with the (0, 0) intercept. R02 and k are the correlation coefficient between the experimental (x) versus predicted activities (y) for the test set through origin and the corresponding slope of regression line.
  and k′ are the correlation coefficients between the predicted (y) versus experimental activities (x) for the test set through origin and the corresponding slope of regression line. The calculation formulas are as follows:41
 | (3) |
 | (4) |
 | (5) |
 | (6) |
 | (7) |
 | (8) |
Among them, Yobs and Ypred represent the experimental and predicted activities in the test set,  and
and  are the average value of the experimental or predicted activities in the test set.
The model is acceptable if the parameters in the 3D-QSAR model meet the following criteria:42
| q2 > 0.5 |
| rpred2 > 0.6 |
| 0.85 ≤ k ≤ 1.15 or 0.85 ≤ k′ ≤ 1.15 |
| rm2 > 0.5 |
Y-randomization test is usually used to evaluate the robustness of the model.43 The dependent variable y is randomly shuffled while the independent variable x matrix is kept unaltered. The process is repeated many times and for each run, a set of new q2 and r2 is generated. If the q2 and r2 of the models are low, it indicates the good calibration result is not due to chance correlation and the QSAR model is robust.
Molecular dynamics simulations
In order to prove the reliability of the docking results, the binding mode between the series of compounds and LSD1 protein need to be further investigated, and molecular dynamics simulation was carried out using AMBER14 software package. Using the docking results of ligands with LSD1 as the initial conformation, the parameter file of ligands was generated by Antechamber module. Amberff10 force field was used for receptor protein and GAFF force field was used for ligand molecules.44 The water box adopted TIP3P water model with a margin distance of 8 Å. After energy minimization, the complex was heated from 0 K to 300 K during 250 ps in NVT ensemble, the constant pressure of 1 atm was equilibrated at 300 K for another 50 ps. Finally, for compound 54 and newly designed compounds with high predictive activity, 50 ns MD was performed under NPT ensemble with the pressure of 1 atm and 300 K. 5000 frames were extracted the average conformation of MD equilibrium phase (the last 5 ns) for analysis as the result of MD.Binding free energy calculations
MM/GBSA method was used to calculate binding free energy. 200 snapshots were received from the last 2 ns trajectory file for calculation. The binding free energy formula for protein and ligand were as follows:27| ΔGbind = ΔGcomplex − ΔGprotein − ΔGligand = ΔEMM + ΔGsol − TΔS = ΔEvdW + ΔEele + ΔGGB + ΔGSA − TΔS |
In the formula, ΔGcomplex represents the total free energy of protein–ligand complex, ΔGprotein is the total binding energy of protein in solvents and ΔGligand means the total binding energy of ligand in solvents. ΔEMM is the interaction energy of protein and ligand under gas-phase, and the energy could be obtained by calculating van der Waals energy ΔEvdW and electrostatic energy ΔEele. ΔGsol stands for the free energy of solvation, which could be achieved by computing polar solvation energy ΔGGB and non-polar solvation energy ΔGSA. TΔS stands for entropy contribution, which is generally ignored, because it consumes a large amount of computing resources and has a weak impact on the results. After calculating the binding free energy, we decomposed the energy onto each residue to obtain the key amino acids which have a great impact on it.
Prediction of ADME and bioavailability
Nowadays, the speed of drug research and development is accelerating, and the number of candidate compounds is increasing. It would waste a lot of resources to put them into experiments directly. Therefore, it is necessary to use computational modeling methods to evaluate their bioavailability and pharmacokinetics. SwissADME web tool (http://www.swissadme.ch.) was used to predict our new LSD1 inhibitors.45Bioavailability evaluation includes the following aspects: lipophilicity, molecular weight, polarity, saturation. The absorption, distribution, metabolism and excretion (ADME) evaluation includes: human gastrointestinal absorption (HIA), blood–brain barrier (BBB) permeation, cytochrome P450-3A4 (CYP3A4) enzyme inhibition and skin permeation (log![[thin space (1/6-em)]](https://www.rsc.org/images/entities/char_2009.gif) Kp). Finally, drug-likeness evaluation of our new compounds was conducted according to Lipinski's rule.46
Kp). Finally, drug-likeness evaluation of our new compounds was conducted according to Lipinski's rule.46
Results and discussion
Validation of docking reliability
Both 3D-QSAR modeling and MD were based on the results of molecular docking, so it was necessary to verify the reliability of docking results: the structures of five compounds 16, 25, 36, 54 and 55 from the docking results, and the crystal structures of those compounds were received from protein data bank (PDB code: 5LGN, 5LGT, 5LGU, 5LHH and 5LHI, respectively). The docking pose of five compounds and their corresponding crystal poses were superimposed, and it can be seen that the crystal pose and the docked pose were almost in the same position, having similar spatial orientations (Fig. S3†), with the RMSDs being 0.78 Å, 1.13 Å, 0.62 Å, 0.69 Å and 1.07 Å, respectively. The result suggested that the docking result was reasonable and could be used for further simulation and analysis. The docked posed were selected by the criteria of ECIDALs. The 5 crystal structures were superposed, and it was found that thieno[3,2-b]pyrrop-5-carboxamide structures almost overlapped in the same position (Fig. 3), those features were defined as the ECIDALs of the small molecules that share similar scaffold.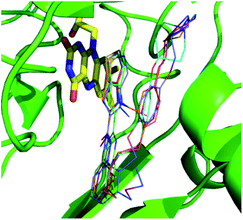 | ||
| Fig. 3 Superimposing of the ligands from 5 LSD1 crystal structures (PDB: 5LGT (cyan), 5LGN (green), 5LGU (violet), 5LHH (orange) and 5LHI (blue)). FAD is represented by yellow stick, small molecules by line, and protein by green cartoon. | ||
Statistical results of CoMFA and CoMSIA
The stepwise development of CoMFA and possible CoMSIA models using different fields were presented in Table 2.47 The internal prediction ability (q2) and the external prediction ability (rpred2) were important criteria for measuring the QSAR mode.40 CoMFA-S and CoMFA-E were separately modeled using steric field and electrostatic field, and their q2 values were acceptable, the rpred2 of CoMFA-S was also acceptable, but the rpred2 < 0.6 in CoMFA-E indicated that the external prediction ability of the model did not up to the standard. When combined to CoMFA-SE, both q2 and rpred2 improved. The result of CoMFA-SE model gave a cross-validated q2 of 0.783 with an ONC value of 4, a non-cross-validated r2 of 0.944, a predictive correlation coefficient rpred2 of 0.851, a SEE value of 0.3, and an F value of 160.128. The contribution of the steric field was 39.4% and 60.6% belonged to electrostatic field.| q2 | ONC | r2 | rpred2 | SEE | F value | Contributions | |||||
|---|---|---|---|---|---|---|---|---|---|---|---|
| S | E | H | A | D | |||||||
| CoMFA-S | 0.682 | 3 | 0.928 | 0.740 | 0.335 | 168.134 | 1 | — | — | — | — |
| CoMFA-E | 0.688 | 5 | 0.945 | 0.574 | 0.301 | 127.014 | — | 1 | — | — | — |
| CoMFA-SE | 0.783 | 4 | 0.944 | 0.851 | 0.3 | 160.128 | 0.394 | 0.606 | — | — | — |
| CoMSIA-EHDA | 0.717 | 6 | 0.989 | 0.812 | 0.135 | 552.841 | — | 0.341 | 0.219 | 0.141 | 0.3 |
| CoMSIA-SHDA | 0.724 | 3 | 0.958 | 0.811 | 0.257 | 295.325 | 0.242 | — | 0.259 | 0.142 | 0.357 |
| CoMSIA-SEDA | 0.721 | 4 | 0.972 | 0.791 | 0.213 | 325.942 | 0.201 | 0.365 | — | 0.129 | 0.305 |
| CoMSIA-SEHD | 0.722 | 3 | 0.942 | 0.807 | 0.302 | 209.989 | 0.179 | 0.356 | 0.197 | — | 0.268 |
| CoMSIA-SEHA | 0.727 | 2 | 0.977 | 0.785 | 0.194 | 309.365 | 0.182 | 0.417 | 0.244 | 0.156 | — |
| CoMSIA-ALL | 0.728 | 5 | 0.982 | 0.814 | 0.170 | 412.470 | 0.144 | 0.292 | 0.179 | 0.125 | 0.259 |
The CoMSIA-SEHA and CoMSIA-ALL models generated similar q2 (0.727 and 0.728, respectively). However, the rpred2 of CoMSIA-ALL was higher than that of CoMSIA-SEHA (0.814 and 0.785, respectively), so we choose CoMSIA-ALL model with stronger external prediction ability as the final CoMSIA model. CoMSIA-ALL model had the highest cross-validated q2 of 0.728 with an ONC value of 5, non-cross-validated r2 of 0.982, the highest predictive correlation coefficient rpred2 of 0.814, a SEE value was 0.170, and an F value was 412.470. The contributions of steric, electrostatic, hydrophobic, H-donor, and acceptor field were 14.4%, 29.2%, 17.9%, 25.9% and 12.5%, respectively. The result illustrated that the electrostatic, H-bond donor and hydrophobic fields played important roles in the model. And among these three fields, the electrostatic field was the most important interaction between the ligand and the receptor protein.
Table 3 showed the results of external validation of the CoMFA-SE and CoMSIA-ALL models (hereinafter, CoMFA-SE was called CoMFA and CoMSIA-ALL was called CoMSIA). Although both CoMFA and CoMSIA models had good rpred2 values, however, according to Tropsha,48 only high rpred2 did not show the true predictive ability of the model, only when the model satisfied condition 1, condition 2a or 2b, condition 3a or 3b, condition 4a or 4b, condition 5 and condition 6, the models had good external prediction ability. It could be seen from the Table 3 that the parameters of CoMFA and CoMSIA models satisfied all above requirements. Among them, rm2 was an important indicator to measure the approximation between experimental activity and predicted activity in the test set.
In addition, the results of 10 random shuffles for Y-randomization test were shown in Table 4. These results were obtained by using the dependent variable (biological activity) randomly shuffled and then using the original independent variable matrix to build new QSAR models. The q2 and r2 values of new QSAR models were really low. Therefore, the possibility of random correlations was ruled out. The randomly arranged bioactivities used for the test were shown in Table S1.†
| CoMFA | CoMSIA | |||
|---|---|---|---|---|
| Iteration | q2 | r2 | q2 | r2 |
| Random_1 | 0.001 | 0.152 | −0.012 | 0.235 |
| Random_2 | −0.181 | 0.268 | −0.225 | 0.445 |
| Random_3 | −0.097 | 0.105 | −0.242 | 0.34 |
| Random_4 | 0.237 | 0.345 | 0.219 | 0.373 |
| Random_5 | 0.29 | 0.309 | 0.264 | 0.424 |
| Random_6 | 0.175 | 0.304 | 0.216 | 0.359 |
| Random_7 | 0.05 | 0.189 | 0.082 | 0.271 |
| Random_8 | −0.036 | 0.217 | 0.015 | 0.408 |
| Random_9 | 0.166 | 0.283 | 0.176 | 0.337 |
| Random_10 | −0.031 | 0.134 | −0.062 | 0.283 |
The predicted activities of small molecules in the 3D-QSAR model are shown in Table 1. The plots of actual pIC50 against predicted pIC50 by the CoMFA and CoMSIA model are shown in Fig. 4, it can be seen that the black solid point and the red solid point were close to the line Y = X, which indicated that the actual and predicted activities of the whole data set had a strong linear relationship. The Y value of the hollow circle represented leave-one-out (LOO) cross-validated predictions.
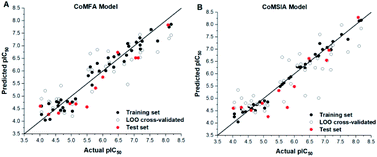 | ||
| Fig. 4 Plots of experimental activities against predicted activities by the optimal of CoMFA model (A) and CoMSIA model (B). Hollow circle indicated a scatter plot of LOO cross-validated. | ||
CoMFA contour maps
The contour maps were provided to explain the relationship between the structures and activities of compounds. The modification of small molecules according to the information given by the contour maps would be conducive to the improvement of the activity of small molecules. The contour maps were shown by StDev*Coeff type and the most active compound 54 was put into the contour maps as a reference for the explanation. The structure of compound 54 was shown in Fig. 5A.Fig. 5B was the contour map of the CoMFA steric field. The green block means that the bulky groups were beneficial for activity, while the yellow block means the bulky groups were disfavored. Around R3 of compound 54, there was a green contour, indicating that increasing the volume at R3 was conducive to improve the activity. For example, compound 13 (pIC50 = 5.658) and 20 (pIC50 = 5.143) introduced medium-sized substituents in R3, and their activity improved compared with compound 1 (pIC50 = 4.59, R3 = H). There was a green contour at N33 of compound 54, illustrating substituent R2 length increases to  appropriately, which was beneficial for the improvement of the activity. For example, the activities of compounds 26 (pIC50 = 7.046) and 36 (pIC50 = 7.745) were greater than compounds with no substituent at R2 such as compounds 1 (pIC50 = 4.59). R2 of compound 31 (pIC50 = 5.824) had substituent, but it did not reach the green block at N33 in Fig. 5B, so its activity was not significantly improved. A yellow contour appeared near the R1, indicating that the bulky volume at R1 was not conducive to the activity, such as the activities arrangement of 6 (pIC50 = 4.274, R1 = Pr) < 5 (pIC50 = 4.318, R1 = CH2CH2NH2) < 4 (pIC50 = 5.032, R1 = Et). Another large yellow contour appeared below hydroquinone in compound 54, indicating that increasing the volume here was not useful for the improvement of activity. Such as
  on ortho substitution of the benzene of compound 28 (pIC50 = 4.166) touched the yellow color contour,
  on of meta substitution of the benzene of compound 27 (pIC50 = 6) also contacted the yellow color contour, therefore compounds 27 and 28 reduced significantly in activity.
The contour map of the CoMFA electrostatic field was shown in Fig. 5C. The red block means that the electronegative groups were beneficial for activity, while the blue block means the electropositive groups were favorable. There were two red contours around O22 and O29 in Fig. 5C, which indicated that the addition of electronegative group can improve the activity. For example, the activity of compound 26 (pIC50 = 7.046) was higher than compound 29 (pIC50 = 6.752), because the oxygen atom was at the Y of compound 26 and the carbon atom was at the Y of compound 29. For 31 (pIC50 = 5.824) and 34 (pIC50 = 5.602) compounds, the electronegativity of  substituents was weak, but they touched the O29 in red color contour, so the activities of these compounds were weaker. The presence of red contour around O19 indicated that R3 should replace group with strong electronegativity, such as compound 7 (pIC50 = 4.728, R3 = Cl) and 9 (pIC50 = 4.654, R3 = F), which were more active than compound 1 (pIC50 = 4.59, R3 = H). Blue color block appeared at N33 illustrated that the increase of electropositive at
  was beneficial for activity. The compounds 54 (pIC50 = 8.174) and 55 (pIC50 = 8.108) with the electropositive group at
  were the most active in all series of compounds.
CoMSIA contour maps
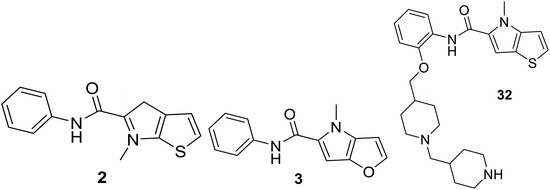
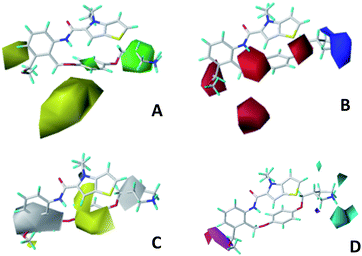
Fig. 6A and B were respectively contour maps of the steric field and electrostatic field of the CoMSIA model, which conclusion were consistent with CoMFA model. For example, in the steric field, a green contour appeared at the C23 and C31 position of molecule 54, which also expressed the need to increase the length of R2. Fig. 6C was the contour map of the hydrophobic field. The yellow block means that the hydrophobic groups were beneficial for activity, while the white block means the hydrophilic groups were favorable.A large yellow block was around C23 and C26 of compound 54, illustrating that improving the hydrophobicity of the intermediate part of R2 would be conducive to activity. For example, in the middle part of R2, compound 32 (pIC50 = 5.57) was piperidine, while compound 29 (pIC50 = 6.752) was benzene. Benzene was more hydrophobic than piperidine, so the activity of compound 29 was greater than 32. A small piece of white color in  demonstrated that adding hydrophilic group was beneficial for activity,
  of 50 (pIC50 = 7.18) and 51 (pIC50 = 8.076) were replaced by piperidine and pyrrolidine, respectively, so they had high activity. There was also a white contour around C14, indicating that increasing the hydrophilicity of R3 could improve the activity. R3 of compound 18 (pIC50 = 4.599) contained benzene, so the reason for its low activity could be explained. The R3 of 7 (pIC50 = 4.728, R3 = Cl) and 9 (pIC50 = 4.654, R3 = F) were hydrophobic halogens, so their activities were not high. Contour maps of H-bond donor and acceptor are shown in Fig. 6D, the cyan contour represented that adding H-bond donor groups was beneficial for activity and the purple contour represented that H-bond donor groups were unfavorable, the magenta color contour expressed H-bond acceptor groups had a positive effect in activity and the red color contour implied H-bond acceptor groups had a negative impact in activity. A large cyan contour appeared at N33 of compound 54, indicating that the addition of H-bond donor group here would increase the activity. The docking results also showed that compound 54 formed a hydrogen bond with Asp555 of LSD1.
  of 39 (pIC50 = 6.827) had piperidine as a hydrogen bond donor, and
  end of 41 (pIC50 = 6.346) was ethyl, therefore the activity of 39 was higher than 41. The magenta contour appeared around C20, indicating that the introduction of hydrogen bond acceptor group in R3 would improve the activity, such as 16 (pIC50 = 4.873, R3 = CH2OMe) > 1 (pIC50 = 4.59, R3 = H).
There was no outlier in the CoMFA model, but in the CoMSIA model, the activity of compound 32 was underestimated and became an outlier, which was also the reason why the rpred2 value of the CoMFA model was high. The structure of compound 32 was different from analog 54 (the most active compound in the series). The bulky substituent composed of two rotatable rings at R2 in compound 32 may allow the distal ring to reach the additional area of the binding pocket, and therefore inducing different binding and modes of actions. As for the reason of inaccurate prediction, the R2 of 32 was extended and touched the green color block in Fig. 6B from the steric field analysis, which were beneficial for the predictive value for compound 32 activity. As shown in Fig. 6C, a red color block appeared at O29, indicating that the introducing of electronegativity atoms was beneficial for activity, whereas carbon atom at the position of compound 32 had weak electronegativity, which had a negative impact on the predicted activity of compound 32. From the hydrophobic field analysis, the larger yellow color block in Fig. 6C showed that if the hydrophobic group was located here, the activity would be improved, but the piperidine of 32 did not satisfy this condition, so it was not conducive to the predictive activity for compound 32. In the CoMSIA model, the contribution of the steric field was 14.4%, the contribution of the electrostatic field was 29.2% and that of the hydrophobic field was 17.9%. This showed that the electrostatic field and hydrophobic field had a greater impact on activity prediction, so compound 32 was underestimated and became an outlier. There is no hydrophobic field involved in the CoMFA model, so 32 was not an outlier in the CoMFA model.
Docking analysis
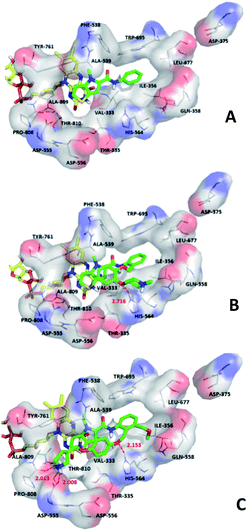
We hope to explain the difference of activity between small molecules through molecular docking, to understand what binding mechanisms will benefit the interaction between ligand and protein, and to provide ideas for the future design of small molecules. Therefore, three representative compounds were chosen for docking analysis: compound 1 was the common structure of this series of compounds. Compound 28 with extended R2 substituents was not increased but decreased in activity. The compound 54 had the highest activity.As shown in Fig. 7A for compound 1, the thiophene–pyrrole ring was surrounded by Val333, Thr335, Phe538, Trp695, Ala809 and Thr810, and thiophene–pyrrole ring and FAD formed an aromatic–aromatic interaction. Benzamide was surrounded by residues of Val333, Trp695 and Phe538. The reason why the low activity of compound 1 was that there was no hydrogen bond at all. It was observed that Asp555 and Asp556 belonged to the electronegative region and was also a hydrogen-bond receptor residue. Therefore, for the series of compounds, introducing positive groups at  and the formation of hydrogen bond with Asp555 and Asp556 were a potential modification method. The conclusion was also confirmed by the results of the 3D-QSAR analysis.
Compound 28 was shown in Fig. 7B, ortho-substitution of benzene rings in benzamide was performed, and the thiophene–pyrrole ring formed an aromatic–aromatic interaction with FAD. The substituents on the benzamide formed a hydrogen bond with His564 (His564–NH⋯O, bond length 2.72 Å). Due to the piperidine ring replaced the ortho-position H of the benzene ring, the electropositive substituents did not extend to the electronegative region at Asp555, which was also the reason why the activity of compound 28 was not high enough. Meanwhile, it was verified with QSAR to explain why there were large yellow blocks under hydroquinone in the CoMFA contour maps. Compound 28 was in the cavity, but the small molecule was still some distance away from the electronegativity region at Asp555, indicating that there was still potential for further improvement of activity.
For compound 54, thiophene–pyrrole heterocyclines still interacted with FAD to form an aromatic–aromatic interaction. As shown in Fig. 7C, the benzene ring of benzamide was approached by ortho–meta double substitution. The ortho-substituents extended to the electronegative region of Asp555, where the basic N on pyrrolidine formed a hydrogen bond (Asp555–HO⋯HN, bond length 2.01 Å) with Asp555 and another hydrogen bond with Pro808 (Pro808![[double bond, length as m-dash]](https://www.rsc.org/images/entities/char_e001.gif) O⋯HN, bond length 2.01 Å). This result was consistent with the analysis of the electrostatic field and the hydrogen bond donor field in QSAR. Furthermore, compound 54 formed a hydrogen bond (His564–NH⋯O, bond length 2.15 Å) with His564. In addition, the compound interacted with the Asp555 electronegative region to form a salt bridge. This analysis explained why compound 54 was the highest in activity. At the same time, we observed that Asp375 was also an electronegative region and a residue of hydrogen bond acceptor, but small molecules were still some distance away from this region. If they interact with this region, the activity of small molecules may be further enhanced, which could be used as the next direction to modify such small molecule inhibitors.
O⋯HN, bond length 2.01 Å). This result was consistent with the analysis of the electrostatic field and the hydrogen bond donor field in QSAR. Furthermore, compound 54 formed a hydrogen bond (His564–NH⋯O, bond length 2.15 Å) with His564. In addition, the compound interacted with the Asp555 electronegative region to form a salt bridge. This analysis explained why compound 54 was the highest in activity. At the same time, we observed that Asp375 was also an electronegative region and a residue of hydrogen bond acceptor, but small molecules were still some distance away from this region. If they interact with this region, the activity of small molecules may be further enhanced, which could be used as the next direction to modify such small molecule inhibitors.
In addition, 2D diagram of compounds 1, 28, 54 was obtained by using open source software LigPlotPlus.49 As shown in Fig. S4,† compounds 1 and 28 with poor activity had little interaction with the surrounding amino acids. Some amino acids in the binding site, Val333, Thr335, Ile356, Gln358, Phe538, Ala539, Leu659, Leu677, Trp695, Tyr761, Ala809, and Thr810 were involved in hydrophobic interactions with compound 54. In addition, Asp555, His564, Pro808 were involved in H-bond interactions with compound 54. Therefore, those interactions had an important impact on inhibitory activity. We found that the reason for the difference of inhibitor activity could be reasonably explained, indicating that binding mode might be the actual binding mode of small molecules. For newly designed small molecules, using molecular docking to observe the interaction between small molecules and LSD1 is very important for preliminary prediction of the activity of new small molecule inhibitors. When selecting the docking results of newly designed small molecules, we can rely on the above information for reference.
Design of novel derivatives
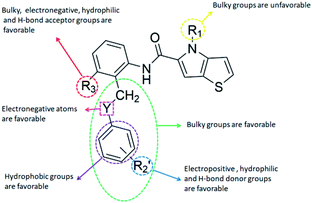
The structure–activity relationship (SAR) information revealed by the above 3D-QSAR contour maps analysis was summarized as shown in Fig. 8, which may be helpful in designing new LSD1 inhibitors with high activity.R1 substituents should not be too large, R2 substituents should be appropriately increased in order to achieve the length of electronegativity region, and the structure of hydroquinone played an important role in improving the activity. Because this structure not only increased the volume of R2, but also conformed to the suggestion of improving the activity of electrostatic field. For example, it was required to add electronegative groups at O22 and O29 positions of template compound 54, which was also of great significance in the hydrophobic field, therefore, this structure was retained when designing new inhibitors.  substituent should introduce electropositive substituent.
The addition of H-bond donor field at the  showed favorable to increase activity and the introduction of hydrogen bond acceptor groups in R3 could improve the activity. Based on scaffold in Fig. 8, we designed eight new small molecules and used 3D-QSAR model to predict their activity. The structure and prediction results of small molecules are shown in Table 5. As mentioned before, the interaction between small molecules and LSD1 was an important basis for predicting the activity of small molecules. Therefore, we selected D4, D5 and D8 with high activity for molecular docking. In the process of molecular docking, we preferentially chose binding mode with the same orientation as the binding mode obtained above and higher docking score.
MD simulations
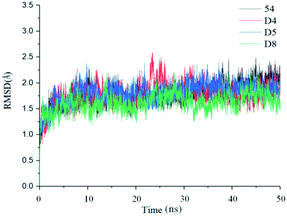
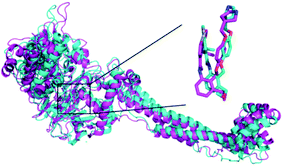
In order to further analyze the dynamic interactions of ligand–receptor and explore the binding mode of new designed small molecules, we chose the docking results of compound 54, D4, D5, D8 and conducted the molecular dynamics simulation of 50 ns. The RMSD plot of Cα for complexes was shown in Fig. 9. After a few time, the RSMD fluctuates of the four complexes were all in a very small range between 1.3 Å and 2.4 Å, which indicated that the systems had reached a state of stability. Plots of temperature and total-energy versus time are shown in Fig. S5 and S6.†We compared the LSD1–54 complex conformation between the after MD structure and initial structure, as is shown in Fig. 10, we found that compound 54 not only remained at the docking site, but also entered the active pocket of histone H3 deeper than the initial structure and blocked the entry of histone H3 into the active site, this prevented further interaction between H3 and FAD. At the same time, these results validated the reliability of the docking results.
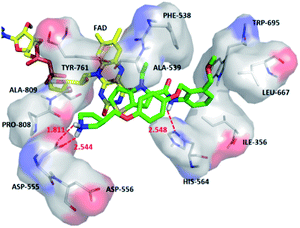
The average MD structure was shown in Fig. 11. The thiophene–pyrrole ring was more closely connected with FAD, and small molecules formed a salt bridge with Asp555. Although compound 54 had no interaction with Pro808, it formed shorter H bonds with Asp555 (Asp555–HO⋯HN, bond length 1.81 Å) and His564 (His564–N⋯HN, bond length 2.55 Å). This was the reason why compound 54 had higher activity.
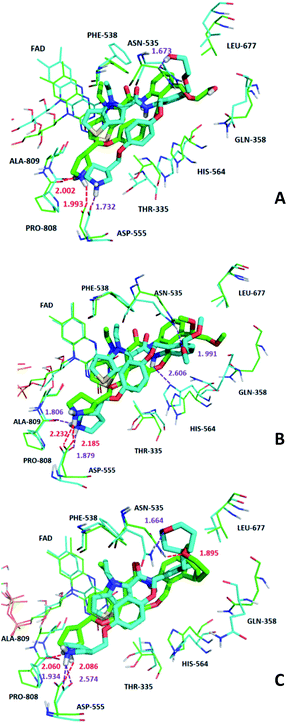
We superimposed the average structures of D4, D5, D8 complexes during MD equilibrium stage to docking results, which are shown in Fig. 12. After 50 ns MD, the 3 new small molecules were still in the active pocket, the molecules formed aromatic–aromatic interaction with FAD and salt bridge with Asp555. The D4 docking results showed that small molecules form hydrogen bonds with Pro808 (Pro808![[double bond, length as m-dash]](https://www.rsc.org/images/entities/char_e001.gif) O⋯HN, bond length 2.00 Å) and Asp555 (Asp555–HO⋯HN, bond length 1.99 Å). Although hydrogen bond lost with Pro808 during MD, shorter H-bond Asp555 (Asp555–HO⋯HN, bond length 1.73) and new H-bond (Asn535–NH⋯O, bond length 1.67 Å) were formed. The docking results and MD average structure showed that D5 and Asp555 established shorter H-bond (Asp555–HO⋯HN, bond length 1.88) during MD simulation. In addition, small molecules formed 3 new hydrogen bonds with Asn535 (Asn535–NH⋯O, bond length 1.99), Pro808 (Pro808
O⋯HN, bond length 2.00 Å) and Asp555 (Asp555–HO⋯HN, bond length 1.99 Å). Although hydrogen bond lost with Pro808 during MD, shorter H-bond Asp555 (Asp555–HO⋯HN, bond length 1.73) and new H-bond (Asn535–NH⋯O, bond length 1.67 Å) were formed. The docking results and MD average structure showed that D5 and Asp555 established shorter H-bond (Asp555–HO⋯HN, bond length 1.88) during MD simulation. In addition, small molecules formed 3 new hydrogen bonds with Asn535 (Asn535–NH⋯O, bond length 1.99), Pro808 (Pro808![[double bond, length as m-dash]](https://www.rsc.org/images/entities/char_e001.gif) O⋯HN, bond length 1.81 Å) and His564 (His564–N⋯HN, bond length 2.61 Å), which is attributed the predictive activity associated with D5.
O⋯HN, bond length 1.81 Å) and His564 (His564–N⋯HN, bond length 2.61 Å), which is attributed the predictive activity associated with D5.
The docking result of D8 showed that small molecules form hydrogen bonds with Pro808 (Pro808![[double bond, length as m-dash]](https://www.rsc.org/images/entities/char_e001.gif) O⋯HN, bond length 2.06) and Asp555 (Asp555–HO⋯HN, bond length 2.09), respectively. At the same time, small molecules formed hydrogen bond with Asn535 (Asn535–NH⋯O, bond length 1.89). During MD simulations, although H-bond was lost with Pro808, shorter H-bonds were formed with Asp555 (Asp555–HO⋯HN, bond length 1.93) and Asn535 (Asn535–NH⋯O, bond length 1.66). MD analysis indicated that D4, D5, D8 form favorable interaction with LSD1. In the meantime, the importance of Asp555 for the activity of these small molecules was proved. In accordance with the previous QSAR model and docking analysis, R3 was modified according to the QSAR contour map (enlarging volume and adding hydrogen bond acceptor groups). After these modifications, we found that the R3 groups of D4, D5 and D8 compounds formed hydrogen bonds with Asn535 in the superposition, among these excellent compounds reported, none of them formed H-bond with Asn535, which may be the reason why D4, D5 and D8 have higher predictive activity than compound 54. The modification of R3 and Asn535 deserve the attention of future designers of such inhibitors.
O⋯HN, bond length 2.06) and Asp555 (Asp555–HO⋯HN, bond length 2.09), respectively. At the same time, small molecules formed hydrogen bond with Asn535 (Asn535–NH⋯O, bond length 1.89). During MD simulations, although H-bond was lost with Pro808, shorter H-bonds were formed with Asp555 (Asp555–HO⋯HN, bond length 1.93) and Asn535 (Asn535–NH⋯O, bond length 1.66). MD analysis indicated that D4, D5, D8 form favorable interaction with LSD1. In the meantime, the importance of Asp555 for the activity of these small molecules was proved. In accordance with the previous QSAR model and docking analysis, R3 was modified according to the QSAR contour map (enlarging volume and adding hydrogen bond acceptor groups). After these modifications, we found that the R3 groups of D4, D5 and D8 compounds formed hydrogen bonds with Asn535 in the superposition, among these excellent compounds reported, none of them formed H-bond with Asn535, which may be the reason why D4, D5 and D8 have higher predictive activity than compound 54. The modification of R3 and Asn535 deserve the attention of future designers of such inhibitors.
In addition, it was found that small molecules and FAD formed aromatic–aromatic interaction before and after MD, which was of great significance to the binding mode of these small molecules.
Binding free energy calculation
In order to further verify the binding affinity of D4, D5, D8 with LSD1, the binding free energies of the three compounds with LSD1 were calculated by MM/GBSA method, and the binding free energy of compound 54 with LSD1 was also computed as a reference. The results are shown in Table 6.| No. | ΔEele kcal mol−1 | ΔEvdW kcal mol−1 | ΔGGB kcal mol−1 | ΔGSA kcal mol−1 | ΔGsol kcal mol−1 | ΔGbind kcal mol−1 | pIC50 predicted |
|---|---|---|---|---|---|---|---|
| LSD1–54 | −103.7501 | −52.4748 | 128.9897 | −6.6194 | 122.3703 | −33.8537 | 8.174 |
| LSD1–D4 | −134.9198 | −49.4678 | 151.9764 | −6.5057 | 145.4707 | −38.9169 | 8.312 |
| LSD1–D5 | −101.5999 | −61.0727 | 120.0679 | −7.7538 | 112.3141 | −50.3592 | 8.521 |
| LSD1–D8 | −86.1198 | −59.8317 | 109.082 | −7.9847 | 101.0974 | −44.8516 | 8.473 |
The binding free energies of compounds 54, D4, D5, D8 with LSD1 were −33.85 kcal mol−1, −38.92 kcal mol−1, −50.36 kcal mol−1, −44.85 kcal mol−1, respectively. It is generally believed that the lower of ΔGbind value, the more stable of the complex. Table 6 showed that ΔGbind values were coincided well with the predicted pIC50 values of the QSAR model. The electrostatic energy ΔEele contributed much more to the binding free energy than other energies, indicating that electrostatic interaction played a key role in the complex system, which could be caused by the interaction between basic N in small molecules and Asp555 negative region. Similarly, the van der Waals energy ΔEvdW illustrated that hydrophobic interaction was also important in the binding process. The polar solvation energy ΔGGB is positive, indicating that it was not conducive to ΔGbind, the reason was that excessive binding pocket could cause exposure of ligand to solvents. However, ΔGSA values were negative, which means that non-polar solvation energy was beneficial for ΔGbind. Because the newly designed compounds D4, D5 and D8 had lower ΔGbind values than 54, they may have a stronger inhibitory effect on LSD1.
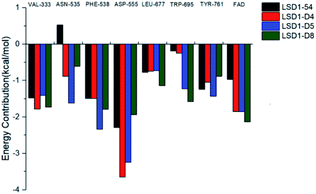
In order to analyze which amino acids contributed more to the binding free energy of the system, we decomposed the binding free energy into each amino acid and observed that the amino acids that contribute more to the binding free energy were Val333, Asn535, Phe538, Asp555, Leu677, Trp695, Tyr761 and FAD. Their energy contributions are shown in Fig. 13. It was found that Asp555 contributed the most to the four systems, which again showed that Asp555 was closely related to the activities of these small molecules. Furthermore, FAD contributed a lot to the four systems. The docking results showed that thiophene–pyrrole and FAD had aromatic–aromatic interaction, which was important for the binding mode of these small molecules. D4, D5 and D8 formed hydrogen bond with Asn535 and compound 54 did not form hydrogen bond with it, therefore Asn535 was beneficial for the binding free energy of D4, D5, D8, but has little contribution to the binding with compound 54. Although Asp555 contributed less to D5 than D4, Asn535, Phe538 and TRP695 contributed more to D5 than D4, which may be the reason why D5 activity was higher than D4.
ADME and bioavailability analysis
It is necessary to carry out bioavailability and pharmacokinetics prediction on the novel candidate compounds before the experiment. We predicted the candidate compounds D4, D5 and D8, and compound 54 with the best activity was selected as the control group. The results are shown in Table 7.| No. | MW (g mol−1) | Fraction Csp3 | N | TPSA (Å2) | log![[thin space (1/6-em)]](https://www.rsc.org/images/entities/char_2009.gif) P P |
log![[thin space (1/6-em)]](https://www.rsc.org/images/entities/char_2009.gif) S S |
HIA | BBB | CYP3A4 inhibition | log![[thin space (1/6-em)]](https://www.rsc.org/images/entities/char_2009.gif) Kp (cm s−1) Kp (cm s−1) |
Drug-likeness Lipinski |
|---|---|---|---|---|---|---|---|---|---|---|---|
| 54 | 519.66 | 0.34 | 12 | 101.99 | 4.44 | −5.37 | High | No | Yes | −6.43 | Yes |
| D4 | 549.68 | 0.37 | 14 | 122.22 | 4.12 | −4.97 | High | No | Yes | −7.10 | Yes |
| D5 | 563.71 | 0.39 | 14 | 111.22 | 4.56 | −5.41 | High | No | Yes | −6.78 | Yes |
| D8 | 587.77 | 0.44 | 12 | 101.99 | 4.90 | −6.73 | Low | No | Yes | −5.73 | Yes |
| Optimal range | <800 | 0.25–1 | ≤10 | 20–130 | −0.7 to 5 | −10 to 6 | — | — | — | — | — |
Compound saturation was measured by fraction Csp3 and polarity was calculated by TPSD (topological polar surface area). Lipophilicity used log![[thin space (1/6-em)]](https://www.rsc.org/images/entities/char_2009.gif) P to quantify. The log
P to quantify. The log![[thin space (1/6-em)]](https://www.rsc.org/images/entities/char_2009.gif) P values of D4, D5 and D8 were in the best range, which indicated that they had good absorbency. log
P values of D4, D5 and D8 were in the best range, which indicated that they had good absorbency. log![[thin space (1/6-em)]](https://www.rsc.org/images/entities/char_2009.gif) S was used to measure solubility, and the log
S was used to measure solubility, and the log![[thin space (1/6-em)]](https://www.rsc.org/images/entities/char_2009.gif) S values of D4, D5 and D8 were also within a reasonable range, which demonstrated that they had good solubility. The only indicator for D4, D5 and D8 beyond the best range was num. rotatable bonds, which mean that the molecules had high flexibility in the human body. So we need to minimize the number of rotational bonds in the design of such small molecules in the future. Overall, D4, D5 and D8 had really high bioavailability. High stands for compounds 54, D4 and D5 with good gastrointestinal absorption ability. Low means that D8 may not have gastrointestinal absorption ability. No represented that compounds 54, D4, D5 and D8 were not brain penetrant. The two properties could be more intuitively reflected from Fig. S7.† Yes represented that these compounds had inhibitory effects on CYP3A4 and could be excreted through metabolic biotransformation. Skin permeability was measured by log
S values of D4, D5 and D8 were also within a reasonable range, which demonstrated that they had good solubility. The only indicator for D4, D5 and D8 beyond the best range was num. rotatable bonds, which mean that the molecules had high flexibility in the human body. So we need to minimize the number of rotational bonds in the design of such small molecules in the future. Overall, D4, D5 and D8 had really high bioavailability. High stands for compounds 54, D4 and D5 with good gastrointestinal absorption ability. Low means that D8 may not have gastrointestinal absorption ability. No represented that compounds 54, D4, D5 and D8 were not brain penetrant. The two properties could be more intuitively reflected from Fig. S7.† Yes represented that these compounds had inhibitory effects on CYP3A4 and could be excreted through metabolic biotransformation. Skin permeability was measured by log![[thin space (1/6-em)]](https://www.rsc.org/images/entities/char_2009.gif) Kp, and D8 had highest skin permeability. Finally, Lipinski's rule was used to evaluate the drug-likeness of four compounds. The results were yes. The bioavailability and ADME analysis showed that the novel designed compounds might become safer and more active LSD1 inhibitors.
Kp, and D8 had highest skin permeability. Finally, Lipinski's rule was used to evaluate the drug-likeness of four compounds. The results were yes. The bioavailability and ADME analysis showed that the novel designed compounds might become safer and more active LSD1 inhibitors.
Conclusions
In this study, we chose the series of thieno[3,2-b]pyrrole-5-carboxamides as reversible LSD1 inhibitors using molecular docking, 3D-QSAR. ECIDALs was followed when selecting docking results.33 The representative results of molecular docking for small molecules were used to explain the differences in biological activity. The CoMFA (q2 = 0.783, r2 = 0.944) and CoMISA models (q2 = 0.728, r2 = 0.982) were received to perform molecular modeling study. The results showed that the models had good internal verification ability and external prediction ability. The models were further validated following the criteria given by Tropsha and Roy, and were determined to be statistically reliable and robust. We could use this model to predict the activity of this series of compounds to reduce the loss of blind investment in the experiment. Likewise, the contour maps also indicated the relationship between the structure and activity of small molecules. The results of molecular docking and the information prompted by contour maps confirmed each other. Based on these 3D-QSAR models, 8 new small molecules were designed in silico. Further docking, MD, calculation of binding free energy, ADME and bioavailability prediction were carried out for these designed compounds and the results indicated that D4, D5 and D8 show good potential to become LSD1 inhibitors with better activity than compound 54. At the same time, key amino acids affecting the activity of these inhibitors, such as Asp555, Pro808, His564, were easy to form H-bonds with small molecules, after R3 was modified, Asn535 formed H-bond with small molecules. Val333, Phe538, Leu677, Trp695, Thr761 and FAD could enable inhibitors to maintain stability in the binding site. Our study would provide some theoretical guidance for the future design novelly reversible LSD1 inhibitor.Conflicts of interest
There are no conflicts to declare.Acknowledgements
The authors are grateful for the financial support from The National Natural Science Foundation of China (Grant No. 21603180), The Research Project of Henan Provincial Department of Science and Technology (Grant No. 182102210122) Research Project of Xinxiang Medical University (Grant No. 505060, 505144, 505212) and Open Topic at School of Biomedical Engineering, Xinxiang Medical University (Grant No. 2018-BME-KFKT-01, 2018-BME-KFKT-10, 2018-BME-KFKT-11). The authors also thank Prof. Zheng Jie from the Guangdong University of Technology for offering software support and Dr Meilan Huang from Queens University Belfast helpful discussion.References
- B. D. Strahl and C. D. Allis, Nature, 2000, 403, 41–45 CrossRef CAS PubMed.
- T. Kouzarides, Cell, 2007, 128, 693–705 CrossRef CAS PubMed.
- Y. Shi, F. Lan, C. Matson, P. Mulligan, J. R. Whetstine, P. A. Cole, R. A. Casero and Y. Shi, Cell, 2004, 119, 941–953 CrossRef CAS PubMed.
- B. Laurent, L. Ruitu, J. Murn, K. Hempel, R. Ferrao, Y. Xiang, S. Liu, B. A. Garcia, H. Wu and F. Wu, Mol. Cell, 2015, 57, 957–970 CrossRef CAS PubMed.
- I. Garciabassets, Y. Kwon, F. Telese, G. G. Prefontaine, K. R. Hutt, C. S. Cheng, B. Ju, K. A. Ohgi, J. Wang and L. Escoubetlozach, Cell, 2007, 128, 505–518 CrossRef CAS PubMed.
- J. Huang, R. Sengupta, A. Espejo, M. G. Lee, J. Dorsey, M. Richter, S. Opravil, R. Shiekhattar, M. T. Bedford and T. Jenuwein, Nature, 2007, 449, 105–108 CrossRef CAS PubMed.
- J. Wang, S. Hevi, J. K. Kurash, H. Lei, J. Bajko, H. Su, W. Sun, H. Chang, G. Xu and F. Gaudet, Nat. Genet., 2009, 41, 125–129 CrossRef CAS PubMed.
- E. Nunez, Y. Kwon, K. R. Hutt, Q. Hu, M. D. Cardamone, K. A. Ohgi, I. Garciabassets, D. W. Rose, C. K. Glass and M. G. Rosenfeld, Cell, 2008, 132, 996–1010 CrossRef CAS PubMed.
- Y. J. Shi, C. Matson, F. Lan, S. Iwase, T. Baba and Y. Shi, Mol. Cell, 2005, 19, 857–864 CrossRef CAS PubMed.
- A. A. Lokken and N. J. Zeleznikle, Cancer Cell, 2012, 21, 451–453 CrossRef CAS PubMed.
- T. Lv, D. Yuan, X. Miao, Y. Lv, P. Zhan, X. Shen and Y. Song, PLoS One, 2012, 7, e35065 CrossRef CAS PubMed.
- C. Magerl, J. Ellinger, T. Braunschweig, E. Kremmer, L. K. Koch, T. Holler, R. Buttner, B. Luscher and I. Gutgemann, Hum. Pathol., 2010, 41, 181–189 CrossRef CAS PubMed.
- J. H. Schulte, S. Lim, A. Schramm, N. Friedrichs, J. Koster, R. Versteeg, I. Ora, K. W. Pajtler, L. Kleinhitpass and S. Kuhfittigkulle, Cancer Res., 2009, 69, 2065–2071 CrossRef CAS PubMed.
- Y. Wang, H. Zhang, Y. Chen, Y. Sun, F. Yang, W. Yu, J. Liang, L. Sun, X. Yang and L. Shi, Cell, 2009, 138, 660–672 CrossRef CAS PubMed.
- Y. C. Zheng, B. Yu, G. Z. Jiang, X. J. Feng, P. X. He, X. Y. Chu, W. Zhao and H. M. Liu, Curr. Top. Med. Chem., 2016, 16, 2179–2188 CrossRef CAS PubMed.
- T. E. Mcallister, K. S. England, R. J. Hopkinson, P. E. Brennan, A. Kawamura and C. J. Schofield, J. Med. Chem., 2016, 59, 1308–1329 CrossRef CAS PubMed.
- Y. Zheng, B. Yu, Z. Chen, Y. Liu and H. Liu, Epigenomics, 2016, 8, 651–666 CrossRef CAS PubMed.
- D. M. Z. Schmidt and D. G. Mccafferty, Biochemistry, 2007, 46, 4408–4416 CrossRef CAS PubMed.
- M. G. Lee, C. Wynder, D. M. Z. Schmidt, D. G. Mccafferty and R. Shiekhattar, Chem. Biol., 2006, 13, 563–567 CrossRef CAS PubMed.
- T. Maes, C. Mascaro, I. Tirapu, A. Estiarte, F. Ciceri, S. Lunardi, N. Guibourt, A. Perdones, M. M. Lufino and T. C. P. Somervaille, Cancer Cell, 2018, 33, 495 CrossRef CAS PubMed.
- C. A. Stewart and L. A. Byers, Cancer Cell, 2015, 28, 4–6 CrossRef CAS PubMed.
- F. Wu, C. Zhou, Y. Yao, L. Wei, Z. Feng, L. Deng and Y. Song, J. Med. Chem., 2016, 59, 253–263 CrossRef CAS PubMed.
- V. Sorna, E. R. Theisen, B. Stephens, S. L. Warner, D. J. Bearss, H. Vankayalapati and S. Sharma, J. Med. Chem., 2013, 56, 9496–9508 CrossRef CAS PubMed.
- L. Sartori, C. Mercurio, F. Amigoni, A. Cappa, G. Faga, R. Fattori, E. Legnaghi, G. Ciossani, A. Mattevi and G. Meroni, J. Med. Chem., 2017, 60, 1673–1692 CrossRef CAS PubMed.
- P. Vianello, L. Sartori, F. Amigoni, A. Cappa, G. Faga, R. Fattori, E. Legnaghi, G. Ciossani, A. Mattevi and G. Meroni, J. Med. Chem., 2017, 60, 1693–1715 CrossRef CAS PubMed.
- W. L. Jorgensen, Science, 2004, 303, 1813–1818 CrossRef CAS PubMed.
- P. P. Qian, S. Wang, K. R. Feng and Y. J. Ren, RSC Adv., 2018, 8, 14311–14327 RSC.
- Y. Fang, Y. Lu, X. Zang, T. Wu, X. Qi, S. Pan and X. Xu, Sci. Rep., 2016, 6, 23634 CrossRef CAS PubMed.
- S. Ma, S. Zhou, W. Lin, R. Zhang, W. Wu and K. Zheng, RSC Adv., 2016, 6, 100772–100782 RSC.
- R. D. Cramer, D. E. Patterson and J. D. Bunce, J. Am. Chem. Soc., 1988, 110, 5959–5967 CrossRef CAS PubMed.
- G. Klebe, U. Abraham and T. Mietzner, J. Med. Chem., 1994, 37, 4130–4146 CrossRef CAS PubMed.
- C. Munozgutierrez, F. Adasmecarreno, E. Fuentes, I. Palomo and J. Caballero, RSC Adv., 2016, 6, 64756–64768 RSC.
- J. Chen, R. Yu, B. Shen, Y. Xu, Y. Liu, H. Zheng and W. Yao, Med. Chem. Res., 2013, 22, 1730–1739 CrossRef CAS.
- H. Duan, X. Liu, W. Zhuo, J. Meng, J. Gu, X. Sun, K. Zuo, Q. Luo, Y. Luo and D. Tang, Mol. Simul., 2019, 45, 694–705 CrossRef CAS.
- G. Klebe and U. Abraham, J. Comput.-Aided Mol. Des., 1999, 13, 1–10 CrossRef CAS PubMed.
- P. K. Balasubramanian, A. Balupuri, C. G. Gadhe and S. J. Cho, Med. Chem. Res., 2015, 24, 2347–2365 CrossRef CAS.
- R. D. Clark and P. C. Fox, J. Comput.-Aided Mol. Des., 2004, 18, 563–576 CrossRef CAS PubMed.
- L. Ding, Z. Wang, X. Sun, J. Yang, C. Ma, W. Li and H. Liu, Bioorg. Med. Chem. Lett., 2017, 27, 3521–3528 CrossRef CAS PubMed.
- V. Srivastava, S. P. Gupta, M. I. Siddiqi and B. N. Mishra, Eur. J. Med. Chem., 2010, 45, 1560–1571 CrossRef CAS PubMed.
- J. Verma, V. M. Khedkar and E. C. Coutinho, Curr. Top. Med. Chem., 2010, 10, 95–115 CrossRef CAS PubMed.
- K. Roy, P. Chakraborty, I. Mitra, P. K. Ojha, S. Kar and R. N. Das, J. Comput. Chem., 2013, 34, 1071–1082 CrossRef CAS PubMed.
- M. Lorca, C. Moralesverdejo, D. Vasquezvelasquez, J. Andradeslagos, J. Campaninisalinas, J. Sotodelgado, G. Recabarrengajardo and J. Mella, Molecules, 2018, 23, 1191 CrossRef PubMed.
- C. Rucker, G. Rucker and M. Meringer, J. Chem. Inf. Model., 2007, 47, 2345–2357 CrossRef PubMed.
- H. Sun, Y. Li, M. Shen, S. Tian, L. Xu, P. Pan, Y. Guan and T. Hou, Phys. Chem. Chem. Phys., 2014, 16, 22035–22045 RSC.
- A. Daina, O. Michielin and V. Zoete, Sci. Rep., 2017, 7, 42717 CrossRef PubMed.
- C. A. Lipinski, F. Lombardo, B. W. Dominy and P. J. Feeney, Adv. Drug Delivery Rev., 1997, 23, 3–25 CrossRef CAS.
- J. Caballero, M. Fernandez, M. Saavedra and F. D. Gonzaleznilo, Bioorg. Med. Chem., 2008, 16, 810–821 CrossRef CAS PubMed.
- A. Tropsha, Mol. Inf., 2010, 29, 476–488 CrossRef CAS PubMed.
- R. A. Laskowski and M. B. Swindells, J. Chem. Inf. Model., 2011, 51, 2778–2786 CrossRef CAS PubMed.
Footnote |
| † Electronic supplementary information (ESI) available. See DOI: 10.1039/c9ra10085g |
| This journal is © The Royal Society of Chemistry 2020 |

