An A–D–A′–D–A type small molecule acceptor with wide absorption spectrum and near-infrared absorption†
Junhui
Miao
ab,
Junxia
Wang
c,
Bin
Meng
*a,
Jun
Liu
 *a and
Lixiang
Wang
 a
a
aState Key Laboratory of Polymer Physics and Chemistry, Changchun Institute of Applied Chemistry, Chinese Academy of Sciences, Changchun 130022, People's Republic of China. E-mail: mengbin@ciac.ac.cn; liujun@ciac.ac.cn
bUniversity of Science and Technology of China, Hefei 230026, People's Republic of China
cCollege of Chemistry, Jilin University, Changchun 130012, People's Republic of China
First published on 23rd October 2018
Abstract
Small molecule acceptors with wide absorption spectra and small bandgap are very important for the sunlight harvesting of organic solar cells (OSCs). Recently, we have developed A–D–A′–D–A type small molecule acceptors with wide absorption spectra. However, the molecule (IID-IC) suffers from medium bandgap with poor light absorption in the near-infrared (NIR) region. Here, we develop a new A–D–A′–D–A type small molecule acceptor, IID-IC-O, with both wide absorption spectrum and small bandgap. IID-IC-O is designed by replacing the alkyl substituents of IID-IC with alkoxyl substituents. The replacement leads to upshifted HOMO energy level and improved backbone planarity of IID-IC-O. As a result, IID-IC-O exhibits a wide absorption spectrum spanning from 300 nm to 890 nm with a bandgap as small as 1.39 eV. The OSC device of IID-IC-O exhibits a power conversion efficiency of 4.20% with wide photoresponse from 300 nm to 900 nm. These results demonstrate the superior light harvesting capability of rationally designed organic molecules, which may be useful for many solar energy-related applications.
Introduction
Organic solar cells (OSCs) have recently received great attention because of their solution processing with low cost, flexibility and light weight.1–5 OSCs use a blend of polymer electron donor and electron acceptor as the active layer to convert solar energy to electricity.6–18 The development of non-fullerene small molecule acceptors has boosted the power conversion efficiency (PCE) to more than 14%.19–22 Small molecule acceptors should have strong sunlight harvesting capability, which requires both wide absorption spectra and small bandgap (for absorption in the near-infrared (NIR) region).23–34 Typical small molecule acceptors are A–D–A type molecules, in which an electron-rich core unit (donor, D) is end-capped by two electron-deficient units (acceptor, A).35–43 These A–D–A type small molecule acceptors exhibit only one strong absorption band attributed to the intramolecular charge transfer. The full width at half maximum (FWHM) of the absorption band is ca. 100–150 nm. Therefore, these small molecule acceptors suffer from narrow absorption spectra. Recently, we have proposed the A–D–A′–D–A strategy to develop small molecule acceptors by using an extra electron-deficient core unit.44 The insertion of the A′ core unit partially disturbs the intramolecular charge transfer effect and leads to wide absorption spectra. However, the A–D–A′–D–A type small molecule acceptor, e.g., IID-IC (see Scheme 1), suffers from medium bandgap (Eg = 1.71 eV) with the onset absorption wavelength of 725 nm, which limits its absorption in the NIR region. Therefore, to maximize the sunlight harvesting capability, it is very challenging to develop small molecule acceptors with both wide absorption spectra and a small bandgap.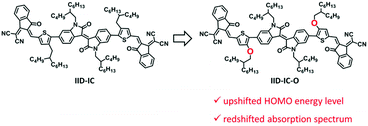 | ||
| Scheme 1 Chemical structures of IID-IC and IID-IC-O, and schematic illustration of the effect of the oxygen atom. | ||
In this manuscript, we report a new A–D–A′–D–A type small molecule acceptor, IID-IC-O, with both wide absorption spectrum and small bandgap. This is achieved by replacing the alkyl substituents of IID-IC with alkoxyl substituents (see Scheme 1). The electron donating oxygen atoms of the alkoxyl substituents increases the HOMO energy level of IID-IC-O and consequently leads to a reduced bandgap.45,46 The absorption spectrum of IID-IC-O spans effectively from 300 nm to 890 nm with the optical bandgap of only 1.39 eV. The OSC device of IID-IC-O exhibits a PCE of 4.20% with wide photoresponse from 300 nm to 900 nm. These results demonstrate the superior light harvesting capability of rationally designed organic molecules, which may be useful for solar energy-related applications.
Results and discussion
Density functional theory calculations
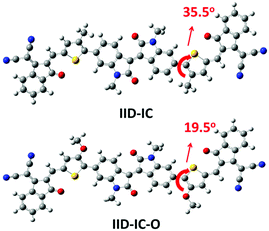
Theoretical calculations by density functional theory (DFT) at the B3LYP/6-31G(d,p) level were conducted to investigate the influence of alkoxy groups on the molecular configuration and frontier molecular orbitals of IID-IC and IID-IC-O. Fig. 1 shows the optimized molecular geometries of IID-IC and IID-IC-O with the simplified side chains. The dihedral angles between the isoindigo and thiophene unit in IID-IC and IID-IC-O are 35.5° and 19.5°, respectively. The small dihedral angle of IID-IC-O indicates improved backbone planarity, which is due to the smaller steric hindrance of the oxygen atom than that of the methylene group.47–51 According to the frontier molecular orbitals of IID-IC and IID-IC-O (Fig. S3, ESI†), the introduction of alkoxy groups has little impact on the electron density distributions of the LUMO of the molecule, but the oxygen atoms contribute to the HOMO significantly. Compared with those of IID-IC, the calculated HOMO energy level of IID-IC-O is upshifted by 0.29 eV and the calculated LUMO energy level is nearly unchanged.Synthesis
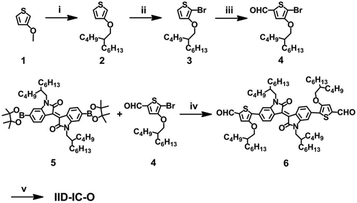
Scheme 2 shows the synthetic route of IID-IC-O. Starting from 3-methoxythiophene, alkylation, bromination and the subsequent Vilsmeier–Haack reaction afforded 4. The Suzuki coupling reaction between 4 and 5 produced 6. Finally, IID-IC-O was synthesized using the Knoevenagel condensation reaction in 85% yield. The chemical structure of IID-IC-O was fully characterized by 1H NMR, 13C NMR, matrix-assisted laser desorption ionization time of flight mass spectroscopy (MALDI-TOF-MS) and elemental analysis. According to thermogravimetric analysis (TGA), IID-IC-O exhibits excellent thermal stability with a decomposition temperature at 5% weight loss of 342 °C in a nitrogen atmosphere.Optical and electrochemical properties
The UV-vis absorption spectra of IID-IC and IID-IC-O in chlorobenzene solution and in thin films are presented in Fig. S5 (ESI†) and Fig. 2a. The characteristics are summarized in Table 1. In solution, IID-IC-O shows two absorption bands with a peak at 684 nm, which is much more bathochromic than that of IID-IC. In a thin film, IID-IC-O exhibits maximum absorption at 805 nm, which is redshifted by ca. 200 nm compared to that of IID-IC. This is attributed to the upshifted HOMO energy level and reduced bandgap of IID-IC-O. According to the onset absorption wavelength, the optical bandgap of IID-IC-O is estimated to be 1.39 eV. IID-IC-O exhibits a wide absorption spectrum spanning from 300 nm to 890 nm, effectively covering the visible region and the NIR region, indicating strong sunlight harvesting capability.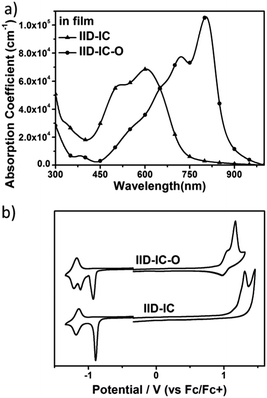 | ||
| Fig. 2 (a) The UV-vis absorption spectra of IID-IC and IID-IC-O in films; (b) cyclic voltammograms of IID-IC and IID-IC-O. | ||
According to the DFT results, the wide absorption spectrum of IID-IC-O is ascribed to the overlap of different absorption bands, which mainly come from the transitions of HOMO → LUMO, HOMO−2 → LUMO, HOMO → LUMO+2, HOMO−1→ LUMO+1, HOMO → LUMO+4, HOMO−4 → LUMO and HOMO−3 → LUMO+1 (Fig. S4, ESI†). The maximum extinction coefficient of IID-IC-O is 1.06 × 105 cm−1, which is much higher than that of IID-IC (Table 1).
The HOMO/LUMO energy levels of IID-IC-O and IID-IC were estimated by cyclic voltammetry. The cyclic voltammograms are presented in Fig. 2b and the characteristics are summarized in Table 1. The HOMO and LUMO energy levels of IID-IC-O are estimated to be −5.74 eV and −3.93 eV, respectively. Compared with IID-IC, the HOMO energy level of IID-IC-O is up-shifted by 0.25 eV while the LUMO energy level is similar. The upshifted HOMO energy level is attributed to the electron-donating properties of the alkoxyl substituents. These results are consistent with the DFT calculation results. Fig. 3c compares the LUMO/HOMO energy levels of IID-IC-O and a typical polymer electron donor, poly[4,8-bis(5-(dodecylthio)thiophen-2-yl)-benzo[1,2-b;4,5-b′]dithiophene-2,6-diyl-alt-5,6-difluoro-2-(2-hexyldecyl)-4,7-di(thiophen-2-yl)-2H-benzo[d][1,2,3]triazole] (J61).52 The LUMO/HOMO energy levels of IID-IC-O are lower than those of J61 by 0.85 eV and 0.42 eV, respectively, indicating that IID-IC-O can work as an electron acceptor in OSCs.
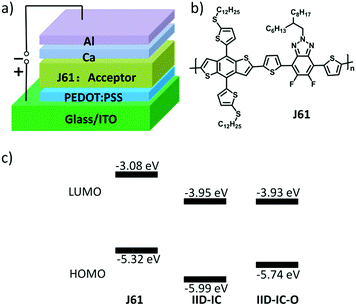 | ||
| Fig. 3 (a) OSC device structure; (b) chemical structure of polymer donor J61; (c) energy level alignment for J61, IID-IC and IID-IC-O. | ||
Carrier mobility
We measured the electron mobility of IID-IC-O using a space charge limited current (SCLC) method based on the current density–voltage (J–V) curve of the electron-only device (Fig. S6, ESI†). The electron mobility of IID-IC-O is estimated to be 3.89 × 10⁻⁵ cm2 V−1 s−1, which is nearly three times higher than that of IID-IC (1.04 × 10⁻⁵ cm2 V−1 s−1).44 The improved charge transport ability of IID-IC-O is possibly due to its more planar molecular backbone. However, the electron mobility of IID-IC-O is moderate, mainly due to the lack of ordered π–π stacking of the molecule backbone, which can be seen from the grazing incident X-ray diffraction (GI-XRD) pattern of the IID-IC-O film (Fig. S9a, ESI†).Photovoltaic properties
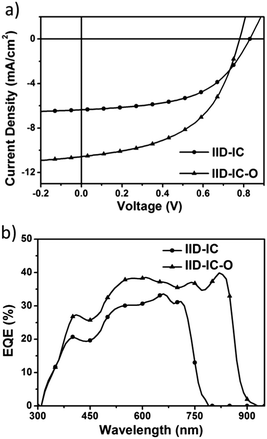
To evaluate the photovoltaic performance of IID-IC-O, we used J61 as the polymer donor and IID-IC-O as the electron acceptor to fabricate the OSC device. The device architecture is ITO/poly(3,4-ethylenedioxythiophene):poly(styrenesulfonate) (PEDOT:PSS)/J61:IID-IC-O or IID-IC/Ca/Al (Fig. 3a). The current density–voltage (J–V) curves of the devices based on J61:IID-IC and J61:IID-IC-O are shown in Fig. 4a and the corresponding photovoltaic parameters are listed in Table 2. The device of J61:IID-IC-O exhibits a PCE of 4.20%, with an open-circuit voltage (VOC) of 0.78 V, a short-circuit current density (JSC) of 10.56 mA cm−2 and a fill factor (FF) of 0.51. In comparison, the device of IID-IC shows a PCE of 2.82%, with a VOC of 0.83 V, a JSC of 6.36 mA cm−2 and an FF of 0.53.44 The IID-IC-O-based device exhibits a slightly lower VOC but much higher JSC than those of the IID-IC-based device. As the LUMO energy level of the two acceptors is similar, the different VOC is maybe ascribed to the different blend morphology of the two systems. The photon energy loss (the difference between the Eoptg and eVOC) of the J61:IID-IC-O device is as small as 0.61 eV, indicating appropriate energy level alignment between J61 and IID-IC-O.53Fig. 4b shows the external quantum efficiency (EQE) curves of the two devices. The device of J61:IID-IC-O displays a broad photoresponse in the range of 300–900 nm with the maximum EQE value of 40% at 820 nm. The EQE response of the J61:IID-IC-O device is stronger and wider than that of the J61:IID-IC device. The integrated photocurrents from the EQE spectra are 6.63 and 10.96 mA cm−2 for J61:IID-IC and J61:IID-IC-O, respectively, which are consistent with the JSC values obtained from the J–V measurements.Charge transport behavior in OSCs
We measured the charge mobilities of the two active layers by an SCLC method with the J–V curves of the electron-only and hole-only devices (Fig. S7, ESI†). The device structures are ITO/PEIE/J61:IID-IC-O/Ca/Al and ITO/PEDOT:PSS/J61:IID-IC-O/MoO3/Al, respectively. The electron mobility (μe) and hole mobility (μh) of the J61:IID-IC-O film are estimated to be 6.47 × 10⁻⁵ cm2 V−1 s−1 and 1.62 × 10⁻⁴ cm2 V−1 s−1, respectively. These values are higher than those of the J61:IID-IC film (μe = 4.18 × 10⁻⁵ cm2 V−1 s−1 and μh = 1.94 × 10⁻⁴ cm2 V−1 s−1).44 The improved electron mobility should contribute to the high JSC of the IID-IC-O-based device. However, the electron/hole mobilities of the J61:IID-IC-O film are relatively low, which may be ascribed to the less ordering in the blend (Fig. S9b, ESI†). The relatively low mobilities in the blend may be one of the reasons for the moderate PCE.Charge generation, collection and recombination behaviors
To investigate the charge generation, collection and recombination behaviors, we measured the photocurrent density (Jph) versus the effective voltage (Veff) and light density dependent J–V characteristics of the IID-IC and IID-IC-O based devices. As shown in Fig. 5a, the IID-IC-O-based devices show much higher Jph than IID-IC-based devices, which is consistent with the improved photon harvesting ability of IID-IC-O. As the Veff rises, the Jph increases and does not saturate for both the devices. The Jph,SC/Jph,sat value (Jph,SC is the Jph under short-circuit condition, Jph,sat is the Jph at saturation) is used to evaluate the charge collection process in the OSC device.54 The Jph,SC/Jph,sat values (the Jph at Veff of 7 V was selected as Jph,sat here) for the IID-IC and IID-IC-O based devices are 60.6% and 69.5%, respectively.44 This suggests that the charge collection is enhanced for the IID-IC-O-based device. The relationship between JSC and light intensity (P) could be described as JSC ∝ Pα, where α is the power-law exponent. If all the charges are swept out and efficiently collected by the electrodes, α should be equal to 1, while α < 1 means the existence of bimolecular recombination. As shown in Fig. 5b, the α value for the IID-IC-O-based device is 0.99, which is higher than that (α = 0.94) for the IID-IC-based device.44 It suggests that the bimolecular recombination is suppressed for the IID-IC-O-based device compared to the IID-IC-based device. The improved charge generation and collection, and reduced charge recombination agree well with the higher device performance of the IID-IC-O-based device.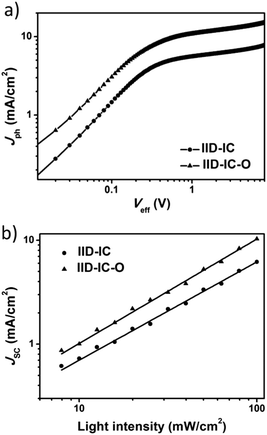 | ||
| Fig. 5 (a) Jphversus Veff plots; (b) dependence of JSC on light intensity for OSCs based on J61:IID-IC and J61:IID-IC-O. | ||
Film morphology
The morphology of the J61:IID-IC-O and J61:IID-IC blends was studied by atomic force microscopy (AFM). The height images of the two blends are shown in Fig. S10a and c (ESI†). The J61:IID-IC blend film shows small domains with a low root-mean-square (RMS) roughness of 1.98 nm,44 while the J61:IID-IC-O blend film exhibits relative larger domains and a higher RMS roughness of 3.97 nm. This is consistent with the larger phase separation size in the phase images (Fig. S10b and d, ESI†).44 The increased phase-separation may be due to the increased aggregation of IID-IC-O caused by the more planar molecular backbone, and this aggregation also facilitates the electron transport in the active layer. Photoluminescence (PL) spectroscopy was employed to study the exciton dissociation behavior in the blends (Fig. S11, ESI†). For the blend films, the PL quenching efficiency of IID-IC is 90% while the PL quenching efficiency of IID-IC-O is 84% when using the photo excitation at 600 nm. The reduced PL quenching efficiency in the J61:IID-IC-O blend film indicates the formation of a coarser morphology with increased phase separation, which are coincident well with those of AFM tests.Conclusions
In summary, we have developed a new A–D–A′–D–A type small molecule acceptor, IID-IC-O, with alkoxyl substitutes as the side chains. Compared with the control molecule with alkyl substitutes, IID-IC-O exhibits greatly upshifted HOMO energy level and improved backbone planarity, and consequently an obvious redshift of absorption spectrum. IID-IC-O shows a wide absorption spectrum spanning from 300 nm to 890 nm and a small bandgap of 1.39 eV. The OSC device of IID-IC-O exhibits a PCE of 4.20% with wide photoresponse from 300 nm to 900 nm. Our results indicate superior light harvesting capability of rationally designed organic molecules, which may be applicable for many solar energy-related applications beyond OSCs.Experimental
Materials and instruments
All chemicals and reagents were purchased from commercial sources and used as received unless otherwise mentioned. Toluene, tetrahydrofuran and chloroform were dried using sodium or calcium hydroxide before use. 1H and 13C NMR spectra were measured using a Bruker AV-400 MHz NMR spectrometer. Mass spectra were measured on a Bruker Daltonics Flex matrix-assisted laser desorption ionization time of flight mass spectrometer (MALDI-TOF-MS). Elemental analysis was recorded on a VarioEL elemental analyzer. Thermal analysis was performed on a Perkin–Elmer 7 instrument under nitrogen flow at a heating rate of 10 °C min−1. UV-vis absorption spectra were measured with a Shimadzu UV-3600 spectrometer in spectral grade solvent. Cyclic voltammetry (CV) was performed on a CHI660a electrochemical workstation using Bu4NClO4 (0.1 mol L−1) in acetonitrile as electrolyte solution and ferrocene as an internal reference at a scan rate of 100 mV s−1. The CV cell consisted of a Pt wire counter electrode, a glassy carbon electrode, and a standard calomel reference electrode. The small molecules were cast on the working electrode for measurements. The ferrocene/ferrocenium (Fc/Fc+) couple was used as an internal standard, which was assigned an absolute energy of −4.80 eV. The HOMO/LUMO energy levels of the material were estimated by the equations: EHOMO/LUMO = −(4.80 + Eoxonset/Eredonset) eV. Atomic force microscopy (AFM) was performed with an SPA300HV (Seiko Instruments, Inc., Japan) in tapping mode. The thickness of various layers was measured by a step profiler with a Dektak 6M Stylus Profile. The out-of-plane grazing incidence X-ray diffraction (GI-XRD) was measured on a Rigaku SmartLab X-ray diffractometer with an X-ray generation power of 40 kV tube voltage and 30 mA tube current. Photoluminescence (PL) was measured using an FL3-KIT (Horiba Instruments Inc., USA).OSC device fabrication and measurement
The device architecture was ITO/PEDOT:PSS/J61:IID-IC-O/Ca/Al. IID-IC-O was used as an electron acceptor. J61 was purchased from Solarmer materials, Inc, with the number-average molecular weight (Mn) of 24900 and polydispersity index of 2.37. Indium tin oxide (ITO) glass substrates were cleaned by sequential ultrasonication in deionized water, acetone, and isopropyl alcohol, followed by drying at 120 °C for 0.5 h and treatment with UV-ozone for 0.5 h. Then PEDOT:PSS (Baytron PVP Al 4083) was spin-coated on the ITO glass substrates at 5000 rpm for 40 s to give a thickness of 40 nm, followed by baking at 120 °C for 0.5 h. The substrates were transferred to a nitrogen-filled glove box. The blend was spin-coated onto the PEDOT:PSS layer to produce the active layer. The blend ratio was 1![[thin space (1/6-em)]](https://www.rsc.org/images/entities/char_2009.gif) :
:![[thin space (1/6-em)]](https://www.rsc.org/images/entities/char_2009.gif) 1.3 (w
1.3 (w![[thin space (1/6-em)]](https://www.rsc.org/images/entities/char_2009.gif) :
:![[thin space (1/6-em)]](https://www.rsc.org/images/entities/char_2009.gif) w) for J61:IID-IC-O in o-DCB solution. The active layer of the J61:IID-IC-O blend was annealed at 160 °C for 10 min. Finally, the active layer was transferred to a vacuum chamber, and Ca (20 nm) and Al (100 nm) were deposited by thermal evaporation at the pressure of about 2 × 10⁻⁴ Pa. The active area of each device was 8 mm2. The current density (J–V) curves of the OSC devices were measured using a computer-controlled Keithley 2400 source meter under 100 mW cm−2 AM 1.5G simulated solar light illumination provided by an XES-40S2-CE Class Solar Simulator (Japan, SAN-EI Electric Co., Ltd). The EQE spectra were measured using a Solar Cell Spectral Response Measurement System QE-R3011 (Enlitech Co., Ltd). The light intensity at each wavelength was calibrated using a calibrated monosilicon diode.
w) for J61:IID-IC-O in o-DCB solution. The active layer of the J61:IID-IC-O blend was annealed at 160 °C for 10 min. Finally, the active layer was transferred to a vacuum chamber, and Ca (20 nm) and Al (100 nm) were deposited by thermal evaporation at the pressure of about 2 × 10⁻⁴ Pa. The active area of each device was 8 mm2. The current density (J–V) curves of the OSC devices were measured using a computer-controlled Keithley 2400 source meter under 100 mW cm−2 AM 1.5G simulated solar light illumination provided by an XES-40S2-CE Class Solar Simulator (Japan, SAN-EI Electric Co., Ltd). The EQE spectra were measured using a Solar Cell Spectral Response Measurement System QE-R3011 (Enlitech Co., Ltd). The light intensity at each wavelength was calibrated using a calibrated monosilicon diode.
Conflicts of interest
There are no conflicts to declare.Acknowledgements
The authors are grateful for the financial support by the National Key Basic Research and Development Program of China (973 program, Grant No. 2015CB655001) Founded by MOST, the National Natural Science Foundation of China (No. 21625403, 21875244, 51603203, and 21875241), the Jilin Scientific and Technological Development Program (No. 20170519003JH), the Strategic Priority Research Program of Chinese Academy of Sciences (No. XDB12010200) and a project supported by State Key Laboratory of Luminescence and Applications (SKLA-2016-02).Notes and references
- Y. Li, Acc. Chem. Res., 2012, 45, 723–733 CrossRef CAS PubMed.
- L. Lu, T. Zheng, Q. Wu, A. M. Schneider, D. Zhao and L. Yu, Chem. Rev., 2015, 115, 12666–12731 CrossRef CAS PubMed.
- R. Søndergaard, M. Hösel, D. Angmo, T. T. Larsen-Olsen and F. C. Krebs, Mater. Today, 2012, 15, 36–49 CrossRef.
- L. Zuo, S. Zhang, M. Shi, H. Li and H. Chen, Mater. Chem. Front., 2017, 1, 304–309 RSC.
- X. Gu, Y. Zhou, K. Gu, T. Kurosawa, Y. Guo, Y. Li, H. Lin, B. C. Schroeder, H. Yan, F. Molina-Lopez, C. J. Tassone, C. Wang, S. C. B. Mannsfeld, H. Yan, D. Zhao, M. F. Toney and Z. Bao, Adv. Energy Mater., 2017, 7, 1602742 CrossRef.
- G. Yu, J. Gao, J. C. Hummelen, F. Wudl and A. J. Heeger, Science, 1995, 270, 1789–1791 CrossRef CAS.
- N. Liang, W. Jiang, J. Hou and Z. Wang, Mater. Chem. Front., 2017, 1, 1291–1303 RSC.
- G. Zhang, J. Zhao, P. C. Y. Chow, K. Jiang, J. Zhang, Z. Zhu, J. Zhang, F. Huang and H. Yan, Chem. Rev., 2018, 118, 3447–3507 CrossRef CAS PubMed.
- B. Fan, L. Ying, Z. Wang, B. He, X.-F. Jiang, F. Huang and Y. Cao, Energy Environ. Sci., 2017, 10, 1243–1251 RSC.
- D. Deng, Y. Zhang, J. Zhang, Z. Wang, L. Zhu, J. Fang, B. Xia, Z. Wang, K. Lu, W. Ma and Z. Wei, Nat. Commun., 2016, 7, 13740 CrossRef CAS PubMed.
- R. Zhao, C. Dou, J. Liu and L. Wang, Chin. J. Polym. Sci., 2017, 35, 198–206 CrossRef CAS.
- F. Liu, Z. Ding, J. Liu and L. Wang, Chem. Commun., 2017, 53, 12213–12216 RSC.
- J. Miao, H. Xu, B. Meng, J. Liu and L. Wang, Chin. J. Chem., 2018, 36, 411–416 CrossRef CAS.
- C. Dou, J. Liu and L. Wang, Sci. China: Chem., 2017, 60, 450–459 CrossRef CAS.
- X. Long, Z. Ding, C. Dou, J. Zhang, J. Liu and L. Wang, Adv. Mater., 2016, 28, 6504–6508 CrossRef CAS PubMed.
- W. Zhao, D. Qian, S. Zhang, S. Li, O. Inganäs, F. Gao and J. Hou, Adv. Mater., 2016, 28, 4734–4739 CrossRef CAS PubMed.
- B. Meng, Y. Ren, J. Liu, F. Jäkle and L. Wang, Angew. Chem., Int. Ed., 2018, 130, 2205–2209 CrossRef.
- F. Yang, C. Li, W. Lai, A. Zhang, H. Huang and W. Li, Mater. Chem. Front., 2017, 1, 1389–1395 RSC.
- L. Meng, Y. Zhang, X. Wan, C. Li, X. Zhang, Y. Wang, X. Ke, Z. Xiao, L. Ding, R. Xia, H.-L. Yip, Y. Cao and Y. Chen, Science, 2018, 361, 1094–1098 CrossRef CAS PubMed.
- Z. Xiao, X. Jia and L. Ding, Sci. Bull., 2017, 62, 1562–1564 CrossRef CAS.
- Y. Zhang, B. Kan, Y. Sun, Y. Wang, R. Xia, X. Ke, Y.-Q.-Q. Yi, C. Li, H.-L. Yip, X. Wan, Y. Cao and Y. Chen, Adv. Mater., 2018, 30, 1707508 CrossRef PubMed.
- S. Li, L. Ye, W. Zhao, H. Yan, B. Yang, D. Liu, W. Li, H. Ade and J. Hou, J. Am. Chem. Soc., 2018, 140, 7159–7167 CrossRef CAS PubMed.
- J.-H. Yum, E. Baranoff, S. Wenger, M. K. Nazeeruddin and M. Grätzel, Energy Environ. Sci., 2011, 4, 842–857 RSC.
- S. M. McAfee, J. M. Topple, A.-J. Payne, J.-P. Sun, I. G. Hill and G. C. Welch, ChemPhysChem, 2015, 16, 1190–1202 CrossRef CAS PubMed.
- F. Liang, F. Shi, Y. Fu, L. Wang, X. Zhang, Z. Xie and Z. Su, Sol. Energy Mater. Sol. Cells, 2010, 94, 1803–1808 CrossRef CAS.
- S. M. McAfee, J. M. Topple, J.-P. Sun, I. G. Hill and G. C. Welch, RSC Adv., 2015, 5, 80098–80109 RSC.
- S. M. McAfee, S. V. Dayneko, A. D. Hendsbee, P. Josse, P. Blanchard, C. Cabanetos and G. C. Welch, J. Mater. Chem. A, 2017, 5, 11623–11633 RSC.
- L. Dou, Y. Liu, Z. Hong, G. Li and Y. Yang, Chem. Rev., 2015, 115, 12633–12665 CrossRef CAS PubMed.
- H. Yao, Y. Cui, R. Yu, B. Gao, H. Zhang and J. Hou, Angew. Chem., Int. Ed., 2017, 56, 3045–3049 CrossRef CAS PubMed.
- Z. Liang, M. Li, X. Zhang, Q. Wang, Y. Jiang, H. Tian and Y. Geng, J. Mater. Chem. A, 2018, 6, 8059–8067 RSC.
- Y. Guo, A. Zhang, C. Li, W. Li and D. Zhu, Chin. Chem. Lett., 2018, 29, 371–373 CrossRef CAS.
- M. Privado, V. Cuesta, P. de la Cruz, M. L. Keshtov, G. D. Sharma and F. Langa, J. Mater. Chem. A, 2017, 5, 14259–14269 RSC.
- Y. Li, J.-D. Lin, X. Che, Y. Qu, F. Liu, L.-S. Liao and S. R. Forrest, J. Am. Chem. Soc., 2017, 139, 17114–17119 CrossRef CAS PubMed.
- Z. Yao, X. Liao, K. Gao, F. Lin, X. Xu, X. Shi, L. Zuo, F. Liu, Y. Chen and A. K. Y. Jen, J. Am. Chem. Soc., 2018, 140, 2054–2057 CrossRef CAS PubMed.
- Y. Lin, J. Wang, Z.-G. Zhang, H. Bai, Y. Li, D. Zhu and X. Zhan, Adv. Mater., 2015, 27, 1170–1174 CrossRef CAS PubMed.
- J. Hou, O. Inganäs, R. H. Friend and F. Gao, Nat. Mater., 2018, 17, 119–128 CrossRef CAS PubMed.
- G. Zhang, G. Yang, H. Yan, J.-H. Kim, H. Ade, W. Wu, X. Xu, Y. Duan and Q. Peng, Adv. Mater., 2017, 29, 1606054 CrossRef PubMed.
- H. Fan, T. Vergote, S. Xu, S. Chen, C. Yang and X. Zhu, Mater. Chem. Front., 2018, 2, 760–767 RSC.
- B. Jang, C. Lee, Y. W. Lee, D. Kim, M. A. Uddin, F. S. Kim, B. J. Kim and H. Y. Woo, Chin. J. Chem., 2018, 36, 199–205 CrossRef CAS.
- X. Shi, J. Chen, K. Gao, L. Zuo, Z. Yao, F. Liu, J. Tang and A. K.-Y. Jen, Adv. Energy Mater., 2018, 8, 1702831 CrossRef.
- T. J. Aldrich, S. M. Swick, F. S. Melkonyan and T. J. Marks, Chem. Mater., 2017, 29, 10294–10298 CrossRef CAS.
- W. Li, L. Ye, S. Li, H. Yao, H. Ade and J. Hou, Adv. Mater., 2018, 30, 1707170 CrossRef PubMed.
- S. Dai, F. Zhao, Q. Zhang, T.-K. Lau, T. Li, K. Liu, Q. Ling, C. Wang, X. Lu, W. You and X. Zhan, J. Am. Chem. Soc., 2017, 139, 1336–1343 CrossRef CAS PubMed.
- J. Miao, B. Meng, J. Liu and L. Wang, Chem. Commun., 2018, 54, 303–306 RSC.
- H. Yao, Y. Chen, Y. Qin, R. Yu, Y. Cui, B. Yang, S. Li, K. Zhang and J. Hou, Adv. Mater., 2016, 28, 8283–8287 CrossRef CAS PubMed.
- S. Li, L. Ye, W. Zhao, S. Zhang, H. Ade and J. Hou, Adv. Energy Mater., 2017, 7, 1700183 CrossRef.
- X. Chen, Z. Zhang, Z. Ding, J. Liu and L. Wang, Angew. Chem., Int. Ed., 2016, 128, 10532–10536 CrossRef.
- H. Huang, L. Yang, A. Facchetti and T. J. Marks, Chem. Rev., 2017, 117, 10291–10318 CrossRef CAS PubMed.
- Y. Liu, Z. Zhang, S. Feng, M. Li, L. Wu, R. Hou, X. Xu, X. Chen and Z. Bo, J. Am. Chem. Soc., 2017, 139, 3356–3359 CrossRef CAS PubMed.
- L. Lv, X. Wang, T. Dong, X. Wang, X. Wu, L. Yang and H. Huang, Mater. Chem. Front., 2017, 1, 1317–1323 RSC.
- H. Huang, Z. Chen, R. P. Ortiz, C. Newman, H. Usta, S. Lou, J. Youn, Y.-Y. Noh, K.-J. Baeg, L. X. Chen, A. Facchetti and T. Marks, J. Am. Chem. Soc., 2012, 134, 10966–10973 CrossRef CAS PubMed.
- H. Bin, Z.-G. Zhang, L. Gao, S. Chen, L. Zhong, L. Xue, C. Yang and Y. Li, J. Am. Chem. Soc., 2016, 138, 4657–4664 CrossRef CAS PubMed.
- Q. An, W. Gao, F. Zhang, J. Wang, M. Zhang, K. Wu, X. Ma, Z. Hu, C. Jiao and C. Yang, J. Mater. Chem. A, 2018, 6, 2468–2475 RSC.
- S. R. Cowan, N. Banerji, W. L. Leong and A. J. Heeger, Adv. Funct. Mater., 2012, 22, 1116–1128 CrossRef CAS.
- Bing Xu, Sangtaik Noh and Barry C. Thompson, Macromolecules, 2014, 47, 5029–5039 CrossRef CAS.
Footnote |
| † Electronic supplementary information (ESI) available: 1H and 13C NMR, TGA measurement, DFT calculations, charge mobility measurements, film morphology and PL measurements. See DOI: 10.1039/c8qm00441b |
| This journal is © the Partner Organisations 2018 |

