 Open Access Article
Creative Commons Attribution 3.0 Unported Licence
Tailoring dielectric properties using designed polymer-grafted ZnO nanoparticles in silicone rubber†
Martin
Wåhlander
 a,
Fritjof
Nilsson
a,
Richard L.
Andersson
a,
Fritjof
Nilsson
a,
Richard L.
Andersson
 a,
Carmen Cobo
Sanchez
a,
Nathaniel
Taylor
a,
Carmen Cobo
Sanchez
a,
Nathaniel
Taylor
 b,
Anna
Carlmark
 a,
Henrik
Hillborg
ac and
Eva
Malmström
 *a
*a
aSchool of Chemical Science and Engineering, Department of Fibre and Polymer Technology, KTH Royal Institute of Technology, SE-100 44 Stockholm, Sweden. E-mail: mavem@kth.se
bSchool of Electrical Engineering, Department of Electromagnetic Engineering, KTH Royal Institute of Technology, SE-100 44 Stockholm, Sweden
cABB AB, Corporate Research, Power Technology, SE-721 78 Västerås, Sweden
First published on 2nd June 2017
Abstract
Polymer grafts were used to tailor the interphases between ZnO nanoparticles (NPs) and silicone matrices. The final electrical properties of the nanocomposites were tuned by the grafted interphases, by controlling the inter-particle distance and the NP-morphology. The nanocomposites can be used in electrical applications where control of the resistivity is desired. Hansen's solubility parameters were used to select a semi-compatible polymer for grafting to obtain anisotropic NP morphologies in silicone, and the grafted NPs self-assembled into various morphologies inside the silicone matrices. The morphologies in the semi-compatible nanocomposites could be tuned by steering the graft length of poly(n-butyl methacrylate) via entropic matrix-graft wetting using surface-initiated atom-transfer radical polymerization. Image analysis models were developed to calculate the radius of primary NPs, the fraction of aggregates, the dispersion, and the face-to-face distance of NPs. The dielectric properties of the nanocomposites were related to the morphology and the face-to-face distance of the NPs. The dielectric losses, above 100 Hz, for nanocomposites with grafted NPs were approximately one decade lower than those of pristine NPs. The isotropic nanocomposites increased the resistivity up to 100 times compared to that of neat silicone rubber, due to the trapping of charge carriers by the interphase of dispersed NPs and nanoclusters. On the other hand, the resistivity of anisotropic nanocomposites decreased 10–100 times when the inter-particle distance in continuous agglomerates was close to the hopping distance of charge carriers. The electrical breakdown strength increased for compatible isotropic nanocomposites, and the temperature dependence of the resistivity and the activation energy were ∼50% lower in the nanocomposites with grafted NPs. These flexible dielectric nanocomposites are promising candidates for low-loss high-voltage transmission cable accessories, mobile electronic devices, wearables and sensors.
1. Introduction
A sustainable society requires renewable generation of electric power and reduced energy consumption via improved energy efficiency. More efficient electrical insulation systems need a range of mechanical and electrical properties. Tailored materials are of interest for specific applications, leading to components with smaller size, and better reliability and efficiency. This is of current importance, for example for integrating distant renewable energy resources. Polymeric materials are being used as the main insulation of power cables, cable accessories and cable joints. They are also found as insulation in generators and motors. Further, flexible polymer nanocomposites are being considered as insulation materials for mobile electronic devices, so-called wearables, since they are known to be durable and elastic, and to have potentially tunable properties.1–3 Nanoparticles (NPs) are especially interesting as they might exhibit different or additional features than their corresponding bulk phase.4 Nanocomposites containing SiO2 nanoparticles (NPs), grown in situ in polyester-amide,5 or dispersed in polyester6 or polyamide-imide,7 show excellent resistance against partial discharges and are used as insulation for electrical motors. The addition of SiO2, TiO2 or MgO NPs to polyethylene (PE) resulted in cable-insulation materials with higher electric breakdown strength8,9 or reduced space-charge accumulation.10 More recently, Hedenqvist et al.11 and Olsson et al.12 have reported the efficient trapping of charge carriers by the interphases of ZnO and MgO nanoclusters in low-density PE, which increased the resistivity by one or two decades at low filling ratios (3 wt%). Previously, Wang et al.13 demonstrated that silicone rubbers filled with reduced graphene oxide (rGO) exhibited a non-linear increase in conductivity with increasing electrical field and that the composites exhibited lower conductivity compared to the neat silicone rubber matrix at low fields. These properties were tailored by varying the oxidation state and volume fraction of rGO. Thus, the dielectric properties of nanocomposites strongly depend on the dispersion of NPs and their percolation point, as well as on the interface and the interphase of the NPs. It is therefore desirable to control the surface characteristics of the NPs.Significant efforts have been made to control the surface chemistry of NPs using Surface-Initiated Reversible Deactivation Radical Polymerization (SI-RDRP) techniques,14–16 including Surface-Initiated Atomic Transfer Radical Polymerization (SI-ATRP17–25) and others.16,26–30 The task of controlling the surface chemistry of the NPs has recently been expanded from obtaining merely well-dispersed systems to being able to arrange the NPs in various self-assembled morphologies.31–33 The grafting density (σ), the curvature of the NP (α), and the ratio NM/Ng (where NM and Ng are respectively the degrees of polymerization of the polymer matrix and of the grafts) are three parameters entropically related to the wetting of the grafts by the matrix and thus to the NP morphology in the nanocomposite. In homopolymer nanocomposites, the entropic parameters are known to determine the formation of spherical aggregates, strings, sheets, phase-separation or well-dispersed particles in the matrix.32–35 On the other hand, the wetting of two different types of polymers in a “multi-polymer” nanocomposite is strongly affected, or even dominated, by enthalpic interactions (including the Flory–Huggins parameter (χ) and the graft penetration).36–38 Due to the increasing complexity of the enthalpic compatibility of grafts and matrix, anisotropic particle morphologies of multi-polymer nanocomposites have received little attention experimentally and are therefore not as well understood as homopolymer nanocomposites.32 However, by using Hansen's solubility parameters (HSPs), the enthalpic compatibility (solubility) of polymers can be described in an elegant and reasonably simple way, with the advantage of including specific interactions, such as hydrogen-bonds, intermolecular dipolar forces and dispersion forces.39 HSPs are usually used to predict the behaviour of polymers or NPs in different solvents,40 but in this study they have been used to describe the compatibility between the graft and the matrix, to assess the ability of the polymeric matrix to entangle with semi-compatible polymer grafts.
In the current study, we aim at investigating the possibility to tune the electrical properties of nanocomposites by tailoring the interphase of ZnO NPs. We designed compatible and semi-compatible nanocomposite systems by the use of HSPs. The nanocomposites were composed of highly pure, commercially available ZnO NPs grafted with poly(n-butyl methacrylate) with controlled graft lengths mixed with silicone elastomer matrices (PDMS or silicone rubber) commonly used as outdoor insulation of high-voltage components and cable joints, but of growing interest for soft electronics. We characterized inter-particle distances of annealed grafted ZnO NPs, various NP-morphologies in silicone matrices and how they depend on the NM/Ng and σ. Finally, we investigated how the morphology of NPs influenced the dielectric properties (e.g. resistivity, electric constant, and losses) below, at and above the glass transition temperature of the grafts (Tg ≈ 20 °C).41
2. Experimental methods
2.1 Materials
ZnO NPs produced by flame spray pyrolysis (NanoGard® manufactured by Nanophase®) were purchased as a white powder from Alfa Aesar® (Lancashire, UK) with a specific surface area of 16 m2 g−1 determined by BET, which corresponds to an average diameter of 67 nm, and a second ZnO nanopowder produced by wet-precipitation from a ZnO-salt precursor (MKN-ZnO-030) was purchased from MKnano® (Mississauga, Canada) with an average particle diameter of 30 nm. The purity and dielectric properties of the two types of ZnO NPs are compared in the ESI†. Polydimethylsiloxane (PDMS, Mn: 62.7 kDa, visc: 10![[thin space (1/6-em)]](https://www.rsc.org/images/entities/char_2009.gif) 000 mPa s, 0.1 eq. vinyl), trimethylsiloxy-terminated cross-linker (poly((6.5%)methylhydrosiloxane-co-(93.5%)dimethylsiloxane), Mn = 1.9–2 kDa) and Pt-catalyst (0.001 M platinum(0)-1,3-divinyl-1,1,3,3-tetramethyl-disiloxane complex in silicone oil) were purchased from ABCR GmbH & Co (Karlsruhe, Germany). A Sylgard® 184 Silicone Elastomer Kit (A-component: (Mn ≈ 40 kDa, visc: 4000–6000 mPa s) and B-component: catalyst and cross-linker (Mn: 5 kDa, 1300 mPa s)) was purchased from Dow Corning. (3-Aminopropyl)triethoxysilane (APTES, 98%), 2-bromoisobutyryl bromide (α-BiB, 98%), ethyl-2-bromoisobutyryl bromide (E-BiB, 98%), copper(I) bromide (Cu(I)Br, 98%), copper(II) bromide (Cu(II)Br2, 99%), 4-(dimethyl amino) pyridine (DMAP, 99%), triethyl amine (TEA, 99%), 1,1,4,7,10,10-hexamethyltriethylenetetramine (HMTETA, 97%), tetrabutylammonium fluoride in tetrahydrofuran (TBAF, 1 M), potassium hydrogen phosphate (K2HPO4, 97%) and a ninhydrin test-kit (Kaiser-test) were used as received from Sigma Aldrich. n-Butyl methacrylate (BMA, 99%) was destabilized prior to use by passing it through a neutral Al2O3 column. Ethanol (EtOH, 96%), tetrahydrofuran (THF, analytical grade) and toluene (HPLC-grade) were used without further purification.
000 mPa s, 0.1 eq. vinyl), trimethylsiloxy-terminated cross-linker (poly((6.5%)methylhydrosiloxane-co-(93.5%)dimethylsiloxane), Mn = 1.9–2 kDa) and Pt-catalyst (0.001 M platinum(0)-1,3-divinyl-1,1,3,3-tetramethyl-disiloxane complex in silicone oil) were purchased from ABCR GmbH & Co (Karlsruhe, Germany). A Sylgard® 184 Silicone Elastomer Kit (A-component: (Mn ≈ 40 kDa, visc: 4000–6000 mPa s) and B-component: catalyst and cross-linker (Mn: 5 kDa, 1300 mPa s)) was purchased from Dow Corning. (3-Aminopropyl)triethoxysilane (APTES, 98%), 2-bromoisobutyryl bromide (α-BiB, 98%), ethyl-2-bromoisobutyryl bromide (E-BiB, 98%), copper(I) bromide (Cu(I)Br, 98%), copper(II) bromide (Cu(II)Br2, 99%), 4-(dimethyl amino) pyridine (DMAP, 99%), triethyl amine (TEA, 99%), 1,1,4,7,10,10-hexamethyltriethylenetetramine (HMTETA, 97%), tetrabutylammonium fluoride in tetrahydrofuran (TBAF, 1 M), potassium hydrogen phosphate (K2HPO4, 97%) and a ninhydrin test-kit (Kaiser-test) were used as received from Sigma Aldrich. n-Butyl methacrylate (BMA, 99%) was destabilized prior to use by passing it through a neutral Al2O3 column. Ethanol (EtOH, 96%), tetrahydrofuran (THF, analytical grade) and toluene (HPLC-grade) were used without further purification.
2.2 Synthesis
![[thin space (1/6-em)]](https://www.rsc.org/images/entities/char_2009.gif) :
:![[thin space (1/6-em)]](https://www.rsc.org/images/entities/char_2009.gif) 1 by vol.) and silanized using APTES prior to the immobilization of ATRP-initiators (α-BiB). The silanization procedure to obtain ZnO–APTES, and the subsequent immobilization procedure to obtain ZnO–Br, were both performed according to previous work42,43 and are described in more detail in the ESI.† The average amount of Br-groups was 0.021 μmol Br per mg of ZnO–Br, according to the mass loss detected by TGA.
1 by vol.) and silanized using APTES prior to the immobilization of ATRP-initiators (α-BiB). The silanization procedure to obtain ZnO–APTES, and the subsequent immobilization procedure to obtain ZnO–Br, were both performed according to previous work42,43 and are described in more detail in the ESI.† The average amount of Br-groups was 0.021 μmol Br per mg of ZnO–Br, according to the mass loss detected by TGA.
![[thin space (1/6-em)]](https://www.rsc.org/images/entities/char_2009.gif) :
:![[thin space (1/6-em)]](https://www.rsc.org/images/entities/char_2009.gif) 1
1![[thin space (1/6-em)]](https://www.rsc.org/images/entities/char_2009.gif) :
:![[thin space (1/6-em)]](https://www.rsc.org/images/entities/char_2009.gif) 0.8
0.8![[thin space (1/6-em)]](https://www.rsc.org/images/entities/char_2009.gif) :
:![[thin space (1/6-em)]](https://www.rsc.org/images/entities/char_2009.gif) 0.2
0.2![[thin space (1/6-em)]](https://www.rsc.org/images/entities/char_2009.gif) :
:![[thin space (1/6-em)]](https://www.rsc.org/images/entities/char_2009.gif) 0.9
0.9![[thin space (1/6-em)]](https://www.rsc.org/images/entities/char_2009.gif) :
:![[thin space (1/6-em)]](https://www.rsc.org/images/entities/char_2009.gif) 0.1 for [BMA]
0.1 for [BMA]![[thin space (1/6-em)]](https://www.rsc.org/images/entities/char_2009.gif) :
:![[thin space (1/6-em)]](https://www.rsc.org/images/entities/char_2009.gif) [HMTETA]
[HMTETA]![[thin space (1/6-em)]](https://www.rsc.org/images/entities/char_2009.gif) :
:![[thin space (1/6-em)]](https://www.rsc.org/images/entities/char_2009.gif) [CuBr]
[CuBr]![[thin space (1/6-em)]](https://www.rsc.org/images/entities/char_2009.gif) :
:![[thin space (1/6-em)]](https://www.rsc.org/images/entities/char_2009.gif) [CuBr2]
[CuBr2]![[thin space (1/6-em)]](https://www.rsc.org/images/entities/char_2009.gif) :
:![[thin space (1/6-em)]](https://www.rsc.org/images/entities/char_2009.gif) [E-BiB]
[E-BiB]![[thin space (1/6-em)]](https://www.rsc.org/images/entities/char_2009.gif) :
:![[thin space (1/6-em)]](https://www.rsc.org/images/entities/char_2009.gif) [ZnO–Br]. Dispersed ZnO–Br (∼0.4 g, 8.9 μmol Br) in 15 mL toluene was added to a 50 mL round-bottomed flask at 0 °C equipped with a rubber septum. BMA (10 mL, 63 mmol) was added to the flask together with HMTETA (24 μL, 90 μmol) and E-BiB (12 μL, 81 μmol). The mixture was degassed by two cycles of vacuum/backfilling with argon. Subsequently, Cu(I)Br (10 mg, 72 μmol) and Cu(II)Br2 (4.0 mg, 18 μmol) were added under argon flow, followed by degassing in two additional cycles of vacuum/argon. The polymerization was conducted at 60 °C in an oil bath, and quenched by letting air in and by cooling on an ice-bath. ZnO-g-PBMA was purified by five successive centrifugation/re-dispersion cycles, described in detail in the ESI.† The purified ZnO-g-PBMA was stored in THF. A fraction (∼100 mg) of ZnO-g-PBMA was dried in a vacuum oven at 50 °C overnight, and the dried ZnO-g-PBMA was characterized by FTIR, TGA, UV-Vis and TEM. The free PBMA was dissolved in THF and passed through a basic Al2O3-column to remove the Cu-catalyst and was dried in a vacuum oven at 50 °C and characterized by DMF-SEC. The PBMA grafts were cleaved from ZnO-g-PBMA using TBAF as a cleaving agent as in our previous work.42,43 A more detailed description of the cleaving procedure is presented in the ESI.†
[ZnO–Br]. Dispersed ZnO–Br (∼0.4 g, 8.9 μmol Br) in 15 mL toluene was added to a 50 mL round-bottomed flask at 0 °C equipped with a rubber septum. BMA (10 mL, 63 mmol) was added to the flask together with HMTETA (24 μL, 90 μmol) and E-BiB (12 μL, 81 μmol). The mixture was degassed by two cycles of vacuum/backfilling with argon. Subsequently, Cu(I)Br (10 mg, 72 μmol) and Cu(II)Br2 (4.0 mg, 18 μmol) were added under argon flow, followed by degassing in two additional cycles of vacuum/argon. The polymerization was conducted at 60 °C in an oil bath, and quenched by letting air in and by cooling on an ice-bath. ZnO-g-PBMA was purified by five successive centrifugation/re-dispersion cycles, described in detail in the ESI.† The purified ZnO-g-PBMA was stored in THF. A fraction (∼100 mg) of ZnO-g-PBMA was dried in a vacuum oven at 50 °C overnight, and the dried ZnO-g-PBMA was characterized by FTIR, TGA, UV-Vis and TEM. The free PBMA was dissolved in THF and passed through a basic Al2O3-column to remove the Cu-catalyst and was dried in a vacuum oven at 50 °C and characterized by DMF-SEC. The PBMA grafts were cleaved from ZnO-g-PBMA using TBAF as a cleaving agent as in our previous work.42,43 A more detailed description of the cleaving procedure is presented in the ESI.†
2.2.3.1 1.5 vol% ZnO NPs in PDMS elastomer. Vinyl-terminated PDMS was used as laboratory grade silicone resin. Suspended or dry ZnO NPs (1.5 vol% ≈ 8.4 wt% inorganic content) were mixed with the PDMS at 70 °C for 2–3 days, while the solvent was removed. Thereafter, the trimethylsiloxy terminated cross-linker was added in small excess together with the Pt-catalyst. The PDMS and cross-linker were mixed in a ratio of 92.3
![[thin space (1/6-em)]](https://www.rsc.org/images/entities/char_2009.gif) :
:![[thin space (1/6-em)]](https://www.rsc.org/images/entities/char_2009.gif) 7.7 wt% with a few drops (∼20 mg) of catalyst.
7.7 wt% with a few drops (∼20 mg) of catalyst.
2.2.3.2 2.5 vol% ZnO NPs in silicone rubber. Sylgard® 184 was used as a commercial grade of silicone rubber as it contains fumed silica. In general, the A-component was mixed with 2.5 vol% (≈14 wt%) suspended or dry ZnO NPs (excluding the coating). The mixture was left at 70 °C for 2–3 days before curing by mixing with the B-component containing the cross-linker and the Pt-catalyst, the ratio of A to B being 10
![[thin space (1/6-em)]](https://www.rsc.org/images/entities/char_2009.gif) :
:![[thin space (1/6-em)]](https://www.rsc.org/images/entities/char_2009.gif) 1.
1.
2.3 Models and methods
| Ra2 = 4(δD1 − δD2)2 + (δP1 − δP2)2 + (δH1 − δH2)2 | (1) |
The relative energy difference (RED) of the system is obtained by dividing Ra by R0. If RED < 1 the polymers are compatible, if RED = 1 the polymers are semi-compatible and if RED > 1 the polymers are incompatible. A table with HSP values for silicone, ZnO, PBMA and THF are presented in the ESI (Table S1†).
(A) The fraction of agglomerates (θagglo,A) was obtained by identifying all NPs with a radius larger than a cut-off radius defined as twice the predefined radius (〈r0A〉) of the primary NPs (i.e. rcutoff = 2〈r0A〉), calculating the area of these agglomerates and normalizing by dividing by the total area of all the NPs. When θagglo,A = 0%, no agglomeration is observed, while θagglo,A = 100% means that all the primary NPs are agglomerated. If the size distribution of the primary NPs is relatively low, this method provides a good estimate of the fraction of agglomerates greater than rcutoff.
(B) A second fraction of agglomerates was obtained from the radius distribution curve. An estimate of the “mean radius” of the primary NPs (〈r0B〉) was obtained as the radius of the highest (and usually first) peak of the bootstrapped radius distribution histogram. The data-points below 〈r0A〉 were mirror-imaged, and a bell-shaped first order Gaussian function was fitted to the data. This Gaussian fit often corresponds to the size distribution of primary NPs. A second order Gaussian fit was also added, corresponding to small agglomerates. The areas of primary NPs (Aprim) and of small agglomerates (Asmall) as well as the total area (Atot) were calculated as:
 | (2) |
(C) The relative cluster size was obtained by calculating the “average radius” (〈r〉) in the micrographs and dividing by the “mean radius” of primary NPs (〈r0B〉, from method B) giving the relative average radius rrel,B = 〈r〉/〈r0B〉. If rrel,B is close to or equal to 1, less agglomeration is present, while a higher rrel,B-value indicates more agglomeration. This strategy is robust, relatively easy to implement and does not use any arbitrary model parameters. However, in the case of homogeneously sized nanoclusters and very few primary NPs, the rrel,B value underestimates the ratio of agglomerates. Therefore, it is valuable to compare rrel,B with rrel,A = 〈r〉/〈r0A〉. Method C is considered more reliable than the methods A and B when most clusters are slightly larger than or slightly smaller than the rcutoff.
(D) The face-to-face (or centre-to-centre) 2D-distances between NPs were compared to the corresponding theoretical distances for randomly positioned, dispersed spheres. The latter distances were calculated on 2D-slices cut from Monte-Carlo generated 3D-geometries of composites with non-intersecting, randomly positioned spherical fillers.42 The theoretical (2D) centre-to-centre distance for a system with equally sized particles with diameter 1 is described as a function of volume filler fraction ϕ as
 | (3) |
where the subscript i corresponds to the ith neighbour. The values used were a = 131.57, b = 73![[thin space (1/6-em)]](https://www.rsc.org/images/entities/char_2009.gif) 978, c = 0.5622, d = 0.5353 for the nearest neighbour and a = 509.02, b = 30
978, c = 0.5622, d = 0.5353 for the nearest neighbour and a = 509.02, b = 30![[thin space (1/6-em)]](https://www.rsc.org/images/entities/char_2009.gif) 746, c = 0.4994, d = 0.01020 for the 51st nearest neighbor.42 To obtain distances for systems with particle diameters other than 1, Dcci1(ϕ) was multiplied by the diameter of the primary NPs. When method B is used to calculate the radius of the primary NPs, the theoretical centre-to-centre distance thus becomes Ďcci,B = 2〈r0B〉Dcci1(ϕ) and the theoretical face-to-face distance is Ďffi,B = Ďcci − 2〈r0B〉.
746, c = 0.4994, d = 0.01020 for the 51st nearest neighbor.42 To obtain distances for systems with particle diameters other than 1, Dcci1(ϕ) was multiplied by the diameter of the primary NPs. When method B is used to calculate the radius of the primary NPs, the theoretical centre-to-centre distance thus becomes Ďcci,B = 2〈r0B〉Dcci1(ϕ) and the theoretical face-to-face distance is Ďffi,B = Ďcci − 2〈r0B〉.
If the primary NPs are clearly distinguishable, the ratio Δcci,B = 〈Dcci〉/Ďcci,B of the distance 〈Dcci〉 and the analytical distance Ďcci,B will decrease with decreasing dispersion, but if the primary NPs within the agglomerates are not treated as separated, Δcci,B will instead increase with decreasing dispersion. This can be handled by introducing the cut-off radius (rcutoff) from method A and treating the observed NPs with a radius larger than rcutoff as clusters of adjacent NPs on a honey comb lattice.12 All the distances and the average radius are then recalculated. With this adjustment, a value of the ratio Δcci,D less than 1 corresponds to a poorer dispersion, while a value of Δcci,D greater than 1 corresponds to a better dispersion. The same applies for the new face-to-face ratio Δffi,B. When experimental distances are compared with theoretical, it is important to use the volume filler fraction (ϕ) calculated from the micrograph to avoid systematic errors introduced due to visibility differences of NPs in cross-sections, deposited or microtomed samples.
2.4 Instrumentation and characterization methods
Fourier Transform Infrared spectroscopy (FTIR, 4000–600 cm−1) was carried out with a Perkin-Elmer Spectrum 2000 FTIR instrument equipped with a MKII Golden Gate, single reflection ATR system (Specac Ltd, London, UK). The ATR-crystal was a MKII heated diamond 45° ATR top-plate.A Kaiser-test kit, containing phenol (∼80% in ethanol), potassium cyanide in H2O![[thin space (1/6-em)]](https://www.rsc.org/images/entities/char_2009.gif) :
:![[thin space (1/6-em)]](https://www.rsc.org/images/entities/char_2009.gif) pyridine, and ninhydrin (6% in ethanol), was used to determine the concentration of primary amines on ZnO–APTES using a Cary UV-Vis Spectrophotometer with CaryWinUV software detecting the absorbance at 576 nm, which is associated with the amine–ninhydrin-complex concentration.44,45
pyridine, and ninhydrin (6% in ethanol), was used to determine the concentration of primary amines on ZnO–APTES using a Cary UV-Vis Spectrophotometer with CaryWinUV software detecting the absorbance at 576 nm, which is associated with the amine–ninhydrin-complex concentration.44,45
Thermogravimetric analysis (TGA) was performed on a Mettler Toledo TGA/DSC1, using STARe software to process the data. The samples were heated from 50 to 700 °C in ceramic cups at a rate of 10 °C min−1 in N2 (flow rate 50 mL min−1).
Transmission electron microscopy (TEM) of ZnO NPs was performed using a Hitachi HT7700 TEM at 100 kV accelerating voltage. Diluted suspensions (<0.1 mg mL−1) of unmodified or modified NPs in EtOH or THF were applied on ultrathin carbon-coated copper grids (Ted Pella, Inc.) and examined in the microscope after drying.
A Hitachi S-4800 field emission scanning and transmission electron microscope (SEM/STEM) was used to study cross-sections of composites prepared by freeze-fracturing in liquid nitrogen and dispersions of pristine and modified NPs applied onto ultrathin carbon coated copper grids (TED Pella, Inc.).
DMF-SEC was carried out using a TOSOH EcoSEC HLC-8320GPC system equipped with an EcoSEC RI detector, three columns (PSS PFG 5 μm; Microguard, 100 Å, and 300 Å) columns (Mw resolving range: 0.1–300 kDa) from PSS GmbH, using DMF (0.2 mL min−1) with 0.01 M LiBr as the mobile phase at 50 °C. A conventional calibration method was used utilizing poly(methyl methacrylate) standards. Corrections for flow rate fluctuations were applied using toluene as an internal standard. PSS WinGPCUnity software version 7.2 was used to process the data.
3. Results and discussion
The major advantage, as well as challenge, of NPs is the control of the chemistry of their large specific surface area. The manufacturing of pure NPs with a defined size and surface chemistry on a large scale is still a significant challenge. Today, a range of commercial ZnO NPs of various purities and surface reactivities are available, but the presence of organic remnants may affect any subsequent surface modification and thus the final properties of nanocomposites. Therefore, two types of commercially available ZnO NPs were compared (see the section “Comparison of commercial ZnO NPs” in the ESI†) and it was found that the organic content of ZnO NPs produced by flame-spray pyrolysis46 was 10 times less than that of ZnO NPs produced by salt-precipitation, which also contained residual salt-precursors47 detected by FTIR and TGA (Fig. S1 and S2†). Further, the resistivity of a silicone rubber with ZnO NPs containing salt-precursors and pure ZnO NPs was ∼1010 Ωm and ∼1014 Ωm, respectively (Fig. S3†). The chemically pure, non-porous and highly crystalline ZnO NPs produced by flame-spray pyrolysis were therefore selected for this study. Micrometer sized ZnO particles (and bulk ZnO) are known to be semi-conductors with properties depending on doping elements and grain-boundaries.48,49 However, flame-sprayed, highly pure ZnO NPs neither contain doping elements nor large grain-boundaries. Low filling fractions of pure metal-oxide NPs have significantly reduced the conductivity by the trapping of charge carriers.11,12 The trapping has mainly been attributed to “deep traps” on the NP-interface;50 the induction of dipoles;51 and the scattering or charge differences by the NP–polymer interphase.8,52 In this study, we designed the interphase of flame-sprayed pristine ZnO NPs46 by silanization and controlled polymer grafting in order to tune the dielectric properties of polymer nanocomposites.3.1 Detection of accessible amines of ZnO–APTES
ZnO NPs were silanized by aminopropyltriethoxysilane (APTES) (Fig. S4a†). The accessible primary amines of the silane coating were monitored by spectrophotometry (at 570 nm) through the formation of the Ruhemanns-Blue complex with ninhydrin, using the Kaiser-test (Fig. S4b†).44,45 The concentration of primary amines was shown to be directly related to the final graft density, as the ninhydrin-complex detects the most accessible amines.42 The amine density was calculated using Lambert–Beer's law as previously described by Malmström et al.42 and was found to be 0.08 ± 0.01 amines nm−2.3.2 Characterization of ZnO-g-PBMA and free PBMA
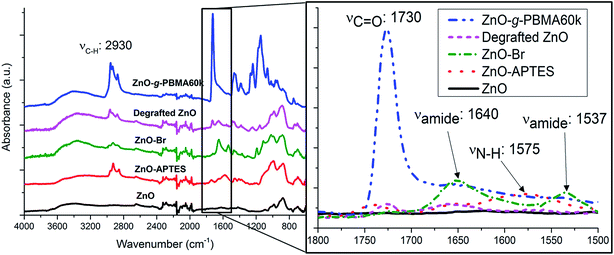
Prior to the controlled grafting of PBMA from ZnO NPs, ATRP-initiators were immobilized on the primary amines of ZnO–APTES by the formation of an amide-bond (ZnO–Br, Fig. 1) as described in previous reports (see the ESI†).42,43 In this study, the SI-ATRP grafting was conducted from the end group of ZnO–Br in the presence of a sacrificial initiator to allow fast and easy characterization of the polymerization (Fig. 1).The PBMA-grafts were cleaved and the degrafted NPs characterized by FTIR (Fig. 2). FTIR-spectra of ZnO–APTES, ZnO–Br and grafted ZnO NPs showed the absorbance peaks of amines, amides, and carboxyl groups or their absence in pristine and degrafted ZnO NPs at 1800–1500 cm−1 (Fig. 2 enlarged image) and the characteristic absorbance of C–H around 2930 cm−1, which confirms the successful surface modification of the NPs (Fig. 2).
According to TGA, the concentration of immobilized initiators on ZnO–Br was 0.021 μmol Br per mg of ZnO–Br, which is equal to 0.8 initiators nm−2. The concentration of initiators was ten times higher than the determined amount of available amines and can be explained by the greater accessibility of the initiators compared to that of the bulky ninhydrin-complex; the initiators are able to reach primary amines deeper inside the “gooey-layer” of silane, as suggested by Malmström et al.42
The free polymers were characterized by DMF-SEC and their average molar masses were compared to those of the cleaved chains (Table 1, Fig. S5 and S6†). The narrow dispersities indicate good control (Table 1). Free PBMA-chains were slightly longer and exhibited a slightly more narrow size distribution than the cleaved PBMA-grafts, in agreement with grafting from cellulose substrates.53
| Name of NPs | Free PBMA | Cleaved grafts | Calculated | |||
|---|---|---|---|---|---|---|
| M w (g mol−1) | Ð M | M w (g mol−1) | Ð M | M g (g mol−1) | N g | |
| ZnO-g-PBMA10k | 13![[thin space (1/6-em)]](https://www.rsc.org/images/entities/char_2009.gif) 000 000 |
1.18 | 9000 | 1.09 | 10![[thin space (1/6-em)]](https://www.rsc.org/images/entities/char_2009.gif) 000 000 |
70 |
| ZnO-g-PBMA50k | 54![[thin space (1/6-em)]](https://www.rsc.org/images/entities/char_2009.gif) 000 000 |
1.12 | 50![[thin space (1/6-em)]](https://www.rsc.org/images/entities/char_2009.gif) 000 000 |
1.19 | 47![[thin space (1/6-em)]](https://www.rsc.org/images/entities/char_2009.gif) 000 000 |
331 |
| ZnO-g-PBMA60k | 68![[thin space (1/6-em)]](https://www.rsc.org/images/entities/char_2009.gif) 000 000 |
1.17 | 60![[thin space (1/6-em)]](https://www.rsc.org/images/entities/char_2009.gif) 000 000 |
1.25 | 61![[thin space (1/6-em)]](https://www.rsc.org/images/entities/char_2009.gif) 000 000 |
429 |
| ZnO-g-PBMA80k | 101![[thin space (1/6-em)]](https://www.rsc.org/images/entities/char_2009.gif) 000 000 |
1.22 | 74![[thin space (1/6-em)]](https://www.rsc.org/images/entities/char_2009.gif) 000 000 |
1.30 | 83![[thin space (1/6-em)]](https://www.rsc.org/images/entities/char_2009.gif) 000 000 |
584 |
According to the thermograms, the content of volatile organics increased with each surface modification, and the mass-losses are displayed next to the sample names in Fig. S7.† The average graft density of ∼0.08 grafts nm−2 was confirmed from the correlation between the molar mass of cleaved grafts and the organic mass losses, and this is equal to a grafting efficiency of ∼10%. The calculated molar mass of grafts (Mg) and the degree of polymerization of the grafts (Ng) in Table 1 were obtained from the grafting density and the organic content according to eqn (S1) in the ESI.†
Finally, the band gaps of pristine ZnO, ZnO-g-PBMA10k and ZnO-g-PBMA60k (Table S2†) were calculated according to eqn (S2) in the ESI,† using the absorption peak obtained by UV-Vis spectroscopy, Fig. S8.† The tiny red-shift of grafted ZnO NPs indicated that the band gaps did not significantly change with surface grafting and thus remained constant at ∼3.3 eV.
3.3 Dispersion of ZnO, ZnO–APTES and ZnO-g-PBMA
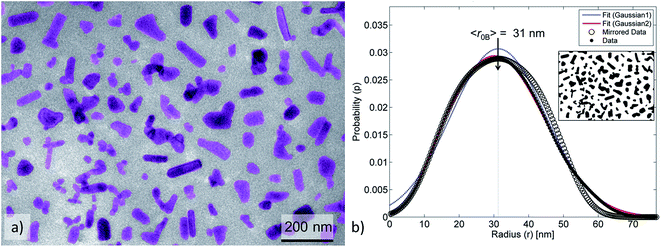
It is challenging to determine the distribution of primary NPs and the fraction of agglomerates from SEM and TEM images, or dynamic light scattering, especially from NPs with a broad size distribution. The size of smaller agglomerates (nanoclusters) may be similar to that of larger primary NPs, which creates the illusion of well-dispersed NPs at low magnification, when in fact small agglomerates are present. Another difficulty is in distinguishing between agglomerates and clusters of individually separated NPs. To improve and to simplify the distinction between single NPs and agglomerates, we developed four methods to assess the radius and the dispersion of NPs considering different aspects. Methods A and B determine the respective fractions of agglomerates (θagglo,A and θagglo,B) by using either the user-defined cut-off radius (rcutoff) or the “mean radius” (r0B) at the highest peak of the distribution histogram. Method A is reliable for detecting both homogeneously distributed agglomerates and heterogeneously distributed well-separated NPs, but it is dependent on the user-defined rcutoff unlike method B. Method C describes two ways to determine the average radius (〈r〉) relative to the radii determined by methods A and B (rrel,A and rrel,B). Method C has been found to be more robust for the detection of nanoclusters that are slightly smaller or slightly larger than the rcutoff. Method D calculates the face-to-face distance (Dffi), the centre-to-centre distance (Dcci), and the deviation ratios (Δffi and Δcci) relative to a completely randomized dispersion. These versatile analytical methods can be applied to AFM, TEM, SEM and STEM images.| Name of the NP | Method A | Method B | Method C | Method D | ||||
|---|---|---|---|---|---|---|---|---|
| Fraction of agglomerates (%) | Average radius (nm) | Mean radius (nm) | Relative average radius | Face-to-face distance (nm) | Face-to-face deviation ratio | |||
| θ agglo,A | θ agglo,B | 〈r〉 | 〈r0B〉 | r rel,A | r rel,B | D ff1,D | Δ ff1,D | |
| ZnO | 90 | 90 | 60–70 | 30–40 | 2.0 | 2.0 | — | 0.4–0.5 |
| ZnO–APTES | 80–90 | 0–50 | 70–90 | 70–90 | 2.4 | 1.1 | — | 0.1–0.3 |
| ZnO-g-PBMA10k | 30–70 | 70–80 | 40–50 | 20–40 | 1.3 | 1.5 | 6–8* | 0.3–0.6 |
| ZnO-g-PBMA60k | 0–50 | 0–60 | 30–60 | 20–50 | 1.2 | 1.1 | 21–22* | 0.8–11 |
| ZnO-g-PBMA80k | 0–30 | 0–40 | 30–40 | 30–40 | 1.1 | 1.1 | 26–28* | 1.1–14 |
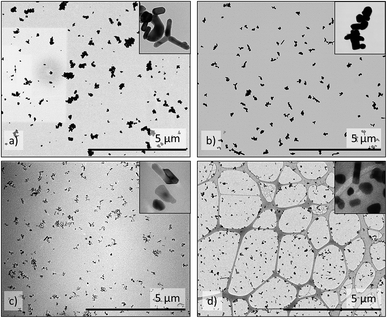
The annealed ZnO-g-PBMAs with short grafts (ZnO-g-PBMA10k) did not form continuous films, but frequently separated the NP-cores of agglomerated nanoclusters (Fig. 4c). Both the face-to-face distance (Dffi) to the closest neighbour (Dff1,D) and the corresponding deviation ratio (Δff1,D) increased with graft length, using the honeycomb packing strategy of method D (Table 2). Deviation ratios as high as 14 indicate good fitting to a densely packed honeycomb structure despite the heterogeneous geometries of the ZnO NPs.
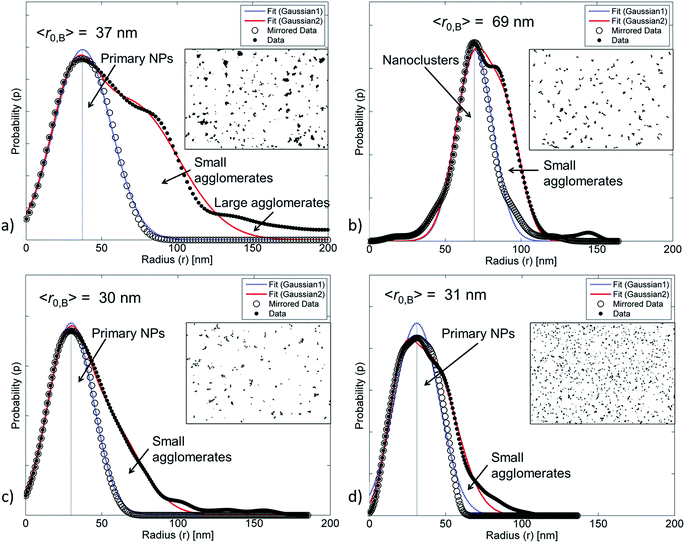
For pristine ZnO NPs, methods A and B successfully determined similar fractions of agglomerates (∼90%, Table 2) despite the heterogeneous geometry of the NPs (Fig. 4a and 5a). The large amount of agglomerates indicated strong NP–NP attraction (polarity). The average radius (〈r〉) was approximately twice as large as the radius of the primary ZnO NPs.
The ZnO–APTES formed homogeneously distributed nanoclusters with agglomerated cores classified as 80–90% agglomerates (Fig. 4b) and only a few primary NPs (Fig. 5b). The formation of nanoclusters was detected by method A (as θagglo,A ≫ θagglo,B) and confirmed by method C (since rrel,A ≫ rrel,B), and was probably an effect of insufficient shielding of short-range core–core attractions during drying (Table 2). The agglomerates and distribution of ZnO-g-PBMA10k appeared very differently compared to ZnO–APTES (Fig. 4c and 5c). Both the radii (〈r0B〉 and 〈r〉) were close to the radius of the primary NPs (∼33.5 nm), and thus described individual NPs separated from the closest neighbours (Table 2). The fractions of agglomeration were different (θagglo,A < θagglo,B), while the relative radii were similar (〈rrel,A〉 ≈ 〈rrel,B〉), indicating a heterogeneous distribution of nanoclusters. The large variations in face-to-face distances of primary NPs within and between nanoclusters suggested that some core–core attraction between ZnO-g-PBMA10k remained during drying, although the grafts prevented complete core–core agglomeration.
Multiple images of annealed and non-annealed NPs with long grafts (ZnO-g-PBMA60k and ZnO-g-PBMA80k) displayed similar radii (〈r〉 ≈ 〈r0B〉), equal to the radius of primary NPs. The fractions θagglo,A and θagglo,B were similar and low, and the relative radii were close to 1 (Table 2), suggesting good dispersion of the NPs. The face-to-face deviation ratio (Δff1,D) ranged from 0.8 to 11 for ZnO-g-PBMA60k and from 1.1 to 14 for ZnO-g-PBMA80k, indicating ordered separation of the NP cores by the grafts (Fig. 4d and 5d). The longer grafts effectively shielded both the short-range and long-range core–core attractions and thus formed well-dispersed primary NPs with a minor fraction of nanoclusters.
3.4 Morphologies of nanocomposites
To manufacture flexible dielectric nanocomposites, the ZnO NPs were mixed into silicone rubbers, commonly used in HV cable accessories (cable joints and terminations).54,55Two grades of silicone matrices were used, a pure laboratory grade of PDMS with a high degree of polymerization (NM = 847) and a commercial silicone rubber (Sylgard® 184) with NM ≈ 550 prior to curing. The degree of polymerization of the grafts (Ng) on ZnO-g-PBMAs was varied in order to change the ratio of NM/Ng to entropically favour different morphologies (Table 3). A rule of thumb for homopolymer nanocomposites is that a ratio of NM/Ng less than 1 entropically favours dispersed NPs, while NM/Ng > 1 causes phase separation, depending on the graft density and the curvature of the NPs.
| Name of the nanocomposite | Silicone matrix | ZnO NP content | N M/Ng | ||
|---|---|---|---|---|---|
| N M | vol% | wt% | |||
| 1.5ZnO-g-PBMA10k | PDMS | 847 | 1.5 | 8.4 | 12 |
| 2.5ZnO-g-PBMA10k | Silicone rubber | 550 | 2.5 | 14 | 8 |
| 1.5ZnO-g-PBMA60k | PDMS | 847 | 1.5 | 8.4 | 2 |
| 2.5ZnO-g-PBMA80k | Silicone rubber | 550 | 2.5 | 14 | 0.9 |
The compatibility between PBMA-grafted NPs and silicone elastomers was investigated using Hansen's solubility parameters (HSPs) in order to estimate the enthalpic compatibility between the PBMA-grafts or pristine ZnO NPs and the silicone matrices. HSPs were selected because they account for interaction parameters such as hydrogen-bonds, dipolar intermolecular forces, and dispersion forces.39 According to the HSPs (Table S1†), the ZnO NPs are compatible with silicone as the relative energy difference (RED) is less than 1 (Fig. 6a), which should give nanocomposites with a random or isotropic distribution of NPs. However, the RED for the PBMA-grafts and the silicone is equal to 1.09 which suggests that a semi-compatible “multi-polymer” nanocomposite will be obtained, as RED is approx. equal to 1 (Fig. 6b).
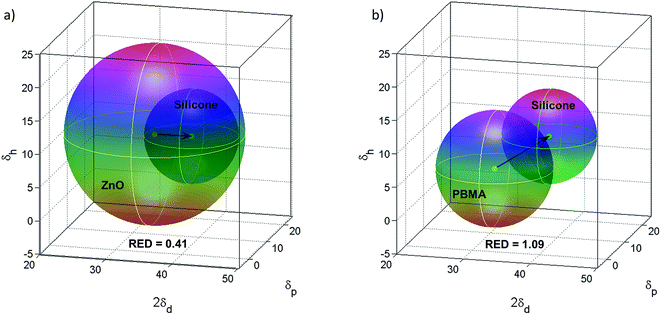 | ||
| Fig. 6 (a) Hansen's solubility parameters for ZnO in silicone resin give RED = 0.41 indicating compatibility. (b) HSPs for PBMA in silicone resin indicate semi-compatibility as RED = 1.09. | ||
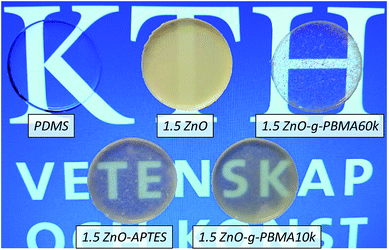 | ||
| Fig. 7 Photo of neat PDMS and nanocomposites containing 1.5 vol% of ZnO NPs, ZnO–APTES, ZnO-g-PBMA10k or ZnO-g-PBMA60k. | ||
The nanocomposite films containing pristine ZnO NPs (1.5ZnO) were homogeneous and white translucent, while 1.5ZnO–APTES and 1.5ZnO-g-PBMA10k were more transparent and heterogeneous. The 1.5ZnO-g-PBMA60k samples contained regions of NPs separated by almost completely transparent regions providing the highest transmittance among the nanocomposites (Fig. 7 and S9a†). The increase in transparency of coated ZnO NPs can be explained by a combination of matching of the refractive indices43 and regions containing few NPs.
Cross-sections of 1.5ZnO revealed randomized isotropic distributions of NPs and small nanoclusters incorporated in the PDMS-matrix (Fig. S10†), as an effect of the enthalpic compatibility between ZnO-NPs and the silicone matrix, according to the HSPs (Fig. 6). Cross-sections of 1.5ZnO-g-PBMA10k, with NM/Ng equal to 12 (Table 1) expectedly formed phase-separated rounded agglomerates of grafted NPs, as the short grafts were entropically unable to be wetted by the much longer polymer matrix. More surprisingly, minor regions of distributed NPs were also present (Fig. 8a and b), and might be an effect of the semi-efficient shielding of the enthalpic interactions between the ZnO NPs and the silicone matrix, in agreement with the heterogeneous dispersions of ZnO-g-PBMA10k (Fig. 4c and 5c). Cross-sections of 1.5ZnO-g-PBMA60k (NM/Ng = 2) formed continuous superstructures of well-separated film-forming NPs (Fig. 8c and d and S11†). The long grafts appeared to entangle mainly with the other PBMA-grafts and partly with the matrix, as NM> Ng, and formed continuous non-spherical agglomerates. This indicates that the initially well-dispersed ZnO-g-PBMA60k (in THF) self-assembled into superstructures of NPs during the thermal treatment of the films prior to curing. The interphase of grafts and matrix appeared to be seamless and the ZnO-cores were clearly separated by the grafts in agreement with annealed NPs (Fig. 3).
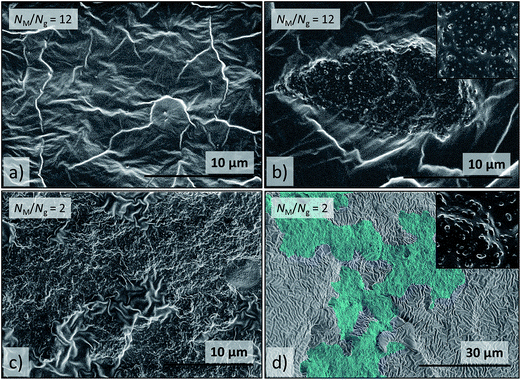 | ||
| Fig. 8 SEM images of cross-sections of (a) and (b) 1.5ZnO-g-PBMA10k (NM/Ng = 12) and (c) and (d) 1.5ZnO-g-PBMA60k (NM/Ng = 2). (a) Region with low concentration of dispersed ZnO-g-PBMA10k, (b) a large spherical agglomerate of separated ZnO-g-PBMA10k, (c) continuous non-spherical agglomerate of ZnO-g-PBMA60k, (d) superstructure of ZnO-g-PBMA60k digitally highlighted in blue using Adobe Photoshop® for clarification. The original image is available in the ESI.† The inset pictures are 2 μm wide and show well-separated grafted NP cores of the agglomerates. | ||
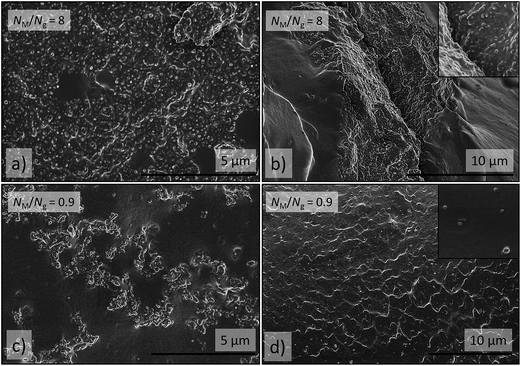
Cross-sections of 2.5ZnO-g-PBMA10k (NM/Ng ≈ 8) showed the anticipated formation of large rounded and elongated agglomerates of closely packed NPs (6–8 nm). Some of the agglomerates percolated and formed superstructures of several hundred microns in size containing islands of neat silicone rubber (Fig. 9), which probably was an effect of improved wetting by the shorter polymer chains of the silicone matrix (NM/Ng < 10), in contrast to 1.5ZnO-g-PBMA10k (NM/Ng > 10).
Interestingly, cross-sections of 2.5ZnO-g-PBMA80k (NM/Ng ≈ 0.9) revealed regions of well-dispersed NPs and the presence of small agglomerates forming short strings (Fig. 9). It appears that the matching of Ng and NM significantly improved the wetting of the semi-compatible grafts by the silicone matrix, and that this allowed the NPs to entangle with, and disperse in, the matrix, in a manner similar to that of homopolymer nanocomposites.32,33 The interconnected strings of grafted NPs appear to be effectively separated by the long brushes, in accordance with Fig. 3 and 4.
 ), Archer et al.57 (
 ), Bates et al.58 (
 ), Kumar et al.33 (
 ), and Jestin et al.59,60 (
 ) (see Fig. 10). The data from the current study are represented by filled pentagons (
 ). Each morphology observed in this study fits the corresponding phases in the diagram, where the product of σ and the square root of the graft length (√Ng) is plotted against the NM/Ng ratio. This indicates that the entropical contributions are dominant for semi-compatible multipolymer nanocomposites (RED ≈ 1). In the case of 2.5ZnO-g-PBMA80k, mainly well-dispersed NPs were observed together with the minor formations of short strings, indicated by a red pentagon with blue edges (Fig. 10). The formation of strings was similar to that reported by Jestin et al.60 The 2.5ZnO-g-PBMA10k is shown by a green pentagon with black edges, representing phase-separated continuous agglomerates. It should be noted that both the NPs and the self-assembled structures in the present study are significantly larger in size than the grafted SiO2 or Fe2O3 NPs in the cited studies.
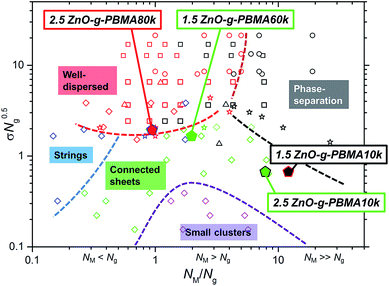 | ||
Fig. 10 A phase-diagram inspired by and partly reproduced from a review by Kumar et al.33 with data from Green et al.48 ( ), Archer et al.49 ( ), Archer et al.49 ( ), Bates et al.50 ( ), Bates et al.50 ( ), Kumar et al.32 ( ), Kumar et al.32 ( ), Jestin et al.51,52 ( ), Jestin et al.51,52 ( ), and data from the current study ( ), and data from the current study ( ). The symbols are color coded where red data points represent well-dispersed samples, the black represent phase-separated structures, the blue represent strings, the green represent connected sheets and superstructures, and the purple points symbolize samples with small clusters of NPs. The edges of the pentagons are colored if a minor additional phase was also present. ). The symbols are color coded where red data points represent well-dispersed samples, the black represent phase-separated structures, the blue represent strings, the green represent connected sheets and superstructures, and the purple points symbolize samples with small clusters of NPs. The edges of the pentagons are colored if a minor additional phase was also present. | ||
3.5 Dielectric properties of silicone nanocomposites
The dielectric properties of the sample films were characterized multiple times under dry conditions at temperatures below, at and above the Tg of the PBMA-grafts. The dielectric losses, the relative permittivity and the resistivity were linked to the NP-morphologies and the face-to-face distance of the NPs, while the breakdown strength was dependent on the NP–matrix compatibility (Fig. S12†).3,61 The breakdown strength was improved by the addition of compatible, highly pure ZnO NPs (despite the relatively large filling content), while it decreased with increasing graft-length for the semi-compatible PBMA-grafted NPs. Importantly, all breakdown voltage levels were well above the E-fields used in high-voltage cable accessories, joints, and rotating machines.The focus of this study is the correlation of the dielectric losses and the resistivity with the NP-morphologies, the surface grafting and the inter-particle distances, which are described in the following sections.
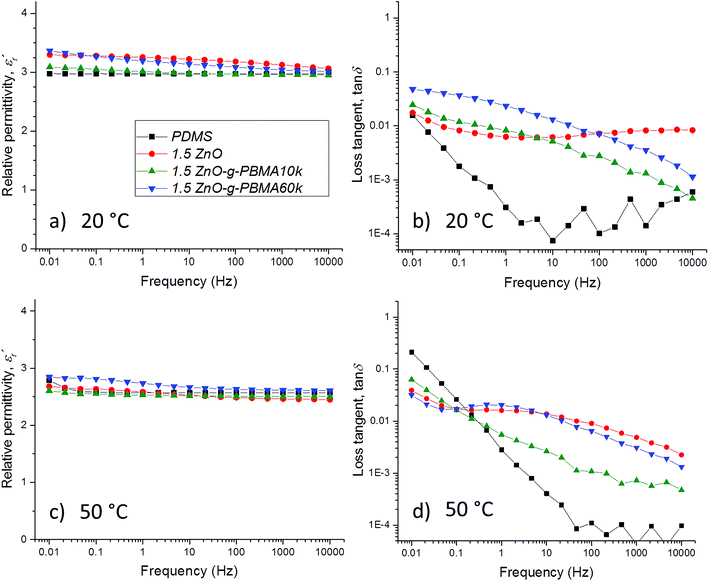
For PDMS, the real part of the relative permittivity  exhibited no significant frequency dependence and was found to be slightly lower at 50 °C,62 due to a reduction in the number of aligned dipoles in PDMS. With the addition of pristine ZnO NPs (1.5ZnO), the
  increased at 20 °C as an effect of the higher
  of the NPs
  .63 The
  was about the same for all the nanocomposites and may be an effect of the absence of impurities, doping agent and grain-boundaries of the highly pure, flame-sprayed ZnO NPs46 (Fig. S1 and S2†). However, the ZnO-g-PBMAs were slightly frequency dependent.
The dielectric loss ( , where
  is the imaginary component of
  ) of PDMS was low and made it possible to investigate the effect of added nanofillers (Fig. 11b and d). The tan
![[thin space (1/6-em)]](https://www.rsc.org/images/entities/char_2009.gif) δ of PDMS increased with temperature at low frequencies and the slope originating from DC conduction was shifted towards higher frequencies at 50 °C. The addition of pristine ZnO NPs (1.5ZnO) led to a higher and constant tan
δ of PDMS increased with temperature at low frequencies and the slope originating from DC conduction was shifted towards higher frequencies at 50 °C. The addition of pristine ZnO NPs (1.5ZnO) led to a higher and constant tan![[thin space (1/6-em)]](https://www.rsc.org/images/entities/char_2009.gif) δ above 0.1 Hz, while tan
δ above 0.1 Hz, while tan![[thin space (1/6-em)]](https://www.rsc.org/images/entities/char_2009.gif) δ at 50 °C decreased at higher frequencies.
δ at 50 °C decreased at higher frequencies.
At both 20 and 50 °C, the addition of grafted NPs introduced a frequency-dependent tan![[thin space (1/6-em)]](https://www.rsc.org/images/entities/char_2009.gif) δ, which resulted in lower losses at higher frequencies than with pristine ZnO NPs. This effect is attributed to the absence of polar groups (–OH and moisture) at the interface of the ZnO-g-PBMAs. At 20 °C, the 1.5ZnO-g-PBMA60k suffered greater losses at low frequencies than 1.5ZnO-g-PBMA10k. This may be attributed to the slower orientation of entangled long PBMA-grafts in the superstructures of 1.5ZnO-g-PBMA60k. However, at 50 °C and at low frequencies, tan
δ, which resulted in lower losses at higher frequencies than with pristine ZnO NPs. This effect is attributed to the absence of polar groups (–OH and moisture) at the interface of the ZnO-g-PBMAs. At 20 °C, the 1.5ZnO-g-PBMA60k suffered greater losses at low frequencies than 1.5ZnO-g-PBMA10k. This may be attributed to the slower orientation of entangled long PBMA-grafts in the superstructures of 1.5ZnO-g-PBMA60k. However, at 50 °C and at low frequencies, tan![[thin space (1/6-em)]](https://www.rsc.org/images/entities/char_2009.gif) δ decreased and 1.5ZnO-g-PBMA60k exhibited the lowest losses of all the samples (Fig. 11d). The non-linear behaviour of the tan
δ decreased and 1.5ZnO-g-PBMA60k exhibited the lowest losses of all the samples (Fig. 11d). The non-linear behaviour of the tan![[thin space (1/6-em)]](https://www.rsc.org/images/entities/char_2009.gif) δ may be an effect of the glass transition of the entangled long PBMA-grafts, and the lower DC conductivity can be explained by the face-to-face distance of 21–22 nm (Table 2), which is longer than the hopping distance of charge carriers (<10 nm) according to Wang et al.64
δ may be an effect of the glass transition of the entangled long PBMA-grafts, and the lower DC conductivity can be explained by the face-to-face distance of 21–22 nm (Table 2), which is longer than the hopping distance of charge carriers (<10 nm) according to Wang et al.64
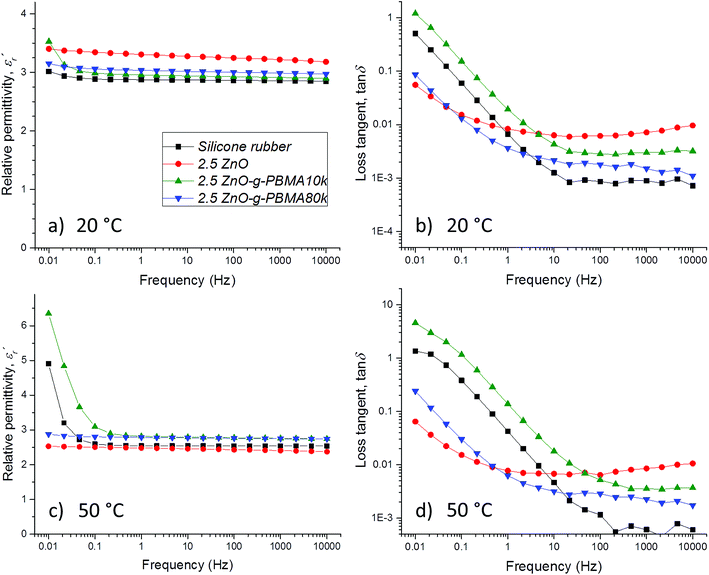
The  of silicone rubber was observed to be similar to that of PDMS (Fig. 11a and c and 12a and c). However, the increase in
  below 0.1 Hz, observed for silicone rubber, and also for 2.5ZnO-g-PBMA10k (Fig. 12a and c), has previously been explained by a “quasi-DC” conduction double-layer effect,52,65 due to the formation of small “capacitors”, or dipoles, as the charges are located on opposite sides of the NPs (i.e. fumed silica or ZnO-g-PBMA10k). The slope of tan
![[thin space (1/6-em)]](https://www.rsc.org/images/entities/char_2009.gif) δ in silicone rubber and 2.5ZnO-g-PBMA10k was close to −1 below ∼50 Hz. The 2.5ZnO-g-PBMA10k exhibited the highest tan
δ in silicone rubber and 2.5ZnO-g-PBMA10k was close to −1 below ∼50 Hz. The 2.5ZnO-g-PBMA10k exhibited the highest tan![[thin space (1/6-em)]](https://www.rsc.org/images/entities/char_2009.gif) δ below ∼50 Hz, and an increase in the DC conductivity, caused by the superstructures with face-to-face distances close to the hopping distance (<10 nm) (Fig. 12b and d).64 However, above ∼50 Hz, the tan
δ below ∼50 Hz, and an increase in the DC conductivity, caused by the superstructures with face-to-face distances close to the hopping distance (<10 nm) (Fig. 12b and d).64 However, above ∼50 Hz, the tan![[thin space (1/6-em)]](https://www.rsc.org/images/entities/char_2009.gif) δ can be significantly reduced in agreement with what was seen for 1.5ZnO-g-PBMA10k and 1.5ZnO-g-PBMA60k.
δ can be significantly reduced in agreement with what was seen for 1.5ZnO-g-PBMA10k and 1.5ZnO-g-PBMA60k.
The isotropic morphology of NPs in 2.5ZnO and 2.5ZnO-g-PBMA80k effectively reduced the “quasi-DC” effect, since the dispersed NP-interphases immobilize the charge carriers (Fig. 12c and d). For 2.5ZnO, tan![[thin space (1/6-em)]](https://www.rsc.org/images/entities/char_2009.gif) δ was constant over the investigated frequency range and showed the highest value at 10 kHz and among the lowest at 0.01 Hz (less DC conduction). The 2.5ZnO-g-PBMA80k (containing dispersed grafted NPs) exhibited a low tan
δ was constant over the investigated frequency range and showed the highest value at 10 kHz and among the lowest at 0.01 Hz (less DC conduction). The 2.5ZnO-g-PBMA80k (containing dispersed grafted NPs) exhibited a low tan![[thin space (1/6-em)]](https://www.rsc.org/images/entities/char_2009.gif) δ at both low and high frequencies.
δ at both low and high frequencies.
![[thin space (1/6-em)]](https://www.rsc.org/images/entities/char_2009.gif) δ values of 1.5ZnO-g-PBMA10k, 1.5ZnO-g-PBMA60k, 2.5ZnO-g-PBMA10k and 2.5ZnO-g-PBMA80k were compared with tan
δ values of 1.5ZnO-g-PBMA10k, 1.5ZnO-g-PBMA60k, 2.5ZnO-g-PBMA10k and 2.5ZnO-g-PBMA80k were compared with tan![[thin space (1/6-em)]](https://www.rsc.org/images/entities/char_2009.gif) δ of their corresponding neat silicone at 0.01 Hz, expressed as percentages. Because of the large scattering in tan
δ of their corresponding neat silicone at 0.01 Hz, expressed as percentages. Because of the large scattering in tan![[thin space (1/6-em)]](https://www.rsc.org/images/entities/char_2009.gif) δ of neat silicone at 10 kHz (close to the noise-level of the instrument), the samples were compared with their corresponding nanocomposites with pristine NPs, in order to quantify the effect of the PBMA-grafts. The relative tan
δ of neat silicone at 10 kHz (close to the noise-level of the instrument), the samples were compared with their corresponding nanocomposites with pristine NPs, in order to quantify the effect of the PBMA-grafts. The relative tan![[thin space (1/6-em)]](https://www.rsc.org/images/entities/char_2009.gif) δ, as a percentage, was related to the morphology and the face-to-face distance of the NPs at 20 °C and 50 °C (Fig. 13). All four nanocomposites with grafted NPs exhibited lower losses at 10 kHz at both temperatures, due to the less polar interphases of ZnO-g-PBMAs than pristine ZnO NPs. The relative tan
δ, as a percentage, was related to the morphology and the face-to-face distance of the NPs at 20 °C and 50 °C (Fig. 13). All four nanocomposites with grafted NPs exhibited lower losses at 10 kHz at both temperatures, due to the less polar interphases of ZnO-g-PBMAs than pristine ZnO NPs. The relative tan![[thin space (1/6-em)]](https://www.rsc.org/images/entities/char_2009.gif) δ at 10 kHz decreased at 50 °C for all four samples. The 2.5ZnO-g-PBMA80k exhibited 80–90% lower relative losses at both frequencies and temperatures. At low frequencies, the interphase of the well-dispersed grafted NPs efficiently trapped charge carriers, and at high frequencies the dielectric loss was lower, due to a reduced amount of polar groups and moisture.
δ at 10 kHz decreased at 50 °C for all four samples. The 2.5ZnO-g-PBMA80k exhibited 80–90% lower relative losses at both frequencies and temperatures. At low frequencies, the interphase of the well-dispersed grafted NPs efficiently trapped charge carriers, and at high frequencies the dielectric loss was lower, due to a reduced amount of polar groups and moisture.
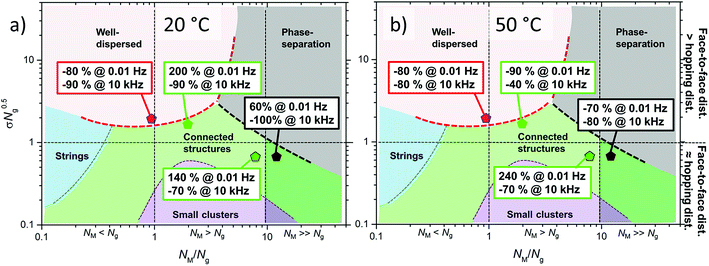 | ||
| Fig. 13 The relative loss tangent as a percentage at 0.01 Hz and 10 kHz for the nanocomposites with grafted NPs at 20 °C (a) and 50 °C (b). | ||
At 0.01 Hz, the 2.5ZnO-g-PBMA10k with connected structures exhibited large relative losses at both 20 °C and 50 °C, in contrast to 1.5ZnO-g-PBMA60k with connected structures and the phase-separated 1.5ZnO-g-PBMA10k, both of which exhibited lower relative losses at 50 °C. The large relative loss tangent (240%) and increased DC-conductivity of 2.5ZnO-g-PBMA10k at 50 °C were an effect of the morphologies and short face-to-face distance of the ZnO-cores (<10 nm) (Fig. 13). The interesting dielectric properties obtained at low frequencies were complemented by DC resistivity measurements to gain more insight into the conduction mechanisms.
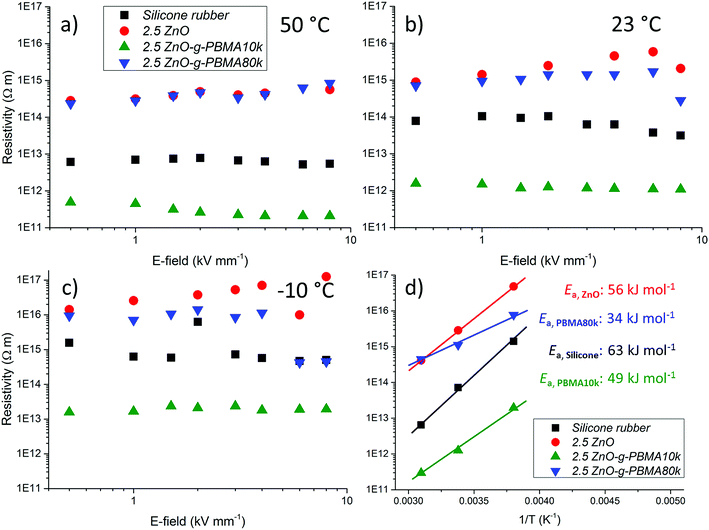
It was concluded that all the evaluated materials essentially exhibited a resistivity independent of the applied electric field within the evaluated interval, and the resistivity increased with decreasing temperature. The isotropic nanocomposites with dispersed NPs (2.5ZnO and 2.5ZnO-g-PBMA80k) had a higher resistivity than the silicone rubber (Fig. 14), indicating a trapping of charge carriers by the interphase of the well-dispersed NPs, despite the high filling ratio. These findings are in agreement with the reported higher resistivities of LDPE-nanocomposites with ZnO NPs.11 The enhanced resistivity indicates that ZnO-g-PBMA80k was still readily available for trapping of charge carriers.
The lower resistivity of 2.5ZnO-g-PBMA10k (Fig. 14) is most likely an effect of the connected structures with the short face-to-face distances (6–8 nm), in the range for efficient hopping of charge carriers (Fig. 13).64 This may be compared with the longer face-to-face distance of 26–28 nm for the 2.5ZnO-g-PBMA80k. We verified that the observed reduction in resistivity was not caused by ionic contamination (Fig. S3†) by reproducing the synthesis and evaluating the effect of different cleaning approaches. The pure interphases of NPs were confirmed by the greater resistivity of 2.5ZnO-g-PBMA80k.
Since it is considered important to obtain stable dielectric properties over a large temperature interval for high voltage dielectrics and electronic applications, the temperature dependence of the resistivity was calculated using the Arrhenius equation. The temperature dependence of the resistivity and the activation energy (Ea) were obtained by curve fitting of the logarithmic resistivities versus T−1, where the slopes correspond to the Ea/R (Fig. 14d and S13a†). The temperature dependence of the resistivity decreased for the nanocomposites compared to silicone rubber. The lowest Ea was obtained for 2.5ZnO-g-PBMA80k followed by 2.5ZnO-g-PBMA10k and 2.5ZnO (Fig. 14d and S13b†).
4. Conclusion
For the first time, Hansen's solubility parameters (HSPs) have been directly applied to predict the compatibility between the polymer grafts on NPs and polymer matrices. By using HSPs, we designed nanocomposites with semi-compatible polymer grafts and matrices in order to obtain various NP morphologies, ranging from spherical agglomerates via continuous superstructures to well-dispersed NPs. We discovered that the morphology of the NPs in a semi-compatible nanocomposite is strongly affected by the entropic wetting of the grafts by the matrix (NM/Ng ratio) similar to homopolymer nanocomposites. This indicates that the morphology of ZnO NPs and thus, the dielectric properties of the nanocomposites can be tuned by controlling the graft length and the NM/Ng ratio. Further, the resistivity of anisotropic nanocomposites containing connected morphologies is dependent on the tunable face-to-face distance of the NP-cores, as the resistivity decreased when the distance was close to the hopping distance (<10 nm). Image analysis models were developed to improve the characterization of NPs and their distribution, by calculating the face-to-face distance, the radius of the primary NPs, and the fraction of agglomerates.More specifically, we obtained nanocomposites of commercial silicone with low dielectric loss where the resistivity increased up to 100 times. The interphase of well-dispersed grafted NPs provides a unique combination of high resistivity, by the trapping of charge carriers, and low dielectric loss at higher frequencies, due to the absence of polar groups and moisture. The well-dispersed pristine ZnO NPs improved the electrical breakdown strength of silicone due to their large and compatible NP–matrix interphase. Further, the thermal dependence of the DC resistivity was reduced by up to 50% for nanocomposites compared to neat silicone rubber.
We believe that these tunable properties of silicone based nanocomposites with semi-compatible polymer grafts are highly versatile and promising materials for low-loss high-voltage transmission cable accessories, as well as for flexible-dielectric materials for mobile electronic devices, wearables and sensors.
Acknowledgements
The authors gratefully acknowledge financial support from ABB AB and the Swedish Energy Agency through SweGRIDS (the Swedish Centre for Smart Grids and Energy Storage), and from KIC InnoEnergy in the European Institute of Innovation and Technology (EIT). H. Hillborg also acknowledges the support of the Swedish Foundation for Strategic Research (SM14-0034).References
- R. T. Olsson, M. S. Hedenqvist, V. Ström, J. Deng, S. J. Savage and U. W. Gedde, Core-shell structured ferrite-silsesquioxane-epoxy nanocomposites: Composite homogeneity and mechanical and magnetic properties, Polym. Eng. Sci., 2011, 51, 862–874 CAS.
- T. J. Lewis, Nanometric dielectrics, IEEE Trans. Dielectr. Electr. Insul., 1994, 1, 812–825 CrossRef CAS.
- M. Roy, J. K. Nelson, R. K. MacCrone, L. S. Schadler, C. W. Reed and R. Keefe, Polymer nanocomposite dielectrics-the role of the interface, IEEE Trans. Dielectr. Electr. Insul., 2005, 12, 629–643 CrossRef CAS.
- J. Kao, K. Thorkelsson, P. Bai, B. J. Rancatore and T. Xu, Toward functional nanocomposites: taking the best of nanoparticles, polymers, and small molecules, Chem. Soc. Rev., 2013, 42, 2654–2678 RSC.
- F. R. Bohm, K. Nagel and H. Schindler, Conference proceedings: a new generation of wire enamel for the production of magnet wires with outstanding corona resistance, IEEE, 2003, pp. 23–25 Search PubMed.
- Y. Kim, S.-Y. Park, S. Y. Kwon, S.-J. Kim, J. Kim and Y.-S. Seo, Enhanced thermal resistance of nanocomposite enameled wire prepared from surface modified silica nanoparticle, Thermochim. Acta, 2012, 542, 62–68 CrossRef CAS.
- F. Guastavino and A. Ratto, Comparison between conventional and nanofilled enamels under different environmental conditions, IEEE Electrical Insulation Magazine, 2012, 28, 35–41 CrossRef.
- M. Roy, J. K. Nelson, R. K. MacCrone and L. S. Schadler, Candidate mechanisms controlling the electrical characteristics of silica/XLPE nanodielectrics, J. Mater. Sci., 2007, 42, 3789–3799 CrossRef CAS.
- D. Ma, R. W. Siegel, J.-I. Hong, L. S. Schadler, E. Mårtensson and C. Önneby, Influence of Nanoparticle Surfaces on the Electrical Breakdown Strength of Nanoparticle-Filled Low-Density Polyethylene, J. Mater. Res., 2004, 19, 857–863 CrossRef CAS.
- T. Takada, Y. Hayase and Y. Tanaka, Space charge trapping in electrical potential well caused by permanent and induced dipoles for LDPE/MgO nanocomposite, IEEE Trans. Dielectr. Electr. Insul., 2008, 15, 152–160 CrossRef CAS.
- A. M. Pourrahimi, T. A. Hoang, D. Liu, L. K. H. Pallon, S. Gubanski, R. T. Olsson, U. W. Gedde and M. S. Hedenqvist, Highly Efficient Interfaces in Nanocomposites Based on Polyethylene and ZnO Nano/Hierarchical Particles: A Novel Approach toward Ultralow Electrical Conductivity Insulations, Adv. Mater., 2016, 28, 8651–8657 CrossRef CAS PubMed.
- L. K. H. Pallon, A. T. Hoang, A. M. Pourrahimi, M. S. Hedenqvist, F. Nilsson, S. Gubanski, U. W. Gedde and R. T. Olsson, The impact of MgO nanoparticle interface in ultra-insulating polyethylene nanocomposites for high voltage DC cables, J. Mater. Chem. A, 2016, 4, 8590–8601 CAS.
- Z. Wang, J. K. Nelson, H. Hillborg, S. Zhao and L. S. Schadler, Graphene Oxide Filled Nanocomposite with Novel Electrical and Dielectric Properties, Adv. Mater., 2012, 24, 3134–3137 CrossRef CAS PubMed.
- R. Barbey, L. Lavanant, D. Paripovic, N. Schüwer, C. Sugnaux, S. Tugulu and H.-A. Klok, Polymer brushes via surface-initiated controlled radical polymerization: synthesis, characterization, properties, and applications, Chem. Rev., 2009, 109, 5437–5527 CrossRef CAS PubMed.
- B. Radhakrishnan, R. Ranjan and W. J. Brittain, Surface initiated polymerizations from silica nanoparticles, Soft Matter, 2006, 2, 386–396 RSC.
- M. Beija, J.-D. Marty and M. Destarac, RAFT/MADIX polymers for the preparation of polymer/inorganic nanohybrids, Prog. Polym. Sci., 2011, 36, 845–886 CrossRef CAS.
- T. von Werne and T. E. Patten, Preparation of structurally well-defined polymer–nanoparticle hybrids with controlled/living radical polymerizations, J. Am. Chem. Soc., 1999, 121, 7409–7410 CrossRef CAS.
- K. X. Matyjaszewski, Atom transfer radical polymerization, Chem. Rev., 2001, 101, 2921–2990 CrossRef CAS PubMed.
- B. Gu and A. Sen, Synthesis of aluminum oxide/gradient copolymer composites by ATRP, Macromolecules, 2002, 35, 8913–8916 CrossRef CAS.
- T. Liu, S. Jia, T. Kowalewski, K. Matyjaszewski, R. Casado-Portilla and J. Belmont, Grafting Poly(n-butyl acrylate) from a Functionalized Carbon Black Surface by Atom Transfer Radical Polymerization, Langmuir, 2003, 19, 6342–6345 CrossRef CAS.
- J. Pyun, S. Jia, T. Kowalewski, G. D. Patterson and K. Matyjaszewski, Synthesis and Characterization of Organic/Inorganic Hybrid Nanoparticles:
![[thin space (1/6-em)]](https://www.rsc.org/images/entities/char_2009.gif) Kinetics of Surface-Initiated Atom Transfer Radical Polymerization and Morphology of Hybrid Nanoparticle Ultrathin Films, Macromolecules, 2003, 36, 5094–5104 CrossRef CAS.
Kinetics of Surface-Initiated Atom Transfer Radical Polymerization and Morphology of Hybrid Nanoparticle Ultrathin Films, Macromolecules, 2003, 36, 5094–5104 CrossRef CAS. - E. Marutani, S. Yamamoto, T. Ninjbadgar, Y. Tsujii, T. Fukuda and M. Takano, Surface-initiated atom transfer radical polymerization of methyl methacrylate on magnetite nanoparticles, Polymer, 2004, 45, 2231–2235 CrossRef CAS.
- M. Kobayashi, R. Matsuno, H. Otsuka and A. Takahara, Precise surface structure control of inorganic solid and metal oxide nanoparticles through surface-initiated radical polymerization, Sci. Technol. Adv. Mater., 2006, 7, 617–628 CrossRef CAS.
- J. Pietrasik, C. M. Hui, W. Chaladaj, H. Dong, J. Choi, J. Jurczak, M. R. Bockstaller and K. Matyjaszewski, Silica-Polymethacrylate Hybrid Particles Synthesized Using High-Pressure Atom Transfer Radical Polymerization, Macromol. Rapid Commun., 2011, 32, 295–301 CrossRef CAS PubMed.
- J. Liu, W. He, L. Zhang, Z. Zhang, J. Zhu, L. Yuan, H. Chen, Z. Cheng and X. Zhu, Bifunctional Nanoparticles with Fluorescence and Magnetism via Surface-Initiated AGET ATRP Mediated by an Iron Catalyst, Langmuir, 2011, 27, 12684–12692 CrossRef CAS PubMed.
- C. Li and B. C. Benicewicz, Synthesis of well-defined polymer brushes grafted onto silica nanoparticles via surface reversible addition - fragmentation chain transfer polymerization, Macromolecules, 2005, 38, 5929–5936 CrossRef CAS.
- C. Li, J. Han, C. Y. Ryu and B. C. Benicewicz, A versatile method to prepare RAFT agent anchored substrates and the preparation of PMMA grafted nanoparticles, Macromolecules, 2006, 39, 3175–3183 CrossRef CAS.
- Y. Zhao and S. Perrier, Synthesis of PMA Grafted onto Silica Particles by Z-supported RAFT Polymerization, Macromol. Symp., 2007, 248, 94–103 CrossRef CAS.
- M. Baum and W. J. Brittain, Synthesis of polymer brushes on silicate substrates via RAFT, Macromolecules, 2002, 35, 610–615 CrossRef CAS.
- S. Blomberg, S. Ostberg, E. Harth, A. W. Bosman, B. Van Horn and C. J. Hawker, Production of crosslinked, hollow nanoparticles by surface-initiated living free-radical polymerization, J. Polym. Sci., Part A: Polym. Chem., 2002, 40, 1309–1320 CrossRef CAS.
- M. Wahlander, F. Nilsson, A. Carlmark, U. W. Gedde, S. Edmondson and E. Malmstrom, Hydrophobic matrix-free graphene-oxide composites with isotropic and nematic states, Nanoscale, 2016, 8, 14730–14745 RSC.
- P. F. Green, The structure of chain end-grafted nanoparticle/homopolymer nanocomposites, Soft Matter, 2011, 7, 7914–7926 RSC.
- P. Akcora, H. Liu, S. K. Kumar, J. Moll, Y. Li, B. C. Benicewicz, L. S. Schadler, D. Acehan, A. Z. Panagiotopoulos, V. Pryamitsyn, V. Ganesan, J. Ilavsky, P. Thiyagarajan, R. H. Colby and J. F. Douglas, Anisotropic self-assembly of spherical polymer-grafted nanoparticles, Nat. Mater., 2009, 8, 354–359 CrossRef CAS PubMed.
- S. K. Kumar, N. Jouault, B. Benicewicz and T. Neely, Nanocomposites with polymer grafted nanoparticles, Macromolecules, 2013, 46, 3199–3214 CrossRef CAS.
- M. Wong, J. Guenther, L. Sun, J. Blümel, R. Nishimura and H.-J. Sue, Synthesis and Fabrication of Multifunctional Nanocomposites: Stable Dispersions of Nanoparticles Tethered with Short, Dense and Polydisperse Polymer Brushes in Poly(methyl methacrylate), Adv. Funct. Mater., 2012, 22, 3614–3624 CrossRef CAS.
- S. Ojha, A. Dang, C. M. Hui, C. Mahoney, K. Matyjaszewski and M. R. Bockstaller, Strategies for the Synthesis of Thermoplastic Polymer Nanocomposite Materials with High Inorganic Filling Fraction, Langmuir, 2013, 29, 8989–8996 CrossRef CAS PubMed.
- I. Borukhov and L. Leibler, Stabilizing grafted colloids in a polymer melt: favorable enthalpic interactions, Phys. Rev. E: Stat. Phys., Plasmas, Fluids, Relat. Interdiscip. Top., 2000, 62, R41–R44 CrossRef CAS.
- I. Borukhov and L. Leibler, Enthalpic Stabilization of Brush-Coated Particles in a Polymer Melt, Macromolecules, 2002, 35, 5171–5182 CrossRef CAS.
- C. M. Hansen, HANSEN SOLUBILITY PARAMETERS, a User's Handbook, CRC Press, 2nd edn, 2007 Search PubMed.
- S. Gardebjer, M. Andersson, J. Engstrom, P. Restorp, M. Persson and A. Larsson, Using Hansen solubility parameters to predict the dispersion of nano-particles in polymeric films, Polym. Chem., 2016, 7, 1756–1764 RSC.
- C. S. Chern, Principles and Applications of Emulsion Polymerization, Wiley, 2008 Search PubMed.
- M. Wåhlander, F. Nilsson, E. Larsson, W.-C. Tsai, H. Hillborg, A. Carlmark, U. W. Gedde and E. Malmström, Polymer-grafted Al2O3-nanoparticles for controlled dispersion in poly(ethylene-co-butyl acrylate) nanocomposites, Polymer, 2014, 55, 2125–2138 CrossRef.
- C. Cobo Sánchez, M. Wåhlander, N. Taylor, L. Fogelström and E. Malmström, Novel Nanocomposites of Poly(lauryl methacrylate)-Grafted Al2O3 Nanoparticles in LDPE, ACS Appl. Mater. Interfaces, 2015, 7, 25669–25678 Search PubMed.
- E. Kaiser, R. L. Colescott, C. D. Bossinger and P. I. Cook, Color test for detection of free terminal amino groups in the solid-phase synthesis of peptides, Anal. Biochem., 1970, 34, 595–598 CrossRef CAS PubMed.
- V. K. Sarin, S. B. H. Kent, J. P. Tam and R. B. Merrifield, Quantitative monitoring of solid-phase peptide synthesis by the ninhydrin reaction, Anal. Biochem., 1981, 117, 147–157 CrossRef CAS PubMed.
- AlfaAesar, Alfa Aesar® A Johnson Matthey Company, Nanoparticles and Dispersions - Exploring the Possibilities (pdf), http://www.alfa.com, accessed 31st Oct, 2016.
- Y. Wang, C. Zhang, S. Bi and G. Luo, Preparation of ZnO nanoparticles using the direct precipitation method in a membrane dispersion micro-structured reactor, Powder Technol., 2010, 202, 130–136 CrossRef CAS.
- C. Leach, Grain boundary structures in zinc oxide varistors, Acta Mater., 2005, 53, 237–245 CrossRef CAS.
- J. D. Russell, D. C. Halls and C. Leach, Direct observation of grain boundary Schottky barrier behaviour in zinc oxide varistor material, J. Mater. Sci. Lett., 1995, 14, 676–678 CrossRef.
- R. E. Palacios, F.-R. F. Fan, J. K. Grey, J. Suk, A. J. Bard and P. F. Barbara, Charging and discharging of single conjugated-polymer nanoparticles, Nat. Mater., 2007, 6, 680–685 CrossRef CAS PubMed.
- T. Takada, Y. Hayase, Y. Tanaka and T. Okamoto, Space charge trapping in electrical potential well caused by permanent and induced dipoles for LDPE/MgO nanocomposite, IEEE Trans. Dielectr. Electr. Insul., 2008, 15, 152–160 CrossRef CAS.
- T. J. Lewis, Interfaces are the dominant feature of dielectrics at the nanometric level, IEEE Trans. Dielectr. Electr. Insul., 2004, 11, 739–753 CrossRef CAS.
- S. Hansson, P. Antoni, H. Bergenudd and E. Malmström, Selective cleavage of polymer grafts from solid surfaces: assessment of initiator content and polymer characteristics, Polym. Chem., 2011, 2, 556 RSC.
- ABB AB, Cable accessories - High Voltage Cables, http://new.abb.com/cables/accessories, accessed 18th of March, 2017.
- NKT cables, High-voltage cable accessories 72 kV up to 245 kV, http://www.nktcables.com, accessed 18th of March, 2017.
- D. Sunday, J. Ilavsky and D. L. Green, A Phase Diagram for Polymer-Grafted Nanoparticles in Homopolymer Matrices, Macromolecules, 2012, 45, 4007–4011 CrossRef CAS.
- S. Srivastava, P. Agarwal and L. A. Archer, Tethered Nanoparticle–Polymer Composites: Phase Stability and Curvature, Langmuir, 2012, 28, 6276–6281 CrossRef CAS PubMed.
- Q. Lan, L. F. Francis and F. S. Bates, Silica nanoparticle dispersions in homopolymer versus block copolymer, J. Polym. Sci., Part B: Polym. Phys., 2007, 45, 2284–2299 CrossRef CAS.
- C. Chevigny, F. Dalmas, E. Di Cola, D. Gigmes, D. Bertin, F. Boué and J. Jestin, Polymer-Grafted-Nanoparticles Nanocomposites: Dispersion, Grafted Chain Conformation, and Rheological Behavior, Macromolecules, 2011, 44, 122–133 CrossRef CAS.
- A.-S. Robbes, F. Cousin, F. Meneau, F. Dalmas, R. Schweins, D. Gigmes and J. Jestin, Polymer-Grafted Magnetic Nanoparticles in Nanocomposites: Curvature Effects, Conformation of Grafted Chain, and Bimodal Nanotriggering of Filler Organization by Combination of Chain Grafting and Magnetic Field, Macromolecules, 2012, 45, 9220–9231 CrossRef CAS.
- R. C. Smith, C. Liang, M. Landry, J. K. Nelson and L. S. Schadler, The mechanisms leading to the useful electrical properties of polymer nanodielectrics, IEEE Trans. Dielectr. Electr. Insul., 2008, 15, 187–196 CrossRef CAS.
- Sigma-Aldrich, SYLGARD® 184-Specification Sheet (PDF), http://www.sigmaaldrich.com/catalog/product/aldrich/761036?lang=en%26region=SE, accessed 15th October, 2016.
- AZoNetwork Ltd, Zinc Oxide (ZnO) Semiconductors, http://www.azom.com/article.aspx?ArticleID=8417#4, accessed 14th October, 2016.
- X. Wang, J. K. Nelson, L. S. Schadler and H. Hillborg, Mechanisms leading to nonlinear electrical response of a nano p-SiC/silicone rubber composite, IEEE Trans. Dielectr. Electr. Insul., 2010, 17, 1687–1696 CrossRef CAS.
- J. I. Hong, P. Winberg, L. S. Schadler and R. W. Siegel, Dielectric properties of zinc oxide/low density polyethylene nanocomposites, Mater. Lett., 2005, 59, 473–476 CrossRef CAS.
Footnote |
| † Electronic supplementary information (ESI) available: Comparison of commercial ZnO NPs, experimental parts, data from SEC, TGA, HSPs, UV-Vis, and the resistivity measurements, calculations of Mg and the band gaps, and additional original and colorized SEM-images of cross-sections. See DOI: 10.1039/c6ta11237d |
| This journal is © The Royal Society of Chemistry 2017 |


