 Open Access Article
Creative Commons Attribution 3.0 Unported Licence
Oxide-based nanomaterials for fuel cell catalysis: the interplay between supported single Pt atoms and particles
Yaroslava
Lykhach
 *a,
Albert
Bruix
 b,
Stefano
Fabris
 c,
Valérie
Potin
 d,
Iva
Matolínová
 e,
Vladimír
Matolín
 *e,
Jörg
Libuda
 *af and
Konstantin M.
Neyman
 *gh
*gh
aLehrstuhl für Physikalische Chemie II, Friedrich-Alexander-Universität Erlangen-Nürnberg, Egerlandstrasse 3, 91058 Erlangen, Germany. E-mail: yaroslava.lykhach@fau.de; joerg.libuda@fau.de; Fax: +49 9131 8528867
bDepartment of Physics and Astronomy and Interdisciplinary Nanoscience Center, Aarhus University, Ny Munkegade 120, Building 1520, DK-8000 Aarhus, Denmark
cCNR-IOM DEMOCRITOS, Istituto Officina dei Materiali, Consiglio Nazionale delle Ricerche and SISSA, Via Bonomea 265, I-34136, Trieste, Italy
dLaboratoire Interdisciplinaire Carnot de Bourgogne, UMR 6303 CNRS-Université de Bourgogne Franche-Comté, 9 Av. A. Savary, BP 47870, F-21078 Dijon Cedex, France
eFaculty of Mathematics and Physics, Department of Surface and Plasma Science, Charles University, V Holešovičkách 2, 18000 Prague, Czech Republic. E-mail: matolin@mbox.troja.mff.cuni.cz
fErlangen Catalysis Resource Center, Friedrich-Alexander-Universität Erlangen-Nürnberg, Egerlandstrasse 3, 91058 Erlangen, Germany
gDepartament de Ciència dels Materials i Química Física and Institut de Química Teòrica i Computacional, Universitat de Barcelona, c/ Martí i Franquès 1, 08028 Barcelona, Spain
hICREA (Institució Catalana de Recerca i Estudis Avançats), Pg. Lluís Companys 23, 08010 Barcelona, Spain. E-mail: konstantin.neyman@icrea.cat; Fax: +34 93 40 21 231
First published on 2nd June 2017
Abstract
The concept of single atom catalysis offers maximum noble metal efficiency for the development of low-cost catalytic materials. Among possible applications are catalytic materials for proton exchange membrane fuel cells. In the present review, recent efforts towards the fabrication of single atom catalysts on nanostructured ceria and their reactivity are discussed in the prospect of their employment as anode catalysts. The remarkable performance and the durability of the ceria-based anode catalysts with ultra-low Pt loading result from the interplay between two states associated with supported atomically dispersed Pt and sub-nanometer Pt particles. The occurrence of these two states is a consequence of strong interactions between Pt and nanostructured ceria that yield atomically dispersed species under oxidizing conditions and sub-nanometer Pt particles under reducing conditions. The square-planar arrangement of four O atoms on {100} nanoterraces has been identified as the key structural element on the surface of the nanostructured ceria where Pt is anchored in the form of Pt2+ species. The conversion of Pt2+ species to sub-nanometer Pt particles is triggered by a redox process involving Ce3+ centers. The latter emerge due to either oxygen vacancies or adsorption of reducing agents. The unique properties of the sub-nanometer Pt particles arise from metal–support interactions involving charge transfer, structural flexibility, and spillover phenomena. The abundance of specific adsorption sites similar to those on {100} nanoterraces determines the ideal (maximum) Pt loading in Pt–CeOx films that still allows reversible switching between the atomically dispersed Pt and sub-nanometer particles yielding high activity and durability during fuel cell operation.
1. Introduction
Hydrogen powered proton exchange membrane fuel cells (PEMFCs) are considered potential next generation power sources for a variety of small to medium-scale applications, including automotive vehicle propulsion and chip-integrated micro-devices.1–3 For PEMFC technology, platinum is the essential catalytic element. Typically, commercial anode catalysts contain about 2–5 mg cm−2 of the noble metal. The high cost of platinum is the main factor limiting the large-scale application of fuel cell technology. Therefore, great efforts are dedicated to the development of catalytic materials for PEMFCs to meet the standards defined by the US Department of Energy (DOE).4 The latest developments in fuel cell technology may reduce the total Pt loading in PEMFCs to 0.15 mg cm−2 which is still above the target value (0.125 mg cm−2) set for the year 2017.4In the prospect of further reduction of Pt loading, supported single atom catalysts (SACs) offer ultimate noble metal efficiency by exposing the entire noble-metal content to reactants.5–8 The synthesis and performance of SACs in numerous heterogeneous reactions have been recently reviewed in detail.6–10 Several key challenges have been identified with respect to the stability and reactivity of the atomically dispersed noble metals. In particular, anchoring of noble metal atoms at appropriate supports requires the presence of specific adsorption sites that are capable of stabilizing metal atoms against sintering and agglomeration into particles. Such sites have been identified on the surfaces of graphene,11–13 nitrides,14–18 zeolites,19 and metal oxides.20–31 In most cases, atomically dispersed metals are found to be anchored in surface cationic positions of the host oxide.23,28,30,32 Depending on the oxidation state of the anchored metal atom, spontaneous formation of anionic or cationic vacancies occurs to balance the charge. In some cases, anchoring of the metal atom is achieved through the spatial confinement in pores or open channels of the support.17,18,33 The stability of the anchored metal atoms and their propensity to agglomerate is determined by the energy difference between the states associated with an adsorbed metal atom and a supported metal particle. In this respect, the use of metal oxides allows employing metal–support interactions to achieve a strong binding between the metal and the support.34–36 Conceptually, oxide supported noble metal SACs are closely related to noble metal-doped oxides.36–38 However, the common disadvantage of the latter is that a substantial amount of the noble metal is atomically dispersed in the bulk.36–38 As a result, the density of the noble-metal sites at the surface is low. An increase of the noble metal loading in doped oxides, on the other hand, often gives rise to metallic particles at the surface.36
Different strategies are applied to increase the density of the atomically dispersed species at the surface. These include grafting of the atomically dispersed metals, the use of stabilizing ligands, and nanostructuring of the support. In particular, new sites emerge at the surface of the nanostructured oxides that may anchor atomically dispersed noble metals in a structural environment which is energetically highly favorable21 with respect to cationic substitution in the doped bulk.36 Under these circumstances, the segregation of the noble metal is driven thermodynamically, yielding a high density of atomically dispersed noble metal at the surface.27
In the following review we summarize the properties of new materials containing atomically dispersed noble metals anchored at surface sites of nanostructured ceria. In particular, the catalytic performance of atomically dispersed platinum supported on nanostructured ceria is discussed in the prospect of applications as anode catalysts for PEMFCs. The remarkable properties of these catalysts involve the interplay between the two states associated with the atomically dispersed noble metal and sub-nanometer particles. The great stability and durability of the prototype anode catalyst arise from reversible switching between these two states under operating PEMFC conditions.
2. Supported single atom catalysts in proton exchange membrane fuel cells
2.1. High efficiency at ultra-low noble metal loading
The performance of Pt–CeO2 catalysts with ultra-low Pt loading prepared by means of radio frequency sputtering was tested under relevant PEMFC conditions.21,39–44 The key parameter determining the cost efficiency of the fuel cell catalyst is the specific power (SP), i.e. the power density (PD) per weight of noble metal. The corresponding SPs and PDs achieved using the Pt–CeO2 catalysts at the anode (Table 1) were compared with those of a commercial Pt nanoparticle catalyst and Pt thin films (Table 2) under identical operation conditions.| Catalyst support | Pt loading (μg cm−2) | T (K) | PD (mW cm−2) | SP (W mg−1) | Ref. |
|---|---|---|---|---|---|
| a The catalyst contains Sn. | |||||
| GDL | 2.2 | 300 | 4.9 | 2.5 | 39 |
| 2.2a | 300 | 10.5 | 5.4 | 39 | |
| 1.2 | 300 | 12.3 | 10 | 40 | |
| 1.2 | 313 | 15.5 | 12.6 | 40 | |
| 0 | 300 | 0.41 | — | 40 | |
| DWCNT/GDL | 1.2 | 300 | 43 | 35 | 40 |
| MWCNT/GDL | 0.9 | 300 | 25 | 28 | 42 |
| 0.9 | 348 | 38 | 42 | 42 | |
| CVD-CNT/GDL | 0.9 | 300 | 40 | 44.4 | 43 |
| 342 | 70 | 77.8 | 43 | ||
| 348 | 74 | 82.2 | 43 | ||
| n-GDL | 4 | 338 | 330 | 82.5 | 41, 44 |
| 2 | 338 | 410 | 205 | 21, 41 | |
| 0.6 | 338 | 170 | 283 | 41 | |
The thin film of the Pt–CeO2 catalyst deposited directly on the gas diffusion layer (GDL) yielded a higher PD with respect to the reference PtRu anode catalyst despite the ten-fold lower Pt loading.39,40 The use of double-wall (DWCNT),40 multi-wall (MWCNT),42 and chemical vapor deposited (CVD-CNT)43 carbon nanotubes resulted in a further increase of PDs and SPs (see Table 1). With respect to the commercial Pt anode (Table 2a), the Pt–CeO2 catalyst yielded an around 102-fold increase of the SP.41
Additionally, an increase of the operation temperature of the fuel cell yielded an approximately two-fold increase of the PD and SP.43 However, the highest PD and SP were obtained with the Pt–CeO2 catalyst deposited on carbon nanoparticle coated GDL (nanoGDL, also n-GDL).21,41,44
The morphology of the GDL support has a critical influence on the performance of the Pt–CeO2 catalyst. Scanning electron microscopy (SEM) revealed characteristic differences in the structure of the bare GDL, GDL coated with DWCNTs, MWCNTs, and CVD-CNTs, and n-GDL (see Fig. 1).
 | ||
| Fig. 1 SEM images of bare (a) and DWCNT (b), MWCNT (c), CVD-CNT (d) coated GDL, and n-GDL (e). (a) Reprinted from ref. 45 with permission from John Wiley & Sons, Inc. Copyright 2016 by John Wiley & Sons, Inc. (b) Adapted from ref. 40, Copyright 2009, The Electrochemical Society. (c) Reprinted from ref. 46 with permission from John Wiley & Sons, Inc. Copyright 2010 by John Wiley & Sons, Inc. (e) Reprinted from ref. 47, Copyright 2015, with permission from Elsevier. | ||
The main difference between the CNT-coated GDL supports (Fig. 1b–d) is the diameter of the tubes and their alignment with respect to the surface of GDL. In particular, CVD-CNTs grow perpendicular to the surface of GDL while DWCNTs and MWCNTs deposited by spin-coating are aligned parallel to the surface of GDL.42
2.2. The composition of the catalysts
The composition of the Pt–CeO2 anode catalysts and the Pt oxidation state were investigated as a function of the information depth.39,40 The experimental approach involved a combination of high-resolution synchrotron spectroscopy (SRPES), angle-resolved X-ray photoelectron spectroscopy (AR XPS), and hard X-ray photoelectron spectroscopy (HAXPS).48 The information depth achieved with these techniques increases with increasing photon energies (hν) and cos(α) with respect to the surface normal from 0.5 nm (SRPES) and 1–2 nm (AR XPS) to 7 nm (HAXPS). The corresponding Pt 4f spectra obtained from the Pt–CeO2 thin films with SRPES, AR XPS, and HAXPS are shown in Fig. 2.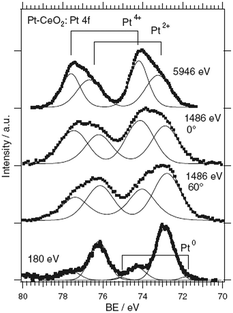 | ||
| Fig. 2 Pt 4f spectra obtained from the Pt–CeO2 film by means of SRPES (hν = 180 eV, α = 0°), AR XPS (hν = 1486 eV, α = 60° and 0°), and HAXPS (hν = 5946 eV, α = 0°). Reproduced with permission from ref. 39, Copyright 2009, The Electrochemical Society. | ||
The major contributions in the Pt 4f spectra arise from atomically dispersed Pt2+ and Pt4+ species. Additionally, traces of metallic Pt0 were identified at the surface of Pt–CeO2 films (Fig. 2, bottom spectrum). The formation of ionic species is typically found for films prepared by magnetron co-sputtering of CeO2 in combination with transition metals.40,49,50 The ratio between the Pt2+, Pt4+, and Pt0 contributions in the Pt 4f is a function of the sampling depth. Accordingly, Pt4+ species are located mostly in the bulk while Pt2+ and Pt0 reside at the surface.
The relationship between the performance of the Pt–CeO2 catalyst supported on n-GDL and the abundance of Pt2+, Pt4+, and Pt0 species can be derived from the comparison of the SPs (Table 1) and the shape of the corresponding Pt 4f spectra (Fig. 3a) as a function of Pt loading.
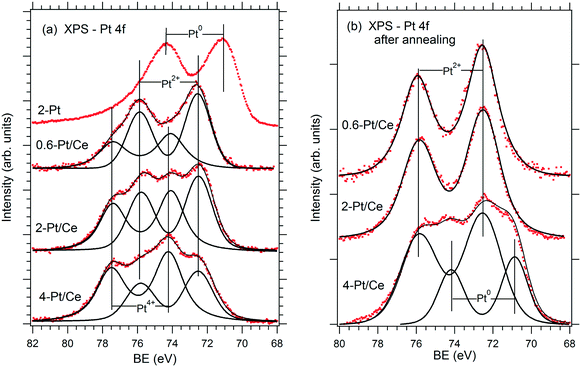 | ||
| Fig. 3 Pt 4f spectra obtained from the reference Pt film (2 μg Pt cm−2, 2-Pt) and Pt–CeO2 films supported on n-GDL with Pt loadings of 0.6 (0.6-Pt/Ce), 2 (2-Pt/Ce) and 4 (4-Pt/Ce) μg Pt cm−2 before (a) and after annealing under PEMFC operating conditions (b). Reprinted from ref. 41, Copyright 2016, with permission from Elsevier. | ||
Clearly, the SP is directly related to the Pt2+/Pt4+ ratio in the films. The highest SP was obtained at the highest Pt2+/Pt4+ ratio corresponding to the lowest Pt loading (0.6 μg cm−2). However, the PD shows a rather non-linear dependence on the Pt2+/Pt4+ ratio. The maximum PD was achieved at moderate Pt loading (2 μg cm−2) and at a lower Pt2+/Pt4+ ratio. Note that a further increase of the Pt loading yielded a lower Pt2+/Pt4+ ratio and resulted in a substantial decrease of the PD (Table 1). The analysis of the Pt–CeO2 catalyst after running several FC cycles revealed conversion of the Pt4+ species to Pt2+ and Pt0 (Fig. 3b). As a result, both Pt–CeO2 films with Pt loadings 0.6 and 2 μg cm−2 contain Pt2+ species, exclusively. Despite the slightly lower SP, the Pt–CeO2 film with a Pt loading of 2 μg cm−2 shows a significantly higher PD with respect to the film with a Pt loading of 0.6 μg cm−2. Under these conditions, the PD increases with the density of Pt2+ species. From the perspective of volumetric power densities, the Pt–CeO2 catalyst with a Pt loading of 2 μg cm−2 is therefore the most suitable for a compact design of the FC.
The presence of metallic Pt0 deteriorated the catalyst performance (see Fig. 3 and Table 1 for a Pt loading of 4 μg cm−2). It follows that the excellent performance of the Pt–CeO2 catalyst is associated with the high density and the enhanced stability of Pt2+ species.
2.3. Parameters controlling proton exchange membrane fuel cell performance
The main parameter that controls the abundance of Pt2+ species on the Pt–CeO2 catalyst is the morphology of the support. The SEM images obtained from Pt–CeO2 deposited on CNT-coated GDL and n-GDL are shown in Fig. 4. The morphology of the Pt–CeO2 anode catalyst corresponds to a porous columnar structure42 that varies as a function of the support with respect to the width and height of the crystallites. The degree of nanostructuring increases for films deposited on CNT-coated GDLs (Fig. 4a–c) and n-GDLs (Fig. 4d) with respect to the bare GDL. | ||
| Fig. 4 SEM images of the Pt–CeO2 anode catalyst deposited on DWCNT (a), MWCNT (b), and CVD-CNT (c) coated GDL, and n-GDL (d). (a) Adapted with permission from ref. 40, Copyright 2009, The Electrochemical Society. (b) Reprinted with permission from ref. 51, Copyright 2012, Inderscience Enterprises Ltd. (d) Reprinted from ref. 47, Copyright 2015, with permission from Elsevier. | ||
The parameters controlling the growth of Pt–CeO2 films have been systematically investigated with respect to the microstructure of the carbon films, the pressure and the temperature. It was found that the major process giving rise to the porous structure of the Pt–CeO2 films is associated with the etching of the carbon films by oxygen plasma.52–55 The corresponding mechanism involves the formation of nucleation centers, e.g. Pt–CeOx or Ce–C particles which mask the carbon substrate partially and, thus, prevent etching.53,55 The density and the mobility of these nucleation centers determine the width of the columns. Additional parameters are the deposition rate55 and thickness56 of the Pt–CeO2 films, temperature, and the composition of the reactive gas.54,55
2.4. Preparation of the nanostructured Pt–CeO2 films
Besides radio frequency magnetron sputtering,21,39–44 the nanostructured Pt–CeO2 films can be prepared by a variety of other techniques including pulsed laser deposition57 and chemical vapor deposition techniques.58–61 The preparation of nanostructured Pt–CeO2 films by means of physical vapor co-deposition of Pt and Ce in an oxygen atmosphere requires low deposition temperature.21 For some methods, e.g. pulsed laser deposition, the degree of the nanostructuring of the Pt–CeO2 films depends on the morphology, i.e. roughness of the support.572.5. Identification of the surface sites on the nanostructured CeO2 support
The degree of the nanostructuring of the Pt–CeO2 films determines the density of the Pt2+ species and is closely related to the number of Ce3+ cations.42,52 For instance, the Pt2+/Pt4+ ratio is much higher in the Pt–CeO2 films deposited under glancing angle (GLAD) conditions.46 In contrast, normal deposition (ND) yielded mainly Pt4+ species accompanied by a low number of Ce3+ cations.62 It was found that Ce3+ sites are located predominantly at the surface steps and edges of the nanostructured Pt–CeO2 films.42The surface of the Pt–CeO2 films was investigated by means of high-resolution transmission electron microscopy (HRTEM). There, the Pt–CeO2 nanoparticles terminated by the {111} and {100} facets were identified in the Pt–CeO2 films supported on CNT-coated GDL,42,43 n-GDL,41,44 and silicon wafers.42,63 Typical HRTEM images obtained from the Pt–CeO2 films supported on n-GDL are shown in Fig. 5 for two different Pt loadings.
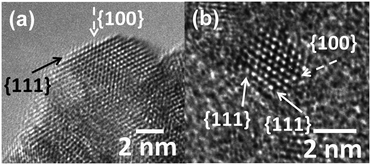 | ||
| Fig. 5 HRTEM images of the Pt–CeO2 films supported on n-GDL with Pt loadings of 2 (a) and 4 (b) μg cm−2. The arrows show the location of the {111} and {100} facets. Reprinted from ref. 41, Copyright 2016, with permission from Elsevier. | ||
The structure of the Pt–CeO2 films is identical to the structure of bare CeO2 films and does not depend on the choice of the preparation technique. For instance, nanoparticles of CeO2 and Pt–CeO2 terminated predominantly by the {111} and {100} facets have been identified in films prepared by magnetron sputtering,56,64 chemical vapor deposition,60 and pulsed laser deposition.57 It follows that with respect to the nature of Pt2+ surface species, either the {111} or {100} facets or edge and step sites connecting these facets provide the adsorption sites that anchor atomically dispersed Pt atoms.
3. Stability of single atom catalysts
3.1. Anchoring noble metal atoms at surface sites of nanostructured ceria
The capacity of the nanostructured ceria to anchor atomically dispersed noble metals at the {111} and {100} facets was analyzed by means of density functional calculations.21 A Ce40O80 nanoparticle model65,66 featuring a truncated octahedral shape with O-terminated {111} and very small {100} facets was identified as a representative model for nanostructured ceria.67 This particle structure, displayed in Fig. 6, emerged from an exhaustive global optimization search.65,66,68 The polar (100) surface corresponding to the {100} nanofacets of the ceria particles is known to be less stable than the (111) surface of ceria.69 Each of these {100} nanofacets is terminated by four surface O2− ions in a square planar arrangement with O–O distances of 315–320 pm forming a so-called O4 pocket.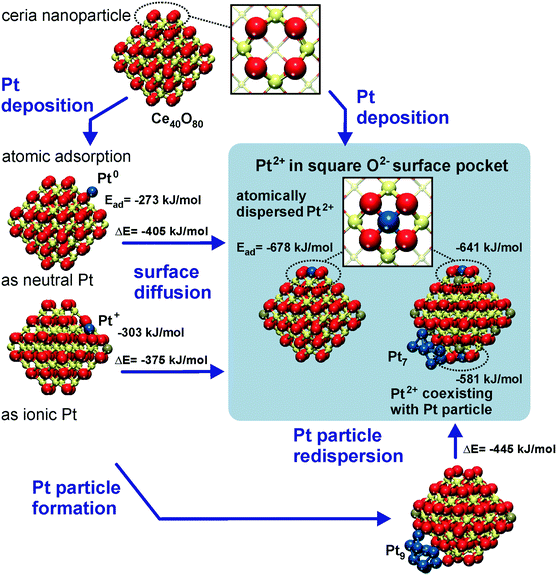 | ||
| Fig. 6 Structure and energetics of various anchored Pt species on ceria nanoparticles obtained from density functional calculations. Pt2+ is strongly bound to square O4 pockets at the {100} nanofacets of the particles. Color coding of atoms: red O, beige Ce4+, brown Ce3+, and blue Pt. Reproduced with permission from ref. 70, Copyright 2016, Springer International Publishing AG. | ||
The binding of Pt atoms adsorbed on the regular CeO2(111) surface in the form of Pt0 or Pt+ is associated with a low diffusion barrier along the surface.71 The formation of Pt2 dimers is therefore kinetically facile and strongly exothermic (by 369 kJ mol−1)72 giving rise to rapid nucleation of Pt particles.73 In turn, the oxidation state and adsorption energy of Pt atoms on the surface of ceria nanoparticles drastically depend on the local structure of the adsorption sites. A moderately strong binding of atomic Pt on edge sites between {111} facets of the Ce40O80 nanoparticle yields Pt0 and Pt+ species with the adsorption energies of −273 and −303 kJ mol−1, respectively.21 Similar adsorption energies were calculated for Pt0 (−256 kJ mol−1) and Pt+ species (−226 kJ mol−1) on the regular CeO2(111) surface.71 This adsorption strength of atomic Pt is typical also for regular surfaces of more inert non-reducible metal oxides, such as MgO(001).74 In contrast, the adsorption of Pt atoms on the {100} nanofacet yields Pt2+ species with an extraordinarily large binding energy of −678 kJ mol−1,21 which is ∼100 kJ mol−1 more in magnitude than that for Pt atoms anchored to neutral oxygen vacancies of the MgO(001) surface.75 In these calculations the formal oxidation state of the adsorbed Pt atom was determined by the number of Ce3+ centers formed via electron transfer into the 4f orbitals of Ce4+. Consequently, the formation of Pt+ or Pt2+ species is accompanied by the reduction of one or two Ce4+ cations to Ce3+, respectively (Fig. 6).
Strong interactions of metal atoms with oxide surfaces are indicative of surface coordination compounds, in which the support acts as a polydentate ligand.76 Indeed, the O4 site provides an ideal coordination environment to host the Pt2+ (d8) species yielding a square planar PtO4 moiety.77 Remarkably, the adsorption energy of the anchored Pt2+ ion exceeds in magnitude the cohesive energy of bulk Pt (−564 kJ mol−1).78 As a consequence, Pt2+ species are thermodynamically stable against sintering. The structure of the resulting PtO4 moiety is consistent with the interatomic distances and coordination numbers of Pt atoms determined by means of extended X-ray absorption fine structure (EXAFS) studies on real Pt/ceria catalysts.79
With respect to sintering and re-dispersion processes, the DFT calculations suggest that the O4 sites are even able to abstract Pt atoms from supported Pt particles21 (Fig. 6). This pathway was calculated to be exothermic for Pt9 and Pt8 particles on Ce40O80, where the migration of Pt atoms from the metal particle to the {100} nanofacets of ceria leads to their transformation into strongly bound Pt2+ species.
Furthermore, the anchored Pt2+ species do not serve as a stable nucleation site for a second Pt atom. Accordingly, no local minimum corresponding to a Pt–Pt2+/O4 moiety was found and during geometry optimization a supported Pt2 dimer dissociated into a Pt2+/O4 complex and a neutral Pt atom adsorbed nearby. This finding implies that the anchored Pt2+ species can actually coexist with Pt particles without being buried by excess Pt.
A very similar local PtO4 structure emerges upon Pt adsorption at the steps of the CeO2(111) surface.22 The thermodynamics of segregation and the corresponding atomic and electronic structures of Pt on stepped CeO2(111) were investigated by density functional calculations.22 Different adsorption sites were considered (Fig. 7) including oxygen vacancies (a), regular sites (b) and Pt clusters (c) on the CeO2(111) terrace, and the two low-energy one-monolayer-high steps labeled as step I (d, f) and step II (e, g) on stoichiometric (denoted S) and non-stoichiometric (with excess of oxygen, denoted O) surfaces. Structures I and II represent the preferred types of steps at the CeO2(111) surfaces at temperatures below 1000 K.80,81
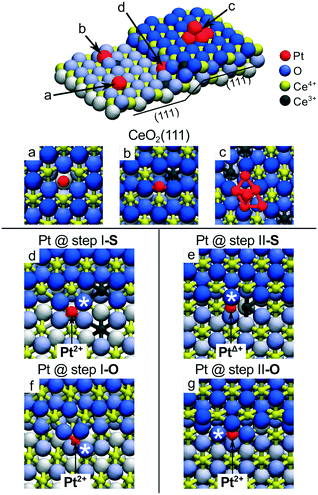 | ||
| Fig. 7 Pt adsorption sites on the stepped CeO2(111) surface. (a) Pt adatom in the surface O vacancy, (b) on the stoichiometric CeO2(111) terrace and (c) supported Pt6 cluster. (d) Pt adatom at the stoichiometric step I (step I-S) and (e) at the stoichiometric step II (step II-S). (f) Pt adatom at step I with excess O (step I-O) and (g) at step II with excess O (step II-O). Reproduced with permission from ref. 22, Copyright 2016, Nature Publishing Group. | ||
Pt adsorption at step I-S yields Pt2+ species coordinated by four lattice O atoms in a characteristic PtO4 planar unit (Fig. 7d) similar to that identified on the {100} facets of the Ce40O80 nanoparticle.21 Consequently, two Ce3+ centers are formed in the proximity of the Pt2+ (Fig. 7d). The resulting adsorption energy of Pt2+ is −5.0 eV. In contrast, the different atomic structure of the step II-S edge prevents the formation of the PtO4 moiety and yields a weakly oxidized PtΔ+ species accompanied by the emergence of one Ce3+ center (Fig. 7e).
The presence of excess oxygen at the steps triggers restructuring and yields Pt2+ in the characteristic square-planar PtO4 surface arrangement. At step I, the excess oxygen leads to the oxidation of Ce3+ centers to Ce4+ while Pt2+ retains its oxidation state. At step II, the oxidation of the PtΔ+ species to Pt2+ is accompanied by the oxidation of one Ce3+ to Ce4+. Remarkably, the resulting binding energies of Pt2+ species in excess of oxygen are ∼1.6 eV higher (i.e. more strongly bound) with respect to that calculated for Pt adsorption on stoichiometric step sites. These results demonstrate that stable PtO4 moieties with Pt2+ species can be formed at step sites of ceria upon oxidation of Pt0 to Pt2+ and that the formation of such Pt2+ species does not necessarily involve the formation of Ce3+ ions.22
The calculations predict the preferential adsorption of Pt atoms at steps I and II regardless of their local geometry and stoichiometry. This prediction is consistent with the higher density of Pt2+ species on ceria surfaces featuring higher step density. Furthermore, it implies that the same square-planar arrangement of PtO4 moieties is formed on different nanostructured ceria supports including stepped surfaces and nanoparticles.
The capacity of the {100} sites on nanostructured ceria to anchor atomically dispersed Pt suggests that other transition metals could interact with the O4 site of Ce40O80 in a similar way. In this respect, the adsorption of metal atoms (M) including the 3d (Fe, Co, Ni, Cu), 4d (Ru, Rh, Pd, Ag) and 5d (Os, Ir, Pt, Au) metals of groups 8–10 was investigated.82 The calculated adsorption energies are shown in Fig. 8 in comparison with the calculated adsorption energy of an edge metal atom of a M79 nanoparticle of the corresponding metal.
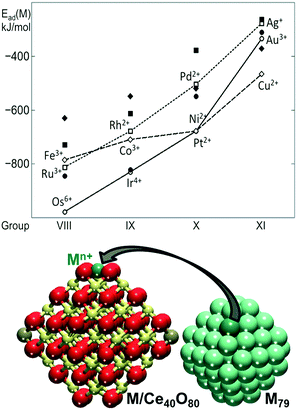 | ||
| Fig. 8 Adsorption energies of atomically dispersed 3d (diamonds), 4d (squares), and 5d (circles) metals (M) on the {100} facet of the Ce40O80 nanoparticle (empty symbols, connected for guiding the eye) and binding energies of these atoms in edge positions of the M79 NP (filled symbols). The corresponding M–Ce40O80 and M79 structures are also shown. Yellow, brown and red spheres represent Ce4+, Ce3+ and O2− ions, respectively. Adapted from ref. 82 with permission from the Royal Society of Chemistry. | ||
The adsorption of the metal atom M at the {100} site results in the oxidation of the adsorbed atom, accompanied by the reduction of Ce4+ cations to Ce3+. In all cases, the adsorption of the metal atom on the O4 site of the ceria nanoparticle is stronger than the binding of edge metal atoms in the M79 models. Interestingly, all calculated oxidation states of metal atoms of groups 8–11 are also observed experimentally in metal–ceria systems.21,26,65,79,83–97 However, only the metals of group 10 all yield cationic species of the same oxidation state, i.e. Pt2+, Pd2+, and Ni2+. This similarity is associated with the d8 electronic configuration of the M2+ cations in the group 10 metals adsorbed in the square planar arrangement. The metals of group 11 adsorbed at the {100} site are found in multiple oxidation states. For instance, Cu2+ in the square planar coordination is just slightly more stable than the Cu+ in a distorted linear arrangement with two short and two long Cu–O distances. Similarly, atomic Ag was found as Ag+ or Ag3+ species. Atomic Au can also be adsorbed as Au+ and Au3+, with the latter being more stable.
Clear trends emerge along the rows and groups of the periodic table (Fig. 8). Binding energies of M both on the ceria nanoparticle and in the M79 nanoparticles generally decrease in magnitude, when moving from the left to the right of the period. This indicates that metals with less occupied d bands form stronger metal–metal bonds and also bind more strongly to the oxide support. With the exception of Au, 5d metals form the strongest bonds with the O4 site of ceria, whereas 4d metals form the weakest bonds, with the exception of Ru. Regardless of the overall strength of the interaction of the different metal atoms with the ceria nanoparticle, the resulting adsorption energies indicate that the {100} sites are able to stabilize atomically dispersed species of a wide range of metals.
3.2. Stability as a function of noble metal loading
The stability of the ceria supported single atom catalysts is a function of numerous parameters including the metal loading,98 the structural and chemical environment of the adsorption site,22 the oxidation state of the substrate, i.e. the density of Ce3+ centers21 and oxygen vacancies,89,99 and the ambient atmosphere.89For instance, the adsorption energy of the Pt2+ species at {100} sites decreases from 7.02 eV to 6.59 eV when the Pt coverage increases from one to four Pt2+ species per Ce40O80 NP due to the increase of Ce3+ density.99 With respect to the limited capacity of the Ce40O80 NP (only 4 Pt atoms can be adsorbed in the form of Pt2+ since there are only four {100} nanofacets each exposing one O4 site), the stepped CeO2(111) surface allows a higher density of Pt2+ species to be obtained by assembling PtO4 units along the steps in close proximity to each other (see Fig. 9).
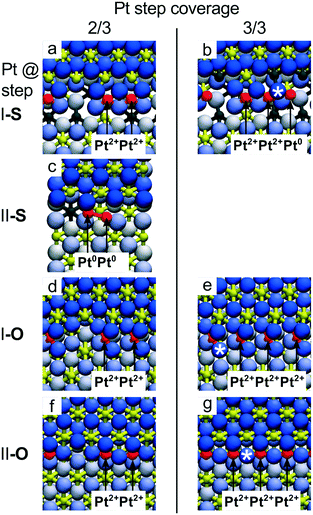 | ||
| Fig. 9 Capacity of the CeO2(111) step edges to accommodate Pt2+ ions obtained from DFT calculations. Calculated top views of Pt atoms bound to steps I-S (a and b), II-S (c), I-O (d and e) and II-O (f and g) for Pt step coverage 2/3 (a, c, d and f) and 1 (b, e and g). At step I-S, the limiting coverage of Pt2+ is 2/3 (a), additional Pt attaches to the step edge as Pt0 (b). At step II-S, the Pt2+ coverage is 0. Pt atoms attach as weakly ionized PtΔ+ and readily form metallic dimers (c) and clusters. On both steps I-O and II-O, excess oxygen can stabilize ionic Pt2+ at step edges as single ions appearing isolated or in groups up to 100% step coverage (d–g). Reproduced with permission from ref. 22, Copyright 2016, Nature Publishing Group. | ||
The maximum coverage of the stable Pt2+ species at step I-S is 2/3 (Fig. 9a). A further increase of the Pt coverage to 3/3 (1 Pt atom per 1 Ce step edge atom) triggers the nucleation of metallic Pt clusters due to the large strain built up in the long row of interconnected PtO4 units at the I-S step (Fig. 9b). On step II-S, reduction of Pt2+ species gives rise to Pt dimers already at coverages exceeding 1/3 (Fig. 9c). In summary, on samples with stoichiometric steps I and II, the calculations predict low Pt2+ coverage at the steps (<33% of the step-edge sites). In contrast, the calculated maximum coverage of Pt2+ at the O-rich steps I-O and II-O is 3/3 (Fig. 9e and g), as interconnected assemblies of PtO4 units fit to the periodicities of both steps I and II (Fig. 7f, g and 9d–g).
The stability of PtO4 moieties was investigated more quantitatively by evaluating the Gibbs free energy of Pt2+ adsorbed at the {100} site of a Ce21O42 particle as a function of ambient temperature and partial pressure of oxygen.89 The relative stability of oxygen vacancies or excess oxygen species evolves progressively with changing pressure and temperature (Fig. 10). Under oxidizing conditions, the adsorption of one oxygen atom in the proximity of the Pt2+ species is favored and leads to the re-oxidation of two Ce3+ centers to Ce4+. Under reducing conditions, the adsorption energy of the Pt2+ species at the {100} site decreases with increasing number of oxygen vacancies. At higher temperature, the onset of vacancy formation shifts to higher oxygen pressure and approaches the onset of oxygen adsorption, thus narrowing the region of the Pt2+ stability.
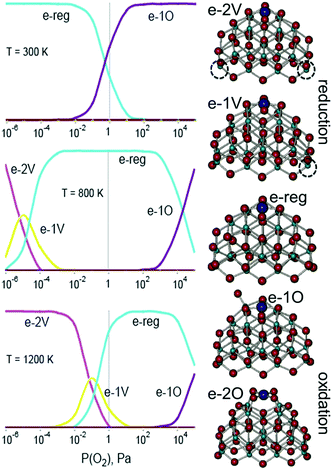 | ||
| Fig. 10 Left: results from a general thermodynamic model including a series consisting of the most stable structures of reduced (e-2v and e-1v), stoichiometric (e-reg), and oxidized (e-1O and e-2O) PtCe21O42 at three different temperatures. The vertical axis corresponds to the relative concentration of the species ranging from 0 to 100%. Right: structures for the different states considered (dashed circles correspond to the positions of oxygen vacancies). Adapted from ref. 89 with permission from the PCCP Owner Societies. | ||
The theoretically predicted behavior of atomically dispersed Pt was examined using appropriate model systems based on well-defined surfaces prepared under UHV conditions.21,22,98 In particular, Pt2+ species were prepared either on the surface of nanostructured ceria films21 or on stepped CeO2(111) surfaces.22 The first approach employed co-deposition of Pt and Ce metal in an oxygen atmosphere onto a well-ordered CeO2(111) buffer layer at low temperature. The use of a 1.5 nm thick buffer layer was necessary to minimize the influence of the Cu(111) substrate on the structure of the Pt–CeO2 film.100 The procedure yielded three-dimensional Pt–CeO2 particles with an average diameter of approximately 3 nm and a typical height of around 0.4 nm (see Fig. 11a and b).21
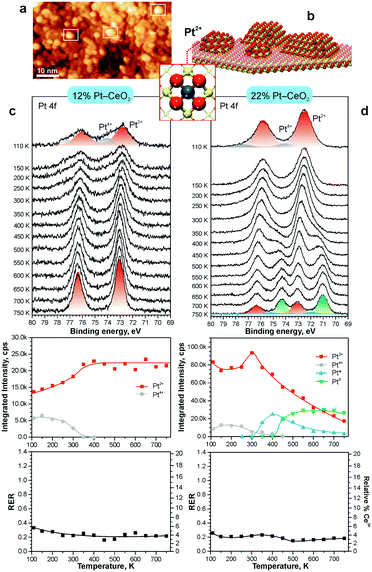 | ||
| Fig. 11 a) STM image obtained from Pt–CeO2 nanoparticles supported on the CeO2(111) buffer layer after annealing to 700 K. White rectangles outline faceted Pt–CeO2 particles. b) Schematic structure of the model catalyst. The height of Pt–CeO2 particles is amplified for illustrative purposes. c and d) Pt 4f spectra, the integrated intensities of the surface species, and RER as a function of annealing temperature at a Pt loading of 12% (c) and 22% (d) in the volume of Pt–CeO2 films. The nominal thickness of the Pt–CeO2 films is 0.3 nm. Pt 4f spectra were obtained with a photon energy of 180 eV. (a and b) reproduced from ref. 21 with permission from John Wiley & Sons, Inc. Copyright © 2016 by John Wiley & Sons, Inc. (c and d) Adapted with permission from ref. 98, Copyright 2016, American Chemical Society. | ||
After annealing to 700 K, some aggregates reveal a faceted shape, suggesting an epitaxial relationship between the supported Pt–CeO2 nanoparticles and the CeO2(111) buffer layer. The chemical state of Pt in the Pt–CeO2 film was investigated by means of SRPES with high surface sensitivity. Two types of species associated with Pt2+ and Pt4+ ions were identified in the Pt 4f spectra obtained from the Pt–CeO2 films as deposited (Fig. 11c and d). In the limit of low Pt loading, the Pt2+ species in the Pt–CeO2 films demonstrate exceptional thermal stability upon annealing up to 750 K (see Fig. 11c). At the same time, less stable Pt4+ species were readily converted to Pt2+. The critical role of providing the appropriate number of surface sites to anchor Pt becomes evident when the Pt–CeO2 films with higher Pt loading were annealed (Fig. 11d). Consequently, the Pt atoms anchored at less favorable sites are bound too weakly to resist sintering to metallic particles.
In line with the density functional calculations82 described in section 3.1, Pd2+ and Ni2+ species were also anchored on the surface of nanostructured ceria following a similar experimental approach. These films were characterized under similar conditions to the Pt–CeO2 films by means of SRPES (see Fig. 12 and 13, respectively).
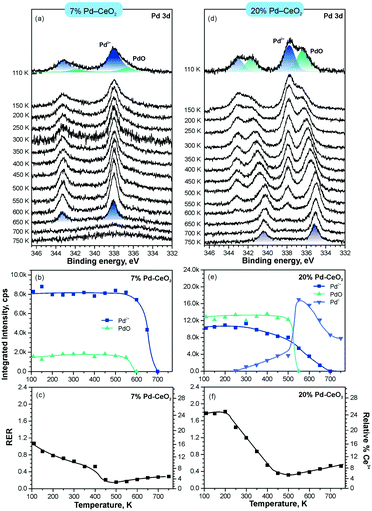 | ||
| Fig. 12 Stability of 7% Pd–CeO2 (a–c) and 20% Pd–CeO2 (d–f) upon annealing in UHV. Pd 3d spectra (a and d) obtained with hν = 410 eV. The integrated intensities of the surface species (b and e) and RER (c and f) on 7% Pd–CeO2 (a–c) and 20% Pd–CeO2 (d–f) as a function of temperature. Adapted with permission from ref. 98, Copyright 2016, American Chemical Society. | ||
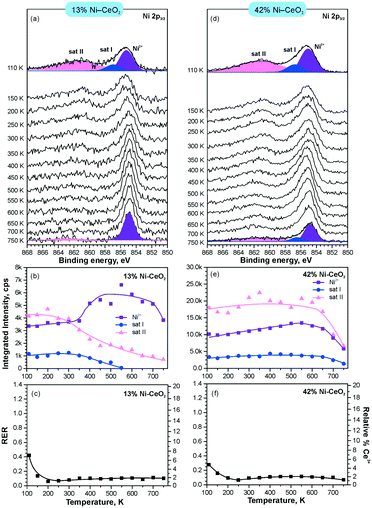 | ||
| Fig. 13 Stability of 13% Ni–CeO2 (a–c) and 42% Ni–CeO2 (d–f) upon annealing in UHV. Ni 2p3/2 spectra (a and d) obtained with hν = 1000 eV. The integrated intensities of the surface species (b and e) and RER (c and f) on 13% Ni–CeO2 (a–c) and 42% Ni–CeO2 (d–f) as a function of temperature. Adapted with permission from ref. 98, Copyright 2016, American Chemical Society. | ||
The formation of both Pd2+ and Ni2+ species was accompanied by additional oxide phases, namely PdO and NiO, that resulted from the lack of a sufficient number of {100} sites on the nanostructured ceria films (see Fig. 12 and 13). Note that the formation and decomposition of the NiO phase can be identified by the presence of two satellite features, i.e. I and II in the spectra of Ni 2p in Fig. 13. The abundance of the additional phases, e.g. oxide and metal particles is a function of metal loading. Thus, in the limit of the low metal loading, the most stable Pd2+ and Ni2+ species can be isolated from the less stable oxide phases by annealing in UHV (see Fig. 12a and b and 13a and b). Both PdO and NiO phases decompose via dissolution in the CeO2(111) buffer layer upon annealing.
Higher Pd loading in the films results in a low stability of atomically dispersed Pd2+ species (see Fig. 12d and e). Similar to the Pt2+, atomically dispersed Pd2+ species are converted into metallic particles upon annealing in UHV.
However, the characteristic difference between the Pt2+ and Pd2+ species is that Pt2+ is preferentially stabilized at the oxygen pockets at the surface, whereas Pd can be stabilized both at the surface and in the bulk in a similar square planar arrangement.94 This property facilitates the diffusion of Pd2+ species into the bulk upon annealing. In sharp contrast to both Pt–CeO2 and Pd–CeO2, formation of metallic Ni particles was not observed in Ni–CeO2, even at high metal loading. This observation is in agreement with the calculated data suggesting that the formation of metallic Ni from ionic Ni2+ is strongly disfavored energetically.
Interestingly, the atomically dispersed metals of group 10 yielded different concentrations of Ce3+ centers. This again demonstrates the diversity of mechanisms involved in the anchoring. In contrast to the Pt–CeO2 films, the Pd–CeO2 films maintain a considerably higher degree of reduction even at low dopant concentrations.8 The decomposition of PdO and NiO phases during annealing results in re-oxidation of Ce3+.
An alternative approach to form Pt2+ species involves the deposition of Pt onto stepped CeO2(111) surfaces in UHV. Under these conditions, the availability of the adsorption sites capable of anchoring Pt2+ species is the most critical parameter. The Pt deposition on CeO2(111) surfaces with a low density of steps and surface oxygen vacancies (Fig. 14a) yields metallic Pt0 clusters in combination with ionic Pt2+ species (Fig. 14b and c).
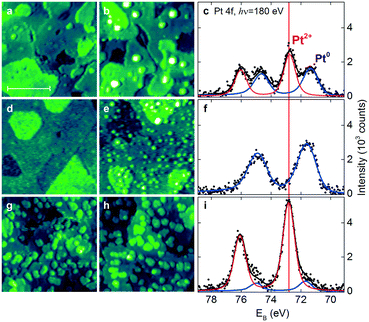 | ||
| Fig. 14 STM images (a and b, d–e and g–h) and Pt 4f spectra (c, f and i) obtained from the stepped CeO2(111) surfaces with a low density of surface oxygen vacancies and steps (a–c), a high density of surface oxygen vacancies (d–f), and a high density of steps (g–i) before (a, d and g) and after (b, e and h) Pt deposition in UHV followed by annealing to 700 K. The size of the images is 45 × 45 nm2 and the scale bar is 20 nm. All STM images were obtained with a tunneling current of 25–75 pA and a sample bias voltage of 2.5–3.5 V. Pt 4f spectra were acquired with photon energy hν = 180 eV. Reproduced with permission from ref. 22, Copyright 2016, Nature Publishing Group. | ||
Subsequent annealing of the films to 700 K increases the amount of Pt2+ species at the expense of Pt0. Interestingly, this process was not accompanied by the reduction of the CeO2(111) surface. This implies the involvement of another oxidizing agent such as excess oxygen atoms. In the UHV environment, one possible source of excess oxygen is water adsorbing in sub-monolayer amounts from the background and undergoing dissociation on reduced ceria and Pt/ceria substrates.101,102 In the real Pt–CeO2 catalysts, excess O atoms may also be incorporated during the synthesis that proceeds in air.103,104
Most importantly, it was found that the relative abundance of the Pt2+ and Pt0 species depends on the density of steps and the number of oxygen vacancies in the CeO2(111) film. In particular, the amount of Pt2+ species scales linearly with the step density.
The presence of oxygen vacancies does not promote the dispersion of Pt2+ species but, instead, leads to the formation of small metallic particles (Fig. 14e and f). According to density functional calculations, oxygen vacancies are not the favorable sites for Pt2+ formation.22,89 Based on the analysis of the adsorption energies of Pt, formation of metallic clusters is preferred on reduced ceria nanoparticles.89
3.3. Identification of the oxidation state of the supported catalyst by CO adsorption
The straightforward identification of Pt sites under reaction conditions is important to understand and tune the structure and stability of Pt–CeO2 films. CO is commonly used as a probe molecule in combination with infrared absorption spectroscopy (IRAS) for identification of adsorption sites in heterogeneous catalysts.105–108The factors that influence the vibrational frequency of CO adsorbed on Pt particles in Pt–CeO2 systems include the local structure of the adsorption site (on-top, bridge, and hollow), the oxidation state and coordination number of the Pt adsorption center, the CO coverage, and the stoichiometry of the support.
For instance, the vibrational frequency of CO adsorbed in the on-top configuration on Pt surfaces increases as a function of the coordination number of the Pt atom. The effect was demonstrated for Pt(111) and unsupported Pt particles as well as for ceria-supported Pt particles of different sizes109,110 (Fig. 15).
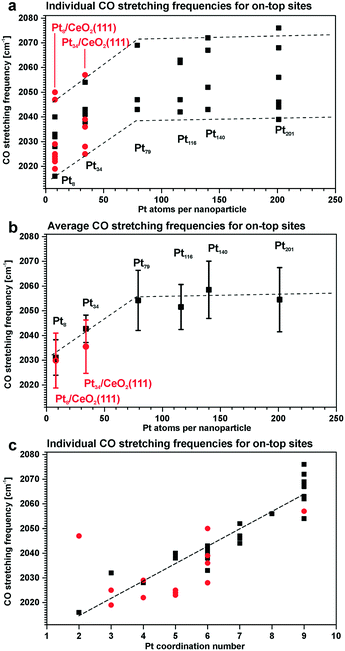 | ||
| Fig. 15 Summary of the stretching frequencies calculated by DFT on different on-top sites of each Pt model particle (black, unsupported particles; red, supported particles): (a) CO stretching frequencies on all on-top sites of each particle and the corresponding tendency visualized by the dashed lines; (b) average on-top stretching frequencies and their standard deviation taking into account weights of all on-top sites in each particle; (c) correlation between the CO stretching frequency and the Pt coordination number with respect to neighboring Pt atoms. Reproduced with permission from ref. 109, Copyright 2016, American Chemical Society. | ||
As under-coordinated sites have characteristic IRAS fingerprints and the relative number of these sites depends on particle size, the trends derived from Fig. 15 allow estimating particle sizes on the basis of the measured CO vibrational frequencies (and vice versa).111 For example, the size of Pt particles under electrochemical working conditions in Pt–ceria electrocatalysts was determined by comparing the experimental frequency shifts in IRAS with calculated shifts, both on free and ceria-supported Pt particles of varying size.109
The calculated vibrational frequencies of CO adsorbed in the on-top configuration on Pt species with different oxidation states and coordination numbers of Pt atoms found in several structural Pt–CeO2 models110 are summarized schematically in Fig. 16. A quick inspection of these data reveals a high degree of overlap between CO frequencies calculated for the different structures. However, general trends indicate that the vibrational frequency of the CO molecule in the on-top configuration depends on the distance between Pt and the nearest oxygen atom of ceria at which the platinum atom is bound to, and that CO vibrational frequencies increase as a function of the oxidation state of atomically dispersed Pt on ceria.110 In addition, an increase in CO coverage leads to a widening of the CO frequency range for adsorption on supported Pt8 clusters and to an increase of the frequency on Pt2+ species.
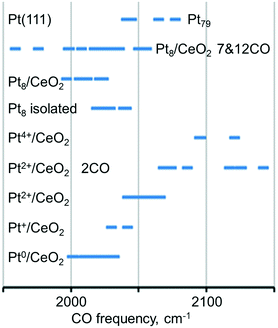 | ||
| Fig. 16 Regions of the calculated C–O vibrational frequency for CO adsorbed on-top of neutral and cationic platinum species. Adapted from ref. 110 with permission from the PCCP Owner Societies. | ||
This scenario suggests that an assignment of platinum species based exclusively on the vibrational frequency might be misleading or inconclusive. When probing metal species with CO and IRAS, it is therefore necessary to monitor the coverage dependent changes in the spectra carefully. In addition, it appears that the adsorption energy of CO is a critical parameter. For example, the adsorption of CO on the Pt2+ cation of the PtO4 moiety is rather weak (−0.61 eV) and also involves a significant reconstruction, suggesting that this is an activated and not very favorable process. Similarly, the vibrational frequency calculated for CO adsorption on Pt4+ comes from a rather unstable system, where excess O atoms have been added to obtain the Pt4+ state. This model is probably not very representative of sites one would find in experiments on Pt–ceria systems, but it is nevertheless useful as a tool to explore how the CO frequency changes with the oxidation state of Pt. CO does not adsorb under pertinent experimental conditions on Pt2+ and Pt4+ species based on the calculated stability of the resulting adsorption complexes.
As a complementary tool, SRPES allows direct determination of the oxidation state of Pt as well as the adsorption site of molecular surface species. The changes in the oxidation state of atomically dispersed Pt species caused by annealing in UHV were reliably identified from their Pt 4f spectra.112 In particular, comparison of the intensities of the Pt 4f spectra before and after CO adsorption at 110 K indicated the presence of metallic Pt clusters which served as adsorption sites for CO.
The development of the Pt 4f spectra obtained from Pt–CeO2 films with different Pt loadings are shown in Fig. 17. CO adsorption on the surfaces containing Pt2+ and Pt4+ exclusively does not attenuate the corresponding contributions (I–II) in the Pt 4f spectra. This suggests that neither Pt2+ nor Pt4+ serve as adsorption sites for CO in line with the calculated instability of CO on these sites. In contrast, small metallic Pt particles formed at high Pt loading (see Fig. 17c) readily adsorb CO. The emergence of metallic particles yielded distinct differences between Pt 4f spectra before (black) and after (green) CO adsorption (Fig. 17). In particular, the contribution from metallic Pt (IV) in the Pt 4f spectra is attenuated and a new component (V) emerges in the Pt 4f spectra upon CO adsorption. Peak V is identified as a shifted component of peak IV, which is consistent with the core level shift expected upon CO adsorption on metallic Pt.
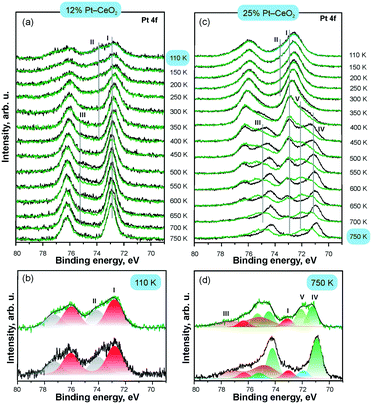 | ||
| Fig. 17 Pt 4f spectra obtained from 12% Pt–CeO2 (a and b) and 25% Pt–CeO2 (c and d) films prepared at 110 K on CeO2(111)/Cu(111) annealed at different temperatures (black) and exposed to 50 L of CO at 110 K (green); the structure of the Pt 4f spectra on as-prepared 12% Pt–CeO2 at 110 K (b) and 25% Pt–CeO2 films annealed to 750 K (d); the components labelled I–V arise from Pt2+, Pt4+, Cu 3p, and metallic Pt particles (IV–V), respectively. Adapted from ref. 112 with permission from the PCCP Owner Societies. | ||
The development of the C 1s spectra upon CO adsorption on Pt–CeO2 films with different Pt loadings is shown in Fig. 18 in comparison with the Pt-free nanostructured CeO2 film. The C 1s spectra reveal the presence of CO-derived species on the three films. The dominant species formed on all surfaces are tridentate (A) and bidentate (B) carbonates. The emergence of the second tridentate carbonate (C) and carbonite (D) contributions indicates the presence of oxygen vacancies in the films. The formation of carbonite species is not associated with the formation of the tridentate carbonate species at oxygen vacancies (C) suggesting that the two species are formed at structurally different types of oxygen vacancies.
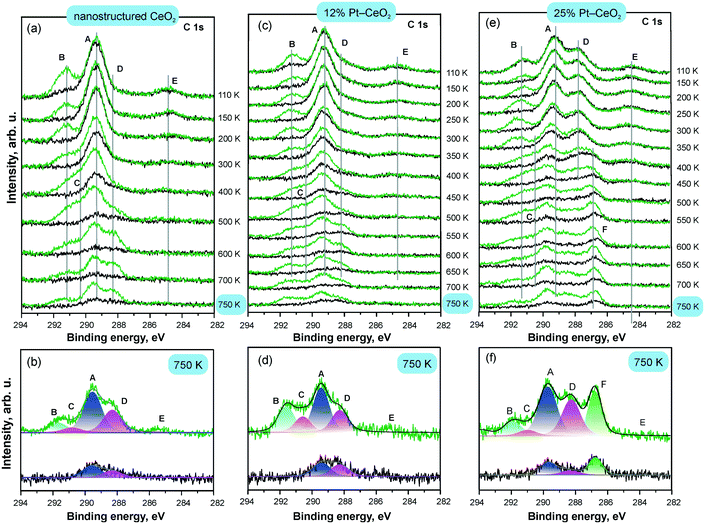 | ||
| Fig. 18 C 1s spectra obtained from Pt-free nanostructured CeO2 (a and b), 12% Pt–CeO2 (c and d), and 25% Pt–CeO2 (e and f) films prepared at 110 K on CeO2(111)/Cu(111) annealed at different temperatures (black) and exposed to 50 L of CO at 110 K (green); the structure of the C 1s spectra obtained from Pt-free nanostructured CeO2 (b), 12% Pt–CeO2 (d), and 25% Pt–CeO2 film (f) annealed to 750 K before (black) and after CO adsorption (green). The components labelled A–F arise from tridentate (A and C) and bidentate carbonates (B), carbonite (D), atomic carbon (E), and CO adsorption on metallic Pt particles (F). Adapted from ref. 112 with permission from the PCCP Owner Societies. | ||
The emergence of a wide range of adsorbed molecular surface species including carbonates, carbonites, and formates, whose stability and spectroscopic signatures strongly depend on the structure and oxidation state of the adsorption site is in line with the results of DFT studies of CO adsorption on a Ce21O42 particle.113
The changes in the relative abundance of species A–D in Fig. 18 are consistent with restructuring of the films upon annealing. The morphological changes induced by the annealing of the 12% and 25% Pt–CeO2 mixed oxides are similar to the changes of the Pt-free CeO2 film and occur above 300 K. The observed reduction of Pt2+ to metallic Pt particles on the 25% Pt–CeO2 film is also associated with restructuring causing a decrease in the number of stable sites that can anchor Pt2+ species. The presence of metallic Pt can therefore be identified by both Pt 4f and C 1s spectra. The appearance of metallic Pt features in the Pt 4f spectra is concomitant with the appearance of a C 1s feature (F) corresponding to CO in the on-top configuration.
4. Reactivity of supported single atom catalysts towards H2
4.1. Supported single metal atoms in the absence of metal particles
Dissociation of molecular hydrogen is the major function of the anode catalyst in hydrogen powered PEMFCs. It was reported that surface cationic Pt species promote dissociation of H2 and facilitate hydrogen spillover on Pt-doped CeO2 powders prepared by the solution combustion method.114 The origins of this reactivity, however, remained obscure. One of the reasons is that the role of atomically dispersed Pt2+ on CeO2 had not been studied individually, i.e. in the absence of other active species such as Pt4+, Pt0, and oxygen vacancies.114–116 Using well-defined model catalysts, atomically dispersed Pt2+ species can be prepared and studied individually.21,99 The corresponding approach involves the preparation of Pt–CeO2 films with low Pt loading at low temperature followed by brief annealing to 700 K.21 The same procedure allows the preparation of atomically dispersed Pd2+ and Ni2+ species on nanostructured ceria.98 Thus, the reactivity of atomically dispersed Pt2+, Pd2+, and Ni2+ species can be investigated under identical experimental conditions.Changes in the oxidation states of Pt2+, Pd2+, and Ni2+ species upon reaction with H2 were investigated by means of SRPES with high surface sensitivity under UHV conditions (see Fig. 19). Additionally, the oxidation state of Ce cations was monitored by means of resonant photoemission spectroscopy (RPES). The resonant enhancement ratio (RER) scales with the Ce3+/Ce4+ concentration ratio.117
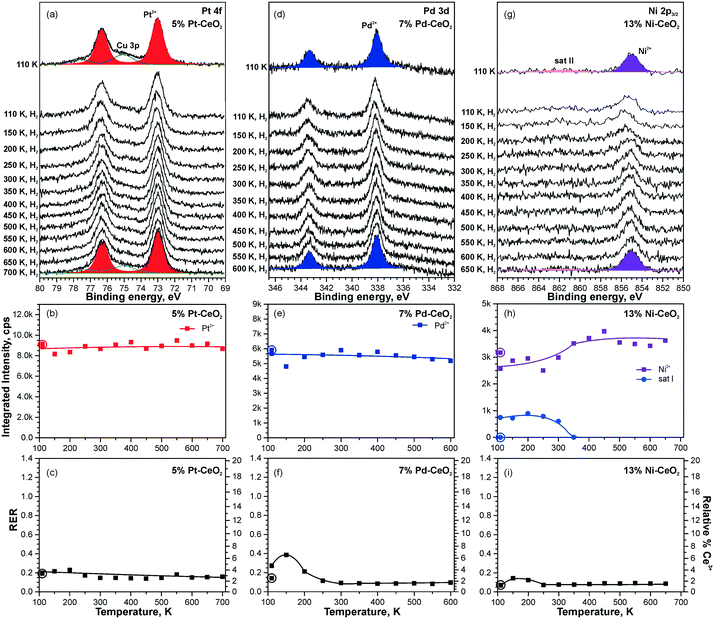 | ||
| Fig. 19 Reactivity of 5% Pt–CeO2 (a–c), 7% Pd–CeO2 (d–f), and 13% Ni–CeO2 (g–i) films towards hydrogen activation. The samples were briefly annealed at 700 K (5% Pt–CeO2, 13% Ni–CeO2) or 600 K (7% Pd–CeO2). Pt 4f (a), Pd 3d (d), and Ni 2p3/2 (g) spectra obtained with hν = 180 eV, hν = 410 eV, and hν = 1000 eV, respectively. The integrated intensities of the surface species (b, e and h) and RER (c, f and i) on 5% Pt–CeO2 (b and c), 7% Pd–CeO2 (e and f), and 13% Ni–CeO2 (h and i) following the exposure to 50 L of H2 as a function of temperature. The data points obtained prior to the hydrogen exposure are circled. (a–c) Reproduced from ref. 99 with permission from the PCCP Owner Societies. (d–i) Adapted with permission from ref. 98, Copyright 2016, American Chemical Society. | ||
Based on the analysis of the corresponding Pt 4f, Pd 3d, and Ni 2p core level spectra and the RER in Fig. 19, it was concluded that isolated Pt2+, Pd2+, and Ni2+ species do not facilitate dissociation of molecular hydrogen under the experimental conditions employed, since reduction of neither these metal cations nor Ce4+ ones by H2 has been detected.98,99
This experimental finding was corroborated by DFT calculations for the case of ceria supported Pt2+ species.99 The reaction pathways and the energetics for H2 dissociation on the Pt–CeO2 system and the CeO2(111) surface are compared in Fig. 20.
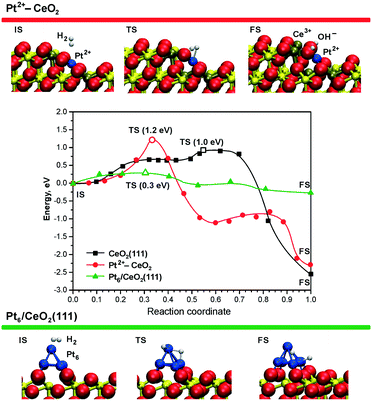 | ||
| Fig. 20 Minimum energy paths for H2 dissociation on the pristine CeO2(111) surface (black), on the ionic Pt2+ sites (red), and on the supported Pt6 cluster (green) – middle panel. The top and bottom panels display the initial (IS), transition (TS), and final (FS) states of H2 dissociation on the Pt2+–CeO2 and Pt6/CeO2(111) systems. The activation energies in TS states (open symbols) are given in parentheses. Ce4+, Ce3+, and O2− ions are displayed as yellow, brown, and red spheres, respectively. Reproduced from ref. 99 with permission from the PCCP Owner Societies. | ||
The Pt–CeO2 system was modeled as a low-energy vicinal surface exposing CeO2(111) terraces and step edges along the [1![[1 with combining macron]](https://www.rsc.org/images/entities/char_0031_0304.gif) 0] direction accommodating Pt2+ ions. These calculations showed that the barrier for H2 dissociation at the Pt2+ sites (1.2 eV) is even larger than the barrier for dissociation on the pristine CeO2(111) surface (1.0 eV).99 The rather high H2 activation energy is consistent with a very high thermodynamic stability of the Pt2+ species.21 This implies that the low barrier desorption of weakly adsorbed H2 is strongly favored over dissociation, in accordance with the experimental findings.99
0] direction accommodating Pt2+ ions. These calculations showed that the barrier for H2 dissociation at the Pt2+ sites (1.2 eV) is even larger than the barrier for dissociation on the pristine CeO2(111) surface (1.0 eV).99 The rather high H2 activation energy is consistent with a very high thermodynamic stability of the Pt2+ species.21 This implies that the low barrier desorption of weakly adsorbed H2 is strongly favored over dissociation, in accordance with the experimental findings.99
In contrast to isolated Pt2+ species, DFT simulations show that sub-nanometer Pt clusters supported on ceria are highly active for H2 dissociation. For instance, the calculated activation energy of only ∼0.3 eV (Fig. 20, green line) for Pt6 on CeO2(111) could be easily overcome even at room temperature.99
4.2. Supported single atom catalysts with traces of metallic clusters
Higher levels of metal loading in Pt–CeO2 and Pd–CeO2 films yield metallic particles upon annealing98 (Fig. 21a and d). In contrast, no metallic Ni was detected in Ni–CeO2 films despite the high metal loading (Fig. 21g).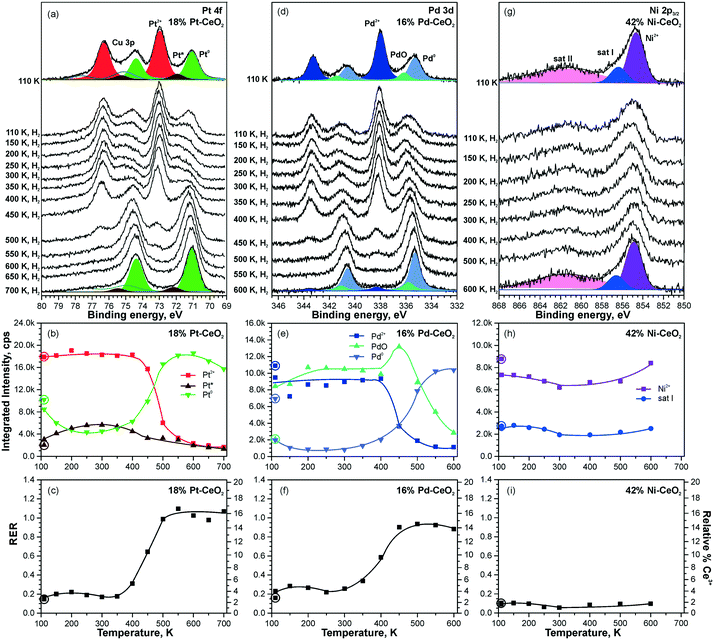 | ||
| Fig. 21 Reactivity of 18% Pt–CeO2 (a–c), 16% Pd–CeO2 (d–f), and 42% Ni–CeO2 (g–i) films towards hydrogen activation. The samples were briefly annealed at 700 K (18% Pt–CeO2, 42% Ni–CeO2) or 600 K (16% Pd–CeO2). Pt 4f (a), Pd 3d (d), and Ni 2p3/2 (g) spectra obtained with hν = 180 eV, hν = 410 eV, and hν = 1000 eV, respectively. The integrated intensities of the surface species (b, e and h) and RER (c, f and i) on 18% Pt–CeO2 (b and c), 16% Pd–CeO2 (e and f), and 42% Ni–CeO2 (h and i) following the exposure to 50 L of H2 as a function of temperature. The data points obtained prior to the hydrogen exposure are circled. (a–c) Reproduced from ref. 99 with permission from the PCCP Owner Societies; (d–i) adapted with permission from ref. 98, Copyright 2016, American Chemical Society. | ||
The activation of molecular hydrogen becomes strongly favored in the presence of metallic Pt and Pd particles on Pt–CeO2 and Pd–CeO2 films. The process is accompanied by the reduction of Pt2+ and Pd2+ species coupled with the reduction of Ce4+ at elevated temperatures (Fig. 21). Eventually, all Pt2+ and Pd2+ species are reduced quantitatively to metallic Pt0. Remarkably, very small amounts of metallic Pt (the traces hardly detected by conventional XPS) turned out to be sufficient to initiate H2 dissociation under similar conditions.99
In contrast to the Pt–CeO2 and Pd–CeO2 films, no reactivity towards H2 was observed on the Ni–CeO2 mixed oxide regardless of the Ni loading. The reason is the particularly high stability of the Ni2+ state preventing formation of metallic Ni.98 In order to probe the role of metallic Ni in hydrogen activation, small amounts of metallic Ni were deposited onto Ni–CeO2 films in UHV.98 However, annealing of the film containing metallic Ni0 in hydrogen at 600 K did not yield a detectable change of the oxidation state of Ni. Apparently, the reaction sequence leading to reduction of cationic Pd and Pt species in Pd–CeO2 and Pt–CeO2 films is not possible for Ni–CeO2, even in the presence of metallic Ni. Besides the high stability of Ni2+, a reason for the low reactivity could be that annealing of the Ni particles on Ni–CeO2 triggers the formation of a NiO capping layer. Such encapsulation processes of the metallic Ni particles could prevent the dissociation of hydrogen.
Overall, the Pt–CeO2 and Pd–CeO2 films show a very similar reactivity towards H2. Therefore, the mechanisms of hydrogen activation on both Pd–CeO2 and Pt–CeO2 films are expected to be similar. With respect to the reduction of atomically dispersed Pt-group species, density functional modelling suggests that hydroxylation of the Pt–O4 moieties upon adsorption of atomic hydrogen21 leads to the reduction of Ce4+ cations and may result in destabilization and, possibly, reduction of Pt2+ species. In the presence of metallic Pt0 on Pt–CeO2, atomic hydrogen could spillover from Pt particles onto the support, leading to hydroxylation of the Pt–O4 moiety. In fact, the calculated reaction pathway on Pt6/CeO2 (Fig. 20) suggests the tendency of H to migrate to the cluster periphery and accumulate at the boundary in contact with the oxide support.99 However, this pathway was ruled out based on the insignificant changes in the RER at temperatures where hydrogen reverse spillover processes are typically observed,118i.e. between 190 and 260 K (see Fig. 21c and f). This suggests that hydrogen spillover and hydroxylation of the PtO4 moiety are not the key steps in Pt2+ reduction during the reaction with H2.
Thus, the mechanism of H2 dissociation involving Pt2+ reduction is likely to be associated with the formation of oxygen vacancies upon reverse oxygen spillover119 from Pt–CeO2 to the Pt particles. Upon exposure to H2 the spilt-over oxygen is continuously removed from the Pt particles by reaction with hydrogen and subsequent formation of water. This reaction channel leads to the formation of oxygen vacancies accompanied by the reduction of Ce4+.
5. Redox conversion of atomically dispersed species to sub-nanometer particles
5.1. The role of oxygen vacancies
Density functional calculations show that the formation of oxygen vacancies can notably lower the adsorption energy of dispersed Pt on the ceria nanoparticles (Fig. 22). The energetic stability of the Pt2+ species depends on the proximity of the oxygen vacancies, their number, the Pt2+ concentration, and the distribution of Ce3+ ions.99 Reduction of Pt2+ species is expected once the adsorption energy of atomic Pt falls below the bulk cohesive energy of Pt (−5.85 eV (ref. 120)).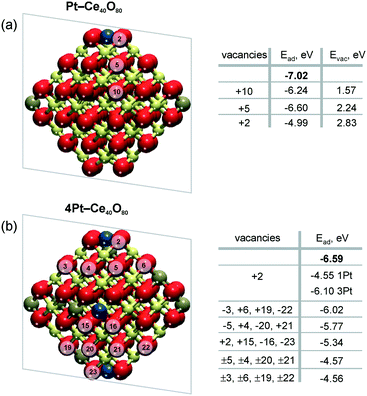 | ||
| Fig. 22 Adsorption energies of atomic Pt in the 2+ state, Ead, without (n = 0) and with n (n > 0) oxygen vacancies on a) Pt–Ce40O80−n and b) 4Pt–Ce40O80−n nanoparticle models. Ead values calculated in the absence of oxygen vacancies are shown in bold. The transparent planes cut the nanoparticles into two halves. The vacancies with the signs “+” and “−” are located in front of and behind the planes, respectively. The sign “±” indicates two symmetric oxygen vacancies located in front of and behind the transparent planes. For the 4Pt–Ce40O80−n nanoparticle (b), the formation of one oxygen vacancy at the position +2 leads to a significant decrease of Ead of one Pt2+ in the proximity of the vacancy (1Pt) while the remaining three Pt2+ species (3Pt) are influenced less significantly. Formation energies of oxygen vacancies, Evac, in the Pt–Ce40O80 model (a) were calculated with respect to ½ of the energy of the O2 molecule. Reproduced from ref. 99 with permission from the PCCP Owner Societies. | ||
The formation of a single oxygen vacancy outside the PtO4 moiety (Fig. 22a) is not sufficient to initiate the reduction of a Pt2+ cation. In contrast, removal of one oxygen atom directly from the PtO4 moiety lowers the adsorption energy Pt2+ species strongly and triggers the reduction, followed by release of Pt from the resulting Pt–O3 moiety. However, the vacancy formation is strongly disfavored at the pocket sites in the presence of Pt2+ species, rendering such a process rather unlikely.99 This suggests that oxygen vacancies are preferentially formed outside the Pt–O4 moiety. If two such oxygen vacancies are created per Pt2+ ion, the Pt2+ adsorption energy falls well below the cohesive energy (Fig. 22b). Thus, density functional calculations indicate that the onset of Pt2+ reduction occurs when approximately two oxygen vacancies are created per Pt2+ site.
A rough estimation of the ratio between the concentration of oxygen vacancies and the Pt2+ cations at the onset of Pt2+ reduction could be obtained also from experimental data.99,121 For the Pt–CeO2 film, the corresponding ratio for reduction of Pt2+ to Pt with hydrogen was determined to be about 1.5 O vacancies per Pt2+ cation.
The direct involvement of metallic Pt particles in the reduction of Pt2+ species can be ruled out by using methanol as a reducing agent.121 The decomposition of methanol on CeO2 films involves the formation of formaldehyde, CO, and oxygen vacancies.122–124 Therefore, the reduction of Pt2+ species is observed as a consequence of the formation of oxygen vacancies regardless of the Pt loading (see Fig. 23). The estimation of the number of oxygen vacancies at the onset of Pt2+ reduction suggested that the formation of two oxygen vacancies is required for reduction of one Pt2+ species.121 This agrees with results of density functional calculations.99 Also, a good correspondence of the ratio between the number of O vacancies and the number of reduced Pt2+ species determined in the presence and in the absence of metallic Pt particles rules out a direct involvement of Pt particles in the destabilization of Pt2+.
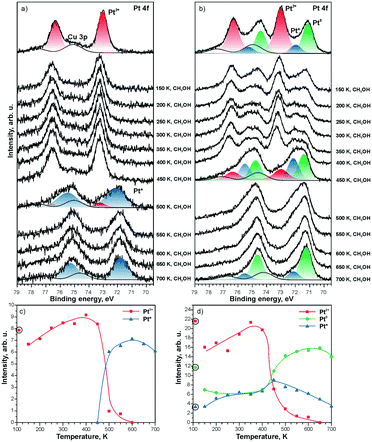 | ||
| Fig. 23 Pt 4f spectra obtained from a) 5% Pt–CeO2 and b) 18% Pt–CeO2 films (top spectra) after annealing while exposing to methanol (10 L) between 150 and 700 K. The Cu 3p signal originates from the underlying Cu(111) substrate. The spectra were acquired with a photon energy of 180 eV. Integrated intensities of Pt2+, Pt0, and Pt* species on c) 5% Pt–CeO2 and d) 18% Pt–CeO2 films are shown as a function of temperature during annealing under methanol exposure. The circled data points were obtained prior to the methanol exposure. Reprinted from ref. 121, Copyright 2016, with permission from Elsevier. | ||
Notably, the reduction of Pt2+ species on the Pt–CeO2 film yields two types of metallic Pt, labeled as Pt0 and Pt* (see Fig. 23). The different binding energies are associated with differences in particle sizes. Based on the value of the binding energy in the Pt 4f spectra, the particle size for the Pt* components falls into the sub-nanometer range (less than 25 Pt atoms per particle) while the Pt0 signal corresponds to “regular” nanoparticles with a size above 2 nm.117
As one would expect, the formation of sub-nanometer Pt particles precedes the formation of larger Pt0 particles. The stability of the sub-nanometer Pt* particles strongly depends on the Pt loading in the Pt–CeO2 films. In the presence of Pt0 particles, Pt* particles are rapidly lost by sintering and coalescence with Pt0 particles.
In the absence of Pt0 particles, however, the sub-nanometer Pt* particles show remarkable stability upon annealing even under strongly reducing conditions (see Fig. 23a).
Due to the high binding energy of the Pt* contribution in the Pt 4f spectra (72.0 eV), the metallic nature of sub-nanometer Pt* particles is difficult to prove.98,99 For example, the presence of a PtO phase or the adsorption of CO on Pt gives rise to spectral contributions at similar binding energies.112,125 Therefore, it is instructive to compare the trends in the formation of oxygen vacancies on Pt–CeO2 films with different Pt loadings with respect to the Pt-free CeO2 film during reaction with methanol (see Fig. 24). The nearly linear increase of the RER on the Pt-free CeO2 film indicates the formation of oxygen vacancies resulting from desorption of formaldehyde, CO, and water that involves partial removal of lattice oxygen from ceria.122–124 In the presence of metallic Pt particles, however, a second channel opens that involves reverse hydrogen spillover followed by desorption of molecular hydrogen.118
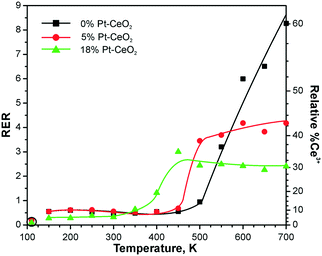 | ||
| Fig. 24 RERs on 0% Pt–CeO2 (black), 5% Pt–CeO2 (red), and 18% Pt–CeO2 (green) films as a function of the temperature during annealing under exposure to methanol (10 L). The data points indicated by circles were obtained prior to the methanol exposure. Reprinted from ref. 121, Copyright 2016, with permission from Elsevier. | ||
This process is accompanied by re-oxidation of ceria. As a result, the amount of the oxygen vacancies formed in the presence of Pt particles is lowered. The limited density of oxygen vacancies in the presence of the Pt particles is reflected by the RER which shows saturation with increasing temperature. Notably, the formation of vacancies is limited on both Pt–CeO2 films regardless of the Pt loadings. This suggests the presence of metallic Pt on all Pt–CeO2 films and corroborates the assignment of the Pt* component to sub-nanometer Pt particles. It can be concluded that the formation of stable sub-nanometer Pt particles is possible via preparation of stable atomically dispersed Pt2+ species followed by their reduction. A similar preparation strategy was employed to obtain finely dispersed Pt particles via Pt segregation from Pt-doped ceria.126
5.2. Redox coupling with the reducing agent
The relationship between the formation of oxygen vacancies and stability of the Pt2+ species99,121 enables new methods to prepare thermally stable sub-nanometer Pt particles.127 Since the formation of oxygen vacancies in ceria-based materials leads to reduction of Ce4+ to Ce3+,123,128,129 one could speculate that reduction of Pt2+ could be controlled via the formation of Ce3+ centers.Following this idea, the reduction of Pt2+ species in Pt–CeO2 materials might be triggered by addition of reducing agents which do not involve the removal of oxygen. For instance, the adsorption of Sn on CeO2 films results in the formation of Sn2+ cations accompanied by the reduction of Ce4+ cations and formation of Ce3+ centers.130–132 Thus, the adsorption of Sn on Pt–CeO2 could trigger the conversion of Pt2+ to sub-nanometer Pt particles. The process could occur at low temperature and without the formation of oxygen vacancies.
Indeed, stepwise Sn deposition onto the Pt–CeO2 film at 300 K in UHV initiated the reduction of Pt2+ species yielding sub-nanometer Pt particles (see Fig. 25). Comparing the trends in the formation of Pt particles under different Sn deposition conditions, it was possible to correlate the onset of Pt2+ reduction with the concentration of the Ce3+ centers determined by the RER.127 Estimating the number of Ce3+ centers formed by Sn deposition on the Pt–CeO2 film it was concluded that approximately 6 Ce3+ cations are required per Pt2+ species to induce the reduction of Pt2+. This number corresponds to 3 Sn2+ cations deposited per Pt2+ species. This finding is in good agreement with density functional modeling data.127
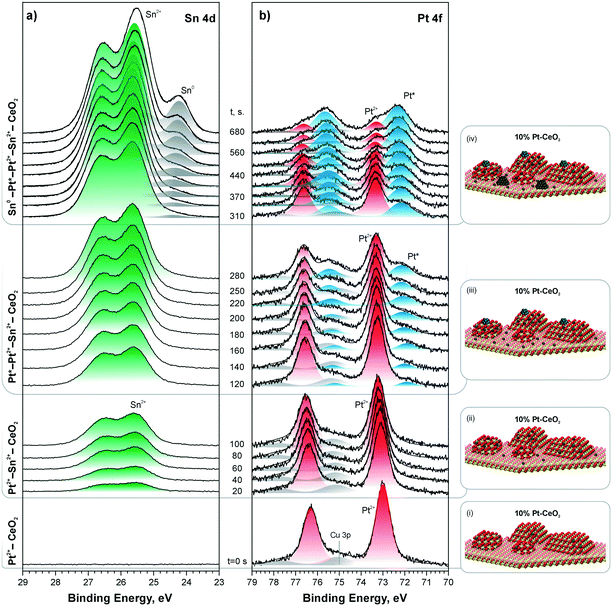 | ||
| Fig. 25 Sn 4d (a) and Pt 4f (b) spectra obtained from a 10% Pt–CeO2 film during stepwise Sn deposition at 300 K in UHV. The Sn 4d and Pt 4f spectra were obtained with photon energies of 60 and 180 eV, respectively. The spectra are grouped (i)–(iv) according to the Pt and Sn oxidation states in the film. In the corresponding ball-and-stick models (i)–(iv), red, yellow, blue, and dark grey balls represent oxygen, cerium, platinum, and tin, respectively. Reproduced from ref. 127 with permission from the Royal Society of Chemistry. | ||
6. Properties of supported sub-nanometer metal particles
6.1. Metal–support interaction as a function of particle size
Metal particles supported on reducible ceria-based materials retain a number of unique properties arising from electronic metal–support interactions (EMSI).34,102,119,133 These include, for instance, higher reactivity and selectivity, structural flexibility, and self-cleaning capacity. Depending on the strength of the EMSI, there is a substantial charge transfer between the supported metal particle and the supporting oxide.73,117,119,134,135 Combining synchrotron-radiation photoelectron spectroscopy and scanning tunneling microscopy it was possible to “count” the number of electrons transferred across the metal/oxide interface as a function of particle size (Fig. 26).117 The maximum charge transferred per Pt atom was detected at particle sizes between 1 and 1.5 nm corresponding to a number of 30 and 70 Pt atoms per particle (see Fig. 26a). At higher Pt coverage the overall number of transferred electrons approaches a limit (Fig. 26b). Consequently, the average charge per Pt atom decreases as a function of size for particles containing more than 70 Pt atoms (Fig. 26a). At these particle sizes, the metal–support interaction is mostly associated with the restructuring of the particle shape and Pt/ceria interface which is rather insensitive to the charge transfer.136 Density functional modeling rationalized the magnitude of the charge transfer, mainly depending on three parameters, i.e. the size of the Pt particles, their density, and the presence of oxygen vacancies117 (Fig. 27). In particular, the limits of charge transfer were attributed to the electrostatic destabilization at a high surface concentration of Ce3+ centers. In this respect, the degree of nanostructuring, i.e. the size of ceria nanoparticles or the roughness of the ceria support, becomes an additional parameter that has a direct impact on the magnitude of the charge transfer.134 The charge transfer would thus increase with increasing density of low-coordinated Ce4+ cations which are capable of accepting electrons from Pt particles and still avoid electrostatic destabilization.134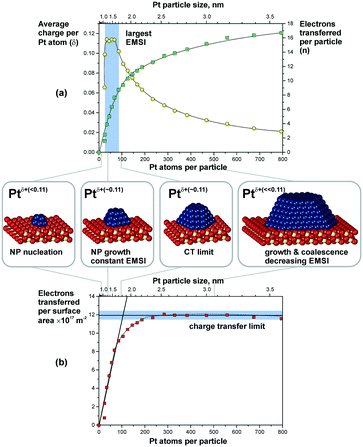 | ||
| Fig. 26 (a) The number of electrons transferred per Pt particle to the ceria support increases with increasing particle size (green squares). The partial charge per Pt atom reaches a maximum for particles with 30 to 70 atoms (yellow circles). Here, the EMSI is largest. (b) At higher Pt coverage the total amount of transferred charge approaches a limit which we denote as the “charge transfer limit” (red squares). The atomic models show schematically the average particle sizes in the different regions. Reproduced with permission from ref. 117, Copyright 2016, Nature Publishing Group. | ||
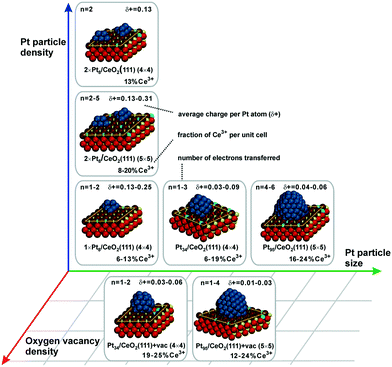 | ||
| Fig. 27 Summarized results of density functional calculations of Ptn/CeO2(111) models. The particle size, the particle density, and the oxygen vacancy density on the support are important factors that control the charge transfer across the metal–oxide interface. Reproduced with permission from ref. 117, Copyright 2016, Nature Publishing Group. | ||
The most remarkable behavior was observed in the regime of sub-nanometer sized Pt particles (Fig. 26a). There, the charge transfer per Pt atom was found to decrease compared to what was predicted by DFT calculations for Pt particles on surfaces of stoichiometric ceria.117,119,137 The observed phenomenon was assigned to nucleation of Pt at Ce3+ defect sites.117,138 Indeed, calculated models also showed that vacancies reduce the net charge transfer from Pt to ceria (Fig. 27). In consequence, the net charge transfer is a function of the degree of reduction of the ceria support.35,139,140 Depending on the specific system, metal particles can bear a positive charge on highly oxidized ceria supported and a negative charge on highly reduced supports.139,140
In summary, the charge transfer is controlled by the particle size, the particle density, the support structure and the degree of reduction of the ceria support.
The DFT modeling suggests that the charge is mainly localized on metal atoms in the vicinity of the interface.117,136 Small Pt aggregates in the sub-nanometer regime consist of only a few atomic layers and, therefore, most of their surface atoms bear an excess charge. This effect may be employed to modify the catalytic properties of the supported particles.
6.2. Charge transfer in aqueous environments
On ceria-based catalysts, water molecules readily dissociate via proton transfer to surface O atoms, resulting in partial surface hydroxylation.101,141,142 DFT calculations were employed to investigate water dissociation at the ceria (111) surface143 and at the ceria/liquid interface144 as well as to elucidate the charge transfers between Pt particles and the ceria support resulting from water dissociation. The influence of the aqueous environment on the reaction mechanism, thermodynamics and kinetics was investigated by means of ab initio molecular dynamics (MD) simulations.144At equilibrium, these MD simulations revealed the existence of a fast proton dynamics at the water/ceria interface involving surface hydroxyl groups, solvated hydroxide ions, and water molecules coordinated to the surface Ce4+ cations at the water/ceria interface.144 Under these conditions, the dissociation of water molecules in the first surface solvation layer becomes a reversible dynamic process, which is governed by solvent-induced short-ranged transfers of protons between the adsorbed water molecules and the surface oxygen sites, or, in the reverse process, between surface hydroxyl groups and solvated hydroxide ions. The local increase of concentration of hydroxide ions on ceria surface, which results from water dissociation, activates a water-mediated Grotthus-like mechanism that gives rise to fast long-ranged proton diffusion along the water/ceria interface.144 It involves concerted transfer of protons along the chains formed by solvent water molecules bridging between surface hydroxide and surface water molecules (Fig. 28a and b).
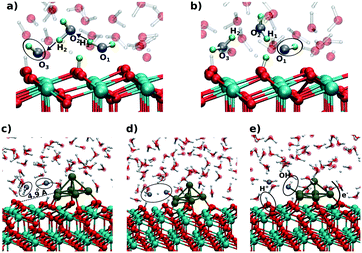 | ||
| Fig. 28 Snapshots from the ab initio MD simulations showing the initial (a and c), intermediate (d), and final (b and e) configurations of the proton chain leading to long-range proton diffusion on the CeO2(111) surface (a and b) and at the periphery of a supported Pt6 cluster (c–e). Adapted with permission from ref. 144, Copyright 2016, American Chemical Society. | ||
The catalytic importance of this dynamic process was demonstrated for water dissociation in the presence of supported sub-nanometer-sized Pt nanoparticles where the solvent accelerates the spillover of ad-species between oxide and metal sites.144 The mechanism of this process, calculated in the presence of a Pt6 cluster on a stoichiometric ceria (111) slab, is demonstrated in Fig. 28c–e. In the first step, a water molecule of the solvation layer dissociates at the periphery of the supported Pt particle into a hydroxide ion and a proton. This activates the dissociation of a neighboring solvent water molecule (see ovals in Fig. 28c and d), which mediates the proton transfer at the water/oxide interface. The proton is effectively transferred to an oxide surface site away from the nanoparticle, forming a surface hydroxyl (Fig. 28e). The resulting OH− species readily binds to a Pt site of the supported cluster inducing substantial charge transfer across the metal/oxide interface.
Upon electron reorganization in the Pt/CeO2 system one electron from the hydroxide species and another one from the Pt cluster are transferred to the oxide substrate through the metal/oxide interface, thus indicating that the cluster/solvent and metal/oxide interfaces are strongly coupled.144 This demonstrates that, with respect to UHV conditions, the number of electrons transferred from a supported Pt cluster in an aqueous environment to the ceria support is larger by up to a factor of two.144 Given the concerted reaction mechanism, the transfer of protons away from the Pt cluster cannot be distinguished from the transfer of the hydroxide ion towards the Pt cluster. In any case, however, the supported Pt clusters act as a basin attracting hydroxide species, which consequently accumulate at the cluster sites.
6.3. Formation of oxygen vacancies and reverse oxygen spillover
In the context of metal–support interaction, the supported metal particles may have a significant influence on the reactivity of ceria and, particularly, on its oxygen storage capacity. For bare ceria, the formation of oxygen vacancies in ceria nanostructures is strongly favored with respect to bulk samples.65,68,83,145,146 DFT calculations suggest that the oxygen vacancy formation energy decreases from 2.25 eV on the CeO2(111) slab to 0.8 eV on ceria nanoparticles such as Ce40O80 (see Fig. 29). The deposition of a Pt particle appears to have only little effect on the energy of vacancy formation, both on extended ceria73,119 and on ceria nanoparticles134 (Fig. 29). However, the formation of an oxygen vacancy results in a variation of the initial charge of the supported Pt8 particle as a function of the size of the ceria nanoparticle, i.e. the degree of ceria nanostructuring.119,134 This effect reflects the flexibility of the electronic structure of nanostructured ceria-based systems.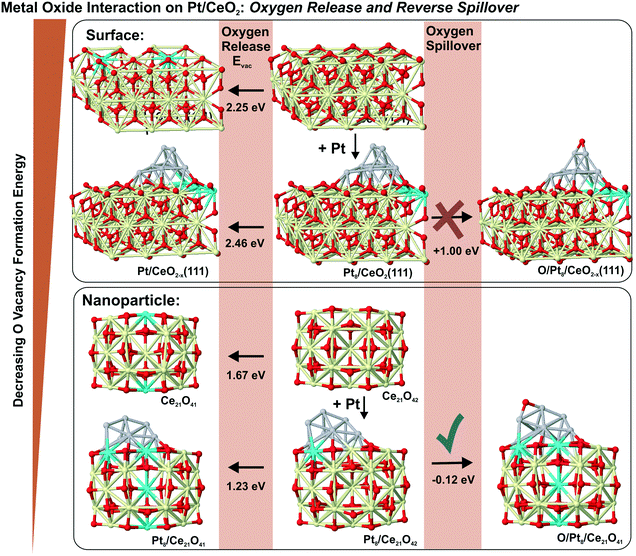 | ||
| Fig. 29 Oxygen release and oxygen reverse spillover in extended and nanostructured Pt/ceria models according to DFT calculations. Reproduced with permission from ref. 119, Copyright 2011, Nature Publishing Group. | ||
In the presence of supported Pt particles, oxygen vacancies can also be created by migration of atomic oxygen from the support onto Pt particles. The corresponding process is denoted as reverse oxygen spillover. Considering the energy of oxygen vacancy formation on CeO2(111) (2.25 eV) and the adsorption energy of oxygen on Pt(111) (0.60–1.55 eV),147 such a reverse spillover process seems to be energetically unfavorable. At this point, the degree of the nanostructuring of ceria plays a critical role. In particular, the low energy for oxygen vacancy formation on nanostructured ceria favors reverse oxygen spillover and makes the process exothermic by 0.51 eV (Fig. 29). The reaction is accompanied by the formation of two new Ce3+ centers. These estimations strongly suggest that the occurrence of oxygen reverse spillover intrinsically requires the presence of a nanostructured ceria support.
The above described processes associated with charge transfer and reverse oxygen spillover were investigated experimentally (see Fig. 30). In particular, the initial increase in Ce3+ concentration indicates the charge transfer from the Pt particles to the ceria film. In contrast to the charge transfer, reverse oxygen spillover is associated with a substantial activation barrier and does not occur spontaneously at low temperature. However, a rapid increase of the Ce3+ concentration was observed upon annealing above 500 K which is associated with the onset of reverse oxygen spillover (Fig. 30).
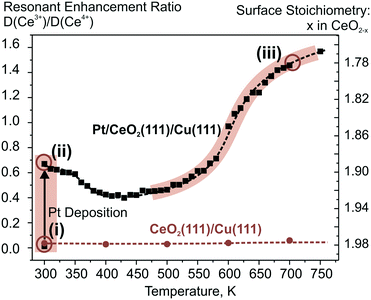 | ||
| Fig. 30 The evolution of the resonant enhancement ratio (RER) indicates the occurrence of the charge transfer upon Pt deposition on nanostructured CeO2(111) at 300 K and the reverse oxygen spillover above 500 K. The RER determined from the heights of the resonant features in the valence bands associated with Ce3+ and Ce4+ cations scales with the Ce3+/Ce4+ concentration ratio by a factor of 5.5.117 Reproduced with permission from ref. 119, Copyright 2011, Nature Publishing Group. | ||
6.4. Structural flexibility of sub-nanometer metal particles
The structural flexibility of metal particles facilitates a chemical reaction by reducing the activation barrier.137,148–153 In the regime of sub-nanometer size this property should become increasingly important. For instance, for a Pt6 cluster supported on a regular CeO2(111) surface the structural flexibility of the former turns the energetic balance of oxygen reverse spillover from endothermic, when structural changes are neglected, to weakly exothermic, when structural changes are taken into account (see Fig. 31).137 In other words, the binding energy of an oxygen atom to the Pt6 cluster becomes comparable to the binding energy of oxygen in the ceria lattice if structural rearrangements in the Pt cluster are considered. Interestingly, this effect suggests that oxygen transfer to supported Pt clusters does not necessarily require nanostructured ceria particles, but may become slightly exothermic for very small Pt clusters even on extended ceria surfaces.137,145 Notably, the initial and final stages of this process identified with global structural optimization indicate a transition from a 3D to 2D morphology of the supported Pt6 cluster (Fig. 31).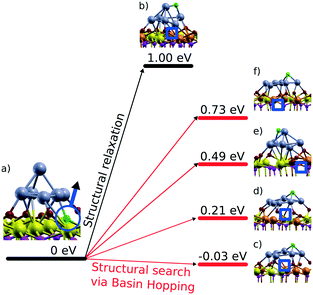 | ||
| Fig. 31 Thermodynamics of reverse oxygen spillover between a supported Pt6 cluster and a CeO2(111) surface. Initial state (a) Pt6 cluster deposited on a stoichiometric CeO2(111) slab and final states (b–f), partially oxidized Pt6O cluster on the slab with an oxygen vacancy beneath the cluster, resulting from a usual structural relaxation towards the local minimum (b) and from a basin hopping structure optimization (c–f) that allows the global minimum to be reached in the configurational space. Pt atoms are in gray, oxygen from the first (second) layer in red (violet), Ce4+ in yellow, and Ce3+ in orange. The oxygen vacancy site is indicated by blue squares. Reproduced with permission from ref. 137, Copyright 2014, American Chemical Society. | ||
6.5. Interconversion between atomically dispersed Pt2+ and sub-nanometer sized Pt particles
Because of the strong correlation between the oxidation state of Pt and the degree of reduction of the ceria support, it is expected that the Pt–CeO2 catalyst can switch between two stable states, one associated with atomically dispersed Pt2+ species anchored at {100} sites and a second one with the Pt from sub-nanometer-sized Pt aggregates. The interconversion between the two states will occur in response to changes of the reactive environment. The latter may be associated with changes in the gas composition or, in the case of the fuel cell catalysts, in response to changes of the electrode potential.Reversible changes in the oxidation state of Pt particles supported on nanostructured ceria have previously been monitored by Hatanaka et al.154 The presence of oxidized Pt species was explained by the formation of Pt–O–Ce bonds in an oxidative atmosphere at high temperature. It was proposed that the formation of such bonds drives the re-dispersion of Pt particles into smaller clusters.155 These studies154,155 suggested the formation of a monolayer of oxidized Pt on the surface of a ceria-based material after treatment in an oxygen atmosphere. Based on the binding energy of the corresponding species in Pt 4f spectra, we speculate that the species described in that work are similar to Pt2+ species anchored at {100} facets described above.
On single-crystal-based Pt–CeO2 model films containing traces of metallic Pt, annealing in a H2 atmosphere was shown to trigger reduction of Pt2+ and formation of metallic Pt, both in the form of sub-nanometer sized aggregates and larger Pt particles.98,99 The corresponding situation is shown in Fig. 32a.
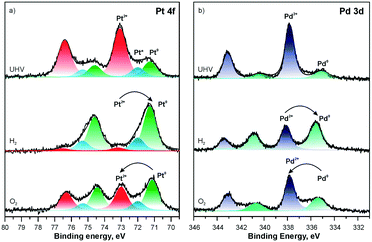 | ||
| Fig. 32 The development of Pt 4f (a) and Pd 3d (b) spectra obtained from Pt–CeO2 and Pd–CeO2 films, respectively, following the annealing in UHV (top), under H2 (middle), and O2 (bottom) atmosphere. | ||
Remarkably, the subsequent annealing of the Pt–CeO2 film in oxygen triggers partial re-dispersion of metallic Pt particles. We observe a partial recovery of the characteristic signal associated with the Pt2+ species anchored at the {100} sites (Fig. 32a). Similar and partially reversible changes were also observed between Pd2+ species and metallic Pd particles (Fig. 32b). The degree of reversibility between two oxidation states likely depends on the conditions of the redox treatment, e.g. the temperature and the pressure of hydrogen and oxygen. Additionally, the degree of sintering can be controlled by the metal loading in a ceria-based catalyst.156 In this respect the ideal Pt loading should allow full recovery of the atomically dispersed state.104 It is likely that the degree of stabilization and the strong dependence of the catalytic activity (power density) on Pt loading observed for the Pt–CeO2 anode fuel cell catalysts are associated with the degree of reversibility that can be achieved in the catalyst film.41
7. Active state of Pt–CeO2 thin film catalysts under electrochemical conditions
The active state of the Pt–CeO2 catalyst films under electrochemical conditions can be examined by means of spectro-electrochemical methods. In line with the above discussion, changes of the electrode potential give rise to dynamic changes in the oxidation state of ceria and, in response, also of the supported Pt species. The stability of Pt–CeO2 catalyst films was investigated as a function of Pt loading by means of electrochemical infrared spectroscopy.109 In these experiments CO formed during electro-oxidation of methanol was employed as a probe molecule. The corresponding IR spectra obtained from Pt–CeOx films are presented in Fig. 33. Reference spectra obtained from Pt(111) under identical conditions are also shown for comparison.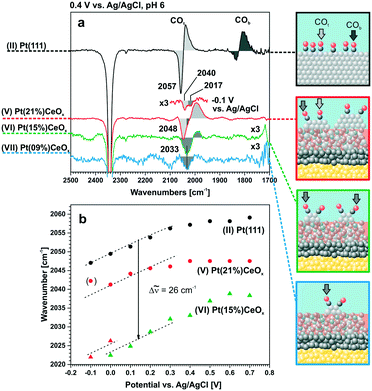 | ||
| Fig. 33 Comparison of the electrochemical IR spectra taken during methanol oxidation on Pt–CeOx electrocatalysts with different Pt concentrations at pH 6 (1 M CH3OH in 0.1 M HClO4): (a) IR spectra at an electrode potential of 0.4 VAg/AgCl (reference −0.15 VAg/AgCl); (b) peak position of the on-top CO band as a function of the electrode potential. The samples are numbered (I–VII) for easy comparison. Reproduced with permission from ref. 109, Copyright 2016, American Chemical Society. | ||
Typically, CO adsorption on Pt(111) gives rise to two bands associated with adsorption in on-top (COt) and bridging (COb) configurations (see Fig. 33a). Clearly, the emergence of COt stretching bands on Pt–CeOx films indicates that a fraction of the atomically dispersed Pt2+ species was converted into metallic Pt particles already in the first potential cycle. The red shift and broadening of the COt band along with the absence of the COb on Pt–CeOx films suggests the formation of small Pt aggregates with less developed (111) facets.157 In particular, the contributions from the low-coordinated sites and from (111) facet are well resolved on Pt–CeOx films with high Pt loading (see dark and light grey areas and arrows in Fig. 33a). In the limit of low Pt loadings, the COt band is dominated by the contributions from CO adsorbed at low-coordinated sites. This situation is consistent with the formation of sub-nanometer-sized Pt particles that do not expose any measurable fraction of regular (111) facets.
Under electrochemical conditions, the blue shift of the COt bands with increasing electrode potential is associated with the Stark effect.158 The relative offsets in the Stark plot between the Pt(111) and Pt–CeOx films (Fig. 33b) are related to the size of supported Pt particles. Density functional modeling reinforces the correlation between the stretching frequency and the particle size, on both unsupported and supported Pt particles.109,110 In particular, the offset of the CO vibrational frequencies by 26 cm−1 with respect to Pt(111) indicates the formation of sub-nanometer-sized particles containing about 30 Pt atoms per particle.
The findings both in UHV and under electrochemical conditions suggest that the conversion of atomically dispersed Pt2+ to sub-nanometer sized Pt particles transforms the Pt–CeOx film into an electrocatalytically active state. Notably, the stability of the sub-nanometer Pt particles under electrochemical conditions is a function of the Pt loading. A progressive blue shift of the COt band on the Pt–CeOx film with high Pt loading during repetitive cycling is associated with sintering and growth of larger Pt particles with defined (111) facets (Fig. 34a). In sharp contrast, such changes are not seen for Pt–CeOx films with low Pt loading, even after repeated potential cycling (Fig. 34b). This behavior is consistent with enhanced stability of the sub-nanometer Pt particles on Pt–CeOx films with low Pt loading in an electrochemical environment.
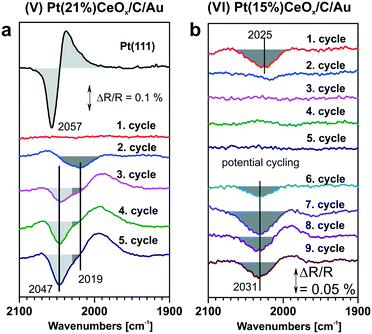 | ||
| Fig. 34 Electrochemical IR spectra during repeated cycles of methanol oxidation on (a) Pt(21%)–CeOx/C/Au and (b) Pt(15%)–CeOx/C/Au at 0.4 VAg/AgCl. All reference spectra were taken at a potential of −0.15 VAg/AgCl. Adapted with permission from ref. 109, Copyright 2016, American Chemical Society. | ||
The enhanced stability of the sub-nanometer Pt particles is associated with the strong interaction between Pt particles and ceria support. The above findings suggest that Pt2+ species are formed under oxidizing conditions, which prevents the Pt particles from sintering during potential cycling. In this respect, the abundance of the {100} sites determines the maximum Pt loading in Pt–CeOx films up to which the stabilization mechanism will operate. At Pt loadings exceeding the density of these sites, the formation and growth of larger metallic Pt particles is no longer suppressed.
In summary, the Pt–CeOx catalyst with ideal Pt loading will be able to undergo reversible conversion between atomically dispersed Pt2+ species and sub-nanometer Pt particles as a function of the oxidation state and/or the electrode potential.
A consistent scenario would involve the presence of two stable states, denoted as the working state and the resting state (see Fig. 35). Accordingly, the resting state is associated with the formation of atomically dispersed Pt2+ anchored at {100} nanofacets. The conversion from the resting state into the working state is accompanied by the formation of sub-nanometer Pt particles triggered by the reduction under electrochemical conditions. Conversely, the resting state is recovered upon returning to oxidizing conditions. Note that such dynamic changes of the Pt oxidation state are typically associated with dissolution processes and sintering. In the presence of the ceria support, the release of Pt species may be prevented, leading to enhanced stability and constant activity.
Conclusions
A dynamic catalyst concept involving a single atom catalyst state has been applied to prepare anode fuel cell catalysts with high noble metal efficiency and enhanced stability. The approach involves the deposition of thin Pt–CeO2 films on carbon substrates by means of radio frequency magnetron sputtering from separate CeO2 and Pt targets in a non-reactive atmosphere. The deposition process is accompanied by the etching of carbon substrates yielding highly porous columnar structures coated with Pt–CeO2 films. Atomically dispersed Pt was found to be present in these films in the form of Pt2+ and Pt4+ species at the surface and in the bulk, respectively. The ratio between the Pt2+ and Pt4+ species strongly depends on the degree of the nanostructuring of the Pt–CeO2 films. Fuel cell tests demonstrated the direct link between the electrocatalytic performance of the Pt–CeO2 films and the density of the surface Pt2+ species.The local structure and reactivity of the Pt2+ species supported on nanostructured ceria films have been investigated by a variety of techniques including high-resolution TEM, SRPES, AR XPS, HAXPS, and STM in combination with density functional modeling. The appropriate model systems were developed to identify possible anchoring sites for the atomically dispersed Pt species. By means of density functional calculations and surface-science-based model catalysts the adsorption sites yielding strongly anchored Pt2+ were associated with {100} nanofacets on ceria particles. There, the Pt2+ species were found to be located in the center of a planar PtO4 moiety forming a quadratic coordination environment. A similar structural element was found at the steps of CeO2(111) films. CeO2(100) nanofacets were also identified on real Pt–CeO2 catalyst films by means of HRTEM.
The stability and the reactivity of the Pt2+ species were investigated as a function of Pt loading on the model Pt–CeO2 films under ultra-high vacuum conditions. It was found that the capacity of the nanostructured ceria surface to form isolated Pt2+ is limited by the number of available {100} sites. If the Pt loading exceeds the density of anchoring sites available, the growth of Pt nanoparticles is observed.
The activation of molecular hydrogen at single Pt2+ species is associated with a high activation barrier. In the presence of metallic Pt, the hydrogen activation is facile and eventually leads to reduction of all Pt2+ species. It was found that metallic Pt is not directly involved in the reduction of the Pt2+ species. Instead the reduction of Pt2+ is coupled to the reduction of Ce4+ to Ce3+, resulting from the formation of oxygen vacancies. Reaction with methanol also leads to reduction of the ceria support and triggers the formation of sub-nanometer Pt particles. Alternatively, the reduction of Pt2+ and the formation of Pt particles can also be mediated by co-adsorption of reducing agents such as Sn that lead to formation of Ce3+ without formation of oxygen vacancies. In an electrochemical environment, conversion of the Pt2+ species to sub-nanometer Pt particles is triggered by the electrode potential.
The sub-nanometer Pt particles exhibit remarkable thermal stability with respect to sintering under both UHV and electrochemical conditions. The chemical properties of the supported sub-nanometer-sized particles are modified by metal–support interactions associated with strong charge transfer, by their structural flexibility, and by spillover phenomena. Regarding the electronic metal support interactions between Pt particles and ceria, the amount of charge accumulated on the Pt particle depends on the Pt particle, the particle density, the structure and the stoichiometry of the ceria support.
From the above results, a consistent picture emerges with respect to the operation of the Pt–CeO2 catalyst films under electrochemical conditions. The stabilization mechanism involves reversible conversion between two chemical states, the atomically dispersed Pt2+ species and sub-nanometer-sized Pt particles in an electrochemical environment. This concept rationalizes the high stability of the Pt–CeO2 catalyst films with low Pt loading under conditions of dynamically changing electrode potentials.
Regarding the transfer of the above described concepts to other less expensive metals, similar anchoring phenomena were predicted by density functional modeling for various metals from groups 8 to 11. The general trends in the energetics of the corresponding atomically dispersed metals have been established and could for some metals (Pd, Ni) be confirmed by experiments. However, characteristic differences are observed regarding the stability and segregation behavior, rendering the Pt–CeO2 system unique in this comparison.
Outlook
At present, one challenge regarding the application of single-atom-based Pt–CeO2 films in fuel cell catalysis is the limited density of the {100} sites, which also limits the total Pt loading and the resulting power density. Different strategies may be employed to tackle this challenge. The first strategy focuses on the improvement of the carbon supports. Along this line, GDLs coated with soot or nitrogen doped carbon films demonstrated great potential.45,54 The second strategy involves shaping the morphology of the Pt–CeO2 film into high-surface area nanostructures with a large fraction of {100} facets, e.g. cubes or nanoscrews.159,160 This can be achieved, for instance, by innovative deposition techniques or a strain driven growth induced, for example, by doping. As a last strategy, we may consider to prepare the key structure, i.e. the square planar PtO4 moiety, on a different support with a higher degree of nanostructuring.Additional insight from theoretical modelling studies should also contribute to unravelling in greater detail the mechanism of reversible conversion between Pt2+ and the sub-nanometer Pt particles and their interaction with reactants. This will allow establishing a kinetic model of the catalyst under fuel-cell operating conditions, providing valuable understanding of the factors influencing the performance of catalytic materials with atomically dispersed metals.
List of abbreviations
| AR XPS | Angle-resolved X-ray photoelectron spectroscopy |
| nanoGDL, n-GDL | Carbon nanoparticle coated gas diffusion layer |
| CVD-CNTs | Chemical vapor deposited carbon nanotubes |
| DFT | Density functional theory |
| DWCNTs | Double-wall carbon nanotubes |
| EMSI | Electronic metal–support interactions |
| GDL | Gas diffusion layer |
| GLAD | Glancing angle deposition |
| HAXPS | Hard X-ray photoelectron spectroscopy |
| SRPES | High-resolution synchrotron spectroscopy |
| HRTEM | High-resolution transmission electron microscopy |
| IRAS | Infrared absorption spectroscopy |
| MWCNTs | Multi-wall carbon nanotubes |
| ND | Normal deposition |
| PD | Power density |
| PEMFC | Proton exchange membrane fuel cell |
| RER | Resonant enhancement ratio |
| RPES | Resonant photoemission spectroscopy |
| SEM | Scanning electron microscopy |
| SAC | Single atom catalyst |
| SP | Specific power |
| UHV | Ultrahigh vacuum |
| XPS | X-ray photoelectron spectroscopy |
Acknowledgements
This work was funded by the European Community (FP7-NMP.2012.1.1-1 project chipCAT, Reference No. 310191), by the Deutsche Forschungsgemeinschaft (DFG) within the Excellence Cluster “Engineering of Advanced Materials” in the framework of the excellence initiative, by the Spanish MINECO (grants CTQ2012-34969 and CTQ2015-64618-R/FEDER), by the Generalitat de Catalunya (grants 2014SGR97 and XRQTC), and by the Czech Ministry of Education (grant LM2015057). Computer resources, technical expertise and assistance were provided by the Red Española de Supercomputación. Y. L. and coworkers thank Elettra for excellent working conditions and support. The authors also acknowledge the CERIC-ERIC Consortium for the access to experimental facilities and financial support and the COST Action CM1104 for travel support. Finally, the authors thank all colleagues involved in the chipCAT project for their dedication and invaluable contributions.References
- Y. Wang, K. S. Chen, J. Mishler, S. C. Cho and X. C. Adroher, A review of polymer electrolyte membrane fuel cells: Technology, applications, and needs on fundamental research, Appl. Energy, 2011, 88, 981–1007 CrossRef CAS.
- S. C. Kelley, G. A. Deluga and W. H. Smyrl, Miniature fuel cells fabricated on silicon substrates, AIChE J., 2002, 48, 1071–1082 CrossRef CAS.
- J. D. Morse, Micro-fuel cell power sources, Int. J. Energy Res., 2007, 31, 576–602 CrossRef CAS.
- T. U. D. o. E. (DOE), Energy Efficiency and Renewable Energy, http://www.eere.energy.gov/hydrogenandfuelcells/mypp/pdfs/fuel_cells.pdf.
- C. Wang, M. Yang and M. Flytzani-Stephanopoulos, Single gold atoms stabilized on nanoscale metal oxide supports are catalytic active centers for various reactions, AIChE J., 2016, 62, 429–439 CrossRef CAS.
- J. Liu, Catalysis by Supported Single Metal Atoms, ACS Catal., 2017, 7, 34–59 CrossRef CAS.
- S. Liang, C. Hao and Y. Shi, The Power of Single-Atom Catalysis, ChemCatChem, 2015, 7, 2559–2567 CrossRef CAS.
- X.-F. Yang, A. Wang, B. Qiao, J. Li, J. Liu and T. Zhang, Single-Atom Catalysts: A New Frontier in Heterogeneous Catalysis, Acc. Chem. Res., 2013, 46, 1740–1748 CrossRef CAS PubMed.
- M. Flytzani-Stephanopoulos and B. C. Gates, Atomically Dispersed Supported Metal Catalysts, Annu. Rev. Chem. Biomol. Eng., 2012, 3, 545–574 CrossRef CAS PubMed.
- C. K. Narula and M. Moses-DeBusk, in Catalysis by Materials with Well-Defined Structures, ed. S. H. Overbury, Elsevier, Amsterdam, 2015, pp. 263–274 Search PubMed.
- N. Cheng, S. Stambula, D. Wang, M. N. Banis, J. Liu, A. Riese, B. Xiao, R. Li, T.-K. Sham, L.-M. Liu, G. A. Botton and X. Sun, Platinum single-atom and cluster catalysis of the hydrogen evolution reaction, Nat. Commun., 2016, 7, 13638 CrossRef CAS PubMed.
- S. Sun, G. Zhang, N. Gauquelin, N. Chen, J. Zhou, S. Yang, W. Chen, X. Meng, D. Geng, M. N. Banis, R. Li, S. Ye, S. Knights, G. A. Botton, T.-K. Sham and X. Sun, Single-atom Catalysis Using Pt/Graphene Achieved through Atomic Layer Deposition, Sci. Rep., 2013, 3, 1775 CrossRef.
- H. Wang, Q. Feng, Y. Cheng, Y. Yao, Q. Wang, K. Li, U. Schwingenschlögl, X. X. Zhang and W. Yang, Atomic Bonding between Metal and Graphene, J. Phys. Chem. C, 2013, 117, 4632–4638 CAS.
- S. Yang, J. Kim, Y. J. Tak, A. Soon and H. Lee, Single-Atom Catalyst of Platinum Supported on Titanium Nitride for Selective Electrochemical Reactions, Angew. Chem., Int. Ed., 2016, 55, 2058–2062 CrossRef CAS PubMed.
- R.-Q. Zhang, T.-H. Lee, B.-D. Yu, C. Stampfl and A. Soon, The role of titanium nitride supports for single-atom platinum-based catalysts in fuel cell technology, Phys. Chem. Chem. Phys., 2012, 14, 16552–16557 RSC.
- K. Mao, L. Li, W. Zhang, Y. Pei, X. C. Zeng, X. Wu and J. Yang, A Theoretical Study of Single-Atom Catalysis of CO Oxidation Using Au Embedded 2D h-BN Monolayer: A CO-Promoted O2 Activation, Sci. Rep., 2014, 4, 5441 CrossRef CAS PubMed.
- G. Vilé, D. Albani, M. Nachtegaal, Z. Chen, D. Dontsova, M. Antonietti, N. López and J. Pérez-Ramírez, A Stable Single-Site Palladium Catalyst for Hydrogenations, Angew. Chem., Int. Ed., 2015, 54, 11265–11269 CrossRef PubMed.
- J. M. Thomas, Catalysis: Tens of thousands of atoms replaced by one, Nature, 2015, 525, 325–326 CrossRef CAS PubMed.
- J. Lu, C. Aydin, N. D. Browning and B. C. Gates, Imaging Isolated Gold Atom Catalytic Sites in Zeolite NaY, Angew. Chem., Int. Ed., 2012, 51, 5842–5846 CrossRef CAS PubMed.
- A. Uzun, V. Ortalan, Y. Hao, N. D. Browning and B. C. Gates, Imaging Gold Atoms in Site-Isolated MgO-Supported Mononuclear Gold Complexes, J. Phys. Chem. C, 2009, 113, 16847–16849 CAS.
- A. Bruix, Y. Lykhach, I. Matolínová, A. Neitzel, T. Skála, N. Tsud, M. Vorokhta, V. Stetsovych, K. Ševčiková, J. Mysliveček, R. Fiala, M. Václavů, K. C. Prince, S. Bruyere, V. Potin, F. Illas, V. Matolín, J. Libuda and K. M. Neyman, Maximum Noble Metal Efficiency in Catalytic Materials: Atomically Dispersed Surface Platinum, Angew. Chem., Int. Ed., 2014, 53, 10525–10530 CrossRef CAS PubMed.
- F. Dvořák, M. Farnesi Camellone, A. Tovt, N.-D. Tran, F. R. Negreiros, M. Vorokhta, T. Skála, I. Matolínová, J. Mysliveček, V. Matolín and S. Fabris, Creating single-atom Pt-ceria catalysts by surface step decoration, Nat. Commun., 2016, 7, 10801 CrossRef PubMed.
- B. T. Qiao, A. Q. Wang, X. F. Yang, L. F. Allard, Z. Jiang, Y. T. Cui, J. Y. Liu, J. Li and T. Zhang, Single-atom catalysis of CO oxidation using Pt1/FeOx, Nat. Chem., 2011, 3, 634–641 CrossRef CAS PubMed.
- R. Si and M. Flytzani-Stephanopoulos, Shape and Crystal-Plane Effects of Nanoscale Ceria on the Activity of Au-CeO2 Catalysts for the Water–Gas Shift Reaction, Angew. Chem., Int. Ed., 2008, 47, 2884–2887 CrossRef CAS PubMed.
- J. H. Kwak, J. Z. Hu, D. Mei, C. W. Yi, D. H. Kim, C. H. F. Peden, L. F. Allard and J. Szanyi, Coordinatively unsaturated Al3+ centers as binding sites for active catalyst phases of platinum on gamma-Al2O3, Science, 2009, 325, 1670–1673 CrossRef CAS PubMed.
- P. Hu, Z. Huang, Z. Amghouz, M. Makkee, F. Xu, F. Kapteijn, A. Dikhtiarenko, Y. Chen, X. Gu and X. Tang, Electronic Metal–Support Interactions in Single-Atom Catalysts, Angew. Chem., Int. Ed., 2014, 53, 3418–3421 CrossRef CAS PubMed.
- J. Jones, H. Xiong, A. T. DeLaRiva, E. J. Peterson, H. Pham, S. R. Challa, G. Qi, S. Oh, M. H. Wiebenga, X. I. Pereira Hernández, Y. Wang and A. K. Datye, Thermally stable single-atom platinum-on-ceria catalysts via atom trapping, Science, 2016, 353, 150–154 CrossRef CAS PubMed.
- L. Wang, W. Zhang, S. Wang, Z. Gao, Z. Luo, X. Wang, R. Zeng, A. Li, H. Li, M. Wang, X. Zheng, J. Zhu, W. Zhang, C. Ma, R. Si and J. Zeng, Atomic-level insights in optimizing reaction paths for hydroformylation reaction over Rh/CoO single-atom catalyst, Nat. Commun., 2016, 7, 14036 CrossRef CAS PubMed.
- T. Rajesh, A. K. Rajarajan, C. S. Gopinath and R. N. Devi, Evidence of Cationic Pt Active for Water-Gas Shift Reaction: Pt-Doped BaCeO3 Perovskite, J. Phys. Chem. C, 2012, 116, 9526–9532 CAS.
- J. Liu, Advanced Electron Microscopy of Metal–Support Interactions in Supported Metal Catalysts, ChemCatChem, 2011, 3, 934–948 CrossRef CAS.
- G. S. Parkinson, Z. Novotny, G. Argentero, M. Schmid, J. Pavelec, R. Kosak, P. Blaha and U. Diebold, Carbon monoxide-induced adatom sintering in a Pd–Fe3O4 model catalyst, Nat. Mater., 2013, 12, 724–728 CrossRef CAS PubMed.
- K. T. Rim, D. Eom, L. Liu, E. Stolyarova, J. M. Raitano, S.-W. Chan, M. Flytzani-Stephanopoulos and G. W. Flynn, Charging and Chemical Reactivity of Gold Nanoparticles and Adatoms on the (111) Surface of Single-Crystal Magnetite: A Scanning Tunneling Microscopy/Spectroscopy Study, J. Phys. Chem. C, 2009, 113, 10198–10205 CAS.
- Z. Huang, X. Gu, Q. Cao, P. Hu, J. Hao, J. Li and X. Tang, Catalytically Active Single-Atom Sites Fabricated from Silver Particles, Angew. Chem., Int. Ed., 2012, 51, 4198–4203 CrossRef CAS PubMed.
- C. T. Campbell, Catalyst-support interactions: Electronic perturbations, Nat. Chem., 2012, 4, 597–598 CrossRef CAS PubMed.
- G. Pacchioni, Electronic interactions and charge transfers of metal atoms and clusters on oxide surfaces, Phys. Chem. Chem. Phys., 2013, 15, 1737–1757 RSC.
- M. S. Hegde and P. Bera, Noble Metal Ion Substituted CeO2 Catalysts: Electronic Interaction between Noble Metal Ions and CeO2 Lattice, Catal. Today, 2015, 253, 40–50 CrossRef CAS.
- M. S. Hegde, G. Madras and K. C. Patil, Noble Metal Ionic Catalysts, Acc. Chem. Res., 2009, 42, 704–712 CrossRef CAS PubMed.
- E. W. McFarland and H. Metiu, Catalysis by Doped Oxides, Chem. Rev., 2013, 113, 4391–4427 CrossRef CAS PubMed.
- V. Matolín, M. Cabala, I. Matolínová, M. Škoda, M. Václavů, K. C. Prince, T. Skála, T. Mori, H. Yoshikawa, Y. Yamashita, S. Ueda and K. Kobayashi, Pt and Sn Doped Sputtered CeO2 Electrodes for Fuel Cell Applications, Fuel Cells, 2010, 10, 139–144 Search PubMed.
- M. Vaclavu, I. Matolinova, J. Myslivecek, R. Fiala and V. Matolin, Anode Material for Hydrogen Polymer Membrane Fuel Cell: Pt-CeO2 RF-Sputtered Thin Films, J. Electrochem. Soc., 2009, 156, B938–B942 CrossRef CAS.
- R. Fiala, A. Figueroba, A. Bruix, M. Vaclavu, A. Rednyk, I. Khalakhan, M. Vorokhta, J. Lavkova, F. Illas, V. Potin, I. Matolinova, K. M. Neyman and V. Matolin, High efficiency of Pt2+-CeO2 novel thin film catalyst as anode for proton exchange membrane fuel cells, Appl. Catal., B, 2016, 197, 262–270 CrossRef CAS.
- V. Matolín, I. Matolínová, M. Václavů, I. Khalakhan, M. Vorokhta, R. Fiala, I. Piš, Z. Sofer, J. Poltierová-Vejpravová, T. Mori, V. Potin, H. Yoshikawa, S. Ueda and K. Kobayashi, Platinum-doped CeO2 thin film catalysts prepared by magnetron sputtering, Langmuir, 2010, 26, 12824–12831 CrossRef PubMed.
- R. Fiala, I. Khalakhan, I. Matolínová, M. Václavů, M. Vorokhta, Z. Sofer, S. Huber, V. Potin and V. Matolín, Pt-CeO2 Coating of Carbon Nanotubes Grown on Anode Gas Diffusion Layer of the Polymer Electrolyte Membrane Fuel Cell, J. Nanosci. Nanotechnol., 2011, 11, 5062–5067 CrossRef CAS PubMed.
- R. Fiala, M. Vaclavu, A. Rednyk, I. Khalakhan, M. Vorokhta, J. Lavkova, V. Potin, I. Matolinova and V. Matolin, Pt–CeOx Thin Film Catalysts for PEMFC, Catal. Today, 2015, 240(Part B), 236–241 CrossRef CAS.
- I. Khalakhan, R. Fiala, J. Lavková, P. Kúš, A. Ostroverkh, M. Václavů, M. Vorokhta, I. Matolínová and V. Matolín, Candle Soot as Efficient Support for Proton Exchange Membrane Fuel Cell Catalyst, Fuel Cells, 2016, 16, 652–655 CrossRef CAS.
- V. Matolín, I. Khalakhan, I. Matolínová, M. Václavů, K. Veltruská and M. Vorokhta, Pt2+,4+ ions in CeO2 rf-sputtered thin films, Surf. Interface Anal., 2010, 42, 882–885 CrossRef.
- R. Fiala, M. Vaclavu, M. Vorokhta, I. Khalakhan, J. Lavková, V. Potin, I. Matolínová and V. Matolín, Proton Exchange Membrane Fuel Cell Made of Magnetron Sputtered Pt-CeOx and Pt-Co Thin Film Catalysts, J. Power Sources, 2015, 273, 105–109 CrossRef CAS.
- H. Yoshikawa, I. Matolínová and V. Matolín, Practical chemical analysis of Pt and Pd based heterogeneous catalysts with hard X-ray photoelectron spectroscopy, J. Electron Spectrosc. Relat. Phenom., 2013, 190(Part B), 268–277 CrossRef CAS.
- K. Ševčíková, V. Nehasil, M. Vorokhta, S. Haviar, V. Matolín, I. Matolínová, K. Mašek, I. Píš, K. Kobayashi, M. Kobata, T. Nagata, Y. Matsushita and H. Yoshikawa, Altering properties of cerium oxide thin films by Rh doping, Mater. Res. Bull., 2015, 67, 5–13 CrossRef.
- V. Matolin, M. Cabala, I. Matolinova, M. Skoda, J. Libra, M. Vaclavu, K. C. Prince, T. Skala, H. Yoshikawa, Y. Yamashita, S. Ueda and K. Kobayashi, Au+ and Au3+ ions in CeO2 rf-sputtered thin films, J. Phys. D: Appl. Phys., 2009, 42, 115301 CrossRef.
- V. Matolín, R. Fiala, I. Khalakhan, J. Lavková, M. Václavů and M. Vorokhta, Nanoporous Ptn+-CeOx catalyst films grown on carbon substrates, Int. J. Nanotechnol., 2012, 9, 680–694 CrossRef.
- M. Vorokhta, I. Khalakhan, I. Matolínová, M. Kobata, H. Yoshikawa, K. Kobayashi and V. Matolín, Nanostructured Pt–CeO2 thin film catalyst grown on graphite foil by magnetron sputtering, Appl. Surf. Sci., 2013, 267, 119–123 CrossRef CAS.
- I. Khalakhan, M. Dubau, S. Haviar, J. Lavková, I. Matolínová, V. Potin, M. Vorokhta and V. Matolín, Growth of nano-porous Pt-doped cerium oxide thin films on glassy carbon substrate, Ceram. Int., 2013, 39, 3765–3769 CrossRef CAS.
- M. Dubau, J. Lavková, I. Khalakhan, S. Haviar, V. Potin, V. R. Matolín and I. Matolínová, Preparation of Magnetron Sputtered Thin Cerium Oxide Films with a Large Surface on Silicon Substrates Using Carbonaceous Interlayers, ACS Appl. Mater. Interfaces, 2014, 6, 1213–1218 CAS.
- S. Haviar, M. Dubau, J. Lavková, I. Khalakhan, V. Potin, V. Matolín and I. Matolínová, Investigation of Growth Mechanism of Thin Sputtered Cerium Oxide Films on Carbon Substrates, Sci. Adv. Mater., 2014, 6, 1278–1285 CrossRef CAS.
- J. Lavkova, I. Khalakhan, M. Chundak, M. Vorokhta, V. Potin, V. Matolin and I. Matolinova, Growth and composition of nanostructured and nanoporous cerium oxide thin films on a graphite foil, Nanoscale, 2015, 7, 4038–4047 RSC.
- M. Vorokhta, I. Khalakhan, I. Matolínová, J. Nováková, S. Haviar, J. Lančok, M. Novotný, H. Yoshikawa and V. Matolín, PLD prepared nanostructured Pt-CeO2 thin films containing ionic platinum, Appl. Surf. Sci., 2017, 396, 278–283 CrossRef CAS.
- N. Zanfoni, L. Avril, L. Imhoff, B. Domenichini and S. Bourgeois, Direct liquid injection chemical vapor deposition of platinum doped cerium oxide thin films, Thin Solid Films, 2015, 589, 246–251 CrossRef CAS.
- L. Avril, N. Zanfoni, P. Simon, L. Imhoff, S. Bourgeois and B. Domenichini, MOCVD growth of porous cerium oxide thin films on silicon substrate, Surf. Coat. Technol., 2015, 280, 148–153 CrossRef CAS.
- P. Simon, N. Zanfoni, L. Avril, Z. Li, V. Potin, B. Domenichini and S. Bourgeois, Nanoporous Platinum Doped Cerium Oxides Thin Films Grown on Silicon Substrates: Ionic Platinum Localization and Stability, Adv. Mater. Interfaces, 2017, 4, 1600821 CrossRef.
- P. Simon, N. Zanfoni, L. Avril, J. Lavkova, I. Matolinova, L. Imhoff, V. Potin, B. Domenichini and S. Bourgeois, Observation of surface reduction in porous ceria thin film grown on graphite foil substrate, Mater. Today, 2016, 3, 2772–2779 CrossRef.
- I. Matolínová, R. Fiala, I. Khalakhan, M. Vorokhta, Z. Sofer, H. Yoshikawa, K. Kobayashi and V. Matolín, Synchrotron radiation photoelectron spectroscopy study of metal-oxide thin film catalysts: Pt-CeO2 coated CNTs, Appl. Surf. Sci., 2012, 258, 2161–2164 CrossRef.
- S. Bruyère, A. Cacucci, V. Potin, I. Matolinova, M. Vorokhta and V. Matolin, Deposition of Pt and Sn doped CeOx layers on silicon substrate, Surf. Coat. Technol., 2013, 227, 15–18 CrossRef.
- V. Potin, J. Lavkova, S. Bourgeois, M. Dubau, I. Matolinova and V. Matolin, Structural and Chemical Characterization of Cerium Oxide Thin Layers Grown on Silicon Substrate, Mater. Today, 2015, 2, 101–107 CrossRef.
- A. Migani, G. N. Vayssilov, S. T. Bromley, F. Illas and K. M. Neyman, Dramatic Reduction of the Oxygen Vacancy Formation Energy in Ceria Particles: A Possible Key to Their Remarkable Reactivity at the Nanoscale, J. Mater. Chem., 2010, 20, 10535–10546 RSC.
- A. Migani, K. M. Neyman and S. T. Bromley, Octahedrality versus tetrahedrality in stoichiometric ceria nanoparticles, Chem. Commun., 2012, 48, 4199–4201 RSC.
- F. Zhang, Q. Jin and S.-W. Chan, Ceria nanoparticles: Size, size distribution, and shape, J. Appl. Phys., 2004, 95, 4319–4326 CrossRef CAS.
- A. Migani, G. N. Vayssilov, S. T. Bromley, F. Illas and K. M. Neyman, Greatly Facilitated Oxygen Vacancy Formation in Ceria Nanocrystallites, Chem. Commun., 2010, 46, 5936–5938 RSC.
- M. M. Branda, R. M. Ferullo, M. Causà and F. Illas, Relative stabilities of low index and stepped CeO2 surfaces from hybrid and GGA plus U implementations of density functional theory, J. Phys. Chem. C, 2011, 115, 3716–3721 CAS.
- A. Bruix and K. M. Neyman, Modeling Ceria-Based Nanomaterials for Catalysis and Related Applications, Catal. Lett., 2016, 146, 2053–2080 CrossRef CAS.
- A. Bruix, K. M. Neyman and F. Illas, Adsorption, oxidation state, and diffusion of Pt atoms on the CeO2(111) surface, J. Phys. Chem. C, 2010, 114, 14202–14207 CAS.
- A. Bruix, F. Nazari, K. M. Neyman and F. Illas, On the adsorption and formation of Pt dimers on the CeO2(111) surface, J. Chem. Phys., 2011, 135, 244708 CrossRef PubMed.
- A. Bruix, A. Migani, G. N. Vayssilov, K. M. Neyman, J. Libuda and F. Illas, Effects of deposited Pt particles on the reducibility of CeO2(111), Phys. Chem. Chem. Phys., 2011, 13, 11384–11392 RSC.
- K. M. Neyman, C. Inntam, V. A. Nasluzov, R. Kosarev and N. Rösch, Adsorption of d-metal atoms on the regular MgO(001) surface: Density functional study of cluster models embedded in an elastic polarizable environment, Appl. Phys. A: Mater. Sci. Process., 2004, 78, 823–828 CrossRef CAS.
- K. M. Neyman, C. Inntam, A. V. Matveev, V. A. Nasluzov and N. Rösch, Single d-Metal Atoms on Fs and Fs+ Defects of MgO(001): A Theoretical Study across the Periodic Table, J. Am. Chem. Soc., 2005, 127, 11652–11660 CrossRef CAS PubMed.
- A. G. Hu, K. M. Neyman, M. Staufer, T. Belling, B. C. Gates and N. Rosch, A Surface Site as Polydentate Ligand of a Metal Complex: Density Functional Studies of Rhenium Subcarbonyls Supported on Magnesium Oxide, J. Am. Chem. Soc., 1999, 121, 4522–4523 CrossRef CAS.
- F. A. Cotton and G. Wilkinson, Advanced Inorganic Chemistry, Wiley, New York, 1990 Search PubMed.
- C. Kittel, Introduction to Solid State Physics, Wiley, New York, 1976 Search PubMed.
- Y. Nagai, T. Hirabayashi, K. Dohmae, N. Takagi, T. Minami, H. Shinjoh and S. Matsumoto, Sintering inhibition mechanism of platinum supported on ceria-based oxide and Pt-oxide-support interaction, J. Catal., 2006, 242, 103–109 CrossRef CAS.
- N. Nilius, S. M. Kozlov, J.-F. Jerratsch, M. Baron, X. Shao, F. Viñes, S. Shaikhutdinov, K. M. Neyman and H.-J. Freund, Formation of One-Dimensional Electronic States along the Step Edges of CeO2(111), ACS Nano, 2012, 6, 1126–1133 CrossRef CAS PubMed.
- S. M. Kozlov, F. Viñes, N. Nilius, S. Shaikhutdinov and K. M. Neyman, Absolute Surface Step Energies: Accurate Theoretical Methods Applied to Ceria Nanoislands, J. Phys. Chem. Lett., 2012, 3, 1956–1961 CrossRef CAS.
- A. Figueroba, G. Kovács, A. Bruix and K. M. Neyman, Towards stable single-atom catalysts: Strong binding of atomically dispersed transition metals on the surface of nanostructured ceria, Catal. Sci. Technol., 2016, 6, 6806–6813 CAS.
- M. A. Sk, S. M. Kozlov, K. H. Lim, A. Migani and K. M. Neyman, Oxygen Vacancies in Self-Assemblies of Ceria Nanoparticles, J. Mater. Chem. A, 2014, 2, 18329–18338 CAS.
- R. Nedyalkova, D. Niznansky and A.-C. Roger, Iron–ceria–zirconia fluorite catalysts for methane selective oxidation to formaldehyde, Catal. Commun., 2009, 10, 1875–1880 CrossRef CAS.
- A. Satsuma, M. Yanagihara, J. Ohyama and K. Shimizu, Oxidation of CO over Ru/Ceria prepared by self-dispersion of Ru metal powder into nano-sized particle, Catal. Today, 2013, 201, 62–67 CrossRef CAS.
- S. S. Y. Lin, D. H. Kim, M. H. Engelhard and S. Y. Ha, Water-induced formation of cobalt oxides over supported cobalt/ceria–zirconia catalysts under ethanol-steam conditions, J. Catal., 2010, 273, 229–235 CrossRef CAS.
- M. Haneda, K. Shinoda, A. Nagane, O. Houshito, H. Takagi, Y. Nakahara, K. Hiroe, T. Fujitani and H. Hamada, Catalytic performance of rhodium supported on ceria–zirconia mixed oxides for reduction of NO by propene, J. Catal., 2008, 259, 223–231 CrossRef CAS.
- Y. Huang, A. Wang, L. Li, X. Wang, D. Su and T. Zhang, “Ir-in-ceria”: A highly selective catalyst for preferential CO oxidation, J. Catal., 2008, 255, 144–152 CrossRef CAS.
- H. A. Aleksandrov, K. M. Neyman and G. N. Vayssilov, The Structure and Stability of Reduced and Oxidized Mononuclear Platinum Species on Nanostructured Ceria from Density Functional Modeling, Phys. Chem. Chem. Phys., 2015, 17, 14551–14560 RSC.
- T. Wu, X. Pan, Y. Zhang, Z. Miao, B. Zhang, J. Li and X. Yang, Investigation of the Redispersion of Pt Nanoparticles on Polyhedral Ceria Nanoparticles, J. Phys. Chem. Lett., 2014, 5, 2479–2483 CrossRef CAS PubMed.
- Y. Gao, W. Wang, S. Chang and W. Huang, Morphology Effect of CeO2 Support in the Preparation, Metal–Support Interaction, and Catalytic Performance of Pt/CeO2 Catalysts, ChemCatChem, 2013, 5, 3610–3620 CrossRef CAS.
- J. Carrasco, D. López-Durán, Z. Liu, T. Duchoň, J. Evans, S. D. Senanayake, E. J. Crumlin, V. Matolín, J. A. Rodríguez and M. V. Ganduglia-Pirovano, In Situ and Theoretical Studies for the Dissociation of Water on an Active Ni/CeO2 Catalyst: Importance of Strong Metal–Support Interactions for the Cleavage of O–H Bonds, Angew. Chem., Int. Ed., 2015, 54, 3917–3921 CrossRef CAS PubMed.
- S. Colussi, A. Gayen, M. Farnesi Camellone, M. Boaro, J. Llorca, S. Fabris and A. Trovarelli, Nanofaceted Pd–O Sites in Pd–Ce Surface Superstructures: Enhanced Activity in Catalytic Combustion of Methane, Angew. Chem., Int. Ed., 2009, 48, 8481–8484 CrossRef CAS PubMed.
- R. V. Gulyaev, T. Y. Kardash, S. E. Malykhin, O. A. Stonkus, A. S. Ivanova and A. I. Boronin, The local structure of PdxCe1-xO2-x-δ solid solutions, Phys. Chem. Chem. Phys., 2014, 16, 13523–13539 RSC.
- J. S. Elias, M. Risch, L. Giordano, A. N. Mansour and Y. Shao-Horn, Structure, Bonding, and Catalytic Activity of Monodisperse, Transition-Metal-Substituted CeO2 Nanoparticles, J. Am. Chem. Soc., 2014, 136, 17193–17200 CrossRef CAS PubMed.
- H. Müller-Buschbaum, Zur Kristallchemie der Oxoargentate und Silberoxometallate, Z. Anorg. Allg. Chem., 2004, 630, 2125–2175 CrossRef.
- A. M. Venezia, G. Pantaleo, A. Longo, G. Di Carlo, M. P. Casaletto, F. L. Liotta and G. Deganello, Relationship between Structure and CO Oxidation Activity of Ceria-Supported Gold Catalysts, J. Phys. Chem. B, 2005, 109, 2821–2827 CrossRef CAS PubMed.
- A. Neitzel, A. Figueroba, Y. Lykhach, T. Skála, M. Vorokhta, N. Tsud, S. Mehl, K. Ševčíková, K. C. Prince, K. M. Neyman, V. Matolín and J. Libuda, Atomically Dispersed Pd, Ni and Pt Species in Ceria-Based Catalysts: Principal Differences in Stability and Reactivity, J. Phys. Chem. C, 2016, 120, 9852–9862 CAS.
- Y. Lykhach, A. Figueroba, M. F. Camellone, A. Neitzel, T. Skála, F. R. Negreiros, M. Vorokhta, N. Tsud, K. C. Prince, S. Fabris, K. M. Neyman, V. Matolín and J. Libuda, Reactivity of Atomically Dispersed Pt2+ Species towards H2: Model Pt–CeO2 Fuel Cell Catalyst, Phys. Chem. Chem. Phys., 2016, 18, 7672–7679 RSC.
- F. Dvořák, O. Stetsovych, M. Steger, E. Cherradi, I. Matolínová, N. Tsud, M. Škoda, T. Skála, J. Mysliveček and V. Matolín, Adjusting Morphology and Surface Reduction of CeO2(111) Thin Films on Cu(111), J. Phys. Chem. C, 2011, 115, 7496–7503 Search PubMed.
- D. R. Mullins, P. M. Albrecht, T.-L. Chen, F. C. Calaza, M. D. Biegalski, H. M. Christen and S. H. Overbury, Water Dissociation on CeO2(100) and CeO2(111) Thin Films, J. Phys. Chem. C, 2012, 116, 19419–19428 CAS.
- A. Bruix, J. A. Rodriguez, P. J. Ramírez, S. D. Senanayake, J. Evans, J. B. Park, D. Stacchiola, P. Liu, J. Hrbek and F. Illas, A New Type of Strong Metal–Support Interaction and the Production of H2 through the Transformation of Water on Pt/CeO2(111) and Pt/CeOx/TiO2(110) Catalysts, J. Am. Chem. Soc., 2012, 134, 8968–8974 CrossRef CAS PubMed.
- Q. Fu, H. Saltsburg and M. Flytzani-Stephanopoulos, Active Nonmetallic Au and Pt Species on Ceria-Based Water-Gas Shift Catalysts, Science, 2003, 301, 935–938 CrossRef CAS PubMed.
- M. Hatanaka, N. Takahashi, T. Tanabe, Y. Nagai, K. Dohmae, Y. Aoki, T. Yoshida and H. Shinjoh, Ideal Pt loading for a Pt/CeO2-based catalyst stabilized by a Pt–O–Ce bond, Appl. Catal., B, 2010, 99, 336–342 CrossRef CAS.
- G. Ertl, H. Knözinger, F. Schüth and J. Weitkamp, Handbook of Heterogeneous Catalysis, Wiley, Weinheim, 2008 Search PubMed.
- F. M. Hoffmann, Infrared reflection-absorption spectroscopy of adsorbed molecules, Surf. Sci. Rep., 1983, 3, 107–192 CrossRef CAS.
- J. M. Chalmers and P. R. Griffiths, Handbook of vibrational spectroscopy, John Wiley & Sons, Ltd., Chichester, UK, 2001 Search PubMed.
- K. I. Hadjiivanov and G. N. Vayssilov, in Adv. Catal., Academic Press, 2002, vol. 47, pp. 307–511 Search PubMed.
- O. Brummel, F. Waidhas, F. Faisal, R. Fiala, M. Vorokhta, I. Khalakhan, M. Dubau, A. Figueroba, G. Kovács, H. A. Aleksandrov, G. N. Vayssilov, S. M. Kozlov, K. M. Neyman, V. Matolín and J. Libuda, Stabilization of Small Platinum Nanoparticles on Pt–CeO2 Thin Film Electrocatalysts During Methanol Oxidation, J. Phys. Chem. C, 2016, 120, 19723–19736 CAS.
- H. A. Aleksandrov, K. M. Neyman, K. I. Hadjiivanov and G. N. Vayssilov, Can the state of platinum species be unambiguously determined by the stretching frequency of an adsorbed CO probe molecule?, Phys. Chem. Chem. Phys., 2016, 18, 22108–22121 RSC.
- M. J. Kappers and J. H. van der Maas, Correlation between CO frequency and Pt coordination number. A DRIFT study on supported Pt catalysts, Catal. Lett., 1991, 10, 365–373 CrossRef CAS.
- A. Neitzel, Y. Lykhach, T. Skála, N. Tsud, M. Vorokhta, D. Mazur, K. C. Prince, V. Matolín and J. Libuda, Surface Sites on Pt–CeO2 Mixed Oxide Catalysts Probed by CO Adsorption: A Synchrotron Radiation Photoelectron Spectroscopy Study, Phys. Chem. Chem. Phys., 2014, 16, 24747–24754 RSC.
- G. N. Vayssilov, M. Mihaylov, P. S. Petkov, K. I. Hadjiivanov and K. M. Neyman, Reassignment of the Vibrational Spectra of Carbonates, Formates, and Related Surface Species on Ceria: A Combined Density Functional and Infrared Spectroscopy Investigation, J. Phys. Chem. C, 2011, 115, 23435–23454 CAS.
- G. Dutta, U. V. Waghmare, T. Baidya and M. S. Hegde, Hydrogen Spillover on CeO2/Pt: Enhanced Storage of Active Hydrogen, Chem. Mater., 2007, 19, 6430–6436 CrossRef CAS.
- P. Bera, K. R. Priolkar, A. Gayen, P. R. Sarode, M. S. Hegde, S. Emura, R. Kumashiro, V. Jayaram and G. N. Subbanna, Ionic Dispersion of Pt over CeO2 by the Combustion Method: Structural Investigation by XRD, TEM, XPS, and EXAFS, Chem. Mater., 2003, 15, 2049–2060 CrossRef CAS.
- B. D. Mukri, U. V. Waghmare and M. S. Hegde, Platinum Ion-Doped TiO2: High Catalytic Activity of Pt2+ with Oxide Ion Vacancy in Ti4+1–xPt2+xO2–x Compared to Pt4+ without Oxide Ion Vacancy in Ti4+1–xPt4+xO2, Chem. Mater., 2013, 25, 3822–3833 CrossRef CAS.
- Y. Lykhach, S. M. Kozlov, T. Skála, A. Tovt, V. Stetsovych, N. Tsud, F. Dvořák, V. Johánek, A. Neitzel, J. Mysliveček, S. Fabris, V. Matolín, K. M. Neyman and J. Libuda, Counting Electrons on Supported Nanoparticles, Nat. Mater., 2016, 15, 284–288 CrossRef CAS PubMed.
- Y. Lykhach, T. Staudt, M. Vorokhta, T. Skála, V. Johánek, K. C. Prince, V. Matolín and J. Libuda, Hydrogen Spillover Monitored by Resonant Photoemission Spectroscopy, J. Catal., 2012, 285, 6–9 CrossRef CAS.
- G. N. Vayssilov, Y. Lykhach, A. Migani, T. Staudt, G. P. Petrova, N. Tsud, T. Skála, A. Bruix, F. Illas, K. C. Prince, V. Matolín, K. M. Neyman and J. Libuda, Support Nanostructure Boosts Oxygen Transfer to Catalytically Active Platinum Nanoparticles, Nat. Mater., 2011, 10, 310–315 CrossRef CAS PubMed.
- C. Kittel, Introduction to Solid State Physics, 8th edition, Wiley, 2004 Search PubMed.
- A. Neitzel, V. Johánek, Y. Lykhach, T. Skála, N. Tsud, M. Vorokhta, V. Matolín and J. Libuda, Reduction of Pt2+ species in model Pt–CeO2 fuel cell catalysts upon reaction with methanol, Appl. Surf. Sci., 2016, 387, 674–681 CrossRef CAS.
- V. Matolín, J. Libra, M. Škoda, N. Tsud, K. C. Prince and T. Skála, Methanol Adsorption on a CeO2(111)/Cu(111) Thin Film Model Catalyst, Surf. Sci., 2009, 603, 1087–1092 CrossRef.
- D. R. Mullins, M. D. Robbins and J. Zhou, Adsorption and Reaction of Methanol on Thin-Film Cerium Oxide, Surf. Sci., 2006, 600, 1547–1558 CrossRef CAS.
- M. Capdevila-Cortada, M. García-Melchor and N. López, Unraveling the structure sensitivity in methanol conversion on CeO2: A DFT + U study, J. Catal., 2015, 327, 58–64 CrossRef CAS.
- D. J. Miller, H. Öberg, S. Kaya, H. Sanchez Casalongue, D. Friebel, T. Anniyev, H. Ogasawara, H. Bluhm, L. G. M. Pettersson and A. Nilsson, Oxidation of Pt(111) under Near-Ambient Conditions, Phys. Rev. Lett., 2011, 107, 195502 CrossRef CAS PubMed.
- F. Pilger, A. Testino, A. Carino, C. Proff, A. Kambolis, A. Cervellino and C. Ludwig, Size Control of Pt Clusters on CeO2 Nanoparticles via an Incorporation–Segregation Mechanism and Study of Segregation Kinetics, ACS Catal., 2016, 6, 3688–3699 CrossRef CAS.
- Y. Lykhach, A. Figueroba, T. Skála, T. Duchoň, N. Tsud, M. Aulická, A. Neitzel, K. Veltruská, K. C. Prince, V. Matolín, K. M. Neyman and J. Libuda, Redox-mediated conversion of atomically dispersed platinum to sub-nanometer particles, J. Mater. Chem. A, 2017, 5, 9250–9261 CAS.
- J. Paier, C. Penschke and J. Sauer, Oxygen Defects and Surface Chemistry of Ceria: Quantum Chemical Studies Compared to Experiment, Chem. Rev., 2013, 113, 3949–3985 CrossRef CAS PubMed.
- M. V. Ganduglia-Pirovano, J. L. F. Da Silva and J. Sauer, Density-Functional Calculations of the Structure of Near-Surface Oxygen Vacancies and Electron Localization on CeO2(111), Phys. Rev. Lett., 2009, 102, 026101–026104 CrossRef PubMed.
- T. Skála, F. Šutara, K. C. Prince and V. Matolín, Cerium oxide stoichiometry alteration via Sn deposition: Influence of temperature, J. Electron Spectrosc. Relat. Phenom., 2009, 169, 20–25 CrossRef.
- M. Škoda, M. Cabala, V. Cháb, K. C. Prince, L. Sedláček, T. Skála, F. Šutara and V. Matolín, Sn interaction with CeO2(111) system: Bimetallic bonding and ceria reduction, Appl. Surf. Sci., 2008, 254, 4375–4379 CrossRef.
- A. Neitzel, Y. Lykhach, T. Skála, N. Tsud, V. Johánek, M. Vorokhta, K. C. Prince, V. Matolín and J. Libuda, Hydrogen activation on Pt-Sn nanoalloys supported on mixed Sn-Ce oxide films, Phys. Chem. Chem. Phys., 2014, 16, 13209–13219 RSC.
- C. T. Campbell, S. C. Parker and D. E. Starr, The Effect of Size-Dependent Nanoparticle Energetics on Catalyst Sintering, Science, 2002, 298, 811–814 CrossRef CAS PubMed.
- G. N. Vayssilov, A. Migani and K. Neyman, Density Functional Modeling of the Interactions of Platinum Clusters with CeO2 Nanoparticles of Different Size, J. Phys. Chem. C, 2011, 115, 16081–16086 CAS.
- Z. Lu and Z. Yang, Interfacial properties of NM/CeO2(111) (NM = noble metal atoms or clusters of Pd, Pt and Rh): a first principles study, J. Phys.: Condens. Matter, 2010, 22, 475003 CrossRef PubMed.
- S. M. Kozlov and K. M. Neyman, Effects of electron transfer in model catalysts composed of Pt nanoparticles on CeO2(111) surface, J. Catal., 2016, 344, 507–514 CrossRef CAS.
- F. R. Negreiros and S. Fabris, Role of Cluster Morphology in the Dynamics and Reactivity of Subnanometer Pt Clusters Supported on Ceria Surfaces, J. Phys. Chem. C, 2014, 118, 21014–21020 CAS.
- Y. Pan, N. Nilius, H.-J. Freund, J. Paier, C. Penschke and J. Sauer, Titration of Ce3+ Ions in the CeO2(111) Surface by Au Adatoms, Phys. Rev. Lett., 2013, 111, 206101 CrossRef PubMed.
- K. Ševčíková, L. Szabová, M. Kettner, P. Homola, N. Tsud, S. Fabris, V. Matolín and V. Nehasil, Experimental and Theoretical Study on the Electronic Interaction between Rh Adatoms and CeOx Substrate in Dependence on a Degree of Cerium Oxide Reduction, J. Phys. Chem. C, 2016, 120, 5468–5476 Search PubMed.
- K. Ševčíková, T. Kolářová, T. Skála, N. Tsud, M. Václavů, Y. Lykhach, V. Matolín and V. Nehasil, Impact of Rh–CeOx interaction on CO oxidation mechanisms, Appl. Surf. Sci., 2015, 332, 747–755 CrossRef.
- Y. Lykhach, V. Johánek, H. Aleksandrov, S. M. Kozlov, M. Happel, T. Skála, P. S. Petkov, N. Tsud, G. N. Vayssilov, K. C. Prince, K. M. Neyman, V. Matolín and J. Libuda, Water Chemistry on Model Ceria and Pt/Ceria Catalysts, J. Phys. Chem. C, 2012, 116, 12103–12113 CAS.
- V. Matolín, I. Matolínová, F. Dvořák, V. Johánek, J. Mysliveček, K. C. Prince, T. Skála, O. Stetsovych, N. Tsud, M. Václavů and B. Šmíd, Water Interaction with CeO2(111)/Cu(111) Model Catalyst Surface, Catal. Today, 2012, 181, 124–132 CrossRef.
- L. Szabová, Y. Tateyama, V. Matolín and S. Fabris, Water Adsorption and Dissociation at Metal-Supported Ceria Thin Films: Thickness and Interface-Proximity Effects Studied with DFT+U Calculations, J. Phys. Chem. C, 2015, 119, 2537–2544 Search PubMed.
- M. Farnesi Camellone, F. Negreiros Ribeiro, L. Szabová, Y. Tateyama and S. Fabris, Catalytic Proton Dynamics at the Water/Solid Interface of Ceria-Supported Pt Clusters, J. Am. Chem. Soc., 2016, 138, 11560–11567 CrossRef CAS PubMed.
- S. M. Kozlov and K. M. Neyman, O vacancies on steps on the CeO2(111) surface, Phys. Chem. Chem. Phys., 2014, 16, 7823–7829 RSC.
- S. Carrettin, P. Concepción, A. Corma, J. M. López Nieto and V. F. Puntes, Nanocrystalline CeO2 Increases the Activity of Au for CO Oxidation by Two Orders of Magnitude, Angew. Chem., Int. Ed., 2004, 43, 2538–2540 CrossRef CAS PubMed.
- V. Fiorin, D. Borthwick and D. A. King, Microcalorimetry of O2 and NO on flat and stepped platinum surfaces, Surf. Sci., 2009, 603, 1360–1364 CrossRef CAS.
- P. Ghosh, M. Farnesi Camellone and S. Fabris, Fluxionality of Au Clusters at Ceria Surfaces during CO Oxidation: Relationships among Reactivity, Size, Cohesion, and Surface Defects from DFT Simulations, J. Phys. Chem. Lett., 2013, 4, 2256–2263 CrossRef CAS.
- P. C. Jennings, H. A. Aleksandrov, K. M. Neyman and R. L. Johnston, A DFT study of oxygen dissociation on platinum based nanoparticles, Nanoscale, 2014, 6, 1153–1165 RSC.
- P. C. Jennings, H. A. Aleksandrov, K. M. Neyman and R. L. Johnston, DFT studies of oxygen dissociation on the 116-atom platinum truncated octahedron particle, Phys. Chem. Chem. Phys., 2014, 16, 26539–26545 RSC.
- P. C. Jennings, H. A. Aleksandrov, K. M. Neyman and R. L. Johnston, O2 Dissociation on M@Pt Core–Shell Particles for 3d, 4d, and 5d Transition Metals, J. Phys. Chem. C, 2015, 119, 11031–11041 CAS.
- F. Viñes, C. Loschen, F. Illas and K. M. Neyman, Edge sites as a gate for subsurface carbon in palladium nanoparticles, J. Catal., 2009, 266, 59–63 CrossRef.
- K. M. Neyman and S. Schauermann, Hydrogen Diffusion into Palladium Nanoparticles: Pivotal Promotion by Carbon, Angew. Chem., Int. Ed., 2010, 49, 4743–4746 CrossRef CAS PubMed.
- M. Hatanaka, N. Takahashi, N. Takahashi, T. Tanabe, Y. Nagai, A. Suda and H. Shinjoh, Reversible Changes in the Pt Oxidation State and Nanostructure on a Ceria-Based Supported Pt, J. Catal., 2009, 266, 182–190 CrossRef CAS.
- Y. Nagai, K. Dohmae, Y. Ikeda, N. Takagi, T. Tanabe, N. Hara, G. Guilera, S. Pascarelli, M. A. Newton, O. Kuno, H. Jiang, H. Shinjoh and S. I. Matsumoto, In Situ Redispersion of Platinum Autoexhaust Catalysts: An On-Line Approach to Increasing Catalyst Lifetimes?, Angew. Chem., Int. Ed., 2008, 47, 9303–9306 CrossRef CAS PubMed.
- Y. Nagai, K. Dohmae, Y. Ikeda, N. Takagi, N. Hara, T. Tanabe, G. Guilera, S. Pascarelli, M. A. Newton, N. Takahashi, H. Shinjoh and S. I. Matsumoto, In situ observation of platinum sintering on ceria-based oxide for autoexhaust catalysts using Turbo-XAS, Catal. Today, 2011, 175, 133–140 CrossRef CAS.
- M. Happel, J. Mysliveček, V. Johánek, F. Dvořák, O. Stetsovych, Y. Lykhach, V. Matolín and J. Libuda, Adsorption Sites, Metal Support Interactions, and Oxygen Spillover Identified by Vibrational Spectroscopy of Adsorbed CO: A Reference Study on Pt/Ceria Model Catalysts, J. Catal., 2012, 289, 118–126 CrossRef CAS.
- D. K. Lambert, Stark effect of adsorbate vibrations, Solid State Commun., 1984, 51, 297–300 CrossRef CAS.
- F. Meng, S. A. Morin, A. Forticaux and S. Jin, Screw Dislocation Driven Growth of Nanomaterials, Acc. Chem. Res., 2013, 46, 1616–1626 CrossRef CAS PubMed.
- X. Yin, J. Shi, X. Niu, H. Huang and X. Wang, Wedding Cake Growth Mechanism in One-Dimensional and Two-Dimensional Nanostructure Evolution, Nano Lett., 2015, 15, 7766–7772 CrossRef CAS PubMed.
| This journal is © The Royal Society of Chemistry 2017 |

