 Open Access Article
Creative Commons Attribution 3.0 Unported Licence
Structural variety in ytterbium dicarboxylate frameworks and in situ study diffraction of their solvothermal crystallisation†
Matthew I.
Breeze
a,
Thomas W.
Chamberlain
a,
Guy J.
Clarkson
a,
Raíssa Pires
de Camargo
ab,
Yue
Wu‡
 c,
Juliana Fonseca
de Lima
bd,
Franck
Millange
e,
Osvaldo A.
Serra
b,
Dermot
O'Hare
 c and
Richard I.
Walton
 *a
*a
aDepartment of Chemistry, University of Warwick, Coventry, CV4 7AL, UK. E-mail: r.i.walton@ warwick.ac.uk
bDepartamento de Química, Faculdade de Filosofia, Ciências e Letras de Ribeirão Preto, Universidade de São Paulo, Av. Bandeirantes, 3900, 14040-901, Ribeirão Preto, SP, Brazil
cInorganic Chemistry Laboratory, South Parks Road, Oxford, OX1 3QR, UK
dInstituto de Química, Universidade do Estado do Rio de Janeiro, Rio de Janeiro 20550-013, Brazil
eDépartement de Chimie, Université de Versailles-St-Quentin-en-Yvelines, Université Paris-Saclay, 45 Avenue des États-Unis, 78035 Versailles cedex, France
First published on 11th April 2017
Abstract
The ytterbium 1,4-benzenedicarboxylate (BDC) framework [Yb2(BDC)3(DMF)2]·H2O (1) crystallises from a N,N-dimethylformamide (DMF)-rich solution at 80–120 °C. (1) is constructed from infinite chains of dicarboxylate-bridged seven-coordinate Yb atoms, cross-linked in two directions by BDC to yield diamond-shaped channels (sra topology) lined by coordinated DMF molecules and occluded water. Increasing the water content in the synthesis solution yields a material with more crystal water Yb2(BDC)3(DMF)2(H2O)2 (2), in which the Yb centres are eight-coordinate and form dimers bridged by BDC to give two interpenetrating networks of pcu (α-Po) topology. Upon extended reaction in this water-rich solvent mixture, an alternative phase is formed: an anhydrous mixed BDC-formate, Yb(BDC)(HCO2), (3), which has a pillared, layered structure, with formate produced by hydrolysis of the DMF. An isoreticular version of (2) can also be formed under similar conditions using 2,6-naphthalene-dicarboxylate (NDC) as linker: [Yb2(NDC)3(H2O)4]·2DMF (4). Despite their different structures, (1) and (2) are calcined to a common porous, desolvated phase Yb2(BDC)3 at 300 °C. Using high energy X-rays at Diamond Light Source we are able to penetrate the solvothermal reaction vessels and to follow the formation of (1) and (2) in real time. This allows accurate crystallisation curves to be obtained from which qualitative kinetic information is extracted. Importantly, the high angular resolution of the in situ powder XRD patterns allows refinement of crystal structure: this permits the temporal evolution of unit cell parameters to be followed, which are ascribed to changes in coordinated solvent composition within the materials during their formation, while analysis of phase fraction allows kinetic parameters to be quantified using the nucleation-growth model of Gualtieri.
Introduction
A diverse range of open-framework carboxylates of lanthanides have now been reported in the literature.1 Interest in these materials lies both in their structural chemistry, which can be distinctly different from that of transition-metal carboxylates due to the preference for higher coordination numbers of the lanthanide ions, and the possibility of interesting physical properties for use in a variety of applications. The f-block metal cations have well-known characteristics from classical coordination chemistry, including photoluminescence, Lewis acidity, and unusual magnetism arising from single-ion anisotropy and slow relaxation effects. Introducing such properties into extended metal–organic framework (MOF) structures may then allow the development of new functional materials. Luminescence may be enhanced by the connecting linkers and self-quenching effect minimised by separation of the lanthanide centres with extended ligands,2 while porous systems can be developed where the addition of a guest molecule gives a tuneable optical response.3 For example, sensing of explosives such as nitrobenzene derivatives has proved possible.4 Other light emission properties have been tuned to produce ‘MOF barcodes’, where mixtures of different lanthanides in a common structure yield a unique spectroscopic signature5 and the formation of a light emitting thermometer based on the thermally varying luminescence from a mixed Eu–Tb framework constructed from the linker 2,5-dimethoxy-1,4-benzenedicarboxylate.6 Early work on catalysis by lanthanide MOFs studied Lewis acidity and redox activity for reactions such as acetalization of aldehydes and oxidation of sulphides,7 cyanosilylation8 and in bifunctional oxidation catalysts.9 In more recent work in catalysis with lanthanide MOFs some examples of shape-selectivity are emerging when basic ligands are used.10 For example, some have been developed as water-resistant and recyclable solid Lewis-acids for various organic reactions,11 while recently a multifunctional MOF based on a flexible dicarboxylate ligand and various lanthanides was produced with Lewis acidity and as a support for palladium for organic reductions.12Despite the large number of studies on the crystallisation of lanthanide MOFs, the number of new framework materials reported in the literature continues to grow. Although increasingly elaborate, custom-made ligands are employed to design new frameworks, it is often the case that new materials may be simply formed from a given set of metals and ligands; this is because the MOF that crystallises from a particular reagent mixture may not be the only material that forms under those conditions, with subtle changes in temperature, time, solvent compositions having an influence over the resulting product. For example, in the case of lanthanum combined with the ligand 4,4′-(hexafluoroisopropylidene)bis(benzoic acid), three different MOFs polymorphs were found, with the most commonly seen computed to be a metastable phase,13 highlighting how fine control of synthesis conditions is needed in order to isolate a desired material. Further, for lanthanide materials, the decrease in ionic radius across the lanthanide series mean that variety of structures can form depending on the lanthanide chosen (or the mixture of lanthanides in mixed-metal systems). It thus remains difficult to predict the outcome of the crystallisation of metal–organic frameworks from a given set of reagents.14 One approach to this problem is a systematic exploration of reagents and reaction conditions, which, although time-consuming, may provide high-quality specimens for structural analysis. Another distinct approach is to use in situ studies of crystallisation to allow the kinetics and mechanism of MOF crystal growth to be quantified, putting the understanding of crystallisation on a firmer fundamental footing.15 In this paper we report a study that combines these two approaches to the formation of 1,4-benzenedicarboxylates of ytterbium, combining one of the lanthanides with the smallest ionic radius with one of the dicarboxylate ligands most widely used in MOF chemistry. Although various ytterbium 1-4,benzenedicarboxylates have already been reported in the literature,16 and we have recently described the crystallisation of a further example,17 herein we report two new phases, along with an isoreticular version of one of these, and describe a study of crystallisation kinetics of two using a recently developed approach with high energy X-rays.17–19
Experimental section
[Yb2(BDC)3(DMF)2]·H2O (1) was prepared as described in our previous work,17 from ytterbium(III) chloride hexahydrate (Sigma-Aldrich 99.9%, 1 mmol) and 1,4-benzenedicarboxylic acid (H2BDC, 98% 1.5 mmol) dissolved in 5 ml N,N-dimethylformamide (DMF). To this, H2O (0.15 ml) was added and the mixture stirred until complete dissolution of all reagents had occurred. The reactants were heated in a sealed 20 ml Teflon-lined autoclave at 100 °C for 20 hours. Synthesis at temperatures of between 80 and 120 °C for 20 hours gave the same solid product, and the amount of water relative to DMF could be increased to as much as 40% by volume while yielding the same phase.Yb2(BDC)3(DMF)2(H2O)2 (2) was also prepared from ytterbium(III) chloride hexahydrate (1 mmol) and 1,4-benzenedicarboxylic acid (1.5 mmol) but the solvent (5 ml in total) contained at least 50% water in DMF. In these water-rich conditions, the temperature and time of reaction were crucial: at 100 °C or lower, a time of 20 hours produced a phase-pure sample of (2), but if the temperature was increased to 120 °C then a reaction time below 3 hours was necessary. If longer reaction times were used at 120 °C under otherwise identical conditions, a phase-pure sample of Yb(BDC)(HCO2) (3) was produced.
[Yb2(NDC)3(H2O)4]·2DMF (4) was prepared from ytterbium(III) chloride hexahydrate (1 mmol), 2,6-naphthalenedicarboxylic acid (H2NDC, 99%, 1.5 mmol), DMF (5 ml) and water (0.15 ml). The mixture was heated to 120 °C for 20 hours before being cooled naturally to room temperature.
For each material, the resulting white crystalline solid after synthesis was isolated by suction filtration, washed with DMF followed by methanol and then allowed to dry at room temperature. Powder X-ray diffraction using either a Siemens D5000 diffractometer operating with Cu Kα1/α2 radiation in flat-plate geometry, or Beamline I11 at Diamond Light Source from samples held in thin-walled quartz capillaries and λ = 0.825174 Å, proved the phase purity of the sample (ESI†) and the reaction yield in each case was over 90% based on ytterbium conversion.
Single crystal X-ray diffraction was performed on each of the materials using suitable specimens selected from the samples prepared as above. An Oxford Diffraction Gemini four-circle system with Ruby CCD area detector with either Mo Kα radiation or Cu Kα radiation was used for data collection with the crystal held at a selected temperature with an Oxford Cryostream Cobra. Using Olex2 (ref. 20) the structures were solved with ShelXS-1997 (ref. 21) using direct methods and refined with the ShelXL22 refinement package (see ESI† for more details). Table 1 shows selected crystallographic data for the four materials.
| Compound | (1)17 | (2) | (3) | (4) |
|---|---|---|---|---|
| Chemical formula | C30H28N2O15Yb2 | C15H15NO8Yb | C9H5O6Yb | C21H20NO9Yb |
| X-ray wavelength | Mo Kα | Mo Kα | Cu Kα | Mo Kα |
| Temperature/K | 100(2) | 100(2) | 296(3) | 150(2) |
| Crystal system | Monoclinic | Triclinic | Monoclinic | Triclinic |
| Space group | C2/c |
P![[1 with combining macron]](https://www.rsc.org/images/entities/char_0031_0304.gif) |
P21/c |
P![[1 with combining macron]](https://www.rsc.org/images/entities/char_0031_0304.gif) |
| a/Å | 18.2950(4) | 8.5054(2) | 10.56825(17) | 8.4516(2) |
| b/Å | 10.8482(2) | 10.2435(2) | 12.66272(19) | 12.3972(4) |
| c/Å | 17.3984(4) | 10.9144(3) | 6.62290(13) | 12.5680(3) |
| α/° | 90 | 63.350(2) | 90 | 110.453(2) |
| β/° | 101.395(2) | 71.042(2) | 95.2274(17) | 102.132(2) |
| γ/° | 90 | 82.5615(9) | 90 | 109.619(3) |
| V/Å3 | 3384.96(12) | 803.65(4) | 882.61(3) | 1079.19(6) |
| Z | 8 | 2 | 4 | 2 |
| μ/mm−1 | 5.565 | 5.864 | 19.776 | 4.386 |
| Crystal size/mm3 | 0.3 × 0.14 × 0.08 | 0.20 × 0.15 × 0.06 | 0.1 × 0.08 × 0.02 | 0.36 × 0.12 × 0.10 |
| Reflections measured, unique | 40![[thin space (1/6-em)]](https://www.rsc.org/images/entities/char_2009.gif) 716, 8841 716, 8841 |
15![[thin space (1/6-em)]](https://www.rsc.org/images/entities/char_2009.gif) 243, 4490 243, 4490 |
12![[thin space (1/6-em)]](https://www.rsc.org/images/entities/char_2009.gif) 823, 3200 823, 3200 |
20![[thin space (1/6-em)]](https://www.rsc.org/images/entities/char_2009.gif) 934, 6549 934, 6549 |
| GOF on F2 | 1.030 | 1.067 | 1.066 | 1.041 |
| R 1, wR2 [I > 2σ(I)] | 0.0358, 0.1042 | 0.0162, 0.0362 | 0.0561, 0.1522 | 0.0403, 0.1032 |
| Data/restraints/parameters | 8841/32/232 | 4490/2/234 | 3200/0/146 | 6549/0/293 |
| Largest peak, hole/e Å−3 | 2.64/−1.46 | 1.03, −0.79 | 2.99/−1.78 | 2.46/−1.76 |
Thermogravimetric analysis and differential scanning calorimetry were performed using a Mettler Toledo TGA/DSC 1-600 instrument under static air with a heating rate of 10 °C min−1 from room temperature to 1000 °C. Thermodiffraction experiments were carried out using a Bruker D8 powder diffraction operating with Cu Kα1/2 radiation and fitted with an HTK900 gas chamber and VÅNTEC-1 detector. Patterns were recorded in static on heating from room temperature to 600 °C in intervals of 20 °C with a 10 minute equilibration time before scans lasting 10 minutes were made.
CHN elemental analysis was performed by Medac Ltd, UK. The following results were found: (1) C 35.60%, 35.30% (calc.); H 2.47%, 2.78% (calc.); N 2.83%, 2.74% (calc.); (2) C 35.24%, 35.30% (calc.); H 2.78%, 2.78% (calc.); N 2.78%, 2.74% (calc.); (3) C 30.23%, 31.80% (calc.); H 1.64%, 1.78% (calc.); N < 0.1%, 0% (calc.) (4) C 42.73%, 42.79% (calc.); H 2.75%, 3.3% (calc.); N 1.71%, 2.31% (calc.).
Nitrogen adsorption isotherms of (1) and (2) were recorded at 77 K after degassing under a vacuum at chosen temperature (see below) using a Micromeritics ASAP 2010 apparatus. Surface areas were calculated using the BET method.
In situ studies of crystallisation were performed using Beamline I12 (JEEP) of the Diamond Light Source.23 A specially constructed reaction cell made from polyether ether ketone (PEEK) was used to study crystallisation: a 5 ml internal volume tube of 12 mm internal diameter that was fitted with a screw-top lid that allowed moderate pressure to be contained and reactions up to 150 °C to be investigated. An internal thermocouple, threaded through the lid of the reaction tube allowed continuous monitoring of temperature during reactions. The reaction was stirred rapidly with a Teflon-coated magnetic follower to aid heat transfer and to ensure that uniform solid product was present in the X-ray beam throughout the experiment. The cells were heated within the ODISC infra-red furnace,24 with a glassy carbon sheath around the sample tube to allow heat transfer to the reaction mixture. A wavelength of 0.2242 Å was used and 2D diffraction patterns collected every minute using a Pixium image plate detector (430 × 430 mm2) with an exposure time of 4000 ms. The system was calibrated with a crystalline CeO2 reference and the 2D image plate data were integrated using the fit2d software25 to give 1D diffraction patterns. The time-resolved in situ data sets were analysed in TOPAS26 using sequential Pawley fits with crystal structure parameters derived from single crystal diffraction as the structure models. For 1,4-benzenedicarboxylic acid, the published structure of Domenicano et al. was used.27 Selected refinements were also inspected manually to confirm the validity of the sequential method. The background was modelled using a freely refining eight-term Chebyshev polynomial. The integrated area of background-subtracted Bragg peaks (obtained through the TOPAS “crystalline_area” function) was used to provide the measure of total sample crystallinity. Broad peaks from the PEEK reaction vessel were modelled using an orthorhombic phase based on the published structure.28
Results and discussion
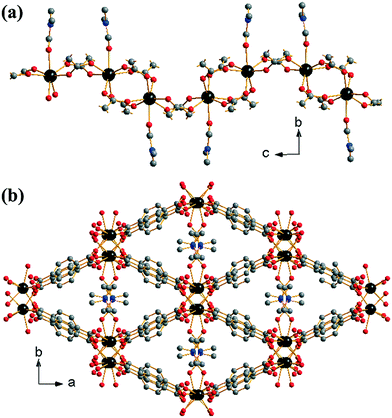
[Yb2(BDC)3(DMF)2]·H2O (1) crystallises from a DMF-rich solvent and we previously reported its synthesis and structure in a preliminary communication.17 The material contains a single crystallographic ytterbium coordinated to seven oxygens: six from singly coordinating 1,4-benzenedicarboxylates and one from an O-coordinated DMF, Fig. 1a. The coordinated DMF is structurally disordered across two positions in a ratio of 0.6![[thin space (1/6-em)]](https://www.rsc.org/images/entities/char_2009.gif) :
:![[thin space (1/6-em)]](https://www.rsc.org/images/entities/char_2009.gif) 0.4. Each ytterbium is connected to adjacent ytterbiums via either two or four carboxylato groups from the BDC linkers in a regular (–Yb–(O–C–O)4–Yb–(O–C–O)2–) fashion (Z,Z-μ2-η1:η1 using the notation of Batten et al.29). This leads to the formation of 1-D chains of ytterbium-carboxylate chains running along the c-axis, Fig. 1a. The coordinated DMF molecules orientate perpendicular to the dimension of the chains. Every ytterbium-carboxylate chain is connected to four other chains through the BDC linkers. The linkers originating from (Yb–(O–C–O)4–Yb) dimers connect only to (Yb–(O–C–O)2–Yb) dimers and vice versa. This leads to directly connected chains being out of phase with one another. The periodicity of chains is restored with the next level of connectivity: chains that are adjacent with regards to the b-axis are able to stack well each other, resulting in regular packing of coordinated DMF along the c-axis. The overall effect of the interconnectivity of the ytterbium-carboxylate chains leads to the formation of diamond shaped 1-D channels running along the c-axis, occupied by coordinated DMF and extra-framework water, Fig. 1b. Since all metal atoms are connected by organic moieties, the structure can be described as (I0O3) using the Cheetham–Rao–Feller nomenclature.30 The topology of (1) is assigned as sra (the Al net in SrAl2, see ESI†), a commonly observed topology for materials with infinite rod-shaped secondary building units,31 such as in the material MIL-53.32
0.4. Each ytterbium is connected to adjacent ytterbiums via either two or four carboxylato groups from the BDC linkers in a regular (–Yb–(O–C–O)4–Yb–(O–C–O)2–) fashion (Z,Z-μ2-η1:η1 using the notation of Batten et al.29). This leads to the formation of 1-D chains of ytterbium-carboxylate chains running along the c-axis, Fig. 1a. The coordinated DMF molecules orientate perpendicular to the dimension of the chains. Every ytterbium-carboxylate chain is connected to four other chains through the BDC linkers. The linkers originating from (Yb–(O–C–O)4–Yb) dimers connect only to (Yb–(O–C–O)2–Yb) dimers and vice versa. This leads to directly connected chains being out of phase with one another. The periodicity of chains is restored with the next level of connectivity: chains that are adjacent with regards to the b-axis are able to stack well each other, resulting in regular packing of coordinated DMF along the c-axis. The overall effect of the interconnectivity of the ytterbium-carboxylate chains leads to the formation of diamond shaped 1-D channels running along the c-axis, occupied by coordinated DMF and extra-framework water, Fig. 1b. Since all metal atoms are connected by organic moieties, the structure can be described as (I0O3) using the Cheetham–Rao–Feller nomenclature.30 The topology of (1) is assigned as sra (the Al net in SrAl2, see ESI†), a commonly observed topology for materials with infinite rod-shaped secondary building units,31 such as in the material MIL-53.32
The structure of (1) is related to that of [Er2(BDC)3(DMF)2] reported by Zhang et al.33 Both materials have the same local structure, connectivity and space group, with the difference being the presence of occluded water in (1). The presence of water, in addition to the small radius of Yb3+ compared to Er3+, has the effect of decreasing the Yb–Yb–Yb angle (148°) leading to a greater ‘corrugation’ of the ytterbium-carboxylate chains along the c-axis as opposed to the more flattened chains of the erbium material (157°). Despite the lack of occluded water, the erbium material has a larger unit cell volume at room temperature (3524.0(12) Å3), consistent with the larger ionic radius of erbium when compared with ytterbium. This is also reflected in the larger average Ln–O bond distances (Yb–O = 2.268 Å, Er–O = 2.284 Å). Some thulium 1,4-benzenedicarboxylates also adopt related structures.34
Yb2(BDC)3(DMF)2(H2O)2 (2) crystallises in the triclinic space group P![[1 with combining macron]](https://www.rsc.org/images/entities/char_0031_0304.gif) . Each ytterbium is coordinated to four oxygens from two bis-coordinating carboxylato groups (η2), two oxygens from singly coordinated carboxylato groups and one oxygen each from both a coordinated DMF molecule and a water molecule, leading to a coordination number of 8. Each ytterbium exists as part of a dimer, linked to another ytterbium by bridging carboxylato groups in which each oxygen in each carboxylate is linked to a different Yb (Z,Z-μ2-η1:η1), Fig. 2a. Each BDC coordinates in the same manner at both of its carboxylate groups i.e. each BDC only coordinates as either η2 or Z,Z-μ2-η1:η1 exclusively. Each dimer is linked to six other dimers: four by each bis-coordinating linker and two by the bridging BDCs. This interconnectivity leads to the overall structure of (2), Fig. 2b, with connectivity I0O3 in the Cheetham–Rao–Feller nomenclature. The coordinated DMF molecules project into a void with a closest interatomic distance between neighbouring DMF molecules of 6.98 Å (N–N distance). The overall structure of (2) shows a 2-fold interpenetrated pcu topology, in which each net can be considered as the α-Po type where the centres of the binuclear lanthanide clusters are the nodes, and no accessible pore space is available. An erbium analogue of (2) has been previously reported by Chen et al.,35 although in the previous work the composition Er2(BDC)3(DMF)2(H2O)2·H2O was found, i.e. with additional crystal water occluded within the structure.
. Each ytterbium is coordinated to four oxygens from two bis-coordinating carboxylato groups (η2), two oxygens from singly coordinated carboxylato groups and one oxygen each from both a coordinated DMF molecule and a water molecule, leading to a coordination number of 8. Each ytterbium exists as part of a dimer, linked to another ytterbium by bridging carboxylato groups in which each oxygen in each carboxylate is linked to a different Yb (Z,Z-μ2-η1:η1), Fig. 2a. Each BDC coordinates in the same manner at both of its carboxylate groups i.e. each BDC only coordinates as either η2 or Z,Z-μ2-η1:η1 exclusively. Each dimer is linked to six other dimers: four by each bis-coordinating linker and two by the bridging BDCs. This interconnectivity leads to the overall structure of (2), Fig. 2b, with connectivity I0O3 in the Cheetham–Rao–Feller nomenclature. The coordinated DMF molecules project into a void with a closest interatomic distance between neighbouring DMF molecules of 6.98 Å (N–N distance). The overall structure of (2) shows a 2-fold interpenetrated pcu topology, in which each net can be considered as the α-Po type where the centres of the binuclear lanthanide clusters are the nodes, and no accessible pore space is available. An erbium analogue of (2) has been previously reported by Chen et al.,35 although in the previous work the composition Er2(BDC)3(DMF)2(H2O)2·H2O was found, i.e. with additional crystal water occluded within the structure.
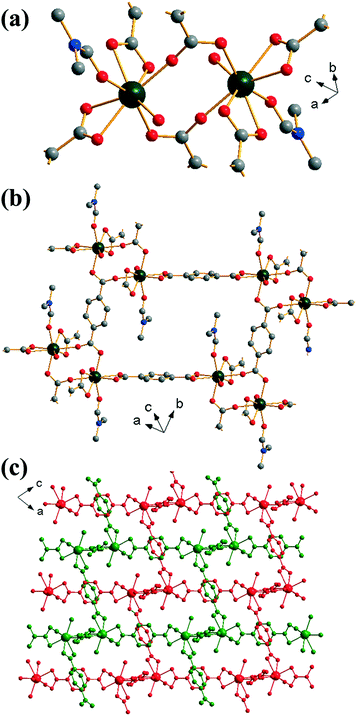 | ||
| Fig. 2 Views of the structure of (2): (a) local view of dimeric building units showing the connecting BDC ligands (represented by broken-off bonds), (b) connectivity of four dimer units showing the void space occupied by coordinated DMF molecules and (c) overall view of the structure showing the two interpenetrated three-dimensional networks in red and green. In (a) and (b) the atomic labelling scheme is as for Fig. 1, with hydrogen atoms omitted for clarity, and only the predominant orientation of the DMF molecule shown and terminal oxygens belong to water molecules. | ||
Extending the reaction time used to prepare (2) yields an anhydrous mixed 1,4-benzenedicarboxylate-formate, Yb(BDC)(HCO2), (3), which is isostructural with a known gadolinium analogue.36 The formate anion bridges three neighbouring Yb centres in μ3-η1:η2:η1 mode while the BDC linker links via a Z,Z-μ2-η1:η1. This results in a single crystallographic Yb with coordination number eight, with two oxygens from a common formate, two from two further formates and four from four distinct BDC linkers. Each Yb is connected to three others by bridging oxygen atoms from these connecting ligands, Fig. 3a. Alternatively the structure may be viewed as dimeric Yb2 clusters formed through edge-sharing of adjacent polyhedra, further linked by sharing corners to give a 1D sheet, Fig. 3b. The sheets are cross-linked by pillaring BDC ligands to give the 3-dimensional structure (I2O1), Fig. 3c. The inclusion of formate in this material must arise from the hydrolysis of DMF in the water-rich solvent with prolonged reaction time, as it is well known that decomposition of DMF occurs in water to give formic acid and dimethylamine.37 This effect has been noted before in the synthesis of other MOFs,38 and a similar situation was reported in the formation of the gadolinium analogue of (3), although in that work HCl was used in the synthesis.36
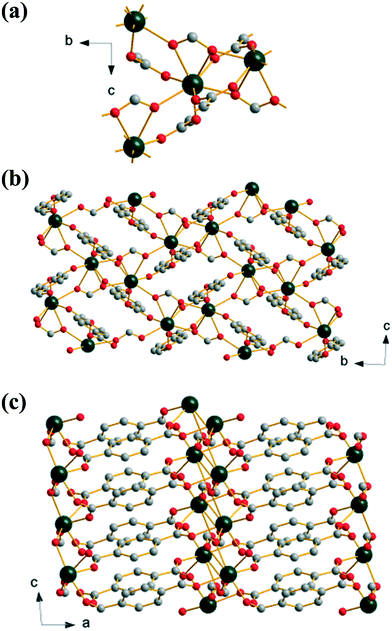 | ||
| Fig. 3 Structure of (3): (a) local view of the connection of four Yb centres, (b) view along a, and (c) view along b. Atomic labelling scheme as for Fig. 1 with hydrogen atoms omitted for clarity. | ||
Replacement of 1,4-benzenedicarboxylic acid by 2,6-naphthalene-dicarboxylic acid in the DMF-rich solvent yields [Yb2(NDC)3(H2O)4]·2DMF (4), a material that has an isoreticular structure to (2). In this case the directly coordinated solvent molecules are only water and the DMF present in the structure fills void space, with evidence for a hydrogen bond between it and the Yb-coordinated water molecule (O–O distance of 2.58 Å), but the ytterbium coordination number, and the geometry and connectivity of the framework is the same as in (2), Fig. 4a. The extended 2,6-naphthalene-dicarboxylate linker gives a more open network, Fig. 4b, but the overall structure shows the same doubly interpenetrated network as in (2), Fig. 4c. The powder XRD pattern of the bulk sample of (4) shows fair agreement with the pattern simulated from the single crystal structure (ESI†), although the elemental analysis shows excess nitrogen suggesting some impurity may be present and so no further analysis of this phase was performed.
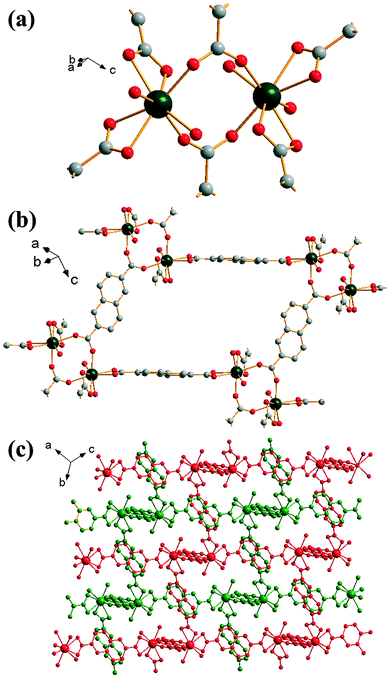 | ||
| Fig. 4 Structure of (4): (a) local view of dimeric building units showing the connecting BDC ligands (represented by broken-off bonds); terminal oxygen atoms are coordinated water molecules, (b) connectivity of four dimer units showing the void space (cf.Fig. 2c), (c) overall view of the structure showing the two interpenetrated three-dimensional networks in red and green. In (a) and (b) the atomic labelling scheme is as for Fig. 1, with hydrogen atoms omitted for clarity. Terminal oxygens are those of water molecules and occluded DMF is not shown. | ||
Calcination of both (1) and (2) occurs via several steps, with assignment of TGA data (ESI†) showing a sequential loss of coordinated water and DMF to yield a common, anhydrous product Yb2(BDC)3, as shown by thermodiffractometry, Fig. 5, before complete collapse above ∼450 °C to yield Yb2O3. Powder XRD shows that the Yb2(BDC)3 material is the same in both cases, Fig. 6a, but its powder diffraction pattern shows considerable peak broadening suggesting loss of crystal integrity upon solvent loss so that its structure remain unsolved and we are only able to assign a tentative unit cell based on indexing.17 A search of the literature for other anhydrous rare-earth 1,4-benzenedicarboxyltes Ln2(BDC)3 produced no matches to our powder diffraction data. Since (1) and (2) have structures of different connectivities and topologies the conversion of at least one of these materials to Yb2(BDC)3 must occur with bond breaking and forming, which may also go towards explaining the poorly crystalline nature of this phase. We can speculate that thermodiffractometry data would imply that it is (2) that undergoes most structural rearrangement to give the anhydrous Yb2(BDC)3 product since the Bragg peaks of the resulting phase are broader in this case (Fig. 5): this would also be consistent with the collapse of the interpenetrated network of (2) requiring greater atomic displacements. Interestingly, Yb2(BDC)3 shows porosity, Fig. 6b, as evidenced by nitrogen adsorption isotherms, which give a BET surface area of 305 m2 g−1 and 376 m2 g−1 for the samples prepared by calcination of (1) and (2), respectively. The higher surface area of the latter may be due to a more defective structure following structural rearrangement. Once prepared and exposed to air, Yb2(BDC)3 shows no further uptake or loss of water, suggesting that the Yb sites in this structure are fully coordinated: elemental analysis and TGA are consistent with an anhydrous material (ESI†).
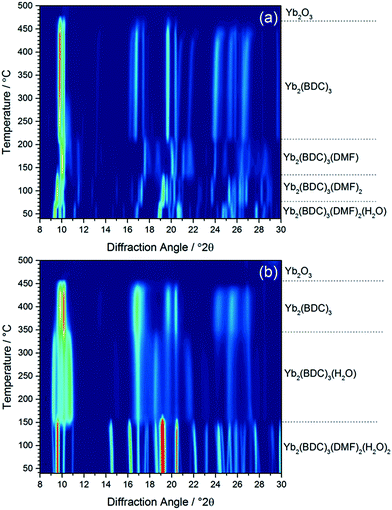 | ||
| Fig. 5 In situ XRD measured (a) (1) and (b) (2) on heating in air, with assignment of each phase present based on TGA (see ESI†). | ||
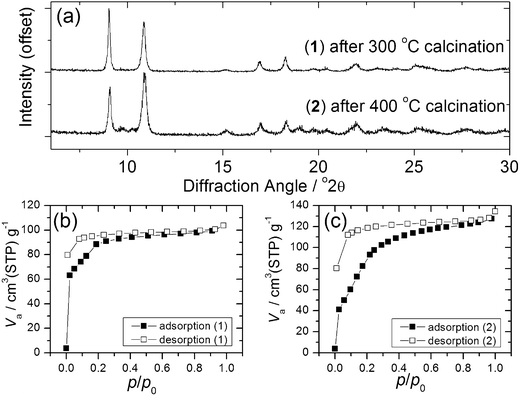 | ||
| Fig. 6 (a) XRD of Yb2(BDC)3 prepared from (1) and (2) and (b) and (c) BET nitrogen adsorption isotherms of each phase. | ||
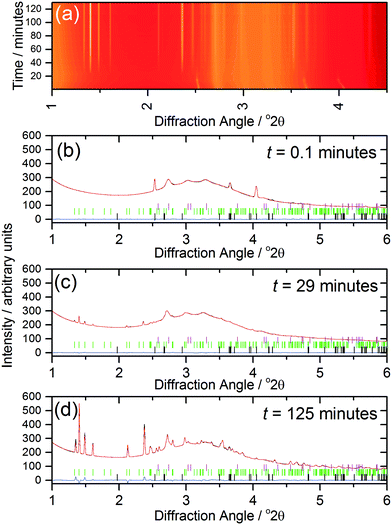
The kinetics of crystallisation (2) were studied using in situ, time-resolved diffraction to compare with the previous results we recently obtained from a similar study of (1).17 The in situ diffraction data measured during the formation of (2) shows the consumption of the 1,4-benzenedicarboxylic acid during the early stages of reaction, Fig. 7a, which is apparent owing to the low solubility of the precursor in the water-rich solvent mixture. The shift of the Bragg peaks of the 1,4-benzenedicarboxylic acid at the early stages of the reaction is because the reaction is still being heated at this point (see Fig. 8). Full pattern fitting, Fig. 7b–d, confirms the identity of phases present at each stage.
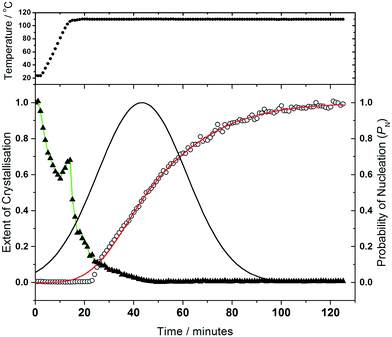
Analysis of the kinetics of crystallisation is possible from the temporal evolution of the phase fractional of material as obtained from the full pattern fitting, Fig. 8. This analysis firstly shows how most of the 1,4-benzenedicarboxylic acid is consumed before the onset of crystallisation of the product, presumably due to its dissolution. We have used the kinetic model of Gualtieri39 to determine kinetic parameters that describe the crystallisation (see ESI†). This model has the advantage of parameterising nucleation and crystal growth as two separate events and was developed for the hydrothermal formation of zeolites and subsequently used by a number of groups for study of the solvothermal crystallisation of MOFs.17,19,40 Although we studied the crystallisation of (2) at four different temperatures (90, 100, 110 and 120 °C), owing to the limited amount of beamtime available, only at the higher two temperatures did the reactions reach completion. However, we can measure the induction time for the onset of crystallisation for all temperatures by inspection of the crystallisation data and this shows a significant retardation of crystallisation as the reaction temperature is lowered, as shown in Table 1. The Gualtieri model requires knowledge of the crystal morphology since the dimensionality of crystal growth (n) is a variable in the model and for (2) SEM was used to inspect the crystal morphology of a typical sample: this showed irregular-shaped crystallites of a few microns in size, but no obvious anisotropy (ESI†), hence n was set at 3. The validity of this was tested by analysing the data with n = 1 and n = 2, but in both cases physically unreasonable rate constants were obtained (for example showing inverse behaviour with temperature). Fig. 8 shows the resulting fits to the crystallisation curve at 110 °C with the derived parameters presented in Table 2. The fitted kinetic parameters allow a probability of nucleation function to be determined, also shown on Fig. 8, and this reveals that nucleation continues late into the crystallisation, which is further supported by the observation in SEM of a variety of crystallite sizes, notably submicron crystallites on the surface of larger particles. This situation can be contrasted with the case of (1) where needle-shaped crystals of several hundred microns were found, consistent with a short period of nucleation and extended one-dimensional crystal growth found by the Gualtieri fit to the crystallisation data.13 Inspection of the rate constants is also informative: for (2) the rate constant for crystal growth is similar for that of nucleation and much larger than for (1). This suggests a rather different crystal growth mechanism for the two materials, which is not surprising given their very different structures with the open-framework one-dimensional channels of (1) contrasting with the interpenetrated networks of (2).
| Temperature/°C | t 0/min | a/min | b/min | k n/min−1 | k g/min−1 | |
|---|---|---|---|---|---|---|
| (1) n = 1 | 90 | 85 ± 1 | 100.18 ± 0.48 | 10.95 ± 0.41 | 0.00998 ± 0.00005 | 0.00034 ± 0.00021 |
| 110 | 28 ± 1 | 39.19 ± 0.32 | 7.70 ± 0.29 | 0.0255 ± 0.0002 | 0.00107 ± 0.00026 | |
| 120 | 27 ± 1 | 40.10 ± 0.30 | 8.53 ± 0.27 | 0.0249 ± 0.0002 | 0.00964 ± 0.00027 | |
| (2) n = 3 | 90 | 45 ± 1 | — | — | — | — |
| 100 | 29 ± 1 | — | — | — | — | |
| 110 | 23 ± 1 | 43.33 ± 0.63 | 18.08 ± 0.46 | 0.0231 ± 0.0003 | 0.031 ± 0.001 | |
| 120 | 25 ± 1 | 44.83 ± 1.05 | 17.06 ± 0.72 | 0.0223 ± 0.0005 | 0.029 ± 0.001 |
We previously reported how during the synthesis of (1) the cell parameters showed a continuous evolution during the growth of the material, which could be explained by the partial replacement of initially coordinated water by solvent DMF, as proven by Rietveld analysis of the in situ diffraction data. The crystallisation of (2) shows similar behaviour, Fig. 9, with all six triclinic lattice parameters evolving with crystallisation time, as determined by Pawley fitting of the in situ patterns. It should be noted that constant reaction temperature is reached before crystallisation of (2) starts so the shift in unit cell parameters is not a thermal effect. It is noteworthy that as crystallisation reaches completion beyond 100 minutes the change in lattice parameter slows, which also verifies that the earlier shift in Bragg peak positions is a real effect and not an experimental artefact. Since (2) contains coordinated DMF and crystal water, it is probable that the evolution of lattice parameter is due to changing amount of occluded solvent as the crystals are formed, as was the case for (1); however, for (2) the lower symmetry triclinic unit cell meant that further interpretation of the data (such as Rietveld refinement to refine fractional occupancy of solvent molecules) proved impossible.
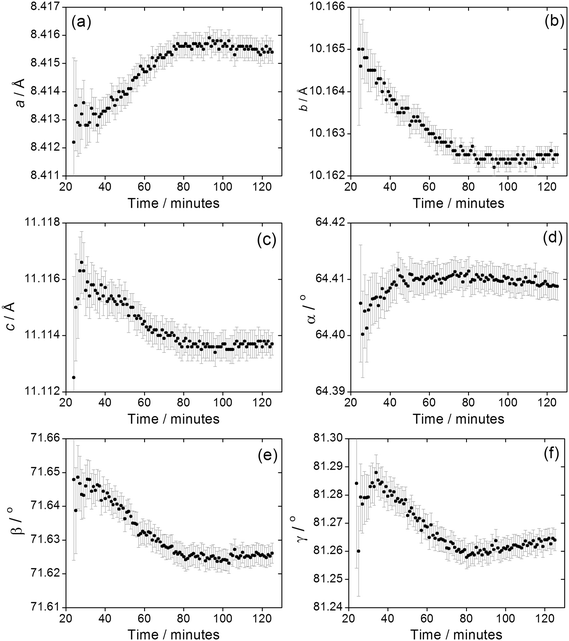 | ||
| Fig. 9 Evolution of triclinic lattice parameters (a) a, (b) b, (c) c, (d) α, (e) β and (f) γ during the crystallisation of (2). Error bars are standard deviations from the Pawley fitting. | ||
Conclusions
Despite the variety of lanthanide organic frameworks already reported in the literature, exploration of ytterbium chemistry with commercially available dicarboxylic acids yields a set of materials with diverse structures, including an isoreticular pair of open-framework materials and a pillared layered structure in which formate is included from hydrolysis of DMF with extended reaction time. While the phases are related to known materials reported separately for other lanthanides, the ytterbium 1,4-benzenedicarboxylate materials we describe are formed from a single set of reagents by varying solvent composition and/or time of crystallisation. The crystallisation kinetics of two of these materials can be modelled using the Gualtieri nucleation growth model, providing new crystal growth kinetic parameters much needed to put MOF formation on a firmer foundation, while the high resolution of the in situ X-ray patterns means that subtle structural changes can be detected during crystallisation under realistic laboratory conditions, providing evidence for the evolution of MOF structure during crystallisation.Acknowledgements
We thank the EPSRC for funding (EP/I020691), Diamond Light Source for provision of beamtime, Saul Moorhouse (Oxford), Thomas Connolley and Michael Hart (Diamond Light Source) for their assistance with collecting data on JEEP, and Alexander Dunn for measuring the SEM images. We are grateful to the University of Warwick Undergraduate Research Support Scheme, partly funded by Santander, who provided funds for the visit of RC to Warwick and RIW thanks CNPq (Brazil) for award of a Pesquisador Visitante Especial position at USP Ribeirão Preto.References
- K. Müller-Buschbaum, in The Chemistry of Metal-Organic Frameworks: Synthesis, Characterization and Applications, ed. S. Kaskel, Wiley-VCH, Weinheim, 2016, vol. 1 Search PubMed.
- M. D. Allendorf, C. A. Bauer, R. K. Bhakta and R. J. T. Houk, Chem. Soc. Rev., 2009, 38, 1330–1352 RSC.
- Y. J. Cui, B. L. Chen and G. D. Qian, Coord. Chem. Rev., 2014, 273, 76–86 CrossRef.
- Z. C. Hu, B. J. Deibert and J. Li, Chem. Soc. Rev., 2014, 43, 5815–5840 RSC.
- K. A. White, D. A. Chengelis, K. A. Gogick, J. Stehman, N. L. Rosi and S. Petoud, J. Am. Chem. Soc., 2009, 131, 18069–18071 CrossRef CAS PubMed.
- Y. J. Cui, H. Xu, Y. F. Yue, Z. Y. Guo, J. C. Yu, Z. X. Chen, J. K. Gao, Y. Yang, G. D. Qian and B. L. Chen, J. Am. Chem. Soc., 2012, 134, 3979–3982 CrossRef CAS PubMed.
- J. Perles, M. Iglesias, C. Ruiz-Valero and N. Snejko, J. Mater. Chem., 2004, 14, 2683–2689 RSC.
- M. Gustafsson, A. Bartoszewicz, B. Martin-Matute, J. L. Sun, J. Grins, T. Zhao, Z. Y. Li, G. S. Zhu and X. D. Zou, Chem. Mater., 2010, 22, 3316–3322 CrossRef CAS.
- F. Gandara, A. Garcia-Cortes, C. Cascales, B. Gomez-Lor, E. Gutierrez-Puebla, M. Iglesias, A. Monge and N. Snejko, Inorg. Chem., 2007, 46, 3475–3484 CrossRef CAS PubMed.
- C. Pagis, M. Ferbinteanu, G. Rothenberg and S. Tanase, ACS Catal., 2016, 6, 6063–6072 CrossRef CAS.
- Y. Liu, K. Mo and Y. Cui, Inorg. Chem., 2013, 52, 10286–10291 CrossRef CAS PubMed.
- Y. Zhu, M. Zhu, L. Xia, Y. L. Wu, H. Hua and J. M. Xie, Sci. Rep., 2016, 6, 29728 CrossRef CAS PubMed.
- F. Gandara, V. A. de la Pena-O'Shea, F. Illas, N. Snejko, D. M. Praserpio, E. Gutierrez-Puebla and M. A. Monge, Inorg. Chem., 2009, 48, 4707–4713 CrossRef CAS PubMed.
- R. E. Morris, ChemPhysChem, 2009, 10, 327–329 CrossRef CAS PubMed; M. G. Goesten, F. Kapteijn and J. Gascon, CrystEngComm, 2013, 15, 9249–9257 RSC.
- K. M. Ø. Jensen, C. Tyrsted, M. Bremholm and B. B. Iversen, ChemSusChem, 2014, 7, 1594–1611 CrossRef CAS PubMed; N. Pienack and W. Bensch, Angew. Chem., Int. Ed., 2011, 50, 2014–2034 CrossRef PubMed; R. I. Walton and F. Millange, in The Chemistry of Metal-Organic Frameworks: Synthesis, Characterization and Applications, ed. S. Kaskel, Wiley-VCH, Weinheim, 2016, vol. 2 Search PubMed.
- D. F. Weng, X. J. Zheng and L. P. Jin, Eur. J. Inorg. Chem., 2006, 4184–4190 CrossRef CAS; S. Feng, Acta Crystallogr., Sect. E: Struct. Rep. Online, 2010, 66, m33 Search PubMed; L. Y. Na, R. N. Hua, L. Y. Zhang, W. Zhang and G. L. Ning, J. Chem. Crystallogr., 2009, 39, 688–691 CrossRef; J. C. Yao, X. X. Cao, L. Zhang, Y. F. Wang, J. B. Guo and C. P. Fan, J. Chem. Crystallogr., 2011, 41, 1400–1405 CrossRef; R. A. Zehnder, R. A. Renn, E. Pippin, M. Zeller, K. A. Wheeler, J. A. Carr, N. Fontaine and N. C. McMullen, J. Mol. Struct., 2011, 985, 109–119 CrossRef.
- Y. Wu, M. I. Breeze, G. J. Clarkson, F. Millange, D. O'Hare and R. I. Walton, Angew. Chem., Int. Ed., 2016, 55, 4992–4996 CrossRef CAS PubMed.
- S. J. Moorhouse, Y. Wu and D. O'Hare, J. Solid State Chem., 2016, 236, 209–214 CrossRef CAS.
- Y. Wu, S. Henke, G. Kieslich, I. Schwedler, M. S. Yang, D. A. X. Fraser and D. O'Hare, Angew. Chem., Int. Ed., 2016, 55, 14081–14084 CrossRef CAS PubMed; H. H. M. Yeung, Y. Wu, S. Henke, A. K. Cheetham, D. O'Hare and R. I. Walton, Angew. Chem., Int. Ed., 2016, 55, 2012–2016 CrossRef PubMed.
- O. V. Dolomanov, L. J. Bourhis, R. J. Gildea, J. A. K. Howard and H. Puschmann, J. Appl. Crystallogr., 2009, 42, 339–341 CrossRef CAS.
- G. M. Sheldrick, Acta Crystallogr., Sect. A: Found. Crystallogr., 2008, 64, 112–122 CrossRef CAS PubMed.
- G. M. Sheldrick, Acta Crystallogr., Sect. C: Struct. Chem., 2015, 71, 3–8 CrossRef PubMed.
- M. Drakopoulos, T. Connolley, C. Reinhard, R. Atwood, O. Magdysyuk, N. Vo, M. Hart, L. Connor, B. Humphreys, G. Howell, S. Davies, T. Hill, G. Wilkin, U. Pedersen, A. Foster, N. De Maio, M. Basham, F. J. Yuan and K. Wanelik, J. Synchrotron Radiat., 2015, 22, 828–838 CrossRef CAS PubMed.
- S. J. Moorhouse, N. Vranjes, A. Jupe, M. Drakopoulos and D. O'Hare, Rev. Sci. Instrum., 2012, 83, 084101 CrossRef PubMed.
- A. P. Hammersley, J. Appl. Crystallogr., 2016, 49, 646–652 CrossRef CAS.
- A. Coelho, TOPAS-Academic V5, Coelho Software, 2012 Search PubMed.
- A. Domenicano, G. Schultz, I. Hargittai, M. Colapietro, G. Portalone, P. George and C. W. Bock, Struct. Chem., 1990, 1, 107–122 CrossRef CAS.
- A. V. Fratini, E. M. Cross, R. B. Whitaker and W. W. Adams, Polymer, 1986, 27, 861–865 CrossRef CAS.
- S. R. Batten, S. M. Neville and D. R. Turner, Coordination Polymers: Design, Analysis and Application, RSC Publishing, Cambridge, UK, 2009 Search PubMed.
- A. K. Cheetham, C. N. R. Rao and R. K. Feller, Chem. Commun., 2006, 4780–4795 RSC.
- A. Schoedel, M. Li, D. Li, M. O'Keeffe and O. M. Yaghi, Chem. Rev., 2016, 116, 12466–12535 CrossRef CAS PubMed.
- F. Millange, C. Serre and G. Férey, Chem. Commun., 2002, 822–823 RSC.
- Y. Zhang, J. Yang, G. D. Li, F. Zhang and J. S. Chen, J. Coord. Chem., 2008, 61, 945–955 CrossRef CAS.
- H. Y. He, H. Q. Ma, D. Sun, L. L. Zhang, R. M. Wang and D. F. Sun, Cryst. Growth Des., 2013, 13, 3154–3161 CAS.
- B. L. Chen, Y. Yang, F. Zapata, G. D. Qian, Y. S. Luo, J. H. Zhang and E. B. Lobkovsky, Inorg. Chem., 2006, 45, 8882–8886 CrossRef CAS PubMed.
- R. Sibille, T. Mazet, B. Malaman and M. Francois, Chem. – Eur. J., 2012, 18, 12970–12973 CrossRef CAS PubMed.
- J. Juillard, Pure Appl. Chem., 1977, 49, 885–892 Search PubMed.
- A. D. Burrows, K. Cassar, R. M. W. Friend, M. F. Mahon, S. P. Rigby and J. E. Warren, CrystEngComm, 2005, 7, 548–550 RSC; G. Huang, P. Yang, N. Wang, J. Z. Wu and Y. Yu, Inorg. Chim. Acta, 2012, 384, 333–339 CrossRef CAS.
- A. F. Gualtieri, Phys. Chem. Miner., 2001, 28, 719–728 CrossRef CAS.
- F. Millange, R. El Osta, M. E. Medina and R. I. Walton, CrystEngComm, 2011, 13, 103–108 RSC; E. Stavitski, M. Goesten, J. Juan-Alcaniz, A. Martinez-Joaristi, P. Serra-Crespo, A. V. Petukhov, J. Gascon and F. Kapteijn, Angew. Chem., Int. Ed., 2011, 50, 9624–9628 CrossRef CAS PubMed; J. Cravillon, C. A. Schroder, H. Bux, A. Rothkirch, J. Caro and M. Wiebcke, CrystEngComm, 2012, 14, 492–498 RSC; B. Seoane, J. M. Zamaro, C. Tellez and J. Coronas, CrystEngComm, 2012, 14, 3103–3107 RSC; R. El Osta, M. Feyand, N. Stock, F. Millange and R. I. Walton, Powder Diffr., 2013, 28, S256–S275 CrossRef; M. Goesten, E. Stavitski, E. A. Pidko, C. Gucuyener, B. Boshuizen, S. N. Ehrlich, E. J. M. Hensen, F. Kapteijn and J. Gascon, Chem. – Eur. J., 2013, 19, 7809–7816 CrossRef PubMed; H. Reinsch and N. Stock, CrystEngComm, 2013, 15, 544–550 RSC; F. Ragon, P. Horcajada, H. Chevreau, Y. K. Hwang, U. H. Lee, S. R. Miller, T. Devic, J. S. Chang and C. Serre, Inorg. Chem., 2014, 53, 2491–2500 CrossRef PubMed; M. E. Schweinefuss, I. A. Baburin, C. A. Schroder, C. Nather, S. Leoni and M. Wiebcke, Cryst. Growth Des., 2014, 14, 4664–4673 Search PubMed; G. Zahn, P. Zerner, J. Lippke, F. L. Kempf, S. Lilienthal, C. A. Schroder, A. M. Schneider and P. Behrens, CrystEngComm, 2014, 16, 9198–9207 RSC; F. Ragon, H. Chevreau, T. Devic, C. Serre and P. Horcajada, Chem. – Eur. J., 2015, 21, 7135–7143 CrossRef PubMed; Y. Wu, S. J. Moorhouse and D. O'Hare, Chem. Mater., 2015, 27, 7236–7239 CrossRef; H. Chevreau, A. Permyakova, F. Nouar, P. Fabry, C. Livage, F. Ragon, A. Garcia-Marquez, T. Devic, N. Steunou, C. Serre and P. Horcajada, CrystEngComm, 2016, 18, 4094–4101 RSC; S. Saha, S. Springer, M. E. Schweinefuss, D. Pontoni, M. Wiebcke and K. Huber, Cryst. Growth Des., 2016, 16, 2002–2010 Search PubMed.
Footnotes |
| † Electronic supplementary information (ESI) available: Further characterisation data and details of kinetic analysis. CCDC 1057461 and 1537042–1537044 contains the supplementary crystallographic data for this paper. For ESI and crystallographic data in CIF or other electronic format see DOI: 10.1039/c7ce00481h |
| ‡ Present address: Department of Materials Science & Metallurgy, 27 Charles Babbage Road, Cambridge, CB3 0FS, UK. |
| This journal is © The Royal Society of Chemistry 2017 |

