 Open Access Article
Creative Commons Attribution 3.0 Unported Licence
A resource efficient design strategy to optimise the temperature coefficient of capacitance of BaTiO3-based ceramics using finite element modelling
J. S.
Dean
*,
P. Y.
Foeller
,
I. M.
Reaney
and
D. C.
Sinclair
Functional Materials and Devices Group, Materials Science and Engineering, University of Sheffield, Sheffield, S1 3JD, UK. E-mail: j.dean@sheffield.ac.uk
First published on 14th January 2016
Abstract
An in-house finite element modelling package is used to simulate the electrical response of core–shell microstructures of BaTiO3-based (BT) dielectric materials as a design strategy for multilayer ceramic capacitors. By combining this method with experimental material properties, both the temperature coefficient of capacitance (TCC) and the volume ratio of undoped BT ceramic (core phase) to chemically doped BT ceramic (shell phase) to optimise temperature stability can be predicted. This is a faster, more reliable and efficient design strategy than current techniques which are based on iterative experimental protocols. This methodology is illustrated using rare earth-free NaNbO3-doped BT (NNBT) ceramics as an example for which we predict and experimentally confirm an optimised volume fraction ratio of 0.66 undoped BT core to 0.34 of a 2.5% NNBT shell.
Introduction
Driven by the rapid growth in the number and type of commercial electronic devices, the need for multilayer ceramic capacitors (MLCC) is increasing and at present exceeds 2 trillion units per year.1 Ferroelectric BaTiO3 (BT) is the material of choice for such devices due to its high permittivity (∼1700 at room temperature, rising to a sharp maximum of ∼10![[thin space (1/6-em)]](https://www.rsc.org/images/entities/char_2009.gif) 000 at the Curie temperature, Tc of ∼120 °C). However, the strong temperature dependent permittivity needs to be modified to meet industrial requirements. For example, a ± 15% temperature variation in capacitance (and therefore permittivity) is required to meet X7R (−55 to 125 °C) and X8R (−55 to 150 °C) standards.2 To achieve such standards, BT is chemically doped to improve the temperature stability of the permittivity of the MLCC, thereby decreasing the magnitude of the Temperature Coefficient of Capacitance (TCC). A wide range of additives and dopants to BT have been considered with a particular focus on intermediate sized trivalent ions such as Y3,4 and rare earths.5–8 One rare earth used frequently is Dy due to its ability to dope onto either or both the Ba and Ti sites.9 Ceramic processing is designed to create limited diffusion of these elements into BT grains and this heterogeneous distribution creates a ‘core–shell’-type ceramic microstructure.3,4,10–15 In its simplest form, the sub-grain microstructure consists of a grain-core based on un-doped BT with Tc ∼ 120–130 °C surrounded by an outer-shell grain region with a distribution of dopants that suppress and smear out Tc to lower temperatures. Core–shell microstructures therefore, create a much broader permittivity–temperature profile as compared to un-doped BaTiO3 ceramics. The overall permittivity–temperature profile depends on many parameters, including; grain size, dopant concentration and distribution and volume fraction of core and shell regions. For a given grain size and dopant concentration, controlling dopant distribution by ceramic processing (e.g. varying heating/cooling rates, sintering temperatures and dwell times) are employed to create different volume fractions of core and shell regions to systematically modify the permittivity–temperature profile of BT-based ceramics.16 Thus, TCC can be controlled over a sufficiently wide temperature range to satisfy industrial standards via optimisation of appropriate core–shell volume fractions.13,16
000 at the Curie temperature, Tc of ∼120 °C). However, the strong temperature dependent permittivity needs to be modified to meet industrial requirements. For example, a ± 15% temperature variation in capacitance (and therefore permittivity) is required to meet X7R (−55 to 125 °C) and X8R (−55 to 150 °C) standards.2 To achieve such standards, BT is chemically doped to improve the temperature stability of the permittivity of the MLCC, thereby decreasing the magnitude of the Temperature Coefficient of Capacitance (TCC). A wide range of additives and dopants to BT have been considered with a particular focus on intermediate sized trivalent ions such as Y3,4 and rare earths.5–8 One rare earth used frequently is Dy due to its ability to dope onto either or both the Ba and Ti sites.9 Ceramic processing is designed to create limited diffusion of these elements into BT grains and this heterogeneous distribution creates a ‘core–shell’-type ceramic microstructure.3,4,10–15 In its simplest form, the sub-grain microstructure consists of a grain-core based on un-doped BT with Tc ∼ 120–130 °C surrounded by an outer-shell grain region with a distribution of dopants that suppress and smear out Tc to lower temperatures. Core–shell microstructures therefore, create a much broader permittivity–temperature profile as compared to un-doped BaTiO3 ceramics. The overall permittivity–temperature profile depends on many parameters, including; grain size, dopant concentration and distribution and volume fraction of core and shell regions. For a given grain size and dopant concentration, controlling dopant distribution by ceramic processing (e.g. varying heating/cooling rates, sintering temperatures and dwell times) are employed to create different volume fractions of core and shell regions to systematically modify the permittivity–temperature profile of BT-based ceramics.16 Thus, TCC can be controlled over a sufficiently wide temperature range to satisfy industrial standards via optimisation of appropriate core–shell volume fractions.13,16
As TCC is controlled by a combination of the material properties and physical microstructure, this poses significant challenges in both the fabrication of devices and in their characterisation post fabrication. For example, state-of-the-art MLCCs based on BT ceramics often consist of more than 500 dielectric layers17 that range from 0.8–2.0 μm thick (corresponding to only ∼5–15 BT grains per layer) interleaved by parallel layers of nickel electrodes.
Characterisation of core–shell microstructures have been attempted using several methods. In a recent study, Jeon et al.16 showed an optimised ratio for X7R existed in their system for a shell thickness (Y-doped) of approximately one third of the core (BT) radius. Microstructural analysis of the core and shell volume fraction was performed using analytical transmission and scanning electron microscopy. Core and shell volume fractions have also been measured in commercial positive temperature coefficient of resistance (PTCR) thermistors based on BaTiO3.18 Analysis of impedance spectroscopy data using complex electric modulus, M*, plots and spectroscopic plots of the imaginary component of the electric modulus, M′′, suggested shell regions are approximately one fifth of the thickness of the core regions. This estimate was confirmed by conductive atomic force microscopy that revealed Schottky barriers ∼500 nm wide for an average grain size of ∼5 μm.19
As the demand for the number of BaTiO3-based MLCC increases, reducing rare-earth dopant concentration is becoming a necessity based on scarcity, geopolitical uncertainty and cost. The trial and error experimental approach to core–shell volume faction optimisation based on various compositional formulations and ceramic-processing conditions is time and resource intensive, as are the analyses required to establish core–shell volume ratios in ceramics. Here, we demonstrate a new strategy of functional materials design using a combination of finite element modelling (FEM) and experimental data. First, we use experimentally measured permittivity–temperature profiles from a range of BT-based ceramics to provide input to an FEM model. This is used to assist and guide the design process by identifying the optimised volume ratio of un-doped BT ceramics (core phase) to doped ceramic (shell phase) to obtain the lowest magnitude of TCC. Finally, ceramics based on predicted volume fractions are fabricated to verify the FEM results. This methodology is faster, more reliable and resource efficient than current techniques which are based purely on an iterative experimental protocol. Novel rare earth-free NaNbO3-doped BaTiO3 (NNBT) ceramics are used to illustrate this new methodology.
Modelling methodology
The modelling uses an in-house developed finite element package, ElCer,20,21 to simulate the response of an electro-ceramic material. This incorporates a time domain finite element method (TDFEM) to solve Maxwell's equations in space and time. A powerful aspect of this approach is that it permits the electronic response to be calculated from a combination of material properties (conductivity, permittivity) and the ceramic microstructure of the system, including grain boundaries, grain cores and grain shells of various shape and size. The system is meshed using a combination of tetrahedra and prisms, solved and analysed for the electrical response. Each electrically active region, such as a grain or grain boundary phase, can be assigned its own unique time constant (i.e. conductivity and permittivity) allowing the ability to create both microstructural and electrical heterogeneity within ceramics. This model can then be solved for the electrical response and the impedance data simulated using ElCer without the requirement of an equivalent circuit consisting of some combination of resistors, capacitors and/or constant phase elements.To use the FEM method for optimising the TCC for multilayer capacitor materials, we propose a novel resource efficient strategy. We first design a microstructure to mimic that found experimentally, namely a volume fraction of core and shell phases. We assign a permittivity to each phase based on experimental data obtained from ceramics of individually fabricated phases. FEM is then used to simulate the total capacitance of the system and converted, using the geometry of the model, to obtain the effective permittivity. This is repeated, using the temperature-permittivity profile for the individual core and shell phases, replicating the response of the system over a defined temperature range and converted to TCC by normalising the permittivity data using eqn (1) where
 | (1) |
Experimental methodology
A series of samples based on x(NaNbO3)–(1 − x)BaTiO3 (NNBT, x = 0, 0.01, 0.025, 0.05, 0.10) powders were prepared via a solid state reaction. BaCO3 (≥99%, Sigma-Aldrich, Dorset, UK), TiO2 (≥99.9%, rutile, Sigma-Aldrich, Dorset, UK), Na2CO3 (≥99.5%, Fisher Scientific, Loughborough, UK) and Nb2O5 (99.999%, Stanford Materials Corporation, USA) were used in ∼50 g stoichiometric batches according to the desired composition. Each composition was weighed to an accuracy of ±0.001 g and ball-milled in iso-propanol using 10 mm diameter Y2O3 stabilised ZrO2 milling media for 12 h. After milling, the media were removed and the remaining slurry dried at 80 °C for 12 h.The dried sample was then sieved through a 200 μm mesh and the resulting powder reacted in an Al2O3 crucible for 6 h at 1140 °C. The powder was then ball-milled, dried, sieved again and pressed into 10 mm diameter pellets in a uniaxial press at ∼0.3 tonne for ∼1 min. Green pellets were then placed on Pt-foil in an Al2O3 crucible and sintered in air for 8 h at 1400 °C. Ceramics were coated with Au-paste electrodes and placed in an in-house designed rig that was inserted into a programmable tube furnace. The permittivity–temperature profiles were obtained using an LCR meter (Agilent E4980 Precision LCR Meter, Agilent Technologies) and the results shown in Fig. 1 for a fixed frequency of 100 kHz with an applied ac voltage of 100 mV. Data points were collected every 60 s from room temperature to 200 °C using a non-inductively wound tube furnace at a rate of 1 °C min−1. All data were corrected for sample geometry.
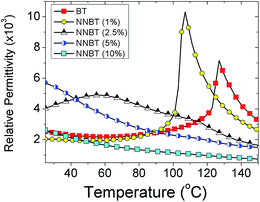 | ||
| Fig. 1 Permittivity (100 kHz) versus temperature profiles for x(NaNbO3)–(1 − x)BaTiO3 (NNBT, x = 0, 0.01, 0.025, 0.05, 0.10) ceramics. | ||
Modelling generation and simulation
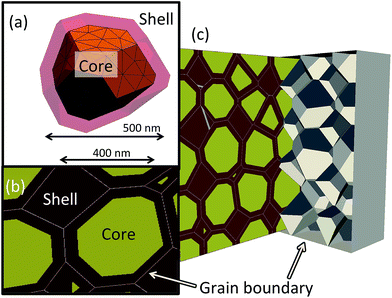
Previously we have shown that grain shape can influence the impedance response of ceramics.21 To accommodate such microstructural effects, we incorporate into the design a realistic grain size and distribution that includes a unique irregular shape for each grain but with a well-defined core–shell volume fraction, each with specified material properties (permittivity and conductivity).To generate the microstructure, a Voronoi tessellation method is employed. This creates a set of surfaces from a collection of seed points that can be used to describe a granular structure. Previously, we have distributed these points onto a cubic array to generate brick-shaped grains and included random fluctuations to their position to form irregular shaped grains. We now extend this moving towards a more realistic granular shape by placing the seed points on a body centred cubic structure. When the Voronoi tessellation algorithm is run, these points form a collection of tessellated truncated octahedra. A variable is included to add a distribution to the grain shape and volume by modifying the position of the points by a small amount. Using this method, we generate 341 points, ensuring the average spacing creates grains approximately 500 nm in diameter with a realistic Gaussian distribution. This is consistent with state-of-the-art MLCCs and the particle size of the starting BT powder. To generate the core–shell volume fraction, the seed point placement is used as the centroid of the associated grain. The associated surface of the grain is then copied and shrunk to create an inner surface that represents the core. This shrinking can then be controlled to obtain the desired volume fraction of the two (i.e. core and shell) phases. Finally, we add between the grains a thin region of 10 nm assigning it the properties of a grain boundary.
Once designed, GMSH22 is used to mesh the structure. A convergence study was performed and established that using over 30![[thin space (1/6-em)]](https://www.rsc.org/images/entities/char_2009.gif) 000 nodes and 150
000 nodes and 150![[thin space (1/6-em)]](https://www.rsc.org/images/entities/char_2009.gif) 000 individual tetrahedral elements provided convergence through all systems presented here. The full microstructure required is shown in Fig. 2. These structural parameters allow the simulation to be generated in <1 h on a desktop computer with optimised convergence and reliability of the solution. To test the optimisation methodology, we simplify the material properties by studying the effect of combining a core of BT with a shell of doped NNBT on the system's capacitance as a function of volume fraction and temperature. The temperature window over which to optimise was chosen as 25 to 150 °C however, it should be noted that this can easily be modified to identify any TCC temperature window. The core and shell are assigned a temperature dependent permittivity extracted from Fig. 1. We set the values of conductivity for undoped BT and the doped NNBT at an arbitrary value of σBT = 100 μS m−1 and the grain boundary to be σgb = 0.1 μS m−1. These values ensure the current flows through the grains via the grain boundaries (i.e. brick work layer model) as opposed to percolating down the grain boundaries. These values are assumed to be independent of doping level and temperature. We also choose the grain boundary permittivity to be fixed at εr = 100 and also constant as a function of temperature consistent with previous simulations.20,21
000 individual tetrahedral elements provided convergence through all systems presented here. The full microstructure required is shown in Fig. 2. These structural parameters allow the simulation to be generated in <1 h on a desktop computer with optimised convergence and reliability of the solution. To test the optimisation methodology, we simplify the material properties by studying the effect of combining a core of BT with a shell of doped NNBT on the system's capacitance as a function of volume fraction and temperature. The temperature window over which to optimise was chosen as 25 to 150 °C however, it should be noted that this can easily be modified to identify any TCC temperature window. The core and shell are assigned a temperature dependent permittivity extracted from Fig. 1. We set the values of conductivity for undoped BT and the doped NNBT at an arbitrary value of σBT = 100 μS m−1 and the grain boundary to be σgb = 0.1 μS m−1. These values ensure the current flows through the grains via the grain boundaries (i.e. brick work layer model) as opposed to percolating down the grain boundaries. These values are assumed to be independent of doping level and temperature. We also choose the grain boundary permittivity to be fixed at εr = 100 and also constant as a function of temperature consistent with previous simulations.20,21
As ceramics contain thousands of individual grains sintered together, the electrical measurement of capacitance that is experimentally determined represents the average response of all grain shapes and sizes. To ensure the simulation results are independent of any statistical anomalies generated by the relatively limited number of irregular shaped grains, each volume ratio was generated ten times and the results averaged.
Optimising TCC
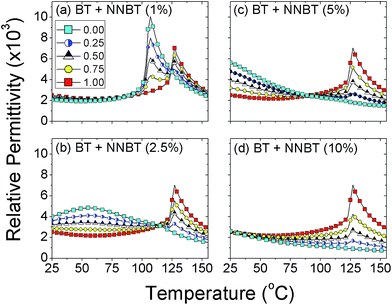
To optimise the TCC of an MLCC, we first generate different volume fractions combining each of the differently doped materials with a core material based on un-doped BT. We define a core volume fraction Vf as the ratio of the core volume (un-doped BT) to that of the total volume of the grain. For example, Vf = 1 indicates a system that is made only of un-doped BT. As the core is shrunk, maintaining the total volume of the grain, we begin to surround the core by a doped material (shell phase). When the volume of core and shell phases are equal this corresponds to Vf = 0.5. This continues to the point where Vf = 0, which denotes the system is made entirely of doped material.For each system, the electrical response for the collection of grains is simulated and the DC capacitance (i.e. at a frequency = 0 Hz) calculated. This is converted to a relative permittivity, εr, of the system, using the geometrical factor (thickness/electrode area) of the sample. As shown in Fig. 3, for each of the combinations of a BT core surrounded by either a 1, 2.5, 5 or 10% NNBT doped shell material a different response is generated. Some combinations of core and shell phases do not lead to flat εr-temperature profiles, Fig. 3(a) and (d) while others are more promising, Fig. 3(b) and (c). An example of a doped material (shell phase) not assisting in a smearing of εrversus temperature is highlighted when combining a 1% NNBT doped material surrounding a BT core, Fig. 3(a). The doped material has a large peak in permittivity at 100 °C due to a decrease in Tc associated with Na- and Nb-doping in contrast to BT with Tc of ∼125 °C. As single-phase materials, corresponding to Vf of 1 (all core phase) and 0 (all shell phase), the high permittivity associated with each phase dominates, leading to a poor permittivity profile for any potential MLCC composition. Combining these two compositions does not enhance the prospects for any potential MLCC usage because at intermediate Vf the increased permittivity of both phases blend together but maintain significant peaks in εr at their respective Tc's. This is in contrast to using a 2.5% NNBT material where a well-defined Tc does not exist, instead there is a broad εr-temperature profile with a maximum at ∼60 °C, Fig. 3(b). When mixed with a BT core such that Vf = 0.50, a much flatter εr-temperature profile is obtained, e.g. triangle symbols in Fig. 3(b).
To optimise Vf of the two phases, εr is converted to TCC and the TCC-temperature profiles shown in Fig. 4. The desired standard TCC criteria, e.g. X7R can then be overlaid to see if any of the material combinations meet the required performance. This optimisation methodology follows the experimental route to identify the best combination of materials however, it is limited since it depends on the number of volume fractions created and measured. Using FEM, we can quickly and systematically simulate many material (phase) combinations and volume fractions thus going beyond the conventional time and resource intensive experimental methodology required to optimise the TCC response in BT-based ceramics.
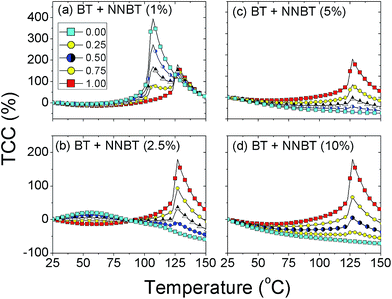 | ||
| Fig. 4 Calculated TCC values versus temperature based on conversion of simulated εr to TCC values. Similar to Fig. 3, they are simulations of a BT core surrounded by a shell phase of (a) 1%, (b) 2.5%, (c) 5% and (d) 10% doped NNBT. In each figure, different shell Vf values are plotted, i.e. Vf = 0.0 (all shell, xNNBT), 0.25, 0.50, 0.75 and 1.0 (all core, un-doped BT). | ||
The ideal combination of core and shell phases would lead to a perfectly flat response with the integral of TCC being as close to zero as possible over the measured temperature range. Realistically TCC will not be either positive or negative but will fluctuate around TCC = 0. To correctly identify the optimised Vf, we integrate the absolute value of TCC from 25 to 150 °C and plot it as a function of Vf of un-doped BT, Fig. 5. This new optimisation route indicates that for a 1% doped NNBT material the response is an almost linear decrease between the two different phases. There is no performance enhancement to be obtained by combining undoped BT with a 1% doped NNBT material and even un-doped BT out performs any combination of these two phases.
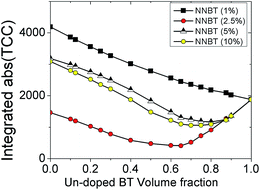 | ||
| Fig. 5 The integrated absolute TCC response versus Vf of undoped BT for NNBT-BT ceramics based on Fig. 1. This provides a new method to identify the best combination of doped materials with undoped BT to minimise TCC in MLCCs. | ||
For 5% and 10% NNBT doped materials, a minimum in the integrated TCC is observed and can be identified as Vf ∼ 0.75 of un-doped BT however, the best candidate to produce the flattest integrated absolute value of TCC is combining 2.5% doped NNBT with un-doped BT with Vf ∼ 0.66. Based on an average grain size of 500 nm, this corresponds to a ∼31 nm thick doped-shell surrounding an un-doped BT core of diameter ∼437 nm.
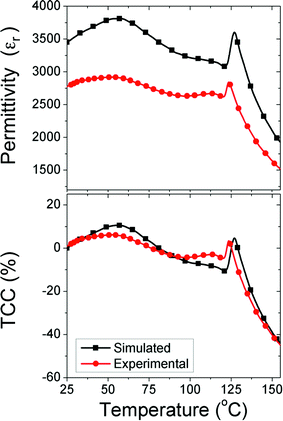
We use a combination of both modelling and experimental studies to verify this prediction. Firstly, using the same methodology as described above, we simulated a multi-granular model, where each grain has a core–shell structure of BT surrounded by a doped 2.5% NNBT shell set at Vf = 0.66. As shown in Fig. 6, this combination leads to a flatter TCC response. Although the simulation predicts a higher εr of ∼3500 compared to that of ∼3000 from the experimental data obtained from the ceramic, there is excellent agreement in the temperature profile of the response. The observed change in absolute permittivity here is associated with extrinsic (experimental) parameters such as porosity, surface roughness, electrode contact problems and grain boundaries as opposed to any inaccuracies of our simplified model used to assess TCC.
More significantly, the experimental fabrication at this Vf shows there is only a maximum change of ±10% in TCC from 25 to 125 °C, highlighting this system is a possible candidate (based solely on TCC) for the upper operating temperature of X7R devices. However, it would be unsuitable for X8R devices due to the large negative deviation in TCC (>−50%) obtained between 125 and 150 °C. Sub-ambient experimental εr data (down to −55 °C) for the ceramics would need to be collected to test if the variation in TCC is within the ±15% limit required for X7R specification. Moreover, TCC is only one of several materials requirements for BT-based MLCCs and other parameters need also to be screened, e.g. dielectric loss, breakdown, degradation/fatigue and compatibility with base metal electrodes such as Ni.
Nevertheless, and in conclusion, the combined FEM-experimental approach described above represents a new and resource efficient design strategy to optimise the TCC of BaTiO3-based ceramics. Other dopant systems are now under investigation and are being tested to verify this design strategy with the longer term aim of producing new, rare-earth free formulations with suitable TCC behaviour for future generations of BT-based MLCCs.
Acknowledgements
We thank the EPSRC (EP/L017563/1) and the Royal Society (RG140287) for funding and supporting this work.References
- J. Ho, T. R. Jow and S. Boggs, Historical Introduction to Capacitor Technology, IEEE Electr. Insul. Mag., 2010, 26, 20–25 CrossRef.
- Murata – Chip Monolithic Ceramic Capacitors http://www.murata.com/%7E/media/webrenewal/support/library/catalog/products/capacitor/mlcc/c02e.ashx (correct as of 07/01/2016).
- C.-H. Kim, K.-J. Park, Y.-J. Yoon, M.-H. Hong, J.-O. Hong and K.-H. Hur, Role of Yttrium and Magnesium in the Formation of Core–Shell Structure of BaTiO3 Grains in MLCC, J. Eur. Ceram. Soc., 2008, 28, 1213–1219 CrossRef CAS.
- C.-C. Chou, C.-S. Chen, I. N. Lin, W.-C. Yang and H.-F. Cheng, Development of X7R Type Base-Metal-Electroded BaTiO3 Capacitor Materials by Co-Doping of MgO/Y2O3 Additives, Ferroelectrics, 2006, 332, 35–39 CrossRef CAS.
- H. Kishi, N. Kohzu, N. Ozaki, H. Ohsato and T. Okuda, Effect of Occupational Sites of Rare-Earth Elements on the Curie Point in BaTiO3, Applications of Ferroelectrics, Proceedings of the 13th IEEE International Symposiumx, 2002, 271–276 CAS.
- H. Kishi, N. Kohzu, J. Sugino, H. Ohsato, Y. Iguchi and T. Okuda, The Effect of Rare-Earth (La, Sm, Dy, Ho and Er) and Mg on the Microstructure in BaTiO3, J. Eur. Ceram. Soc., 1999, 19, 1043–1046 CrossRef CAS.
- J. Nishikawa, T. Hagiwara, K. Kobayashi, Y. Mizuno and H. Kishi, Effects of Microstructure on the Curie Temperature in BaTiO3-Ho2O3-MgO-SiO2 System, Jpn. J. Appl. Phys., Part 1, 2007, 46, 6999–7004 CrossRef CAS.
- K.-J. Park, C.-H. Kim, Y.-J. Yoon, S.-M. Song, Y.-T. Kim and K.-H. Hur, Doping Behaviors of Dysprosium, Yttrium and Holmium in BaTiO3 Ceramics, J. Eur. Ceram. Soc., 2009, 29, 1735–1741 CrossRef CAS.
- D. Makovec, Z. Samardzija and M. Drofenik, Solid Solubility of Holmium, Yttrium, and Dysprosium in BaTiO3, J. Am. Ceram. Soc., 2004, 87, 1324–1329 CrossRef CAS.
- C.-H. Kim, K.-J. Park, Y.-J. Yoon, J.-O. Hong, D.-S. Sinn and K.-H. Hur, Ieee, Formation of Core–Shell Structure of BaTiO3 Grains in MLCC, in 2007 Sixteenth Ieee International Symposium on the Applications of Ferroelectrics, 2007, vol. 1 and 2, pp. 540–543 Search PubMed.
- C.-H. Kim, K.-J. Park, Y.-J. Yoon, D.-S. Sinn, Y.-T. Kim and K.-H. Hur, Effects of Milling Condition on the Formation of Core–Shell Structure in BaTiO3 Grains, J. Eur. Ceram. Soc., 2008, 28, 2589–2596 CrossRef CAS.
- Z. Tian, X. Wang, H. Gong, T.-H. Song, K. H. Hur and L. Liz, Core–Shell Structure in Nanocrystalline Modified BaTiO3 Dielectric Ceramics Prepared by Different Sintering Methods, J. Am. Ceram. Soc., 2011, 94, 973–977 CrossRef CAS.
- S.-C. Jeon, C.-S. Lee and S.-J. L. Kang, The Mechanism of Core/Shell Structure Formation During Sintering of BaTiO3-Based Ceramics, J. Am. Ceram. Soc., 2012, 95, 2435–2438 CrossRef CAS.
- H. Y. Lu, J. S. Bow and W. H. Deng, Core–Shell Structures in ZrO2-Modified BaTiO3 Ceramic, J. Am. Ceram. Soc., 1990, 73, 3562–3568 CrossRef CAS.
- C. A. Randall, S. F. Wang, D. Laubscher, J. P. Dougherty and W. Huebner, Structure Property Relationships in Core–Shell BaTiO3-LiF Ceramics, J. Mater. Res., 1993, 8, 871–879 CrossRef CAS.
- S.-C. Jeon, B.-K. Yoon, K.-H. Kim and S.-J. Kang, Effects of Core/Shell Volumetric Ratio on the Dielectric-Temperature Behavior of BaTiO3, J. Adv. Ceram., 2014, 3, 76–82 CrossRef CAS.
- H. Kishi, Y. Mizuno and H. Chazono, Base-Metal Electrode-Multilayer Ceramic Capacitors: Past, Present and Future Perspectives, Jpn. J. Appl. Phys., Part 1, 2003, 42, 1–15 CrossRef CAS.
- D. C. Sinclair and A. R. West, Impedance and Modulus Spectroscopy of Semiconducting BaTiO3 Showing Positive Temperature-Coefficient of Resistance, J. Appl. Phys., 1989, 66, 3850–3856 CrossRef CAS.
- P. Fiorenza, R. Lo Nigro, P. Delugas, V. Raineri, A. G. Mould and D. C. Sinclair, Direct Imaging of the Core–Shell Effect in Positive Temperature Coefficient of Resistance-BaTiO3 Ceramics, Appl. Phys. Lett., 2009, 95, 142904 CrossRef.
- J. S. Dean, J. H. Harding and D. C. Sinclair, Simulation of Impedance Spectra for a Full Three-Dimensional Ceramic Microstructure Using a Finite Element Model, J. Am. Ceram. Soc., 2014, 97, 885–891 CrossRef CAS.
- J. P. Heath, J. S. Dean, J. H. Harding and D. C. Sinclair, Simulation of Impedance Spectra for Core–Shell Grain Structures Using Finite Element Modeling, J. Am. Ceram. Soc., 2015, 98, 1925–1931 CrossRef CAS.
- C. Geuzaine and J.-F. Remacle, Gmsh: A 3-D Finite Element Mesh Generator with Built-in Pre- and Post-Processing Facilities, Int. J. Numer. Meth. Eng., 2009, 79, 1309–1331 CrossRef.
| This journal is © The Royal Society of Chemistry 2016 |

