 Open Access Article
Creative Commons Attribution 3.0 Unported Licence
Redox-active polyimide–polyether block copolymers as electrode materials for lithium batteries†
Guiomar
Hernández
a,
Nerea
Casado
a,
Raphaël
Coste
ab,
Devaraj
Shanmukaraj
c,
Laurent
Rubatat
b,
Michel
Armand
c and
David
Mecerreyes
*ad
aPOLYMAT, University of the Basque Country UPV/EHU, Joxe Mari Korta Centre, Avda. Tolosa 72, 20018, Donostia-San Sebastián, Spain. E-mail: david.mecerreyes@ehu.es
bUMR 5254 IPREM EPCP, Université de Pau et des Pays de l'Adour, Technopole Hélioparc, 2 av. Du Président Angot, 64053, Cedex 9 Pau, France
cCIC EnergiGUNE, Alava Technology Park, C/Albert Einstein 48, 01510, Miñano, Álava, Spain
dIkerbasque, Basque Foundation for Science, E-48011 Bilbao, Spain
First published on 2nd February 2015
Abstract
Redox-active polyimide–polyether multi-block copolymers were synthesized by polycondensation reaction of aromatic dianhydrides with α-ω-diamino poly(ethylene oxide). Polyimide-b-polyether block copolymers showed microphase separation between a hard-polyimide domain and a soft-polyether domain as observed by Atomic Force Microscopy. The block copolymers were investigated as cathodes for polymer/lithium metal batteries. Polymer cathodes were formulated where the block copolymer had a dual role as active material and binder, with a small amount of carbon black (15 wt%). Naphthalene polyimides showed higher discharge voltages, higher specific capacities as well as better cycling performance, compared to pyromellitic polyimides. The longest PEO blocks resulted in a better performance as electrodes. The best performing naphthalene polyimide-b-PEO2000 presented an excellent value of discharge capacity of 170 mA h g−1, stable after 100 cycles at a current density of 1Li+/5 h and considering the polyimide as the active material. The average discharge plateaus were 2.51 V and 2.37 V vs. Li+/Li.
Introduction
Electrochemical energy storage is still gaining interest due to the increasing demand for energy management in our daily life.1 Nowadays, research is focusing on green, sustainable and safe battery systems, taking into account life cycle, abundance of raw materials and electrode recycling.2 Among several types of batteries, lithium batteries have become powerful because of their high energy density, long cycle life and high efficiency.3,4 Currently, lithium-ion batteries are based on inorganic oxides as cathodes. Although lithium cobalt oxide (LiCoO2) is known to fail in terms of safety and sustainability,5,6 lithium iron phosphate (LiFePO4) is safer and environmentally benign.7As an alternative to inorganic oxides, organic molecules are being investigated as potential candidates for lithium batteries. Some of their advantages are the abundant resources as well as the feasibility of incorporation functional groups leading to tunable redox properties.5,6,8,9 However, drawbacks of using organic compounds are the electrode dissolution, low thermal and mechanical stability and poor conductivity.5,6 Here, organic redox polymers are known to reduce these problems due to their lower solubility in common organic solvents used as electrolytes, lower self-discharge rate, high mechanical strength, flexibility, excellent thermal stability and broader functionalities.10–12 In recent years, redox-active polymers have been studied as active materials of electrodes. Some examples are conducting polymers, such as polypyrrole13 or poly(3,4-ethylenedioxythiophene) (PEDOT);14 radical polymers;13 organosulphur derivatives15,16 and polymers with carbonyl groups.10,17
Polyimides were chosen in this work due to their ability to undergo reversible electrochemical reduction and oxidation. Reversible redox properties of polyimides was reported in the early 90's by Viehbeck et al.18 for different aromatic structures. A bit later, the electrochemical and optical properties of polyimide–polyether copolymers were studied by Michot and co-workers.19 Those materials presented an intense colour change in the reduced state. In 2010, several groups started to look again to polyimides because of its excellent performance as active materials for rechargeable lithium batteries due to their outstanding thermal stability and mechanical strength.10,18–20 Thus, polyimides derived from 3,4,9,10-perylenetetracarboxylic dianhydride (PTCDA) exhibited a discharge voltage of 2.35 V vs. Li+/Li and a discharge capacity of 110 mA h g−1 cycled at 50 mA g−1 current density.5 Due to their low solubility and electrical conductivity, different conductive additives have been used with polyimides derived from pyromellitic dianhydride as active material. Some examples are single-wall carbon nanotube (SWNT) film used as current collector21 and 3D graphene as the conductive network.4
In this work, block copolymers made from imide redox-active groups in combination with oligoether blocks were investigated as electrodes for lithium batteries. It is well known the microphase separation properties of block copolymers which allow to closely combine the properties of the different polymer blocks. This strategy was originally used for the development of thermoplastic elastomers. Nowadays it is being investigated for the development of advanced materials for nanolithography,22 polymer electrolytes23 and solar cells.24 The goal of our work is to explore the possibility of engineering polymer battery electrodes using the block copolymer strategy. This may allow combining closely the polymer responsible for the redox active electrode and the properties of the polymer ion-conducting electrolyte. For the later, oligomeric block containing ethylene oxide groups is the ideal choice due to its ability to act as solvating agent for Li+ and providing mobility.25,26 In this article, we investigated the effect of the chemical nature of the imide and the length of the oligoether segment, the morphology of the block copolymers and its performance as cathode in polymer/lithium batteries.
Experimental
Materials
Pyromellitic dianhydride (PMDA) (97%) and 1,4,5,8-naphthalenetetracarboxylic dianhydride (NTDA) (≥95%) were obtained from commercial sources (Sigma-Aldrich) and used as received. O,O′-Bis(2-aminopropyl)polyethylene glycol, with central PEO sequences of 500, 800 and 1900 molecular weights (Jeffamines® ED-600, ED-900 and ED-2003, respectively) were purchased also from Sigma-Aldrich and used as received.Anhydrous N,N-dimethylacetamide (DMAc), anhydrous toluene, diethyl ether, dichloromethane, N,N-dimethylformamide (DMF), anhydrous acetonitrile and anhydrous 2-methyltetrahydrofuran (MeTHF) were purchased from Sigma-Aldrich and used as received.
Polymer synthesis
Polyimides were synthesized by simple polycondensation reaction from dianhydrides and diamines.19,27 PEO based diamines (5 mmol) were dissolved in anhydrous N,N-dimethylacetamide in a 100 mL three-necked flask blanketed with nitrogen. Afterwards, stoichiometric amount of dianhydride (5 mmol) was added and stirred overnight at room temperature. Azeotropic imidization was carried out at 120 °C using toluene as an azeotrope (Dean Stark) to remove water from the polycondensation reaction. Polymers were obtained by precipitation of the reaction mixture into diethyl ether. Scheme of the polycondensation reaction and the chemical structures of polyimides are shown in Fig. 1.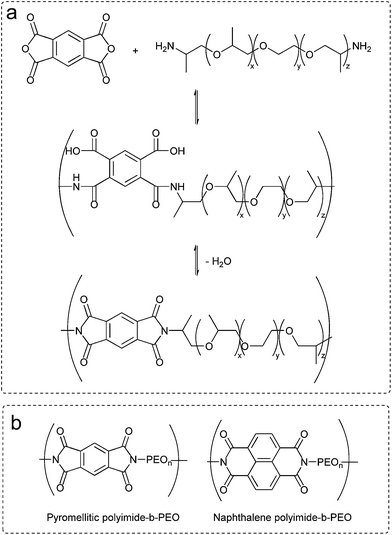 | ||
| Fig. 1 (a) Chemical route to polyimide-b-poly(ether). (b) Chemical structures of polyimide-b-poly(ethylene oxide) multi-block copolymers. | ||
Polymer characterization
1H and 13C NMR measurements were carried out using deuterated chloroform (CDCl3) on a Bruker Avance 500 (500 MHz) spectrometer. Attenuated Total Reflectance Fourier Transform Infrared Spectroscopy measurements (ATR-FTIR) were conducted on a Bruker ALPHA Spectrometer. Gel Permeation Chromatography (GPC) analysis was performed on a Shimadzu LC-20AD pump with an UV-visible detector (Waters 2487 dual k absorbance detector) and IR detector (Waters 2410 differential refractometer), with Styragel HR series of columns (HR6-HR4-HR2). Tetrahydrofuran (THF) was used as eluent with a flow rate of 1 mL min−1 at 35 °C. Calibration relative to polystyrene standards was used to calculate molecular weights and polydispersity.Differential scanning calorimetry (DSC) measurements were carried out on a DSC Q2000 from TA Instruments in order to determine glass transition temperatures, Tg, and melting temperatures, Tm. Samples were heated to 150 °C, then quenched to −80 °C and heated again to 150 °C, at a heating rate of 10 °C min−1. Thermal stability of the samples was investigated with a thermo-gravimetric analysis (TGA) performed on a TGA Q500 from TA Instruments. Measurements were carried out by heating the sample at 10 °C min−1 under nitrogen atmosphere from room temperature to 800 °C.
Morphology of the samples was studied with two Atomic Force Microscopes. The first one is a Bruker Multimode IV atomic force microscope (AFM) used in tapping mode. The cantilevers used were standard TESP from Bruker probe with a nominal resonance frequency of 320 kHz and a nominal spring constant of 42 N m−1. The second AFM used in this study is a Bruker Multimode VIII AFM used in PeakForce mode at 2 kHz. The cantilevers mounted were SCANASYST with a nominal spring constant of 0.4 N m−1 provided by Bruker probe. Since no cantilever calibration was initially performed, the z-scales on the elastic modulus and adhesion images are purely qualitative (displayed in arbitrary units or in V).
Electrochemical characterization
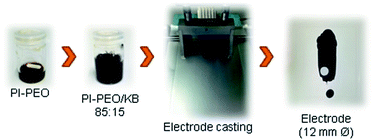
Cathodes were prepared by mixing PI–PEO copolymers (85 wt%) and Ketjen Black (KB) (15 wt%) (Ketjenblack® EC-600JD, AzkoNobel) in acetonitrile. The obtained slurry was cast on aluminium foils using the doctor blade technique. Fig. 5 depicts the preparation of the film electrode. Electrodes were dried under vacuum at 100 °C overnight for amorphous polymers and at room temperature for semi-crystalline polymers. The electrode films were punched into discs with a 12 mm diameter and a material loading of ca. 5 mg.Morphology and conductivity of electrodes were studied with the Bruker Multimode VIII AFM under the PeakForce TUNA mode, at 2 kHz. This mode allows mapping of mechanical and conductivity properties of the samples at the nanometre length scale. The SCM-PIT conductive cantilevers, with a nominal spring constant ranging from 1 to 5 N m−1, provided by Bruker probe were mounted. The peak current signal was measured in pA with DC sample bias of 1 V.
Coin cells (CR2032) were assembled in an argon-filled glove box. The cathode was separated from the lithium anode (Rockwood lithium) by a glass fibre (Glass fiber GFD/55, Whatman) imbibed with a 1 M lithium bis-trifluoromethanesulfonimide (LiTFSI, Solvionic) solution in MeTHF. This electrolyte mixture exhibited the best performance among others due to the partial solubility of the copolymers in common organic solvents.
Cyclic voltammetry (CV) measurements were performed using a VMP3 (Biologic®) electrochemical workstation. Scan rates of 1 mV s−1 were used between 1 V and 3.3 V against Li+/Li. Cells were cycled between 1 V and 3 V in galvanostatic mode using a MACCOR® battery tester at current rates of one Li+ ion/monomeric unit in 5 and 10 h. In both cases the counter electrode was lithium.
Results and discussion
Synthesis and characterization
Polyimide–polyether block copolymers were investigated before as electrochromic devices19 and gas separation membranes.27 Using a similar synthetic pathway, polyimides–polyether multi-block copolymers were synthesized by a polycondensation reaction of stoichiometric quantities of diamine (PEO600, PEO900, PEO2000) and dianhydride (pyromellitic-PMDA and naphthalene-NTDA) in two steps via an intermediate polyamic acid. Mechanism of polycondensation reaction and the chemical structures of the block copolymers are shown in Fig. 1. Appearance and consistence of the final polymers depend upon the PEO length, from waxy semi-crystalline for polyimide-b-PEO2000 block copolymers, to amorphous and transparent for polyimide-b-PEO600 and polyimide-b-PEO900. Similarly, the colour of the samples is given by the imide segment, light yellow for pyromellitic and dark brown for naphthalene polyimides.Structure characterization was carried out using 1H NMR, 13C NMR and IR spectroscopy. 1H NMR spectra showed the characteristic peaks of PEO blocks at 0.9 ppm (protons from the corresponding CH3) and 3.6 ppm (from the CH2) which integrate 40H, 63H and 153H for PEO600, 900 and 2000, respectively. The corresponding aromatic protons from the imide moieties appeared at 8.2 ppm (2H) for PMDA polymers and 8.7 ppm (4H) for NTDA polymers. The most significant peak for carbon NMR is the imide carbonyl with a 166 ppm shift for pyromellitic and 163 ppm for NTDA polymers. Besides NMR, imidization was also indicated by ATR-FTIR (Fig. 2), showing similar values to the ones reported in the literature.10 Characteristic bands of imides corresponding to asymmetric and symmetric stretching of C![[double bond, length as m-dash]](https://www.rsc.org/images/entities/char_e001.gif) O (νas and νsym C
O (νas and νsym C![[double bond, length as m-dash]](https://www.rsc.org/images/entities/char_e001.gif) O), asymmetric stretching of C–N (νas C–N) and bending of C
O), asymmetric stretching of C–N (νas C–N) and bending of C![[double bond, length as m-dash]](https://www.rsc.org/images/entities/char_e001.gif) O (δ C
O (δ C![[double bond, length as m-dash]](https://www.rsc.org/images/entities/char_e001.gif) O) appeared at 1770, 1714, 1350 and 730 cm−1, respectively, for PMDA polymers, and 1705, 1662, 1330 and 735 cm−1, respectively, for naphthalene polymers. Increasing aromaticity of the imide moiety leads to a decrease in the wavenumber of the bands.
O) appeared at 1770, 1714, 1350 and 730 cm−1, respectively, for PMDA polymers, and 1705, 1662, 1330 and 735 cm−1, respectively, for naphthalene polymers. Increasing aromaticity of the imide moiety leads to a decrease in the wavenumber of the bands.
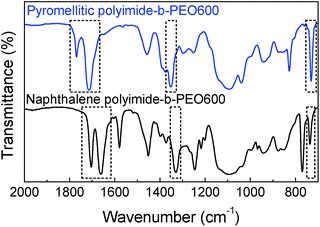 | ||
| Fig. 2 ATR-FTIR spectra of pyromellitic polyimide-b-PEO600 (top blue) and naphthalene polyimide-b-PEO600 (bottom black). | ||
The molecular weight (MW) of the copolymers was close to 2 × 10⁴ g mol−1 similar to other reports. The polymers showed high polydispersity index (PDI) between 3 and 5.4. Both results were determined by GPC in THF and are presented in Table 1.
| Entry | Name PI-b-PEO | M W a (g mol−1) | PDIa | T g b (°C) | T m b (°C) | T d c (°C) |
|---|---|---|---|---|---|---|
| a Molecular weight (MW) and polydispersity index (PDI) of polymers determined by GPC. b Glass transition temperature (Tg) and melting temperature (Tm) recorded by DSC at 10 °C min−1 heating rate. c Degradation temperature (Td) obtained by TGA at a heating rate of 10 °C min−1 under nitrogen atmosphere. | ||||||
| 1 | Pyromellitic-PEO600 | 6500 | 3.3 | −34 | — | 320 |
| 2 | Pyromellitic-PEO900 | 15![[thin space (1/6-em)]](https://www.rsc.org/images/entities/char_2009.gif) 500 500 |
5.2 | −47 | — | 330 |
| 3 | Pyromellitic-PEO2000 | 25![[thin space (1/6-em)]](https://www.rsc.org/images/entities/char_2009.gif) 300 300 |
4.4 | −25 | 29 | 280 |
| 4 | Naphthalene-PEO600 | 30![[thin space (1/6-em)]](https://www.rsc.org/images/entities/char_2009.gif) 300 300 |
4.0 | −26 | — | 385 |
| 5 | Naphthalene-PEO900 | 83![[thin space (1/6-em)]](https://www.rsc.org/images/entities/char_2009.gif) 100 100 |
5.4 | −43 | — | 380 |
| 6 | Naphthalene-PEO2000 | 24![[thin space (1/6-em)]](https://www.rsc.org/images/entities/char_2009.gif) 700 700 |
3.7 | −22 | 30 | 350 |
The DSC traces indicated that polymers having PEO blocks of 600 g mol−1 and 900 g mol−1 were amorphous polymers exhibiting well-defined glass transition temperatures. However, when the multi-block copolymers had a PEO block of 2000 g mol−1 a semi-crystalline polymer was obtained. Differential Scanning Calorimetry (DSC) curves for the three naphthalene polyimide-b-PEO copolymers having different length are shown in Fig. 3 (experimental data for all the samples is summarized in Table 1). Despite the fact that all polymers presented a Tg below 0 °C, an increase in the aromaticity of the imide moiety led to a higher Tg of the polymer (−34 °C for pyromellitic polyimide-b-PEO600 and −26 °C for naphthalene polyimide-b-PEO600), whereas an increase in the number of PEO units showed a decrease in the Tg (−43 °C for naphthalene polyimide-PEO900), making the overall chain more rigid.28 Semi-crystalline structure of samples pyromellitic polyimide-b-PEO2000 and naphthalene polyimide-b-PEO2000 can be explained due to the ability of long PEO segments to crystallize.
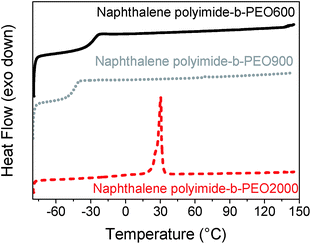 | ||
| Fig. 3 DSC curves for naphthalene polyimides-b-PEO600 (black solid line), naphthalene polyimide-b-PEO900 (grey dot line) and naphthalene polyimide-b-PEO2000 (red dashed line) at 10 °C min−1. | ||
Degradation temperature was determined by thermo-gravimetric analysis (TGA) and values for the different polymers are shown in Table 1. There was no significant weight loss up to 300 °C, temperature at which decomposition of aliphatic polyether segments takes place.
Polyimide–polyether multi-block copolymers are composed of rigid segments from aromatic groups alternating with flexible oligoether blocks. This composition should in principle lead to microphase separation in our copolymers. Fig. 4 shows the AFM images of naphthalene polyimide-b-PEO600 block copolymer. Weight composition of the copolymer was 32 wt% in hard polyimide block and 68 wt% soft PEO block. Films were solvent-casted on glass squares from an acetonitrile solution of the polymer. The films were dried under vacuum at 100 °C overnight. As observed in the AFM image, a weak segregation is noticeable from the height and elastic modulus (log scale) images collected in the PeakForce mode (Fig. 4). More specifically, on the mechanical modulus image, the clear domains correspond to aromatic parts (higher modulus), whereas darker domains are rich in aliphatic polyether segments (lower modulus). Unfortunately, characterization by AFM of polyimide–polyether samples with PEO2000 blocks was not possible due to their semi-crystalline morphology. Altogether, the multi-block copolymers showed microphase separation typical of block copolymers. The nanodomains showed a non-regular structure formed by two co-continuous phases. This morphology is in principle ideal for electrochemical properties since it clearly increases the contact surface area between our redox active block and ion conducting blocks.
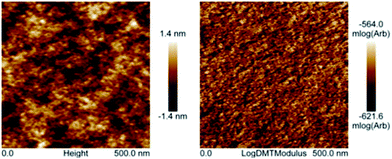 | ||
| Fig. 4 Height (left) and elastic modulus in log scale (right) AFM images of sample naphthalene polyimide-PEO600 multi-block copolymer (collected in the PeakForce mode). | ||
Electrochemical characterization
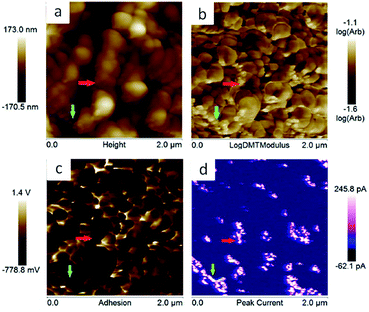
Polyimide–polyether block polymers are soluble in common organic solvents in comparison with aromatic polyimides which solubility is limited.29 This solubility brings two important benefits when the battery electrodes were prepared. Firstly, the addition of a binder is not needed to the electrode formulation which increases the composition of redox active material of the electrode. Secondly, the electrodes can be prepared by a simple solution method. Thus, our electrode was prepared by solubilising polyimides in acetonitrile and, afterwards, just conducting Ketjen black (KB) carbon was added. Composition of the slurry was 85 wt% of polyimide, acting as active material and binder, with 15 wt% of KB. The mixture was casted on aluminium foil. The overall process is depicted in Fig. 5.The PeakForce TUNA mode of the AFM has been used to investigate the morphology of our electrodes. This mode provides additional information about the conductivity of the samples as well as the elastic modulus and adhesion at the nanometre length scale. This technique was used to characterise sample naphthalene polyimide-b-PEO600 electrode loaded with 15 wt% of carbon black. Fig. 6 shows the topography, elastic modulus (log scale), adhesion and peak current images. The electrode does not show an obvious phase segregation between the copolymer blocks, but presents an aggregate-like morphology with small particles (few tens nm) surrounding bigger particles (few hundreds nm). The correlation between the elastic modulus and the peak current images tends to demonstrate that the small particles correspond to the carbon black. Indeed, there is a strong spatial correlation between higher modulus and electron conducting area; e.g. domains pointed by the red and green arrows. In addition, the analysis (bearing analysis) on the peak current image indicates a conducting area of about 10%, which is in reasonable agreements with the amount of carbon black loaded in the composite. However, carbon black is not very well distributed along the sample as it can be seen on the peak current image (Fig. 6d).
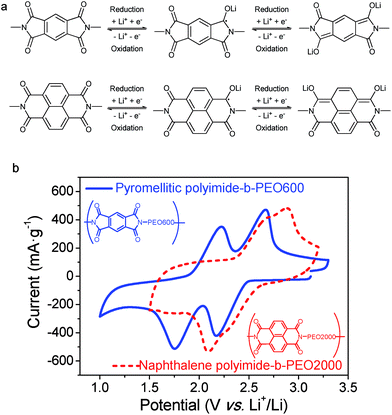
Redox reaction mechanism of imides can be described as an enolization process of the carbonyl group, facilitated by a conjugated structure able to disperse charge by delocalization.30 As shown in Fig. 7a, reduction of imide groups is related to association of lithium ions with oxygen whereas dissociation occurs during oxidation.10,18 Ideally, each formula unit could be able to transfer four electrons, however, it is only possible by applying a deep discharge voltage to below 1.3 V, which could lead to structural damage.31 As it can be seen in Fig. 7a, reduction and oxidation of polyimides involve two electrons in the potential range of 1.3 V to 3 V vs. Li+/Li. Consequently, the specific theoretical capacity for pyromellitic polyimide is 250 mA h g−1 and 200 mA h g−1 for the naphthalene polyimide, considering the imide as the active material.10,31
The first reduction step forms a radical-anion, followed by a second reduction step to generate a dianion species. Dianionic state of pyromellitic groups involves trans carbonyls due to the largest anionic charge separation. However, reduction of cis carbonyls occurs in naphthalene derivatives not to lose the aromaticity on both rings.18 It has also been demonstrated that a positive shift in the reduction potential is achieved by increasing the ring size of the imide.3,19
It has been reported that voltages of polyimides are more associated with the active group, which is the dianhydride component, rather than with the diamine.10,32 The same behaviour was observed for these PI–PEO block copolymers. Cyclic voltammograms of samples pyromellitic polyimide-b-PEO600 and naphthalene polyimide-b-PEO2000 are shown in Fig. 7b. Oxidation and reduction processes, for both polyimides, consist of two contiguous steps of one electron each. The first one could be associated with the formation of the radical-anion followed by the generation of the dianion,10,18 as shown in Fig. 7a. Polyimides derived from PMDA presented two well-resolved redox peaks at 1.8 V and 2.2 V for reduction and 2.2 V and 2.7 V for oxidation. However, naphthalene polyimides tend to merge into a broader two-electron peak.19 Reduction potentials for naphthalene polyimide-b-PEO2000 were 2.1 V and 2.3 V, whereas oxidations peaks were 2.8 V and 2.9 V.
Further comparison between samples based on different dianhydrides, pyromellitic polyimide-b-PEO600 and naphthalene polyimide-b-PEO600, was carried out by galvanostatic charge–discharge. Cycling performances of both samples are presented in Fig. 8. Among different current rates, 1Li+/5 h was chosen due to the higher stability and capacity values for all the samples. For pyromellitic polyimides, the capacity faded rapidly within the first cycles with a capacity retention of 53% in 20th cycle and 21% after 100 cycles. However, in the case of naphthalene polyimides, capacity decay was very low after cycle 10. Capacity in the 100th cycle was 90 mA h g−1 with a capacity retention of 54%. Naphthalene polyimides not only show higher voltage potential, but also provide high capacities and long cycle life. Same trend was reported previously in the literature with polyimide homopolymers.10,32
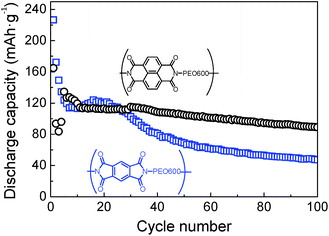 | ||
Fig. 8 Discharge capacities versus cycle number for pyromellitic polyimide-b-PEO600 ( ) and naphthalene polyimide-b-PEO600 (○) at 1Li+/5 h rate. ) and naphthalene polyimide-b-PEO600 (○) at 1Li+/5 h rate. | ||
A better performance of sample naphthalene polyimide-b-PEO600 led us to study its voltage profile at different cycles (Fig. 9). Two average discharge plateaus of 2.47 V and 2.30 V vs. Li+/Li were consistent with the CV curve peaks of the naphthalene polyimide. These results confirm that the redox voltage of the polyimides is dependent on the active imide group and not on the PEO segments or their chain length.10,32 The initial discharge capacity was 165 mA h g−1, 81% of the theoretical value considering a two-electron process. After 50 cycles the electrode retains a capacity of 105 mA h g−1 with a coulombic efficiency ratio of 96% (Fig. 9).
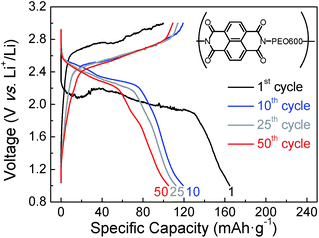 | ||
| Fig. 9 Voltage profile for naphthalene polyimide-b-PEO600 at different cycle numbers at 1Li+/5 h rate. | ||
Effect of the PEO chain length has been studied with the naphthalene polyimide that has shown the best performance. Results can be observed in Fig. 10 for samples naphthalene polyimide-b-PEO600, naphthalene polyimide-b-PEO900 and naphthalene polyimide-b-PEO2000 cycled at a current rate of 1Li+/5 h. Emphasis has to be given to the increasing capacity values with the molecular weight of the PEO. Low capacity fading was observed after cycle 6, discharge capacities remained constant with increasing cycle number. Discharge capacity of naphthalene polyimide-b-PEO600 in the 6th cycle was 127 mA h g−1, in the case of naphthalene polyimide-b-PEO900 it was 149 mA h g−1, whereas for naphthalene polyimide-b-PEO2000 it was 196 mA h g−1 (97% of the theoretical capacity for a two-electron reaction). Although high coulombic efficiency appeared in sample naphthalene polyimide-b-PEO900 (90%), it was very low for the other two samples naphthalene polyimide-b-PEO600 and naphthalene polyimide-b-PEO2000 (higher than 99%). Initial discharge capacities for naphthalene polyimide-b-PEO2000 were higher than the theoretical value calculated considering a two-electron reaction. Initial discharge capacity of 300 mA h g−1 in the first cycle suggested that three electrons might have been involved in the first discharge process. This is due to the low cut-off voltage (1 V vs. Li+/Li) used during cycling.31 Furthermore, the performance of the entire electrode is highly important regarding the practical use. Considering that only 10 wt% of the cathode correspond to the active material, imide groups, the entire PI–PEO/KB electrode showed a discharge capacity of 20 mA h g−1.
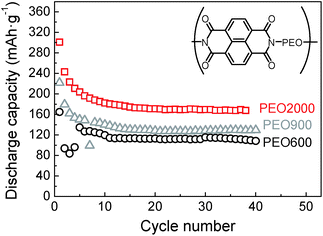 | ||
Fig. 10 Discharge capacities versus cycle number for naphthalene polyimide-b-PEO600 (○), naphthalene polyimide-b-PEO900 ( ) and naphthalene polyimide-b-PEO2000 ( ) and naphthalene polyimide-b-PEO2000 ( ) at 1Li+/5 h rate. ) at 1Li+/5 h rate. | ||
Polyimide–polyether block copolymers showed high cycling stability. Among all of them, naphthalene polyimide with the longest PEO chain, PEO2000, presented the best performance. A discharge capacity of approximately 170 mA h g−1 (84% of the theoretical capacity), based on the mass of the active material, was obtained at a discharge current density of 1Li+/5 h which corresponds to 0.1 C (1 C = 203 mA h g−1). On further increasing the C rate to 1Li+/1 h, a discharge capacity of 138 mA h g−1 was delivered, 81% of the one at 1Li+/5 h, showing a good rate performance (Fig. S1†). The average discharge plateaus of the electrode were 2.51 V and 2.37 V vs. Li/Li+. The charge and discharge voltage difference for both plateaus was 70 mV.
Conclusions
Polyimide–polyether block copolymers combined the intrinsic properties of both materials, redox activity of imide moieties as well as the ion conductivity of polyether blocks. The copolymers showed a microphase separation morphology as confirmed by AFM images. A bicontinuous morphology composed of rigid aromatic imide groups separated from soft polyether segments was observed.Solubility of the polyimide–polyether block copolymers in acetonitrile facilitated the electrode preparation. High capacity values were obtained with 15 wt% of carbon black. No binder was needed due to the ability of PI–PEO copolymers to form films.
Naphthalene polyimides showed higher discharge voltages, higher specific capacities as well as better cycling performance, compared to pyromellitic polyimides. The longest PEO blocks resulted in a better performance as electrodes. The naphthalene polyimide-b-PEO2000 presented a discharge capacity of 170 mA h g−1, based on the active mass, stable after 100 cycles at a current density of 1Li+/5 h.
Altogether the block copolymer strategy offers several advantages to engineer the polyimide electrodes in batteries. Advantages demonstrated in this work are: (1) facile solvent-based electrode processing due to the solubility of the block copolymers; (2) high performance electrodes without the use of additional binders and low conductive carbon contents (15 wt%).
Acknowledgements
We are grateful to the financial support of the European Research Council by Starting Grant Innovative Polymers for Energy Storage (iPes) 306250 and the Basque Government through ETORTEK Energigune 2013. Funding grant Aquitaine-Euskadi ANR-10-EQPX-16 XYLOFOREST is acknowledged for funding the AFM. Guiomar Hernández thanks Spanish Ministry of Education, Culture and Sport for the predoctoral FPU fellowship received to carry out this work.Notes and references
- J. M. Tarascon and M. Armand, Nature, 2001, 414, 359–367 CrossRef CAS PubMed.
- M. Armand and J. M. Tarascon, Nature, 2008, 451, 652–657 CrossRef CAS PubMed.
- T. Nokami, T. Matsuo, Y. Inatomi, N. Hojo, T. Tsukagoshi, H. Yoshizawa, A. Shimizu, H. Kuramoto, K. Komae, H. Tsuyama and J.-i. Yoshida, J. Am. Chem. Soc., 2012, 134, 19694–19700 CrossRef CAS PubMed.
- Y. Meng, H. Wu, Y. Zhang and Z. Wei, J. Mater. Chem. A, 2014, 2, 10842–10846 CAS.
- P. Sharma, D. Damien, K. Nagarajan, M. M. Shaijumon and M. Hariharan, J. Phys. Chem. Lett., 2013, 4, 3192–3197 CrossRef CAS.
- H. Wu, K. Wang, Y. Meng, K. Lu and Z. Wei, J. Mater. Chem. A, 2013, 1, 6366–6372 CAS.
- D. Jugović and D. Uskoković, J. Power Sources, 2009, 190, 538–544 CrossRef.
- L. Chen, W. Li, Y. Wang, C. Wang and Y. Xia, RSC Adv., 2014, 4, 25369–25373 RSC.
- Y. Liang, Z. Tao and J. Chen, Adv. Energy Mater., 2012, 2, 742–769 CrossRef CAS.
- Z. Song, H. Zhan and Y. Zhou, Angew. Chem., Int. Ed., 2010, 49, 8444–8448 CrossRef CAS PubMed.
- R. Gracia and D. Mecerreyes, Polym. Chem., 2013, 4, 2206–2214 RSC.
- T. Janoschka, M. D. Hager and U. S. Schubert, Adv. Mater., 2012, 24, 6397–6409 CrossRef CAS PubMed.
- K. Nakahara, K. Oyaizu and H. Nishide, Chem. Lett., 2011, 40, 222–227 CrossRef CAS.
- L. Zhan, Z. Song, J. Zhang, J. Tang, H. Zhan, Y. Zhou and C. Zhan, Electrochim. Acta, 2008, 53, 8319–8323 CrossRef CAS.
- L. Wang, X. He, W. Sun, J. Li, J. Gao, G. Tian, J. Wang and S. Fan, RSC Adv., 2013, 3, 3227–3231 RSC.
- A. G. Simmonds, J. J. Griebel, J. Park, K. R. Kim, W. J. Chung, V. P. Oleshko, J. Kim, E. T. Kim, R. S. Glass, C. L. Soles, Y.-E. Sung, K. Char and J. Pyun, ACS Macro Lett., 2014, 3, 229–232 CrossRef CAS.
- W. Deng, X. Liang, X. Wu, J. Qian, Y. Cao, X. Ai, J. Feng and H. Yang, Sci. Rep., 2013, 3, 2671 Search PubMed.
- A. Viehbeck, M. J. Goldberg and C. A. Kovac, J. Electrochem. Soc., 1990, 137, 1460–1466 CrossRef CAS.
- C. Michot, D. Baril and M. Armand, Sol. Energy Mater. Sol. Cells, 1995, 39, 289–299 CrossRef CAS.
- K. Oyaizu, A. Hatemata, W. Choi and H. Nishide, J. Mater. Chem., 2010, 20, 5404–5410 RSC.
- H. Wu, S. A. Shevlin, Q. Meng, W. Guo, Y. Meng, K. Lu, Z. Wei and Z. Guo, Adv. Mater., 2014, 26, 3338–3343 CrossRef CAS PubMed.
- X. Chevalier, C. Nicolet, R. Tiron, A. Gharbi, M. Argoud, J. Pradelles, M. Delalande, G. Cunge, G. Fleury, G. Hadziioannou and C. Navarro, J. Micro/Nanolithogr., MEMS, MOEMS, 2013, 12, 031102 CrossRef.
- J.-H. Choi, Y. Ye, Y. A. Elabd and K. I. Winey, Macromolecules, 2013, 46, 5290–5300 CrossRef CAS.
- C. Renaud, S.-J. Mougnier, E. Pavlopoulou, C. Brochon, G. Fleury, D. Deribew, G. Portale, E. Cloutet, S. Chambon, L. Vignau and G. Hadziioannou, Adv. Mater., 2012, 24, 2196–2201 CrossRef CAS PubMed.
- D. E. Fenton, J. M. Parker and P. V. Wright, Polymer, 1973, 14, 589 CrossRef CAS.
- D. T. Hallinan and N. P. Balsara, Annu. Rev. Mater. Res., 2013, 43, 503–525 CrossRef CAS.
- A. Tena, A. Marcos-Fernández, L. Palacio, P. Cuadrado, P. Prádanos, J. de Abajo, A. E. Lozano and A. Hernández, Ind. Eng. Chem. Res., 2012, 51, 3766–3775 CrossRef CAS.
- D. Djurado, J. P. Curtet, M. Bée, C. Michot and M. Armand, Electrochim. Acta, 2007, 53, 1497–1502 CrossRef CAS.
- S. V. Vinogradova, V. A. Vasnev and Y. S. Vygodskii, Russ. Chem. Rev., 1996, 65, 249 CrossRef.
- Y. Liang, P. Zhang and J. Chen, Chem. Sci., 2013, 4, 1330–1337 RSC.
- X. Han, C. Chang, L. Yuan, T. Sun and J. Sun, Adv. Mater., 2007, 19, 1616–1621 CrossRef CAS.
- H.-g. Wang, S. Yuan, D.-l. Ma, X.-l. Huang, F.-l. Meng and X.-b. Zhang, Adv. Energy Mater., 2014, 4, 1301651 Search PubMed.
Footnote |
| † Electronic supplementary information (ESI) available: Further electrochemical characterization. See DOI: 10.1039/c4ra15976d |
| This journal is © The Royal Society of Chemistry 2015 |

