DOI:
10.1039/C4AY02211D
(Paper)
Anal. Methods, 2015,
7, 353-358
A facile fluorescent probe based on anthraldehyde for trace Fe(III) ion determination in neutral aqueous solution
Received
22nd September 2014
, Accepted 14th November 2014
First published on 14th November 2014
Abstract
A flexible fluorescent probe for the determination of Fe(III) in aqueous solution was designed and synthesized by conjugating 4-aminoacetophenone into 9-anthraldehyde as a fluorophore. Its sensing behavior toward metal ions was investigated by fluorescence spectroscopy. The fluorescence intensity of the fluorescent probe decreased with the increasing concentration of Fe(III) when it was excited at λex/λem = 402/560 nm in water–ethanol (21.5/3.5, v/v) solutions at pH = 7.20. In addition, the calibration curve was linear in the concentration range of ca. 5 × 10⁻⁹ to 1 × 10⁻⁷ mol L−1. The prepared dye presented satisfactory sensitivity, and the detection limit could be as low as 3.04 × 10⁻¹⁰ mol L−1. The Fe(III)-selective quenching was insensitive to the presence of Cr(III), Cd(II), Cu(II), Co(II), Ni(II), Mn(II), Ba(II), Pb(II), Ca(II), Fe(II), Zn(II), Mg(II), and Al(III). The proposed method was successfully employed for preliminary application in natural water, domestic sewage, and human serum samples.
1. Introduction
Iron is widely distributed in nature and is one of the most important elements in biological systems and chemicals. It plays a pivotal role in vital biochemical activities such as oxygen sensing and transport, electron transfer, and catalysis;1 thus, iron is indispensable for life. The biological functions of iron are based on its chemical properties, e.g., its capacity to form a variety of coordination complexes with organic ligands in a dynamic and flexible mode and its favorable redox potential to switch between the ferrous and ferric states.2 However, if iron concentration exceeds the normal level, it may become be a potential health hazard. Iron deficiency leads to anemia, and iron homeostasis is an important factor involved in neuroinflammation and the progression of Alzheimer's disease.3,4 Therefore, the determination of trace levels of iron ions in clinical, medicinal, environmental, and different industrial samples is an important topic in environmental and biological analysis.
Numerous methods, such as high-pressure liquid chromatography (HPLC), spectrophotometry, electron spin resonance (ESR), and atomic absorption spectroscopy (AAS), have been developed for the measurement of metal ions. The procedures of these methods are often not sufficiently sensitive and may suffer from high costs associated with the instrument lifetime. Metal ion recognition and sensing via synthetic fluorescent receptors are of current interest in analytical chemistry due to the high sensitivity, rapid response, low cost, and easy monitoring of fluorescence methods.5–7
The design and synthesis of a sensitive and selective fluorescent probe is the most versatile and widespread approach for researchers. To date, the fluorescent indicators for Fe(III) have been the subject of a series of investigations.8–10 Several fluorophore-based probes, such as dansyl, rhodamine, anthracene, naphthyl, and nile blue, have been reported.11–15 The measurement mechanisms were mainly based on fluorescent enhancement and fluorescent quenching modes, which are obtained by employing photoinduced energy transfer, photoinduced electron transfer (PET), enhanced spin–orbit, and excited-state intramolecular proton transfer.16–19 Selective probes for Fe(III) in aqueous environments are relatively rare, because they are relatively easy to be chelated and detected in organic solvents but are rather difficult to recognize directly in aqueous environments due to their strong hydrations.20–23 More recently, Singh and coworkers developed a simple fluorescent sensor for Fe(III) based on the β-aminobisulfonate receptor.24 Zhang and coworkers prepared an asymmetric imidazole derivative as the fluorescent chemosensor for Fe(III) in aqueous solution.25 Lohani and coworkers reported a fluorescent Fe(III) sensor based on anthracene-appended amino acids.26 These probes for Fe(III) presented high selectivity, except for complex synthesis processes, and relatively high detection limits. Therefore, the development of practical fluorescent indicators for Fe(III) is still a challenge.
In the present work, a derivative of anthraldehyde, 1-(4-aminophenyl)-3-(anthracen-9-yl)-prop-2-en-1-on (AAPen) was synthesized and used as a fluorescence indicator owing to its favorable sensitivity to Fe(III). In the pH range from 4 to 9, the fluorescence intensity of the dye remained stable and the optimum pH value of 7.20 was adopted in the experiments. In addition, good linearity was observed for Fe(III) in the concentration range of ca. 5.0 × 10⁻⁹ to 1.0 × 10⁻⁷ mol L−1. The results show that the fluorescent probe displays a preferable selective and sensitive response of the fluorescent signal toward Fe(III) in neutral aqueous solution over other common metal ions.
2. Experimental section
2.1 Reagents and chemicals
9-Anthraldehyde, purchased from Changyu Chemicals (Jiangsu, China), was recrystallized twice from ethanol (m.p. 103–104 °C). 4-Aminoacetophenone was purchased from Qunli Reagent Co. (Shanghai, China). Cadmium nitrate (99%), aluminum sulfate (99%), zinc acetate (99%), barium chloride (99.5%), calcium chloride (96%), manganese sulfate (98%), cobalt nitrate (99%), lead acetate (99%), cupric sulfate (99%), ammonium ferrous sulfate (99%), ferric sulphate (99%), and chromium nitrate (99%) were purchased and used as received. Tris(hydroxymethyl)methylamine used in the preparation of buffer solutions (pH = 7.20) was of analytical reagent grade and used without further purification. Doubly distilled water was used throughout. Unless otherwise stated, all other reagents were of analytical reagent grade and used without purification or treatment.
2.2 Apparatus
All fluorescence measurements, collected through a 1 cm quartz cell, were carried out using a Perkin-Elmer LS-55 spectrofluorimeter with both excitation and emission (λex/λem = 402/560 nm) slits set at 10 nm and controlled by a personal computer data processing unit. The light source was a pulsed Xe lamp. The solution pH was measured by a pHS-3B pH meter from Shanghai Precision & Scientific Instrument Co. Ltd. (Shanghai, China), which was calibrated with standard buffers prior to usage. All measurements were performed at room temperature (25 ± 2 °C) and atmospheric pressure.
2.3 Preparation of buffer solutions
Britton–Robinson (B–R) buffer solutions of different pH were prepared by mixing appropriate amounts of phosphoric, acetic, and boric acids of the same concentration (0.040 mol L−1) and they were adjusted to the desired pH with 0.20 mol L−1 sodium hydroxide. Tris–HCl buffer solutions were prepared by titrating the solution of Tris with 0.10 mol L−1 hydrochloric acid (HCl) until the correct pH was reached.
2.4 Synthesis of 1-(4-aminophenyl)-3-(anthracen-9-yl)-prop-2-en-1-on (AAPen)
1-(4-Aminophenyl)-3-(anthracen-9-yl)-prop-2-en-1-one (AAPen) was easily synthesized by the reaction of 9-anthraldehyde with 4-aminoacetophenone and is shown schematically in Fig. 1. 9-Anthraldehyde (8.60 mmol, 1.57 g) was mixed with 4-aminoacetophenone (8.40 mmol, 1.00 g) in about 1![[thin space (1/6-em)]](https://www.rsc.org/images/entities/char_2009.gif) :
:![[thin space (1/6-em)]](https://www.rsc.org/images/entities/char_2009.gif) 1 molar ratio in a three-necked flask containing 70 mL methanol and added in a 40 mL solution of potassium hydroxide (1.00 g mL−1). The mixture was reacted at 40 °C for 48 h with magnetic stirring and then cooled to room temperature. A large amount of orange crystals were obtained. The crude product was recrystallized from ethanol, washed with doubly distilled water and dried to afford AAPen as an orange solid with a good yield of 80.0%; m.p.: 182–183 °C; HR-MS m/z: 323 (M+); 1H NMR δ (ppm): 4.277 (2H, –NH2), 6.706–6.727 (2H, –CH
1 molar ratio in a three-necked flask containing 70 mL methanol and added in a 40 mL solution of potassium hydroxide (1.00 g mL−1). The mixture was reacted at 40 °C for 48 h with magnetic stirring and then cooled to room temperature. A large amount of orange crystals were obtained. The crude product was recrystallized from ethanol, washed with doubly distilled water and dried to afford AAPen as an orange solid with a good yield of 80.0%; m.p.: 182–183 °C; HR-MS m/z: 323 (M+); 1H NMR δ (ppm): 4.277 (2H, –NH2), 6.706–6.727 (2H, –CH![[double bond, length as m-dash]](https://www.rsc.org/images/entities/char_e001.gif) CH–), 7.259–8.467 (13H, –anthracene and –benzene); 13C NMR δ (ppm): 113.24, 125.25, 125.43, 125.93, 126.97, 128.06, 129.18, 129.31, 130.81, 131.24, 131.71, 131.97, 138.10, 154.49, 185.70; elemental analysis: C23H17NO (323), calcd C, 85.45%; H, 5.26%; N, 4.33%; O, 4.95%; found C, 85.71%; H, 5.15%; N, 4.32%; O, 4.82%.
CH–), 7.259–8.467 (13H, –anthracene and –benzene); 13C NMR δ (ppm): 113.24, 125.25, 125.43, 125.93, 126.97, 128.06, 129.18, 129.31, 130.81, 131.24, 131.71, 131.97, 138.10, 154.49, 185.70; elemental analysis: C23H17NO (323), calcd C, 85.45%; H, 5.26%; N, 4.33%; O, 4.95%; found C, 85.71%; H, 5.15%; N, 4.32%; O, 4.82%.
 |
| | Fig. 1 Synthesis of 1-(4-aminophenyl)-3-(anthracen-9-yl)-prop-2-en-1-on (AAPen). | |
2.5 Standard stock solutions preparation
Stock solutions of fluorescent probe AAPen (0.0005 mol L−1, stored in refrigerator at 4 °C) and Fe(III) (0.1 mol L−1) were prepared. The stock solutions of other metal ions (0.1 mol L−1) were prepared by dissolving certain amount of metal salts in double distilled water and a certain amount of nitrate acid was added if necessary. These stock solutions were diluted further, whenever necessary, with buffer solution, and the pH was adjusted to the necessary value using HCl and NaOH.
The sample solutions with different metal ions and different concentrations of Fe(III) were freshly prepared prior to the measurement according to the following procedure. The working solutions were prepared in the following order: 2.5 mL of AAPen stock solution, 1.0 mL of ethanol, and a certain bulk volume of metal solution were added in a 25 mL volumetric flask by transfer pipettes. Tris–HCl buffer solution (pH = 7.20) was then added to the volumetric flask to the mark.
3. Results and discussion
3.1 Fluorescence response of AAPen to Fe(III)
The fluorescence emission spectra of the probe contacted with different concentrations of Fe(III) were recorded at λex = 402 nm and λem = 560 nm. As shown in Fig. 2, it can be observed that AAPen could be a sensitive Fe(III) probe (from 118 of blank to 47 with 1 × 10⁻⁴ mol L−1, 60% reduction). When the concentration of Fe(III) increased from 0 to 1.0 × 10⁻⁴ mol L−1, the fluorescence intensity of AAPen decreased significantly. The metal ions noticeably perturb the charge distribution of the fluorescent dye molecular and its fluorescence is strongly quenched as a result of the binding event, which constitutes the basis for the determination of Fe(III).
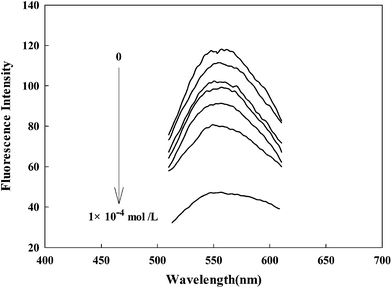 |
| | Fig. 2 Fluorescence emission spectra of AAPen upon the addition of different concentrations of Fe(III). Concentrations of Fe(III) from top to bottom: blank, 1.0 × 10⁻⁹, 1.0 × 10⁻⁸, 1.0 × 10⁻⁷, 1.0 × 10⁻⁶, 1.0 × 10⁻⁵, 1.0 × 10⁻⁴ mol L−1; water–ethanol, 21.5/3.5 (v/v); λex/λem = 402/560 nm; pH = 7.20, Tris–HCl buffer solution. | |
3.2 The principle of operation
Suppose a complexation equilibrium between Fe(III) (B) and AAPen (A) in the sample solution is established along with the formation of a complex with a complexing ratio of m![[thin space (1/6-em)]](https://www.rsc.org/images/entities/char_2009.gif) :
:![[thin space (1/6-em)]](https://www.rsc.org/images/entities/char_2009.gif) n, one has
n, one has| |  | (1) |
where k is the equilibrium constant of the reaction. The fluorescence intensity of a compound can be decreased by a variety of processes, including excited state reactions, energy transfer, complex formation, and collisional quenching. In many instances, the fluorophore can be quenched both by collisions and by complex formation with the same quencher.27 According to the modified Stern–Volmer equation,28 the relationships for the change of fluorescence intensities, the concentration of Fe(III) [B] and the total concentration of AAPen [A] can be expressed as follows:| |  | (2) |
Assuming ΔF = F0 − F, one can obtain
| |  | (3) |
where
F0 and
F denote the fluorescence intensities of AAPen in a blank solution and in the presence of Fe(
III), respectively. Evidently,
m is the slope of the plot of log(Δ
F/
F)
versus log[Fe(
III)], which was calculated to be 1.
The relative fluorescence intensity α can be experimentally determined by measuring the fluorescence intensity:
| |  | (4) |
where
F0 is the fluorescence intensity of AAPen in the blank solution,
Fb represents the fluorescence intensity when AAPen is completely complexed with Fe(
III) and
F is the fluorescence intensity of AAPen actually measured when in contact with different concentrations of Fe(
III). The relationship between
α and Fe(
III) concentration can be represented as
| |  | (5) |
The response of AAPen with different concentrations of Fe(III) is shown in Fig. 3. Three curves are calculated using eqn (4) with different m![[thin space (1/6-em)]](https://www.rsc.org/images/entities/char_2009.gif) :
:![[thin space (1/6-em)]](https://www.rsc.org/images/entities/char_2009.gif) n and K. It can be seen that the curve with a 1
n and K. It can be seen that the curve with a 1![[thin space (1/6-em)]](https://www.rsc.org/images/entities/char_2009.gif) :
:![[thin space (1/6-em)]](https://www.rsc.org/images/entities/char_2009.gif) 3 complex ratio and an appropriate K of 8.340 × 10¹³ fits best to the experimental data.
3 complex ratio and an appropriate K of 8.340 × 10¹³ fits best to the experimental data.
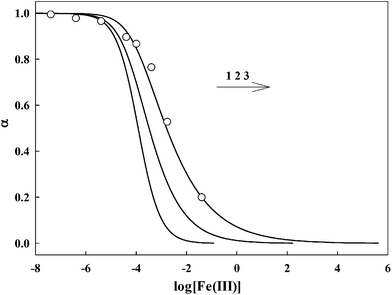 |
| | Fig. 3 Relative fluorescence intensity α as a function of logarithm metal ion concentration. The curves fitting the experimental data were calculated from eqn (5). The circles are experimentally observed data points. For Fe(III), 1. m![[thin space (1/6-em)]](https://www.rsc.org/images/entities/char_2009.gif) : :![[thin space (1/6-em)]](https://www.rsc.org/images/entities/char_2009.gif) n = 1 n = 1![[thin space (1/6-em)]](https://www.rsc.org/images/entities/char_2009.gif) : :![[thin space (1/6-em)]](https://www.rsc.org/images/entities/char_2009.gif) 1, K = 8.430 × 10³; 2. m 1, K = 8.430 × 10³; 2. m![[thin space (1/6-em)]](https://www.rsc.org/images/entities/char_2009.gif) : :![[thin space (1/6-em)]](https://www.rsc.org/images/entities/char_2009.gif) n = 1 n = 1![[thin space (1/6-em)]](https://www.rsc.org/images/entities/char_2009.gif) : :![[thin space (1/6-em)]](https://www.rsc.org/images/entities/char_2009.gif) 2, K = 3.105 × 10⁸; 3. m 2, K = 3.105 × 10⁸; 3. m![[thin space (1/6-em)]](https://www.rsc.org/images/entities/char_2009.gif) : :![[thin space (1/6-em)]](https://www.rsc.org/images/entities/char_2009.gif) n = 1 n = 1![[thin space (1/6-em)]](https://www.rsc.org/images/entities/char_2009.gif) : :![[thin space (1/6-em)]](https://www.rsc.org/images/entities/char_2009.gif) 3, K = 8.340 × 10¹³. 3, K = 8.340 × 10¹³. | |
3.3 The effect of pH
Fluorescent probes are usually affected by the pH of the media in the detection of metal ions; therefore, the influence of an operative pH value upon the sensitivities of the fluorescent probe is extremely important.29 A preliminary study showed that the fluorescent probe AAPen was affected by the hydrogen ion concentration. The pH was adjusted using B–R buffer solutions in the range from 1.00 to 13.00; outside the range, the pH was adjusted by the addition of HCl or NaOH. The results are shown in Fig. 4A and indicate that the fluorescence intensity initially increased from pH = 1.00 to pH = 4.00, and then stay comparatively steady between 4 and 9, but then slightly ascend from pH = 9.00 to pH = 14.00. The mechanism of the change of the fluorescence intensity may be that the protonation of AAPen switches off the ICT effect, and a strong fluorescence was released and the florescence intensity thus significantly increased. Hence, all of the measurements were carried out at pH = 7.20 considering the practical use of the probe.
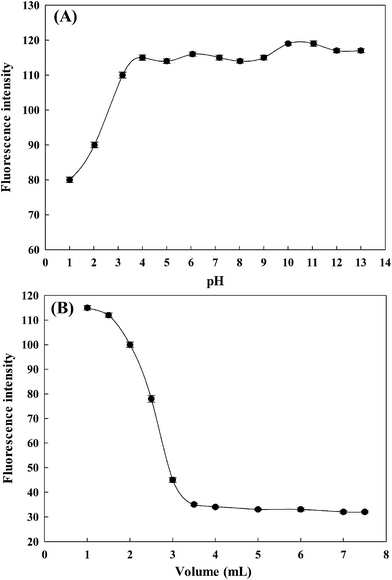 |
| | Fig. 4 The effects of pH (A) and ethanol content (B). Each data point was the mean of three measurements. The error bars are the standard deviation. | |
3.4 The effect of ethanol content
To have a more optimized condition for the signaling of Fe(III), the effect of the ethanol content on the fluorescence intensity was surveyed. The results are shown in Fig. 4B. The fluorescence enhancements induced by the addition of ethanol were very sharp at an ethanol content of 3/25–1/25, but mild at the ethanol content greater than 3/25 (v/v). On the basis of this, all the fluorescence signaling experiments were carried out using a water–ethanol solution of 21.5/3.5 (v/v, including adding 2.5 mL stock solution of AAPen) and buffered at pH = 7.20 with a Tris–HCl buffer solution.
3.5 Quantification and detection limit
Fig. 5 shows the calibration curve of AAPen for different concentrations of Fe(III). In the range of 5.0 × 10⁻⁹ to 1.0 × 10⁻⁷ mol L−1, the fluorescence intensity is linearly dependent on the Fe(III) ion concentration. The dependency can be described by the following equation:| | | y = −1.64x + 0.93 (R = 0.9986) | (6) |
where y is the ratio of FFe/F0, F0 is the fluorescence intensity of AAPen in the blank solution, FFe represents the fluorescence intensity when AAPen is in contact with Fe(III) and x is the concentration of Fe(III). This calibration equation can serve as the quantitative basis for the determination of the trace concentrations of Fe(III). The detection limit is about 3.04 × 10⁻¹⁰ mol L−1. The relative standard deviation for the metal concentration from the calibration curve was less than 0.39%.
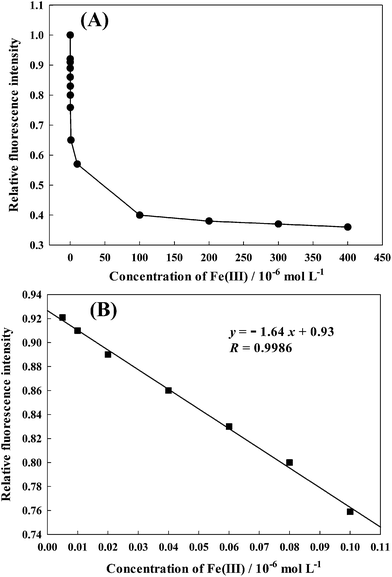 |
| | Fig. 5 (A) The relative fluorescence intensity as a function of the concentration of Fe(III). (B) The linear region of panel A. | |
3.6 The selectivity of the proposed probe
The experiments were carried out by recording the change of the fluorescence intensity of different metal ions solutions with a blank solution. To realize the practical utility of AAPen as an ion-selective fluorescence probe for Fe(III), two control experiments were conducted to evaluate the selectivity of the fluorescent probe for Fe(III). Firstly, experiments were conducted by comparing the relative fluorescence intensity of AAPen at 5.0 × 10⁻⁵ mol L−1 mixed with Fe(III), Cr(III), Cd(II), Cu(II), Co(II), Ni(II), Mn(II), Ba(II), Pb(II), Ca(II), Fe(II), Zn(II), Mg(II), or Al(III) at 1.0 × 10⁻⁴ mol L−1. Secondly, Fe(III) and the other metal ions were mixed as one sample for the selectivity experiment. As shown in Fig. 6A, only the samples that include Fe(III) result in a remarkable decrease and the other metal ions did not lead to a noticeable change in the fluorescence intensity when excited at 402 nm. Even so, AAPen can also respond to the Fe(II) to some extent, as seen from Fig. 6A. Hence, to further investigate the selectivity of the probe for Fe(III) at low concentrations, selectivity experiments of Fe(III) and Fe(II) at the concentrations of 1.0 × 10⁻⁶, 1.0 × 10⁻⁷, and 1.0 × 10⁻⁸ mol L−1 were performed. The results are shown in Fig. 6B and indicate that the probe also presents good selectivity at low concentrations. From the above mentioned results, we could see that the selectivity of the proposed fluorescent probe was satisfactory.
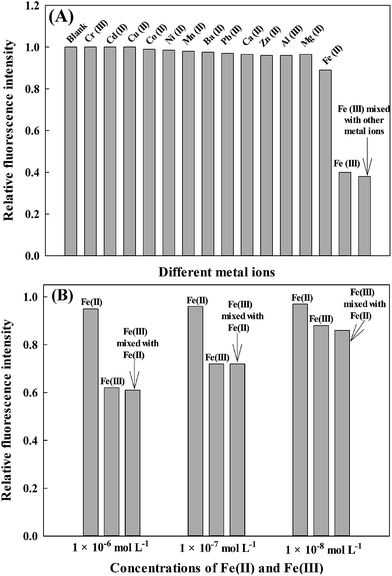 |
| | Fig. 6 (A) Fluorescent quenching of AAPen in the presence of different metal ions. The concentrations of the metal ions [Fe(III), Cr(III), Cd(II), Cu(II), Co(II), Ni(II), Mn(II), Ba(II), Pb(II), Ca(II), Zn(II), Mg(II), Fe(II) and Al(III)] were all 1.0 × 10⁻⁴ mol L−1; (B) fluorescent quenching of AAPen in the presence of different low concentrations of Fe(II), Fe(III), or the mixture of Fe(II) and Fe(III). The concentrations of Fe(II) or Fe(III) are 1.0 × 10⁻⁶, 1.0 × 10⁻⁷, and 1.0 × 10⁻⁸ mol L−1. The concentration of the probe is 5.0 × 10⁻⁵ mol L−1; Tris–HCl buffer solution, pH = 7.20; water–ethanol, 21.5/3.5 (v/v). | |
3.7 The preliminary application of the probe
First, the recovery of Fe(III) from natural water and domestic sewage were studied with the proposed fluorescent probe. The domestic sewage samples were firstly centrifuged and filtrated. All the sample solutions were diluted with Tris–HCl buffer solution, pH = 7.20. Fluorescence measurements of the sample solutions were taken after the addition of 1.0 mL of ethanol and 2.5 mL of AAPen stock solution into 25 mL volumetric flasks. The recovery and relative standard deviation (RSD) values of the samples are shown in Table 1. From Table 1, we can see that the recovery study of Fe(III) determined by the AAPen-based indicator shows satisfactory results.
Table 1 Results from the recovery experiments
| Sample |
Added (mol L−1) |
Founda (mol L−1) |
Recovery (%) |
RSDb (%) |
|
Mean values from three determinations.
Relative standard deviation from three determinations.
|
| Fe(III) in natural water |
1.0 × 10⁻⁶ |
1.04 × 10⁻⁶ |
104.0 |
3.76 |
| 1.0 × 10⁻⁷ |
1.08 × 10⁻⁷ |
108.0 |
5.95 |
| 1.0 × 10⁻⁸ |
0.98 × 10⁻⁸ |
98.0 |
6.19 |
| Fe(III) in domestic sewage |
1.0 × 10⁻⁶ |
0.97 × 10⁻⁶ |
97.0 |
3.09 |
| 1.0 × 10⁻⁷ |
1.05 × 10⁻⁷ |
105.0 |
6.81 |
| 1.0 × 10⁻⁸ |
0.95 × 10⁻⁸ |
95.0 |
2.98 |
Second, to further test the practical application of the probe for Fe(III), three types of human serum samples were tested using the proposed method and atomic absorption spectrophotometry (AAS). Serum is the substance that remains after coagulation of whole blood. Its chemical composition is similar to plasma, but it does not contain coagulation proteins, such as thrombin, or other compositions. The human serum samples were digested firstly and then diluted to the appropriate concentration before the experiments. The results are summarized in Table 2. The results obtained using the proposed probe were in good agreement with those observed by AAS. These results indicate that the present probe is acceptable for Fe(III) determination in real samples.
Table 2 Determination of Fe(III) in human serum using the proposed method and AAS
| Samples |
Proposed method (meana ± SDb) (mol L−1) |
AAS (mean ± SD) (mol L−1) |
|
Mean values from three determinations.
Relative standard deviation from three determinations.
|
| No. 1 |
(1.55 ± 0.17) × 10−8 |
(1.51 ± 0.07) × 10−8 |
| No. 2 |
(1.87 ± 0.21) × 10−8 |
(1.85 ± 0.10) × 10−8 |
| No. 3 |
(2.29 ± 0.24) × 10−8 |
(2.25 ± 0.12) × 10−8 |
4. Conclusions
A simple fluorescent dye AAPen for the recognition of Fe(III) was designed and easily synthesized. It displays satisfactory selectivity and sensitivity for Fe(III) by fluorescence quenching in neutral aqueous solution. The prepared probe shows a good detection limit, which is sufficiently low to allow the detection of sub-millimolar concentrations of Fe(III). Work is underway to construct fluorescent probes based on AAPen suitable for the measurements of other metal ions.
Acknowledgements
This work was financially supported by the Hunan Provincial Environmental Science Foundation of China (14JJ2045), the Scientific Research Fund of Hunan Provincial Education Department (13k017), and the National Natural Science Foundation of China (51408206). We sincerely thank Xiaoxiao Lv of Hunan University for the kind assistance in the process of revision. We also acknowledge the recommendations of the editor and reviewers on this paper.
Notes and references
-
N. N. Greenwood and A. Earnshaw, Chemistry of the Elements, Pergamon Press, Oxford, 1984, p. 1071 Search PubMed.
- G. Papanikolaou and K. Pantopoulos, Pharmacology, 2005, 202, 199 CAS.
- J. T. Rogers, A. I. Bush, H. H. Cho and D. H. Smith, Biochem. Soc. Trans., 2008, 36, 1282 CrossRef CAS PubMed.
- L. Silvestri and C. J. Camaschella, J. Cell. Mol. Med., 2008, 12, 1548 CrossRef CAS PubMed.
- W. Qin, Z. J. Zhang and F. C. Wang, Fresenius' J. Anal. Chem., 1998, 360, 130 CrossRef CAS.
- J. M. T. Carneiro, A. C. B. Dias, E. A. G. Zagatto and R. S. Honorato, Anal. Chim. Acta, 2002, 455, 327 CrossRef CAS.
- A. Safavi, H. Abdollahi and M. R. Hormozi-Nezhad, Talanta, 2002, 56, 699 CrossRef CAS.
- J. M. Liu, Q. Y. Zheng, J. L. Yang, C. F. Chen and Z. T. Huang, Tetrahedron Lett., 2002, 9209 CrossRef CAS.
- X. B. Zhang, G. Cheng, W. J. Zhang, G. L. Shen and R. Q. Yu, Talanta, 2007, 71, 171 CrossRef CAS PubMed.
- O. Oter, K. Ertekin, C. Kirilmis, M. Koca and M. Ahmedzade, Sens. Actuators, B, 2007, 122, 450 CrossRef CAS PubMed.
- S. Deo and A. G. J. Goldwin, J. Am. Chem. Soc., 2000, 122, 174 CrossRef CAS.
- X. Chen, S. W. Nam, Y. Kim, S. J. Kim, S. Park and J. Yoon, Org. Lett., 2008, 10, 5235 CrossRef CAS PubMed.
- Z. C. Xu, S. K. Kim, K. H. Lee and J. Y. Yoon, Tetrahedron Lett., 2007, 48, 3797 CrossRef CAS PubMed.
- M. H. Lee, S. W. Lee, S. H. Kim, C. Kang and J. S. Kim, Org. Lett., 2009, 11, 2101 CrossRef CAS PubMed.
- K. J. Parker, S. Kumar, D. A. Pearce and A. J. Sutherland, Tetrahedron Lett., 2005, 46, 7043 CrossRef CAS PubMed.
- D. S. McClure, J. Chem. Phys., 1952, 20, 682 CrossRef CAS PubMed.
- A. W. Varnes, R. B. E. L. Dodson and J. Wehry, J. Am. Chem. Soc., 1972, 94, 946 CrossRef CAS.
- B. Valeur and I. Leray, Coord. Chem. Rev., 2000, 205, 3 CrossRef CAS.
- G. Klein and D. Kaufmann, Chem. Commun., 2001, 561 RSC.
- A. W. Czarnik, Chem. Biol., 1995, 2, 423 CrossRef CAS.
- R. Kramer, Angew. Chem., Int. Ed., 1998, 37, 772 CrossRef CAS.
- K. Rurack, M. Kollmannsberger, U. Resch-Genger and J. Daub, J. Am. Chem. Soc., 2000, 122, 968 CrossRef CAS.
- X. F. Guo, X. H. Qian and L. H. Jia, J. Am. Chem. Soc., 2004, 126, 2272 CrossRef CAS PubMed.
- N. Singh, N. Kaur and J. Dunn, Tetrahedron Lett., 2009, 50, 953 CrossRef CAS PubMed.
- H. M. Zhang, W. F. Fu and S. M. Chi, J. Lumin., 2009, 129, 589 CrossRef CAS PubMed.
- C. R. Lohani, J. M. Kim and K. H. Lee, Bioorg. Med. Chem. Lett., 2009, 19, 6069 CrossRef CAS PubMed.
-
J. R. Lakowicz, Principles of fluorescence spectroscopy, Plenum Press, New York, 1983, p. 303 Search PubMed.
- W. H. Liu, Y. Wang, J. H. Tang, G. L. Shen and R. Q. Yu, Talanta, 1998, 46, 679 CrossRef CAS.
- N. R. Cha, M. Y. Kim, Y. H. Kim, J. I. Choe and S. K. Chang, J. Am. Chem. Soc., 2002, 2, 1193 Search PubMed.
|
| This journal is © The Royal Society of Chemistry 2015 |
Click here to see how this site uses Cookies. View our privacy policy here. ![[thin space (1/6-em)]](https://www.rsc.org/images/entities/char_2009.gif) :
:![[thin space (1/6-em)]](https://www.rsc.org/images/entities/char_2009.gif) 1 molar ratio in a three-necked flask containing 70 mL methanol and added in a 40 mL solution of potassium hydroxide (1.00 g mL−1). The mixture was reacted at 40 °C for 48 h with magnetic stirring and then cooled to room temperature. A large amount of orange crystals were obtained. The crude product was recrystallized from ethanol, washed with doubly distilled water and dried to afford AAPen as an orange solid with a good yield of 80.0%; m.p.: 182–183 °C; HR-MS m/z: 323 (M+); 1H NMR δ (ppm): 4.277 (2H, –NH2), 6.706–6.727 (2H, –CH
1 molar ratio in a three-necked flask containing 70 mL methanol and added in a 40 mL solution of potassium hydroxide (1.00 g mL−1). The mixture was reacted at 40 °C for 48 h with magnetic stirring and then cooled to room temperature. A large amount of orange crystals were obtained. The crude product was recrystallized from ethanol, washed with doubly distilled water and dried to afford AAPen as an orange solid with a good yield of 80.0%; m.p.: 182–183 °C; HR-MS m/z: 323 (M+); 1H NMR δ (ppm): 4.277 (2H, –NH2), 6.706–6.727 (2H, –CH![[double bond, length as m-dash]](https://www.rsc.org/images/entities/char_e001.gif) CH–), 7.259–8.467 (13H, –anthracene and –benzene); 13C NMR δ (ppm): 113.24, 125.25, 125.43, 125.93, 126.97, 128.06, 129.18, 129.31, 130.81, 131.24, 131.71, 131.97, 138.10, 154.49, 185.70; elemental analysis: C23H17NO (323), calcd C, 85.45%; H, 5.26%; N, 4.33%; O, 4.95%; found C, 85.71%; H, 5.15%; N, 4.32%; O, 4.82%.
CH–), 7.259–8.467 (13H, –anthracene and –benzene); 13C NMR δ (ppm): 113.24, 125.25, 125.43, 125.93, 126.97, 128.06, 129.18, 129.31, 130.81, 131.24, 131.71, 131.97, 138.10, 154.49, 185.70; elemental analysis: C23H17NO (323), calcd C, 85.45%; H, 5.26%; N, 4.33%; O, 4.95%; found C, 85.71%; H, 5.15%; N, 4.32%; O, 4.82%.
![[thin space (1/6-em)]](https://www.rsc.org/images/entities/char_2009.gif) :
:![[thin space (1/6-em)]](https://www.rsc.org/images/entities/char_2009.gif) n, one has
n, one has


![[thin space (1/6-em)]](https://www.rsc.org/images/entities/char_2009.gif) :
:![[thin space (1/6-em)]](https://www.rsc.org/images/entities/char_2009.gif) n and K. It can be seen that the curve with a 1
n and K. It can be seen that the curve with a 1![[thin space (1/6-em)]](https://www.rsc.org/images/entities/char_2009.gif) :
:![[thin space (1/6-em)]](https://www.rsc.org/images/entities/char_2009.gif) 3 complex ratio and an appropriate K of 8.340 × 10¹³ fits best to the experimental data.
3 complex ratio and an appropriate K of 8.340 × 10¹³ fits best to the experimental data.
![[thin space (1/6-em)]](https://www.rsc.org/images/entities/char_2009.gif) :
:![[thin space (1/6-em)]](https://www.rsc.org/images/entities/char_2009.gif) n = 1
n = 1![[thin space (1/6-em)]](https://www.rsc.org/images/entities/char_2009.gif) :
:![[thin space (1/6-em)]](https://www.rsc.org/images/entities/char_2009.gif) 1, K = 8.430 × 10³; 2. m
1, K = 8.430 × 10³; 2. m![[thin space (1/6-em)]](https://www.rsc.org/images/entities/char_2009.gif) :
:![[thin space (1/6-em)]](https://www.rsc.org/images/entities/char_2009.gif) n = 1
n = 1![[thin space (1/6-em)]](https://www.rsc.org/images/entities/char_2009.gif) :
:![[thin space (1/6-em)]](https://www.rsc.org/images/entities/char_2009.gif) 2, K = 3.105 × 10⁸; 3. m
2, K = 3.105 × 10⁸; 3. m![[thin space (1/6-em)]](https://www.rsc.org/images/entities/char_2009.gif) :
:![[thin space (1/6-em)]](https://www.rsc.org/images/entities/char_2009.gif) n = 1
n = 1![[thin space (1/6-em)]](https://www.rsc.org/images/entities/char_2009.gif) :
:![[thin space (1/6-em)]](https://www.rsc.org/images/entities/char_2009.gif) 3, K = 8.340 × 10¹³.
3, K = 8.340 × 10¹³.


