Preparation of Ru-doped TiO2 nanotube arrays through anodizing TiRu alloys for bifunctional HER/OER electrocatalysts†
Yuejiao
Liu
,
Xixin
Wang
,
Mengyao
Yang
,
Ying
Li
,
Yue
Xiao
and
Jianling
Zhao
 *
*
School of Materials Science and Engineering, Hebei University of Technology, Tianjin 300130, China. E-mail: hebutzhaoj@126.com; Tel: +86-22-60204525
First published on 31st October 2023
Abstract
In this research, Ru-doped TiO2 nanotube arrays (Ru-TNTA) were prepared by anodizing TiRu alloys, and the effects of annealing temperature, Ru content and test temperature on their performances for the hydrogen evolution reaction (HER) and the oxygen evolution reaction (OER) were investigated. The results show that the unannealed Ru-TNTA (a-Ru-TNTA) exhibits superior activity for the HER, and the Ru-TNTA annealed at 450 °C (c-Ru-TNTA) shows excellent activity for the OER. The Ru content of TiRu impacts the electrochemically active surface area (ECSA) and the charge transfer resistance (Rct) significantly. When the Ru content of Ru-TNTA is 6%, its performance is optimal. Moreover, the electrocatalytic activity of Ru-TNTA improves with increasing test temperature, and the overpotentials of a-Ru-TNTA and c-Ru-TNTA at 80 °C are 19 mV and 227 mV (10 mA cm−2), respectively. Ru-TNTA exhibits excellent electrocatalytic performance for water splitting and good stability, which provides a new idea for the preparation of advanced bifunctional electrocatalysts for water splitting.
1. Introduction
Hydrogen energy is considered as a clean renewable energy source with high energy density.1–5 Among the various methods of hydrogen production, water electrolysis has the advantages4,6 of mature technology, simple equipment, high purity of hydrogen, green pollution-free nature and so on. The electrochemical reactions involved include the hydrogen evolution reaction (HER) at the cathode and the oxygen evolution reaction (OER) at the anode.7,8 The HER is a two-electron reaction and the OER is a four-electron reaction.9,10 These two reactions possess a high overpotential and high energy consumption, which is not conducive to efficient and rapid water electrolysis.11 To improve the utilization rate of electrical energy in water electrolysis, researchers have focused on reducing the overpotential through the use of catalysts. At present, the most advanced electrocatalysts are platinum (Pt), iridium oxide (IrO2) and ruthenium oxide (RuO2).12–14 RuO2 is a bifunctional catalyst that is much cheaper than Pt and IrO2, but still has a higher cost and poor stability, which limits its large-scale application.Studies have shown that combining RuO2 with other substances or loading it on a certain carrier can not only reduce costs, but also improve stability. For example, Edison et al. prepared carbon encapsulated RuO2 nanorods (RuO2 NRs/C) with an onset overpotential of 99 mV and a Tafel slope of 99.4 mV dec−1 for the HER, which is a highly stable HER electrocatalyst.15 Liu et al. loaded RuO2 nanoparticles on MoS2 nanosheets to form an efficient and stable electrocatalyst, and it had a low overpotential of 114 mV at a current density of 10 mA cm−2 in 1 M KOH.16 Lim et al. prepared RuO2/SnO2 electrocatalysts by coating RuO2 on SnO2 support to reduce the cost and enhance the stability of the RuO2 catalyst. RuO2/SnO2 had high OER electrochemical activity and could reduce the noble metal content by about 50%.17 Lu et al. proved that RuO2-modified Co3O4 can effectively accelerate the OER kinetics of Co3O4 in a neutral electrolyte, showing excellent OER activity and stability.18
Titanium oxide (TiO2) has the advantages of rich resources, environmental friendliness and strong stability, and the performance of RuO2 can also be improved by combining it with TiO2. For example, Ouyang et al. synthesized a RuO2 nanoparticle-decorated TiO2 nanobelt array supported on a titanium plate by hydrothermal growth, cation exchange and subsequent annealing, which exhibited excellent catalytic performance and high stability for the HER at all pH values.19 Li et al. prepared TiO2 through in situ fabrication on Ti mesh (TM) and then combined it with defective RuO2 nanoparticles (D-RuO2) to obtain a D-RuO2/TiO2/TM catalyst. This catalyst showed excellent catalytic activity and superior durability for the HER and OER in 1 M KOH.20 Naslund et al. prepared TiO2-doped RuO2 electrodes for the water oxidation reaction, which showed excellent electrocatalytic activity and durability. The interaction between Ti and Ru played an important role in enhancing the OER activity on the mixed oxide electrodes.21
The morphological structure of TiO2 has a significant effect on electrode performance. TiO2 nanotube arrays (TNTA) grown in situ on the surface of titanium sheets by anodic oxidation have a large specific surface area and a large number of active sites. These nanotubes are highly ordered and perpendicular to the substrate, providing a smooth channel for ion transport. Meanwhile, TNTA is tightly bound to the Ti substrate and has low resistance. Therefore, TNTA-based electrodes display excellent performance and have been widely used in photocatalysis,22,23 sensors24,25 and solar cells.26–28
At present, most of the prepared ruthenium–titanium composite oxides are powder materials. When they are bonded to collectors (e.g. nickel foam) using a binder to construct electrodes, the prepared electrodes have a large internal resistance and poor stability. Thus, in this work, to obtain RuO2 electrodes with better performance, Ru-TNTA electrodes were prepared by anodizing TiRu alloys and the performance of Ru-TNTA electrodes for the HER and OER was investigated. The overpotential of the optimized Ru-TNTA for the HER and OER is 41 and 349 mV, respectively (10 mA cm−2), and the Tafel slope is 67 and 94 mV dec−1, respectively. The overall water splitting voltage of the two-electrode electrolytic cell constructed with Ru-TNTA is only 1.496 V at a current density of 10 mA cm−2, which also shows remarkable long-term electrochemical durability.
2. Experimental
2.1. Preparation of electrodes
A 40 mm × 20 mm × 2 mm TiRu sheet (the atomic ratio of Ru is 6.0%) was ultrasonically cleaned in a mixture of deionized water and ethanol. Using a cleaned TiRu sheet as the anode, a Pt sheet as the cathode, and glycol solution containing 0.25% NH4F and 10% H2O as the electrolyte, the anodic oxidation reaction was carried out at 40 °C and 40 V for 3 h. After anodization, the sample was taken out, washed with deionized water and air-dried to obtain Ru-doped TiO2 nanotube arrays (denoted as Ru-TNTA).For comparison, TiO2 nanotube arrays (TNTA) were prepared by anodizing the Ti sheet at 25 V while keeping the other conditions the same as above.
2.2. Characterization
Scanning electron microscopy (SEM, Quanta 450 FEG) and transmission electron microscopy (TEM, JEOL JEM-2100F) were used to analyze the morphological structures of the samples. An X-ray diffractometer (XRD, D8 Discover) and an X-ray photoelectron spectrometer (XPS, ESCALAB-250Xi) were employed to analyze the elemental composition and valence states of the samples.2.3. Electrochemical measurements
All electrochemical measurements were carried out in a typical three-electrode system using an electrochemical workstation (CHI 660e, Chenhua, Shanghai). Linear sweep voltammetry (LSV) tests were performed with Ru-TNTA as the working electrode (test area: 4 cm2), a SCE as the reference electrode and a Pt sheet as the counter electrode at a scan rate of 2 mV s−1 in 1 mol L−1 KOH. The polarization curves were converted to reversible hydrogen electrode potentials using the equation ERHE = ESCE + 0.2415 + 0.059 × pH and calibrated using 95% IR compensation. The Tafel plots were obtained by fitting the logarithmic equation of overpotential vs. current density in the polarization curve (η = a + b![[thin space (1/6-em)]](https://www.rsc.org/images/entities/char_2009.gif) log
log![[thin space (1/6-em)]](https://www.rsc.org/images/entities/char_2009.gif) j), where η represents the overpotential, a is the Tafel constant, b is the Tafel slope, and j is the current density. Electrochemical impedance spectroscopy (EIS) was performed in the frequency range from 1000 kHz to 0.01 Hz. The electrochemically active surface area (ECSA) was calculated from the electrical double-layer capacitance (Cdl) using the formula ECSA = Cdl/Cs, where Cs is the ideal specific capacitance of a smooth planar electrode and the general value in alkaline media is 0.04 mF cm−2.29–32 The long-term stability of the catalyst was tested by chronoamperometry.
j), where η represents the overpotential, a is the Tafel constant, b is the Tafel slope, and j is the current density. Electrochemical impedance spectroscopy (EIS) was performed in the frequency range from 1000 kHz to 0.01 Hz. The electrochemically active surface area (ECSA) was calculated from the electrical double-layer capacitance (Cdl) using the formula ECSA = Cdl/Cs, where Cs is the ideal specific capacitance of a smooth planar electrode and the general value in alkaline media is 0.04 mF cm−2.29–32 The long-term stability of the catalyst was tested by chronoamperometry.
For comparison with the commercial electrode materials, Pt/C and IrO2 powders were bought from Beijing Mreda Technology Co., Ltd and the corresponding electrodes were prepared as follows and tested similarly. 5 mg of catalyst powder (20 wt% Pt/C or IrO2) was dispersed in a mixed solution of 350 μL of isopropanol, 150 μL of deionized water and 10 μL of 0.5% Nafion, and a uniform dispersion similar to an ink was obtained after ultrasonic treatment for 1 h. The dispersion was dropped onto a clean TiRu sheet and dried at room temperature to produce a working electrode of the HER (OER).
3. Results and discussion
3.1. Morphology and structure of Ru-TNTA
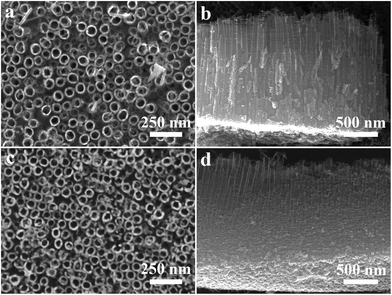
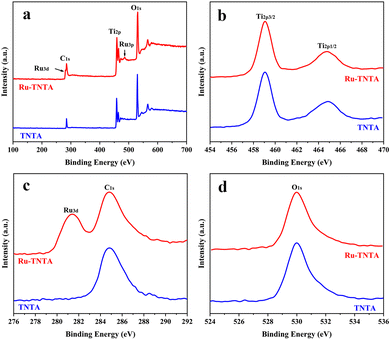
SEM images of TNTA and Ru-TNTA are shown in Fig. 1. The nanotubes of TNTA are tightly arranged with an outer diameter of about 80 nm (Fig. 1a) and a tube length of about 1586 nm (Fig. 1b). A similar morphology can be observed in Ru-TNTA, where the nanotubes are more tightly bound, but the tube mouths become slightly rougher. The outer diameter and tube length are about 77 nm (Fig. 1c) and 1602 nm (Fig. 1d), respectively. The results in Fig. 1 demonstrate that Ru-TNTA and TNTA have similar tube diameters and lengths.Fig. 2 shows the XPS spectra of TNTA and Ru-TNTA. As shown in Fig. 2a, in addition to the C1s peak located at around 285.0 eV, Ti, O and Ru elements can be observed in Ru-TNTA, while only Ti and O elements are found in TNTA. Two peaks at 459.0 eV and 464.8 eV in the Ti2p XPS spectra (Fig. 2b) are assigned to Ti2p3/2 and Ti2p1/2, respectively. The peak spacing between Ti2p3/2 and Ti2p1/2 is 5.8 eV, revealing that the valence state of Ti element is +4.20,33–35 In Fig. 2c, the Ru3d peak is located at 281.4 eV, which indicates that Ru in Ru-TNTA is Ru4+.33,36Fig. 2d shows that the O1s peaks of both TNTA and Ru-TNTA are located at 529.9 eV, suggesting that Ti and Ru in TNTA and Ru-TNTA exist in the form of TiO2 and RuO2. In addition, XPS analysis of the annealed Ru-TNTA was conducted and the results do not change significantly compared with those of the unannealed Ru-TNTA.
Fig. 3 shows the EDS elemental mapping of the Ti, O and Ru elements of Ru-TNTA. It can be seen that the content of Ru is obviously lower than those of Ti and O, and these elements have a substantially uniform distribution in the nanotubes.
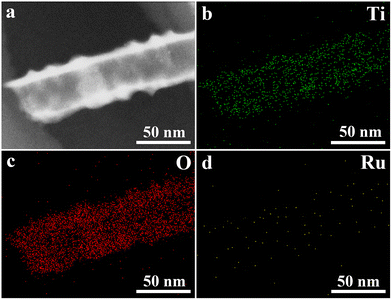 | ||
| Fig. 3 EDS elemental mapping images of Ru-TNTA (a: TEM image of the scanned area, b: Ti, c: O, and d: Ru). | ||
The XRD spectra of TNTA and Ru-TNTA are shown in Fig. 4. The diffraction peaks of unannealed TNTA are located at 35.28°, 38.59°, 40.35°, 53.16°, 63.11°, 70.81°, 76.34° and 77.48°, corresponding to the (100), (002), (101), (102), (110), (103), (112) and (201) crystal planes of the Ti substrate (JCPDF#44-1294), respectively. The oxide diffraction peak does not appear, indicating that TiO2 has an amorphous structure. No diffraction peaks of oxides can be found in TNTA annealed at 250 °C, which demonstrates that TiO2 still has the amorphous structure. When the annealing temperature is increased to 450 °C, the characterized diffraction peaks of oxides at 25.42°, 37.06°, 37.95°, 48.21°, 54.02°, 55.20°, 68.97° and 75.23° are attributed to the (101), (103), (004), (200), (105), (211), (116) and (215) crystal planes of anatase TiO2 (JCPDF#21-1272), respectively. A new diffraction peak at 27.56° is observed when the annealing temperature is increased to 600 °C, corresponding to rutile TiO2 (JCPDF#21-1276), indicating that a part of TiO2 is transformed from the anatase phase to the rutile phase as shown in Fig. 4a.
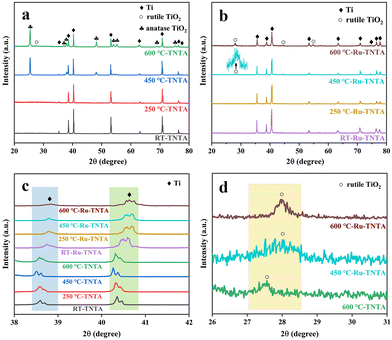 | ||
| Fig. 4 XRD patterns of TNTA (a) and Ru-TNTA (b) and comparison of the XRD patterns of TNTA and Ru-TNTA (c and d) annealed at different temperatures. | ||
Fig. 4b shows the XRD spectra of Ru-TNTA at different annealing temperatures. As can be seen from Fig. 4b, after drying at room temperature (RT: 20 °C) or annealing at 250 °C, Ru-TNTA only has diffraction peaks of the Ti substrate (35.48°, 38.75°, 40.59°, 53.38°, 63.13°, 70.85°, 74.45°, 76.40° and 77.58°), indicating that the oxide has an amorphous structure. When the annealing temperature is increased to 450 °C, the diffraction peaks of rutile TiO2 appear at 27.96° and 42.15°. As the annealing temperature increases, the diffraction peak intensity of rutile TiO2 gradually becomes stronger, which shows that the crystallization degree of rutile TiO2 is improved.
From the comparison of Fig. 4c and d, it is clear that the diffraction peak of Ti in Ru-TNTA is shifted to a large angle compared to TNTA, indicating the formation of TiRu alloys. The atomic radius of Ru is 1.89 Å and the atomic radius of Ti is 2.00 Å. Due to the fact that the atomic radius of Ru is smaller than that of Ti, a solid solution is formed when Ru is doped into the Ti lattice. At the same time, the Ti lattice shrinks and the crystal plane spacing decreases; thus the diffraction peak of TiRu alloys is shifted to a large angle. Similarly, compared to TNTA, the rutile TiO2 diffraction peaks (27.96° and 42.15°) of Ru-TNTA annealed at 450 °C and 600 °C are also shifted to the right. That is because TiO2 and RuO2 have the same rutile crystal structure; the radius of Ti4+ is 0.64 Å and the radius of Ru4+ is 0.62 Å.37 Obviously, the radius of Ru4+ is smaller than that of Ti4+. Therefore, Ru4+ can enter the TiO2 lattice, resulting in the shrinkage of the TiO2 lattice and a decrease in crystal plane spacing, so the diffraction peak is shifted to a large angle. In addition, TiO2 in TNTA annealed at 450 °C has an anatase structure. TiO2 in TNTA annealed at 600 °C appears to be a rutile structure, while TiO2 in Ru-TNTA annealed at 450 °C already has a rutile structure. These results indicate that Ru can promote the formation of rutile TiO2, which is consistent with previous findings. Houskova et al. have shown that Ru-doped TiO2 can transform into the rutile phase at lower temperatures compared to undoped TiO2.38 The diffraction peaks of Ru and its oxides do not appear in all the samples, which may be attributed to the lower doping concentration and the entry of Ru4+ into the lattice of TiO2.39
Fig. 5 shows the TEM and HRTEM images of Ru-TNTA. From Fig. 5a and b, it can be seen that there is no obvious ordered atomic arrangement in the unannealed Ru-TNTA nanotubes, and there are no diffraction spots or diffraction rings in the selected area electron diffraction (SAED) patterns, indicating the amorphous structure of the unannealed sample. The sample annealed at 450 °C is still a nanotube structure (Fig. 5c), and the HRTEM image reveals an ordered crystal structure (Fig. 5d) with a lattice spacing of 0.32 nm (Fig. 5e), which can be ascribed to the (110) planes of rutile TiO2. The lattice spacing is slightly reduced compared to the standard card, which might be due to the doping of Ru. Analysis of the lattice images by inverse fast Fourier transform (IFFT) indicates the presence of distortions and dislocations in the lattice stripes, confirming the existence of defects and lattice distortions in the crystal structure of the sample. No crystalline plane of RuO2 is observed in the sample, meaning that no RuO2 grains are formed. This result is consistent with the XRD analysis. Both RuO2 and TiO2 have a rutile structure,40 and the radii of Ti4+ and Ru4+ only differ by 0.02 Å. Therefore, Ru4+ is relatively easy to be doped into the lattice of TiO2. On the basis of the above analyses, the Ru4+ in Ru-TNTA is uniformly dispersed in the TiO2 lattice.
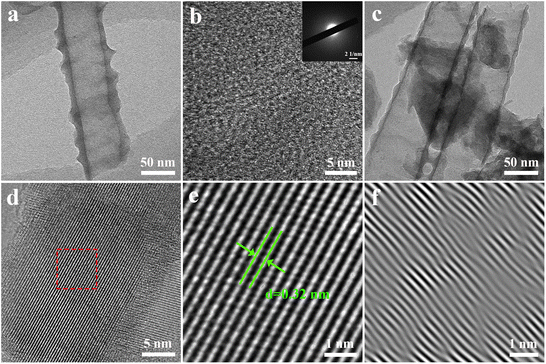 | ||
| Fig. 5 TEM (a) and HRTEM (b) images and SAED pattern (inset) of unannealed Ru-TNTA, TEM (c) and HRTEM (d) images of Ru-TNTA annealed at 450 °C and enlarged (e) and IFFT (f) images of selected area. | ||
3.2. Performances of the hydrogen evolution reaction
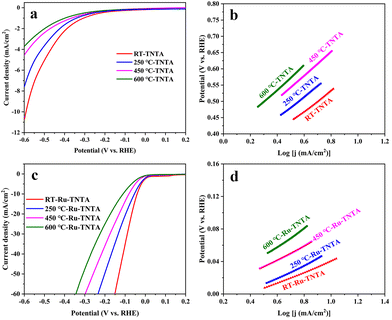
The electrocatalytic performance of TNTA and Ru-TNTA for the HER was investigated by linear sweeping voltammetry (LSV). Fig. 6a shows the polarization curves of TNTA annealed at different temperatures. From Fig. 6a, it is known that at the same electrode potential, the current density of the electrode decreases as the annealing temperature increases. The current density of unannealed TNTA is the largest, with an overpotential of 591 mV at a current density of 10 mA cm−2. The Tafel slope was estimated using the Tafel equation to evaluate HER kinetics.41 Theoretically, a lower Tafel slope indicates a better electrocatalytic hydrogen evolution ability of the electrode. Fig. 6b shows Tafel plots calculated from the polarization curves in Fig. 6a. After linear fitting, the Tafel slopes of electrodes with four different annealing temperatures (from low to high) are 317 mV dec−1, 331 mV dec−1, 364 mV dec−1 and 374 mV dec−1, respectively. The Tafel slope of unannealed TNTA is the smallest, indicating its best HER performance among all the TNTA electrodes. The performance of TNTA electrodes for the HER becomes worse with the increase of annealing temperatures.Fig. 6c shows the polarization curves of Ru-TNTA annealed at different temperatures. The unannealed Ru-TNTA only requires an overpotential of 41 mV to obtain a current density of 10 mA cm−2, which is lower than those of Ru-TNTA annealed at 250 °C (54 mV), 450 °C (81 mV) and 600 °C (111 mV). Therefore, the unannealed Ru-TNTA has the highest catalytic activity for the HER. Along with the increase of annealing temperature, the catalytic activity of Ru-TNTA for the HER becomes worse. Fig. 6d shows the Tafel plots of Ru-TNTA at different annealing temperatures (low to high) with the corresponding Tafel slopes of 67 mV dec−1, 81 mV dec−1, 86 mV dec−1 and 114 mV dec−1, respectively. The unannealed Ru-TNTA has the smallest Tafel slope (67 mV dec−1), indicating its fast HER kinetics. The performance of Ru-TNTA for the HER becomes worse as the annealing temperature increases. The results in Fig. 6 suggest that the annealing temperature greatly influences the performance of electrodes for the HER. When the annealing temperature changes, the HER performance of TNTA and Ru-TNTA has the same variation tendency, and the unannealed electrodes have the best HER catalytic activity.
3.3. Performances of the oxygen evolution reaction
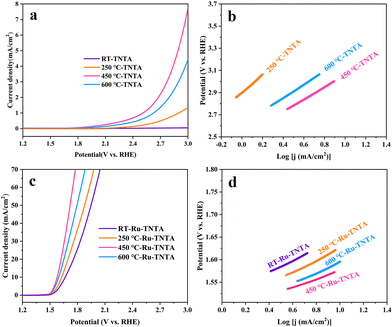
The electrocatalytic performance of TNTA and Ru-TNTA for the OER is shown in Fig. 7. Fig. 7a shows the polarization curves of TNTA. Along with the increase of annealing temperature, the current density of the TNTA electrode increases first and then decreases (Fig. 7a). The current density of TNTA annealed at 450 °C is the largest. The overpotential is 1836 mV at a current density of 10 mA cm−2, and the Tafel slope is 554 mV dec−1 (Fig. 7b). The variation tendency of the OER catalytic performance of Ru-TNTA at different annealing temperatures is the same as that of TNTA (Fig. 7c and a). The highest OER activity is observed for Ru-TNTA annealed at 450 °C, with an overpotential of 349 mV at a current density of 10 mA cm−2. According to the Tafel plots in Fig. 7d, the Tafel slopes of Ru-TNTA electrodes dried at room temperature and annealed at 250 °C, 450 °C and 600 °C are 129 mV dec−1, 134 mV dec−1, 94 mV dec−1 and 119 mV dec−1, respectively. As shown in Fig. 7c and d, Ru-TNTA annealed at 450 °C possesses the smallest overpotential and Tafel slope, and its OER catalytic performance is the best, which is consistent with the analysis results of TNTA.It is known from Fig. 6 and 7 that the HER and OER overpotentials of TNTA are larger, while those of Ru-TNTA decrease significantly, indicating that the electrocatalytic activity of Ru-TNTA is much better than that of TNTA. Due to the characteristics of the Ru element, RuO2 has excellent electrocatalytic activity for the HER and OER. The special tube structure of TNTA can not only increase the surface area, but also promote mass transfer, which is conducive to the formation and detachment of hydrogen and oxygen. For Ru-TNTA, Ru4+ is highly dispersed in the TiO2 lattice and there are more Ru active sites on the inner and outer surfaces of the nanotubes, resulting in a significant increase in electron transfer efficiency and a full utilization of Ru; thus the Ru-TNTA electrode exhibits high electrocatalytic activity.9,42 Moreover, it is known from Fig. 6 and 7 that the annealing temperature has a marked effect on the HER and OER performances of the electrodes. The unannealed Ru-TNTA shows the best HER performance and the Ru-TNTA annealed at 450 °C has the best OER performance.
As shown in Fig. 4, the unannealed TNTA and Ru-TNTA have amorphous structures. There are a large number of hydroxyl groups on the surface of amorphous oxide, which can provide more active sites and make it easy to achieve hydrogen adsorption and detachment. Therefore, the unannealed electrodes exhibit higher HER performance.43–46 As the annealing temperature increases, the hydroxyl groups will condense and dehydrate, and the surface electronic state of the oxide changes, which is not conducive to the adsorption and detachment of hydrogen, thus resulting in a decrease in the HER catalytic activity.
Along with the increase of annealing temperature, the order degree of atoms increases and the oxide changes from an amorphous structure to a crystalline structure. Meanwhile, the electrical conductivity is improved and the oxide surface is more favorable for oxygen adsorption and detachment. Hence, TNTA and Ru-TNTA after annealing show greater catalytic activity for the OER.47 The electrodes annealed at 450 °C are almost completely crystallized. When the annealing temperature is higher than 450 °C, the further growth of grains will reduce defects and active sites, and the change of the crystal phase will increase the electron migration resistance, resulting in a decrease in the OER catalytic performance.
3.4. Effect of Ru content
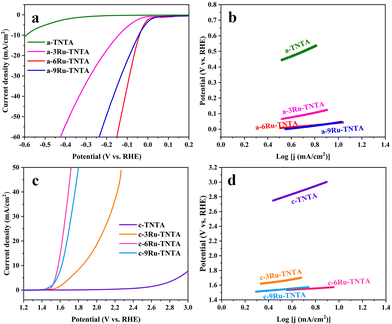
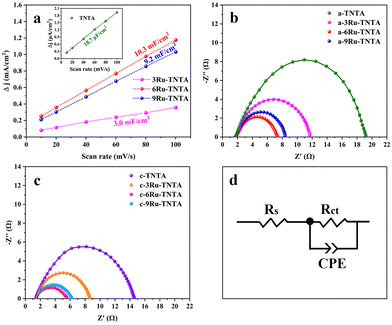
xRu-TNTA samples (x represents the atomic percentage of Ru in the alloys) were prepared using TiRu alloys with different Ru contents. Fig. 8 shows the HER performance of the amorphous structure sample dried at room temperature (denoted as a-xRu-TNTA) and the OER performance of the crystallized sample annealed at 450 °C (denoted as c-xRu-TNTA). It is known from Fig. 8a and b that the HER performance of a-xRu-TNTA increases first and then decreases along with increasing Ru content. The HER performance of a-6Ru-TNTA is optimal when the Ru content in the alloy is 6%. As shown in Fig. 8c and d, the overpotential of c-xRu-TNTA decreases first and then increases with increasing Ru content. c-6Ru-TNTA displays the best OER catalytic activity when the Ru content in the alloy is 6%. Meanwhile, the Tafel slope of c-6Ru-TNTA is the smallest, meaning that the OER kinetics of c-6Ru-TNTA is the fastest.To investigate the reason for the effect of Ru content on the electrocatalytic performance of Ru-TNTA, the ECSAs and EIS spectra of the electrodes with different Ru contents were tested. Fig. S1† shows the CV curves of TNTA and xRu-TNTA in 1 M KOH at different sweep speeds. The current density vs. sweep speed curves (Fig. 9a) of all electrodes can be obtained from Fig. S1,† and all the curves are approximately straight lines, which means that all electrodes exhibit an electric double-layer capacitance under the test conditions. The slope of each fitting curve in Fig. 9a represents Cdl. The Cdl values of TNTA, 3Ru-TNTA, 6Ru-TNTA and 9Ru-TNTA are 18.7 μF cm−2, 3.0 mF cm−2, 10.3 mF cm−2 and 9.2 mF cm−2, and the corresponding ECSAs are 0.47 cm2, 75.0 cm2, 257.5 cm2 and 230.0 cm2, respectively. The ECSAs of all electrodes suggest that doping Ru into TNTA can significantly increase the electrochemically active surface area. Moreover, the Ru content in Ru-TNTA has a significant effect on ECSA. With increasing Ru content, the ECSA of electrodes first increases and then decreases, and a maximum value appears at a Ru content of 6% (6Ru-TNTA). Fig. 9b–d show the EIS spectra of a-xRu-TNTA for the HER (Fig. 9b) and c-xRu-TNTA for the OER (Fig. 9c) with different Ru contents and the corresponding equivalent circuits used to fit the data (Fig. 9d). As can be seen in Fig. 9b, the charge transfer resistances for the HER of a-TNTA, a-3Ru-TNTA, a-6Ru-TNTA and a-9Ru-TNTA are 17.36 Ω, 9.33 Ω, 5.43 Ω and 6.20 Ω, respectively. This indicates that the Rct of each electrode is obviously different and Ru doping can considerably reduce the Rct of the electrodes. With increasing Ru content, the Rct of electrodes first decreases and then increases slightly, and the Rct of a-6Ru-TNTA is the smallest. The Rct in the EIS spectra of c-xRu-TNTA for the OER (Fig. 9c) has a similar variation trend to that in Fig. 9b, where c-6Ru-TNTA exhibits the smallest Rct of about 4.14 Ω. The results of Fig. 9b and c are consistent with those of Fig. 9a.
The above results could possibly be due to two main reasons. One is that the conductivity of RuO2 is noticeably better than that of TiO2, so doping RuO2 in TiO2 can improve its conductivity; the second is that the radii of Ti4+ and Ru4+ are different. Doping TNTA with Ru causes distortion of the TiO2 lattice and generation of defects, resulting in an increase in the surface area of the electrode. The combined effect of the two factors will increase the ECSA of xRu-TNTA. With the increase in Ru content, the amount of RuO2 in TNTA increases, so the conductivity of the electrodes improves and the ECSA expands. However, when the Ru content in Ru-TNTA is too high, there are too many defects. Moreover, the integrity and continuity of the TiO2 phase are severely damaged, which will cause deterioration of conductivity along with a concomitant decrease in the ECSA. According to the results of the ECSA and EIS, doping TNTA with Ru can significantly increase the ECSA and decrease the Rct of the electrodes. The larger ECSA represents more catalytically active sites and the smaller Rct represents the faster charge transfer rate and electrochemical process, leading to the improvement of the catalytic activity of the electrodes. At the same time, the Ru content in Ru-TNTA affects the ECSA and Rct. Thus, 6Ru-TNTA with the largest ECSA and the smallest Rct displays optimal electrocatalytic performance.
For comparison with the electrocatalytic performance of xRu-TNTA, the HER and OER performances of TiRu alloys with different Ru contents (denoted as TiRux, where x represents the atomic percentage of Ru in the alloy) were also tested. The relevant results are shown in Fig. 10. It can be seen from Fig. 10a and b that the HER performance of the Ti sheet is poor, and its current density increases slowly. The overpotentials of TiRu3, TiRu6 and TiRu9 are 254 mV, 188 mV and 169 mV (10 mA cm−2), and the Tafel slopes are 248 mV dec−1, 220 mV dec−1 and 187 mV dec−1, respectively. As shown in Fig. 10c and d, with increasing Ru content in the TiRu alloys, the overpotentials and Tafel slopes of TiRux electrodes decrease, indicating enhanced and stabilized HER performance. Furthermore, the HER performance of TiRux is considerably lower than that of a-xRu-TNTA. From Fig. 10e–h, the variation tendency of the OER performance of TiRux alloys is the same as that in Fig. 10a–d. Meanwhile, the performance of TiRux for the OER is significantly inferior to that of the corresponding c-xRu-TNTA.
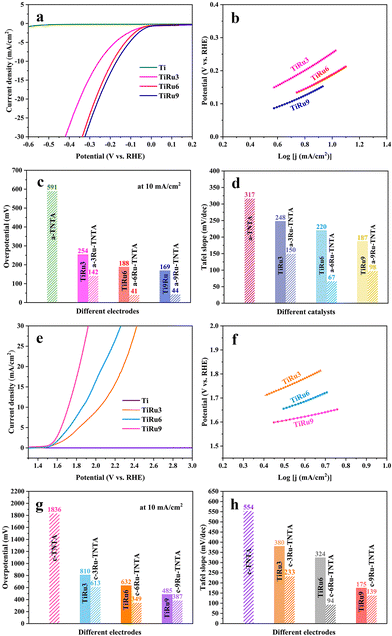 | ||
| Fig. 10 HER performance of TiRux (a and b) and the comparison histogram with a-xRu-TNTA (c and d) and OER performance of TiRux (e and f) and the comparison histogram with c-xRu-TNTA (g and h). | ||
The significant difference between TiRux and xRu-TNTA shown in Fig. 10 can be ascribed to their different surface areas. The surface area of TiRux approximates the physical area of the alloy (about 4 cm2), while the electrochemically active surface area of xRu-TNTA is several times larger than that of TiRux and more active sites can be provided. Besides, differences in the properties of metallic Ru and RuO2 can have an impact on the electrocatalytic activity of TiRux and xRu-TNTA.
3.5. Effect of test temperature
Fig. 11 shows the performances of a-Ru-TNTA (i.e., a-6Ru-TNTA) for the HER and c-Ru-TNTA (i.e., c-6Ru-TNTA) for the OER at different test temperatures. For the HER, the overpotentials of a-Ru-TNTA at room temperature, 40 °C, 60 °C and 80 °C are 41 mV, 34 mV, 28 mV and 19 mV (10 mA cm−2), and the corresponding Tafel slopes are 67 mV dec−1, 66 mV dec−1, 65 mV dec−1 and 64 mV dec−1, respectively (Fig. 11a and b). For the OER, the overpotentials of c-Ru-TNTA at room temperature, 40 °C, 60 °C and 80 °C are 349 mV, 311 mV, 265 mV and 227 mV (10 mA cm−2), respectively, and the corresponding Tafel slopes are 94 mV dec−1, 86 mV dec−1, 84 mV dec−1 and 82 mV dec−1, respectively (Fig. 11c and d). As the test temperature increases, the overpotential and Tafel slope of Ru-TNTA gradually become lower, demonstrating that the test temperature can affect the HER and OER. At a higher reaction temperature, the reactant activity is improved and the reaction activation energy, interfacial tension and mass transfer resistance are reduced, which is more beneficial for the HER and OER, and therefore the overpotentials of electrodes are lowered. Moreover, the electrocatalytic activity of Ru-TNTA also changes with different test temperatures.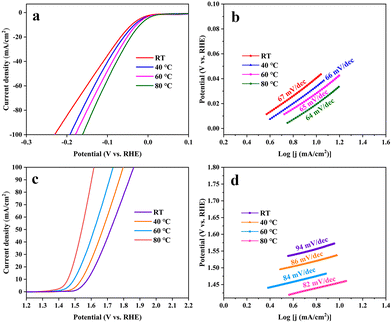 | ||
| Fig. 11 HER performance of a-xRu-TNTA (a and b) and OER performance of c-xRu-TNTA (c and d) at different test temperatures. | ||
3.6. Comprehensive performances of the optimized electrodes
The performance comparison of the optimized Ru-TNTA with commercial Pt/C and IrO2 is shown in Fig. 12. As can be seen from Fig. 12a and b, the HER performance of commercial Pt/C at the test temperature of 80 °C (η10 = 54 mV, Tafel slope = 78 mV dec−1) is better than that at room temperature (η10 = 74 mV, Tafel slope = 96 mV dec−1), but both are lower than that of a-Ru-TNTA (80 °C: η10 = 19 mV, Tafel slope = 64 mV dec−1; RT: η10 = 41 mV, Tafel slope = 67 mV dec−1). The electrocatalytic performance of a-Ru-TNTA for the HER is considerably superior to those of recently reported electrodes (Table S1†).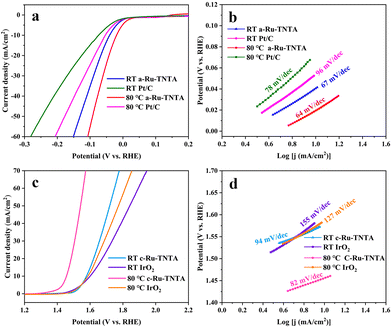 | ||
| Fig. 12 HER performances of a-Ru-TNTA and commercial Pt/C (a and b) and OER performances of c-Ru-TNTA and IrO2 (c and d) at room temperature and 80 °C test temperature. | ||
From Fig. 12c and d, the OER performance of IrO2 at 80 °C (η10 = 357 mV, Tafel slope = 127 mV dec−1) is improved compared to that at room temperature (η10 = 371 mV, Tafel slope = 155 mV dec−1), but the change is not substantial. The performance of c-Ru-TNTA for the OER at room temperature (η10 = 349 mV, Tafel slope = 94 mV dec−1) is superior to that of IrO2. Moreover, its performance for the OER is substantially improved at 80 °C (η10 = 227 mV, Tafel slope = 82 mV dec−1). The performance of c-Ru-TNTA for the OER is superior to those of previously reported electrodes (Table S2†).
The stability measurement results are given in Fig. S2.† After 5000 CV cycles, the HER polarization curve of a-Ru-TNTA almost overlaps with the initial curve (Fig. S2a†), and the OER polarization curve of c-Ru-TNTA deviates marginally from the initial curve, with its increasing overpotential of only 14 mV (10 mA cm−2) and a smaller activity loss (Fig. S2b†). During the electrolysis testing at a constant voltage for 72 hours continuously at room temperature, the current density of a-Ru-TNTA is nearly invariable (Fig. S2c†) while that of c-Ru-TNTA is slightly reduced (Fig. S2d†). These results demonstrate that both a-Ru-TNTA and c-Ru-TNTA possess outstanding stability.
Based on the above results, Ru-TNTA exhibits excellent HER (a-Ru-TNTA) and OER activities (c-Ru-TNTA), and can be used as a bifunctional electrocatalytic electrode. Fig. 13a shows the current density vs. voltage curves for water splitting with different cathodes and anodes. At room temperature, the a-Ru-TNTA||c-Ru-TNTA electrode group exhibits a voltage of 1.496 V at a current density of 10 mA cm−2, which is significantly lower than those of a-Ru-TNTA||a-Ru-TNTA (1.545 V), c-Ru-TNTA||c-Ru-TNTA (1.567 V) and Pt/C||IrO2 (1.604 V). At the test temperature of 80 °C, the voltage of the a-Ru-TNTA||c-Ru-TNTA electrode group (1.480 V) is still markedly lower than that of Pt/C||IrO2 (1.563 V). Fig. 13b shows the stability measurement of the a-Ru-TNTA||c-Ru-TNTA electrode group. There is no apparent decay in current density after 72 hours of continuous overall water splitting at room temperature. The results in Fig. 13 demonstrate that the a-Ru-TNTA||c-Ru-TNTA electrode group has excellent water splitting performance and good stability, much superior to those reported in previous literature (Table S3†).
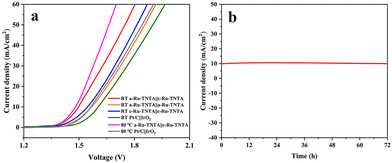 | ||
| Fig. 13 Current density vs. voltage curves for water splitting with different cathodes and anodes (a) and stability of the a-Ru-TNTA||c-Ru-TNTA electrode group (b). | ||
4. Conclusions
In conclusion, Ru-TNTA electrodes were prepared from TiRu alloys by anodic oxidation, and their performances for the HER and OER are closely related to the annealing temperature, Ru content and testing temperature. The unannealed Ru-TNTA (a-Ru-TNTA) with an amorphous structure has more hydroxyl groups on the oxide surface, and the adsorption and detachment of hydrogen are easier, exhibiting excellent HER activity. Ru-TNTA annealed at 450 °C (c-Ru-TNTA) has a rutile structure and its oxide surface is more favorable for oxygen adsorption and detachment, exhibiting superior OER activity. The Ru content in Ru-TNTA has an obvious effect on the ECSA and Rct. The lowest Rct and the largest ECSA contribute to the excellent electrochemical performance of Ru-TNTA when the Ru content is 6%. At room temperature, the overpotential of a-Ru-TNTA is 41 mV for the HER and 349 mV for c-Ru-TNTA for the OER, and at 80 °C they are reduced to 19 mV and 227 mV (at 10 mA cm−2), which are lower than those of commercial Pt/C and IrO2, respectively. The overall water splitting voltage of the a-Ru-TNTA||c-Ru-TNTA electrode group is also remarkably smaller than that of Pt/C||IrO2. In addition, Ru-TNTA exhibits excellent electrochemical stability and durability, and is a bifunctional electrocatalytic electrode with promising applications.Conflicts of interest
There are no conflicts to declare.Acknowledgements
This work was supported by the National Natural Science Foundation of China (51972095).References
- J. Jin, Y. Zhu, Y. Liu, Y. Li, W. Peng, G. Zhang, F. Zhang and X. Fan, Int. J. Hydrogen Energy, 2017, 42, 3947–3954 CrossRef CAS.
- J. Yao, W. Huang, W. Fang, M. Kuang, N. Jia, H. Ren, D. Liu, C. Lv, C. Liu, J. Xu and Q. Yan, Small Methods, 2020, 4, 2000494 CrossRef CAS.
- S. Wang, A. Lu and C.-J. Zhong, Nano Converg., 2021, 8, 1–23 CrossRef CAS PubMed.
- Z. Yu, K. Mao and Y. Feng, J. Adv. Ceram., 2021, 10, 1338–1349 CrossRef CAS.
- W. He, F. Wang, D. Jia, Y. Li, L. Liang, J. Zhang, Q. Hao, C. Liu, H. Liu and J. Zhao, Nanoscale, 2020, 12, 24244–24250 RSC.
- M. Wang, Z. Wang, X. Gong and Z. Guo, Renewable Sustainable Energy Rev., 2014, 29, 573–588 CrossRef CAS.
- M. Zhang, J. Chen, H. Li, P. Cai, Y. Li and Z. Wen, Nano Energy, 2019, 61, 576–583 CrossRef CAS.
- B. Zhou, R. Gao, J.-J. Zou and H. Yang, Small, 2022, 18, 2202336 CrossRef CAS PubMed.
- M. Zhao, W. Yuan and C. M. Li, J. Mater. Chem. A, 2017, 5, 1201–1210 RSC.
- Y. Zhou, J. Li, X. Gao, W. Chu, G. Gao and L.-W. Wang, J. Mater. Chem. A, 2021, 9, 9979–9999 RSC.
- Y. Pan, X. Wang, H. Lin, Q. Xia, M. Jing, W. Yuan and C. M. Li, Nanoscale, 2023, 15, 14068–14080 RSC.
- L. Hang, T. Zhang, Y. Sun, D. Men, X. Lyu, Q. Zhang, W. Cai and Y. Li, J. Mater. Chem. A, 2018, 6, 19555–19562 RSC.
- L. Zhang, Z. Hu, J. Huang, Z. Chen, X. Li, Z. Feng, H. Yang, S. Huang and R. Luo, J. Adv. Ceram., 2022, 11, 1294–1306 CrossRef CAS.
- X. Wang, Y. Fei, W. Wang, W. Yuan and C. M. Li, ACS Appl. Energy Mater., 2019, 2, 8851–8861 CrossRef CAS.
- T. N. J. I. Edison, R. Atchudan and Y. R. Lee, Int. J. Hydrogen Energy, 2019, 44, 2323–2329 CrossRef.
- Z. Liu, J. Jiang, Y. Liu, G. Huang, S. Yuan, X. Li and N. Li, Appl. Surf. Sci., 2021, 538, 148019 CrossRef CAS.
- J. Y. Lim, G. Rahman, S. Y. Chae, K.-Y. Lee, C.-S. Kim and O.-S. Joo, Int. J. Energy Res., 2014, 38, 875–883 CrossRef CAS.
- K. Lu, G. Chang, H. Zhang and X.-Y. Yu, Chem. Commun., 2021, 57, 2907–2910 RSC.
- L. Ouyang, X. He, Y. Sun, L. Zhang, D. Zhao, S. Sun, Y. Luo, D. Zheng, A. M. Asiri, Q. Liu, J. Zhao and X. Sun, Inorg. Chem. Front., 2022, 9, 6602–6607 RSC.
- W. Li, H. Zhang, M. Hong, L. Zhang, X. Feng, M. Shi, W. Hu and S. Mu, Chem. Eng. J., 2022, 431, 134072 CrossRef CAS.
- L.-A. Naslund, C. M. Sanchez-Sanchez, A. S. Ingason, J. Backstrom, E. Herrero, J. Rosen and S. Holmin, J. Phys. Chem. C, 2013, 117, 6126–6135 CrossRef.
- C. Karunakaran, S. Senthilvelan and S. Karuthapandian, J. Photochem. Photobiol., A, 2005, 172, 207–213 CrossRef CAS.
- A. Fujishima, T. Rao and D. Tryk, Electrochim. Acta, 2000, 45, 4683–4690 CrossRef CAS.
- A. Nikfarjam, R. Mohammadpour and A. I. Zad, Appl. Phys. A: Mater. Sci. Process., 2014, 115, 1387–1393 CrossRef CAS.
- T. Pan, W. Cao and M. Wang, Opt. Fiber Technol., 2018, 45, 359–362 CrossRef CAS.
- Y. Liu, B. Zhou, B. Xiong, J. Bai and L. Li, Chin. Sci. Bull., 2007, 52, 1585–1589 CrossRef CAS.
- Z. Liu, J. Zhou, H. Xue, L. Shen, H. Zang and W. Chen, Synth. Met., 2006, 156, 721–723 CrossRef CAS.
- X. Zhang, Y. Zhang, Y. Wang, Q. Wang, Z. Liu, R. Geng, H. Wang, W. Jiang and W. Ding, J. Alloys Compd., 2022, 929, 167278 CrossRef CAS.
- M. P. Browne, H. Nolan, G. S. Duesberg, P. E. Colavita and M. E. G. Lyons, ACS Catal., 2016, 6, 2408–2415 CrossRef CAS.
- G. Li, L. Anderson, Y. Chen, M. Pan and P.-Y. A. Chuang, Sustainable Energy Fuels, 2018, 2, 237–251 RSC.
- A. Roy, A. Ray, S. Saha, M. Ghosh, T. Das, M. Nandi, G. Lal and S. Das, Int. J. Energy Res., 2021, 45, 16908–16921 CrossRef CAS.
- U. Aftab, A. Tahira, A. Gradone, V. Morandi, M. I. Abro, M. M. Baloch, A. L. Bhatti, A. Nafady, A. Vomiero and Z. H. Ibupoto, Int. J. Hydrogen Energy, 2021, 46, 9110–9122 CrossRef CAS.
- L. Atanasoska, R. T. Atanasoski, F. H. Pollak and W. E. O'Grady, Surf. Sci., 1990, 230, 95–112 CrossRef CAS.
- M. T. Uddin, Y. Nicolas, C. Olivier, T. Toupance, M. M. Mueller, H.-J. Kleebe, K. Rachut, J. Ziegler, A. Klein and W. Jaegermann, J. Phys. Chem. C, 2013, 117, 22098–22110 CrossRef CAS.
- S. Niu, X.-P. Kong, S. Li, Y. Zhang, J. Wu, W. Zhao and P. Xu, Appl. Catal., B, 2021, 297, 120442 CrossRef CAS.
- T.-T. Li, B. Shan, W. Xu and T. J. Meyer, ChemSusChem, 2019, 12, 2402–2408 CrossRef CAS PubMed.
- J. Yu, D. Zhao, X. Xu, X. Wang and N. Zhang, ChemCatChem, 2012, 4, 1122–1132 CrossRef CAS.
- V. Houskova, V. Stengl, S. Bakardjieva, N. Murafa and V. Tyrpekl, Appl. Catal., B, 2009, 89, 613–619 CrossRef CAS.
- N.-P. Thuy-Duong, S. Luo, D. Vovchok, J. Llorca, S. Sallis, S. Kattel, W. Xu, L. F. J. Piper, D. E. Polyansky, S. D. Senanayake, D. J. Stacchiola and J. A. Rodriguez, Phys. Chem. Chem. Phys., 2016, 18, 15972–15979 RSC.
- E. Morais, C. O'Modhrain, K. R. Thampi and J. A. Sullivan, J. Catal., 2021, 401, 288–296 CrossRef CAS.
- Y. Wei, J. Fu, H. Song, B. Zhang, C. Pi, L. Xia, X. Zhang, B. Gao, Y. Zheng and P. K. Chu, RSC Adv., 2019, 9, 11676–11682 RSC.
- S. Zhao, Y. Zhang, H. Li, S. Zeng, R. Li, Q. Yao, H. Chen, Y. Zheng and K. Qu, J. Mater. Chem. A, 2023, 11, 13783–13792 RSC.
- Y. Xia, W. Wu, H. Wang, S. Rao, F. Zhang and G. Zou, Nanotechnology, 2020, 31, 145401 CrossRef CAS PubMed.
- J. Hu, S. Li, Y. Li, J. Wang, Y. Du, Z. Li, X. Han, J. Sun and P. Xu, J. Mater. Chem. A, 2020, 8, 23323–23329 RSC.
- J. Lee, S. A. S. Shah, P. J. Yoo and B. Lim, Chem. Phys. Lett., 2017, 673, 89–92 CrossRef CAS.
- H. Masai, H. Sakurai, A. Koreeda, Y. Fujii and T. Akai, Sci. Rep., 2020, 10, 1–14 CrossRef PubMed.
- V. R. Jothi, R. Bose, H. Rajan, C. Jung and S. C. Yi, Adv. Energy Mater., 2018, 8, 1802615 CrossRef.
Footnote |
| † Electronic supplementary information (ESI) available. See DOI: https://doi.org/10.1039/d3nr03831a |
| This journal is © The Royal Society of Chemistry 2023 |

