Giant thermal switching in ferromagnetic VSe2 with programmable switching temperature†
Chao
Wu
ab,
Yunshan
Zhao
c,
Gang
Zhang
 *d and
Chenhan
Liu
 *ae
*ae
aMicro- and Nano-scale Thermal Measurement and Thermal Management Laboratory, School of Energy and Mechanical Engineering, Nanjing Normal University, Nanjing, 210023, P. R. China. E-mail: chenhanliu@njnu.edu.cn
bJiangsu Key Laboratory for Design and Manufacture of Micro-Nano Biomedical Instruments, School of Mechanical Engineering, Southeast University, Nanjing, 211100, P. R. China
cNNU-SULI Thermal Energy Research Center (NSTER) & Center for Quantum Transport and Thermal Energy Science (CQTES), School of Physics and Technology, Nanjing Normal University, Nanjing 210023, P. R. China
dInstitute of High Performance Computing, Agency for Science, Technology and Research, 138632, Singapore. E-mail: zhangg@ihpc.a-star.edu.sg
eJiangsu Key Laboratory for Numerical Simulation of Large-Scale Complex Systems, Nanjing Normal University, Nanjing, 210023, P. R. China
First published on 25th November 2022
Abstract
Active and reversible modulation of thermal conductivity can realize efficient heat energy management in many applications such as thermoelectrics. Using first-principles calculations, this study reports a giant thermal switching ratio of 12, much higher than previously reported values, in monolayer 2H-VSe2 above room temperature. Detailed analysis indicates that the high thermal switching ratio is dominated by the ferromagnetic ordering induced phonon bandgap, which significantly suppresses the phonon–phonon scattering phase space across the entire vibration spectrum. The thermal switching in bulk 2H-VSe2 is also investigated and the thermal switching ratio reaches 9.2 at the magnetic transition temperature. Both the phonon–phonon scattering space phase and phonon anharmonicity are responsible for the 9.2-fold thermal switching. This study advances the understanding of heat energy transport in two-dimensional ferromagnets, and also provides new insight into heat energy control and conversion.
New conceptsFerromagnets are potential candidates for thermal switching since they typically have a high switching ratio of thermal conductivity. However, a high switching ratio is only achieved at low temperature and no switching ratio over 3 has been reported around room temperature. Herein, we report a giant switching ratio of 12 at a magnetic transition temperature of 430 K from the ferromagnetic to paramagnetic phase in monolayer 2H-VSe2. We also find that the switching ratio in 2H-VSe2 has a weak dependence on thickness. Combining the fact that the magnetic transition temperature of few-layer 2H-VSe2 decreases monotonously with increasing thickness, a highly efficient thermal switch with programmable switching temperature can be realized based on few-layer 2H-VSe2 by simply using an appropriate thickness. These findings advance the understanding of thermal control in ferromagnets and provide a practical way to design thermal switching with a desired working temperature. |
Introduction
Thermoelectric materials can convert waste heat into electricity, making them attractive in the field of heat energy harvesting. In order to achieve a high conversion efficiency, a low thermal conductivity is highly desired.1–5 For example, doping, as an efficient method, has been widely employed to achieve a low thermal conductivity and a high thermoelectric power factor coefficient.6 On the other hand, for hot-spot thermal management in the field of electronic cooling, one should combine active and passive cooling and both a high power factor and a high thermal conductivity are desired.7,8 Thus, actively and reversibly controlling the thermal conductivity is a new horizon for efficient heat energy management and conversion.Compared with electrons, phonons (heat energy carriers) have no mass and charge, i.e., there is a lack of direct connections between phonons and the external environment, making their control much more difficult. Nevertheless, many methods, including structural phase transitions by external stimuli,9–12 electrochemical ion insertion and removal,13–15 mechanical stress,16,17 and charge density redistribution,18 have been proposed to actively and reversibly control phonon transport or thermal conductivity. For example, in ferroelectric perovskites, structural phase transition or domain wall density change triggered by an electric field,12,19–21 temperature,12,22 and substrate strain23,24 has been employed to explore the reversible control of thermal conductivity. Considering the possible technological applications of thermal control, we propose the following two general conditions: (i) the switching ratio should be up to 10; and (ii) the switching temperature or working temperature should be around room temperature. Accordingly, ferromagnets are the most potential material systems for thermal control since they have the highest switching ratio based on published studies.25–27 However, high thermal switching in ferromagnets typically occurs around the magnetic transition temperature, which is much lower than that occurring at room temperature, making condition (ii) not satisfied. Thus, at present, finding a ferromagnet with a high magnetic transition temperature or increasing the magnetic transition temperature by external stimuli is necessary to realize controllable thermal transport for practical applications.
Compared with bulk ferromagnets, it has been demonstrated that an electric field,28–30 magnetic field,31,32 electrostatic doping,33 and strain34,35 can significantly modulate the magnetic transition temperature in two-dimensional (2D) ferromagnets. Thus, 2D ferromagnets have a high possibility to realize a high switching ratio around room temperature. Recently, the discovery of various 2D ferromagnets,36–40 such as CrI3,41 and Cr2Ge2Te6,28 has provided the possibility of realizing novel devices with broad applications from sensing to van der Waals spintronics. The thermal switching properties in several 2D ferromagnets were also investigated by first-principles calculations.42,43 Although these first-principles calculations observed high thermal switching ratios at low temperature, there is no report on thermal switching in 2D ferromagnets around room temperature. Fortunately, a recent experiment reported that ferromagnetic (FM) ordering in monolayer 1T-VSe2 can persist well above room temperature.44 A more recent experiment reported that for an 8 nm 2H-VSe2 thin film, the FM-to-PM (paramagnetic) phase transition temperature can reach ∼430 K due to magnetic anisotropy.45 In addition, with an increase in the thickness, the magnetic transition temperature decreases monotonously from ∼430 K to ∼300 K at around 50 nm. Therefore, the high magnetic transition temperature from the FM to the PM phase in VSe2 provides the possibility of realizing a high thermal switching ratio around room temperature.
To address the possibility of thermal switching in VSe2, in the current study, the switching ratio that originates from the FM–PM phase transition in monolayer and bulk 2H-VSe2 is investigated using first-principles calculations. The calculation results indicate that at the FM–PM transition temperature of 430 K, the switching ratio in monolayer 2H-VSe2 reaches up to 12, which is the highest ratio for ferromagnets around and above room temperature. The switching ratio decreases to 9.2 in bulk 2H-VSe2 along with a decrease of the magnetic transition temperature to 80 K. Our detailed analysis indicates that the high thermal switching ratio is dominated by the large difference in the weighted phonon–phonon scattering phase space (WP3) in monolayer 2H-VSe2 and both the WP3 and phonon anharmonicity in bulk 2H-VSe2. This study deepens the understanding of phonon transport in 2D materials and indicates the possibility of 2H-VSe2 for controllable thermal switching around room temperature.
Results and discussion
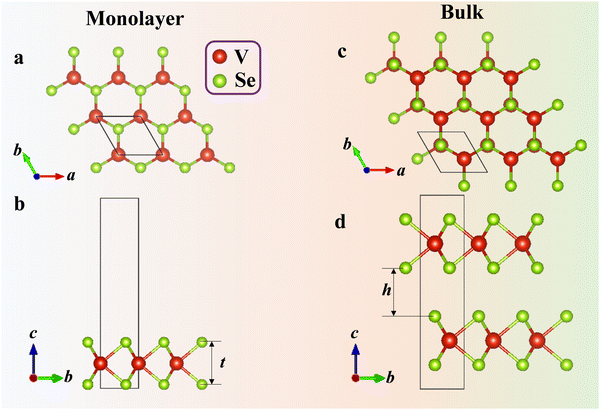
The effect of FM ordering on 2H-VSe2 is firstly reflected in the structural and energy information through relaxing the structures with (FM) and without (PM) spin polarization. The total energy of both monolayer and bulk 2H-VSe2 (Fig. 1) in the FM phase is lower than that of the corresponding PM phase (Table S1, ESI†), consistent with experimental measurements45 and previous theoretical calculations.46,47 The lower energy in the FM phase indicates the preferred stability and FM ordering for 2H-VSe2. In addition to the difference in energy, FM ordering also alters the lattice constants, bond angles, and atomic positions, as shown in Table S1 (ESI†). For example, the angle ∠Se1V1Se2 decreases from 79.816° to 79.682° in monolayer 2H-VSe2 when FM ordering is included. Thus, for 2H-VSe2, FM ordering lowers its energy and alters its lattice structure significantly.Due to the significant change in lattice structure, the effect of FM ordering on 2H-VSe2 is secondly reflected in the lattice vibration or the phonon dispersion. Since phonon–orbit coupling may be important in quantifying spin–phonon coupling,48 the phonon dispersion with spin–orbit coupling is also calculated. The calculation results show that spin–orbit coupling has weak effects on the phonon dispersion, especially for the acoustic phonons in 2H-VSe2 (Fig. S2, ESI†); thus, in the current work, the spin–orbit coupling is ignored. For both monolayer and bulk 2H-VSe2, FM ordering creates the phonon bandgap due to the upshift of optical phonon modes (Fig. 2), which is also distinctly indicated by the phonon density of states (DOS) and was observed in a previous study.42 Strain engineering and doping18,49 are two efficient strategies for modulating the phonon bandgap. Here, we discover that FM ordering is another efficient and non-destructive strategy for modulating the phonon bandgap. As indicated in ref. 50, introducing or enlarging the phonon bandgap can decrease the number of phonon–phonon scattering channels since the conservation of both energy and momentum during the scattering process becomes more difficult to satisfy. Thus, FM ordering may significantly alter the phonon transport properties and thermal conductivity in 2H-VSe2.
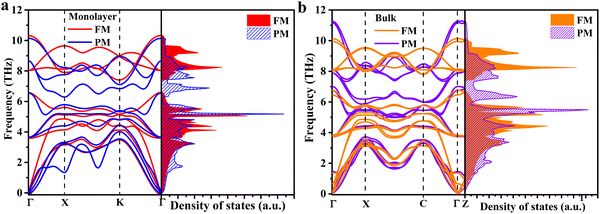 | ||
| Fig. 2 Phonon dispersion and phonon DOS of 2H-VSe2. The red and blue lines as well as the orange and purple lines, respectively, represent the FM and PM phases of monolayer (a) and bulk (b) 2H-VSe2. | ||
As discussed above, FM ordering has significant effects on the lattice structure and phonon dispersion, both of which are directly related to the phonon thermal conductivity. Thus, based on first-principles calculations using the linearized Boltzmann transport equation, the lattice (phonon) thermal conductivity of FM and PM 2H-VSe2 was calculated since they are semiconductors and phonons dominate the thermal transport.45,51 The calculation details are shown in the ESI.† Notably, the ground state of VSe2 is still under debate. As indicated in ref. 52, estimation of the ground state in VSe2 is quite tricky and dependent on the functional used as well as the treatment of V d-electrons. The basic reason, we think, is the close energy of the two structures, i.e., 1T-VSe2 and 2H-Vse2. In our calculations, the total energy of the 2H structure is just 0.016 eV per unit cell higher than that of the 1T structure. Despite the debate, VSe2 with the 2H structure has been successfully synthesized45 and our calculated phonon dispersion of the 2H structure (Fig. 2) has no imaginary frequency, both of which thermodynamically favor the stability of 2H-VSe2. Thus, the thermal switching in 2H-VSe2 is considered in the current work. For the magnetic transition temperature TFM–PM from the FM to the PM phase of monolayer 2H-VSe2, the experimental data of 430 K is directly adopted.45 Due to the lack of experimental data for bulk 2H-VSe2, the TFM–PM of 80 K is estimated based on the energy of the spin exchange interaction obtained from the Heisenberg model,53,54 the details of which are shown in the ESI.† The decrease in the magnetic transition temperature with increasing thickness is consistent with previous experimental measurements.45 The underlying reason for the decrease indicated by the measurement is the gradual disappearance of magnetic anisotropy with increasing thickness.
From Fig. 3a, the thermal conductivity of both monolayer and bulk 2H-VSe2 in the PM phase is lower than 5 W m−1 K−1 around room temperature, indicating the potential for thermoelectric applications.55,56 As indicated in ref. 57, Se vacancies have important effects on the ferromagnetism in VSe2. In order to measure the effects of Se vacancies on the ferromagnetism and thermal conductivity in 2H-VSe2, we perform two comparative calculations. First, we calculate the magnetic moment of the V atom in monolayer 2H-VSe2, and the calculated results observed were 1.0 μB per V atom, which is consistent with previous work.58 Then, we take two Se atoms away in a 2 × 2 × 1 supercell to mimic the Se vacancies and calculate the magnetic moment of the V atom. Interestingly, the magnetic moment per V atom increases to 1.8 μB. Thus, Se vacancies can significantly enhance the ferromagnetism in 2H-VSe2. For the effects of Se vacancies on the thermal conductivity, vacancies typically decrease the thermal conductivity due to phonon–defect scattering. However, ferromagnetism in 2H-VSe2 increases the thermal conductivity as shown in Fig. 3a. Thus, there is a competition between Se-vacancy-introduced phonon–defect scattering and enhanced ferromagnetism. The increase or decrease of thermal conductivity in 2H-VSe2 depends on which one is dominant. This competition is interesting, which deserves further study.
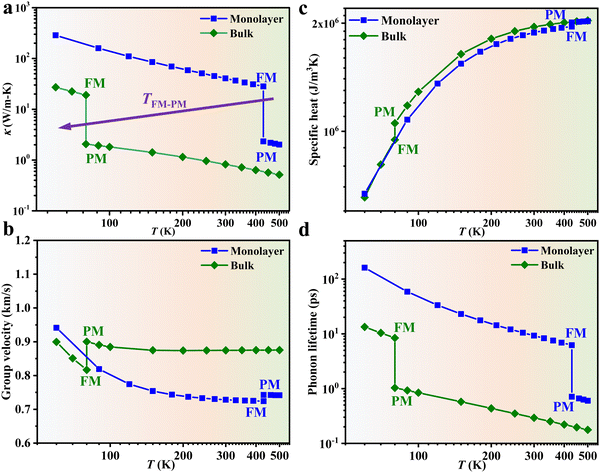
From Fig. 3a, we can also observe that for both monolayer and bulk 2H-VSe2, the thermal conductivity in the FM phase is much larger than that in the PM phase, i.e., at the TFM–PM of 430 K (80 K) the thermal conductivity of monolayer (bulk) 2H-VSe2 in the FM phase is about 12 (9.2) times that in the PM phase. Notably, the PM phase in the current study is treated as the non-magnetic (NM) phase. There are two reasons for this treatment: (1) the bulk VSe2 observed in many experimental studies59,60 and first-principles calculations predicted the non-magnetic phase in monolayer VSe2;61 and (2) if the randomly oriented magnetic moments, namely spin fluctuations, are considered (PM), the thermal conductivity change or the switching ratio at TFM–PM should be even larger since spin fluctuations typically decrease the thermal conductivity.62 Thus, the large change in thermal conductivity at TFM–PM in the current work represents the lower limit of the switching ratio in 2H-VSe2. Such a large change in thermal conductivity indicates that FM ordering can significantly improve the phonon transport. A similar phenomenon was also observed in the 2D van der Waals ferromagnets FeCl3, RuCl3, RuBr3, and RuI3.43 Interestingly, for 2H-VSe2, at TFM–PM the high switching ratio of thermal conductivity has a weak dependence on the thickness (Fig. 3a). Combining the fact that the magnetic transition temperature of 2H-VSe2 decreases monotonously with increasing thickness,45 a high switching ratio with a programmable switching temperature can be realized by simply employing an appropriate thickness. In order to verify the accuracy of the thermal conductivity and thermal switching ratio, the thermal conductivity of 1T-VSe2 (Fig. S3, ESI†), the convergence of the number of q points and scalebroad during the solution of the Boltzmann transport equation (Fig. S4, ESI†), and four-phonon effects (Fig. S5, ESI†) are investigated. The details are shown in the ESI.† All these considerations support the findings in the current work. Since the structural parameters of the PM and FM phases are different due to FM ordering, in order to understand the effects of pure structural change and pure magnetic order on the thermal properties, we calculate the phonon dispersion of 2H-VSe2 using the PM structure with spin polarization. Interestingly, the phonon dispersion of the PM structure with spin polarization is similar to that of the FM structure but is much different from that of the PM structure without spin polarization (Fig. S6, ESI†), indicating that the giant thermal switching in 2H-VSe2 is caused mainly by magnetic order while the structural change has weak effects.
Based on kinetic theory, the lattice (phonon) thermal conductivity k is determined by the specific heat C, phonon group velocity v, and phonon lifetime τ, i.e., k = ΣλCλvλ2τλ, where λ is the phonon mode. Next, we will investigate the effects of these three parameters individually on the thermal conductivity change at TFM–PM. Since vλ and τλ are phonon mode λ dependent parameters, in order to clearly and intuitively show their effects on the thermal conductivity, the specific heat averaged v and τ are calculated as follows:
 | (1) |
 . Fig. 3b–d, respectively, show the temperature dependent v, C, and τ. Through these three figures, it is obvious that at TFM–PM, both the phonon velocity and specific heat have slight effects on the large change in thermal conductivity for 2H-VSe2, which instead is dominated by the phonon lifetime. Moreover, these three figures can explain that the slightly lower switching ratio in bulk 2H-VSe2 is caused by the larger increase in the specific heat (Fig. 3c) and phonon group velocity (Fig. 3b) from the FM to the PM phase, partially eliminating the effects of the phonon lifetime (Fig. 3d). Since the phonon lifetime is dominant and determined by WP3 and phonon anharmonicity, in order to further explore the change in thermal conductivity at TFM–PM, the specific heat averaged WP3 and Grüneisen parameter γ using eqn (1) are then calculated, as shown in Fig. 4. For monolayer 2H-VSe2, at the TFM–PM of 430 K, the specific heat averaged WP3 in the PM phase is about 9.1 times that in the FM phase (blue square symbols in Fig. 4a). The ratio of the specific heat averaged WP3 between the PM and FM phases is similar to that (8.8) of the specific heat averaged phonon lifetime between the FM and PM phases (Fig. 3d), indicating the dominant role of phonon–phonon scattering phase space on the thermal conductivity change. The much smaller WP3 in the FM phase originates from the FM ordering induced phonon bandgap (blue lines in Fig. 2a), which makes the conservation of both energy and momentum more difficult to satisfy. The much weaker change in specific heat averaged γ at the TFM–PM (blue squares in Fig. 4b) verifies the dominant role of phonon–phonon scattering phase space. For bulk 2H-VSe2, at the TFM–PM of 80 K, in addition to the phonon–phonon scattering phase space (olive diamond symbols in Fig. 4a), phonon anharmonicity also significantly affects the thermal conductivity change (olive diamonds in Fig. 4b). Quantitatively, the ratio of the specific heat averaged WP3 between the PM and FM phases is 3.1 and the ratio of the specific heat averaged γ between the PM and FM phases is 3.2; thus, the overall ratio combining WP3 and γ between the PM and FM phases is 9.9, which is similar to the ratio of the phonon lifetime (8.2) or thermal conductivity (9.2) between the FM and PM phases for bulk VSe2.
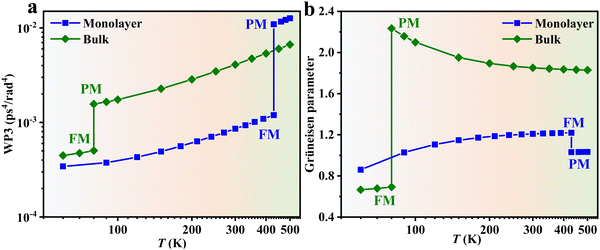 | ||
| Fig. 4 Specific heat averaged weighted phonon–phonon scattering phase space WP3 (a) and Grüneisen parameter (b) of 2H-VSe2. Throughout, the blue squares represent monolayer 2H-VSe2 and the olive diamonds represent bulk 2H-VSe2. For monolayer 2H-VSe2, the giant thermal conductivity change at TFM–PM in Fig. 3a is dominated by the giant change in phonon–phonon scattering phase space; by contrast, for bulk 2H-VSe2, the change in both phonon–phonon scattering phase space and phonon anharmonicity contributes to the change in thermal conductivity at TFM–PM. | ||
Although the specific heat averaged τ, WP3, and γ can provide an intuitive explanation for the large change in thermal conductivity at TFM–PM, what is missing is detailed mode dependent information that can provide a deeper understanding about the underlying mechanism of thermal switching. Next, the mode (frequency) dependent τ data are compared at TFM–PM between the FM and PM phases. As shown in Fig. 5, for both monolayer and bulk 2H-VSe2, at TFM–PM the phonon lifetime in the FM phase is much larger than that in the PM phase over the whole frequency range, indicating that FM ordering can improve phonon transport across the entire vibration spectrum. Such an FM ordering introduced improvement of phonon transport is very different from previous strategies for modulating the thermal conductivity, for which phonons within only a narrow spectrum range can be modulated. The improvement in phonon transport across the entire vibration spectrum is the underlying reason for the giant thermal conductivity change for 2H-VSe2 at the FM–PM phase transition.
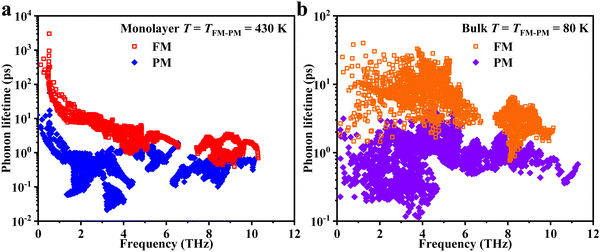 | ||
| Fig. 5 Phonon lifetime of monolayer (a) and bulk (b) 2H-VSe2 at the magnetic transition temperature from the FM phase (hollow symbols) to the PM phase (solid symbols). | ||
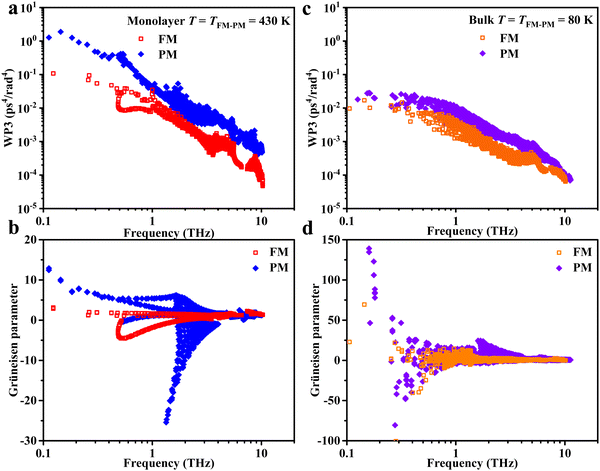
As discussed above, the phonon lifetime is determined by WP3 and phonon anharmonicity. Thus, the mode dependent WP3 and phonon anharmonicity are compared between the FM and PM phases, respectively. For monolayer 2H-VSe2, the mode dependent WP3 in the PM phase is about 10 times that in the FM phase over the whole frequency range (Fig. 6a), verifying the dominant role of phonon–phonon scattering phase space in the thermal conductivity change indicated in Fig. 4a as well as the significant effects of the enlarged phonon bandgap on thermal switching (Fig. 2a). By contrast, for bulk 2H-VSe2, the difference in the mode dependent WP3 data between the FM and PM phases is much smaller (Fig. 6b) since the phonon anharmonicity also contributes significantly to the large thermal conductivity change at TFM–PM, which is verified by the mode dependent γ in Fig. 6d. Therefore, for the monolayer 2D ferromagnet 2H-VSe2, the phonon–phonon scattering phase space dominates the thermal conductivity change at the magnetic transition temperature, whereas for bulk 2H-VSe2, both the phonon–phonon scattering phase space and phonon anharmonicity control the thermal conductivity change at the magnetic transition temperature.
Based on the above discussion, 2H-VSe2 has a giant switching ratio of thermal conductivity. Fig. 7 compares the temperature dependent switching ratio values for some ferromagnets. Notably, the solid symbols represent the theoretical data while the hollow symbols represent the experimental data. As shown in this figure, although a high switching ratio can be obtained at low temperature, a switching ratio of over 3 around room temperature has never been reported in previous literature, either theoretically or experimentally. For example, through magnetic field induced magnetization vector alignment from antiparallel to parallel, a switching ratio of only 2.5 was experimentally obtained at 300 K for Cu/Co50Fe50 multilayer films,71 and a small switching ratio of 1.4 was theoretically predicted for bulk FeRh at 340 K.72 Our work predicts a giant switching ratio of 12 at 430 K and 9.2 at 80 K. Based on the experimental data, the magnetic transition temperature from the FM to the PM phase for few-layer 2H-VSe2 can be modulated via the thickness. Combining the fact that the switching ratio shows only a slight decrease with increasing thickness (the dashed red line in Fig. 7), a giant switching ratio at a desired working temperature can be obtained using an appropriate thickness.
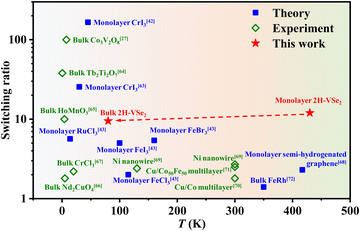 | ||
| Fig. 7 Temperature dependent switching ratio of thermal conductivity in ferromagnets.27,42,43,63–72 | ||
Conclusions
In summary, this study reports giant thermal switching in the 2D ferromagnet 2H-VSe2 using first-principles calculations with the linearized Boltzmann transport equation. For monolayer 2H-VSe2, the thermal conductivity at the magnetic transition temperature of 430 K from the PM to the FM phase jumps 12-fold, which originates from the FM ordering induced drop in phonon–phonon scattering phase space. For bulk 2H-VSe2, the thermal switching ratio is 9.2 at the magnetic transition temperature of 80 K, where both the phonon–phonon scattering phase space and phonon anharmonicity contribute to the thermal conductivity change. Since both monolayer and bulk 2H-VSe2 has a giant switching ratio and the magnetic transition temperature can be designed by simply changing the thickness, this study discovers a material that can meet two important factors – i.e., a high switching ratio and a switching temperature around room temperature – for thermal switching, which indicates the high possibility of realizing controllable thermal transport.Data availability statement
The data will be made available from the corresponding author upon reasonable request.Author contributions
C. Liu initiated the project. C. Wu performed the calculations and C. Liu wrote the manuscript. C. Liu and G. Zhang supervised the project. G. Zhang and Y. Zhao edited the manuscript. All authors discussed the results and commented on the manuscript.Conflicts of interest
There are no conflicts to declare.Acknowledgements
This work was supported by the National Natural Science Foundation of China (Grant no. 52206092) and the Natural Science Foundation of Jiangsu Province (Grant no. BK20210565). C. H. Liu was funded by the Department of Science and Technology of Jiangsu Province (BK20220032), the Basic Science (Natural Science) Research Project of Higher Education Institutions of Jiangsu Province (21KJB470009) and the “Shuangchuang” Doctor program of Jiangsu Province (JSSCBS20210315). C. H. Liu was also funded by the Nanjing Science and Technology Innovation Project for Overseas Students and open research fund of Jiangsu Key Laboratory for Design and Manufacture of Micro-Nano Biomedical Instruments, Southeast University (No. KF202010). Y. Zhao is supported by the Natural Science Foundation of Jiangsu Province (Grant no. BK20210556) and the Jiangsu Specially-Appointed Professor Program. The authors thank the Scientific Computing Center of Nanjing Normal University and the Big Data Center of Southeast University for performing the numerical calculations presented in this paper.References
- W. K. He, D. Y. Wang, H. J. Wu, Y. Xiao, Y. Zhang, D. S. He, Y. Feng, Y. J. Hao, J. F. Dong, R. Chetty, L. J. Hao, D. F. Chen, J. F. Qin, Q. Yang, X. Li, J. M. Song, Y. C. Zhu, W. Xu, C. L. Niu, X. Li, G. T. Wang, C. Liu, M. Ohta, S. J. Pennycook, J. Q. He, J. F. Li and L. D. Zhao, Science, 2019, 365, 1418–1424 CrossRef CAS PubMed.
- J. Mao, H. T. Zhu, Z. W. Ding, Z. H. Liu, G. A. Gamage, G. Chen and Z. F. Ren, Science, 2019, 365, 495–498 CrossRef CAS PubMed.
- S. Roychowdhury, T. Ghosh, R. Arora, M. Samanta, L. Xie, N. K. Singh, A. Soni, J. Q. He, U. V. Waghmare and K. Biswas, Science, 2021, 371, 722–727 CrossRef CAS PubMed.
- X. W. Zhang, Y. Guo, Z. B. Zhou, Y. H. Li, Y. F. Chen and J. L. Wang, Energy Environ. Sci., 2021, 14, 4059–4066 RSC.
- X. W. Zhang, C. H. Liu, Y. Tao, Y. H. Li, Y. L. Guo, Y. F. Chen, X. C. Zeng and J. L. Wang, Adv. Funct. Mater., 2020, 30, 2001200 CrossRef CAS.
- G. Zhang and B. W. Li, Nanoscale, 2010, 2, 1058–1068 RSC.
- J. Mao, G. Chen and Z. Ren, Nat. Mater., 2021, 20, 454–461 CrossRef CAS PubMed.
- M. Zebarjadi, Appl. Phys. Lett., 2015, 106, 203506 CrossRef.
- Q. Y. Lu, S. Huberman, H. T. Zhang, Q. C. Song, J. Y. Wang, G. Vardar, A. Hunt, I. Waluyo, G. Chen and B. Yildiz, Nat. Mater., 2020, 19, 655–662 CrossRef CAS PubMed.
- R. Shrestha, Y. X. Luan, S. Shin, T. Zhang, X. Luo, J. S. Lundh, W. Gong, M. R. Bockstaller, S. Choi, T. F. Luo, R. K. Chen, K. Hippalgaonkar and S. Shen, Sci. Adv., 2019, 5, eaax3777 CrossRef CAS PubMed.
- J. Shin, J. Sung, M. Kang, X. Xie, B. Lee, K. M. Lee, T. J. White, C. Leal, N. R. Sottos, P. V. Braun and D. G. Cahill, Proc. Natl. Acad. Sci. U. S. A., 2019, 116, 5973–5978 CrossRef CAS PubMed.
- K. Aryana, J. A. Tomko, R. Gao, E. R. Hoglund, T. Mimura, S. Makarem, A. Salanova, M. S. Bin Hoque, T. W. Pfeifer, D. H. Olson, J. L. Braun, J. Nag, J. C. Read, J. M. Howe, E. J. Opila, L. W. Martin, J. F. Ihlefeld and P. E. Hopkins, Nat. Commun., 2022, 13, 1–9 Search PubMed.
- J. Cho, M. D. Losego, H. G. Zhang, H. Kim, J. M. Zuo, I. Petrov, D. G. Cahill and P. V. Braun, Nat. Commun., 2014, 5, 1–6 Search PubMed.
- G. H. Zhu, J. Liu, Q. Y. Zheng, R. G. Zhang, D. Y. Li, D. Banerjee and D. G. Cahill, Nat. Commun., 2016, 7, 1–9 Search PubMed.
- A. Sood, F. Xiong, S. D. Chen, H. T. Wang, D. Selli, J. S. Zhang, C. J. McClellan, J. Sun, D. Donadio, Y. Cui, E. Pop and K. E. Goodson, Nat. Commun., 2018, 9, 1–9 CrossRef CAS PubMed.
- X. H. Meng, T. Pandey, J. Jeong, S. Y. Fu, J. Yang, K. Chen, A. Singh, F. He, X. C. Xu, J. S. Zhou, W. P. Hsieh, A. K. Singh, J. F. Lin and Y. G. Wang, Phys. Rev. Lett., 2019, 122, 155901 CrossRef CAS PubMed.
- C. H. Liu, Z. Y. Wei, W. Y. Chen, K. D. Bi, J. K. Yang and Y. F. Chen, Phys. Lett. A, 2016, 380, 248–254 CrossRef CAS.
- G. Z. Qin, Z. Z. Qin, S. Y. Yue, Q. B. Yan and M. Hu, Nanoscale, 2017, 9, 7227–7234 RSC.
- C. H. Liu, Y. F. Chen and C. Dames, Phys. Rev. Appl., 2019, 11, 044002 CrossRef CAS.
- C. H. Liu, V. Mishra, Y. F. Chen and C. Dames, Adv. Theory Simul., 2018, 1, 1800098 CrossRef.
- C. H. Liu, P. Lu, Z. Z. Gu, J. K. Yang and Y. F. Chen, J. Phys. Chem. C, 2020, 124, 26144–26152 CrossRef CAS.
- M. Tachibana, T. Kolodiazhnyi and E. Takayama-Muromachi, Appl. Phys. Lett., 2008, 93, 092902 CrossRef.
- E. Langenberg, D. Saha, M. E. Holtz, J.-J. Wang, D. Bugallo, E. Ferreiro-Vila, H. Paik, I. Hanke, S. Ganschow, D. A. Muller, L.-Q. Chen, G. Catalan, N. Domingo, J. Malen, D. G. Schlom and F. Rivadulla, Nano Lett., 2019, 19, 7901–7907 CrossRef CAS PubMed.
- S. Ning, S. C. Huberman, C. Zhang, Z. Zhang, G. Chen and C. A. Ross, Phys. Rev. Appl., 2017, 8, 054049 CrossRef.
- L. Chenhan and C. Yunfei, Sci. China: Phys., Mech. Astron., 2022, 65, 117009 Search PubMed.
- C. H. Liu, Q. Fu, Z. Z. Gu and P. Lu, Phys. Chem. Chem. Phys., 2020, 22, 22016–22022 RSC.
- X. Zhao, J. C. Wu, Z. Y. Zhao, Z. Z. He, J. D. Song, J. Y. Zhao, X. G. Liu, X. F. Sun and X. G. Li, Appl. Phys. Lett., 2016, 108, 242405 CrossRef.
- I. A. Verzhbitskiy, H. Kurebayashi, H. Cheng, J. Zhou, S. Khan, Y. P. Feng and G. Eda, Nat. Electron., 2020, 3, 460–465 CrossRef CAS.
- B. Huang, G. Clark, D. R. Klein, D. MacNeill, E. Navarro-Moratalla, K. L. Seyler, N. Wilson, M. A. McGuire, D. H. Cobden, D. Xiao, W. Yao, P. Jarillo-Herrero and X. D. Xu, Nat. Nanotechnol., 2018, 13, 544–548 CrossRef CAS PubMed.
- R. Z. Xu and X. L. Zou, J. Phys. Chem. Lett., 2020, 11, 3152–3158 CrossRef CAS PubMed.
- A. McCreary, T. T. Mai, F. G. Utermohlen, J. R. Simpson, K. F. Garrity, X. Z. Feng, D. Shcherbakov, Y. L. Zhu, J. Hu, D. Weber, K. Watanabe, T. Taniguchi, J. E. Goldberger, Z. Q. Mao, C. N. Lau, Y. M. Lu, N. Trivedi, R. V. Aguilar and A. R. H. Walker, Nat. Commun., 2020, 11, 1–8 CrossRef PubMed.
- Z. Wang, I. Gutierrez-Lezama, N. Ubrig, M. Kroner, M. Gibertini, T. Taniguchi, K. Watanabe, A. Imamoglu, E. Giannini and A. F. Morpurgo, Nat. Commun., 2018, 9, 1–8 CrossRef PubMed.
- S. W. Jiang, L. Z. Li, Z. F. Wang, K. F. Mak and J. Shan, Nat. Nanotechnol., 2018, 13, 549–553 CrossRef CAS PubMed.
- X. H. Hu, Y. H. Zhao, X. D. Shen, A. V. Krasheninnikov, Z. F. Chen and L. T. Sun, ACS Appl. Mater. Interfaces, 2020, 12, 26367–26373 CrossRef CAS PubMed.
- A. M. Leon, J. W. Gonzalez, J. Mejia-Lopez, F. C. de Lima and E. S. Morell, 2D Mater., 2020, 7, 035008 CrossRef CAS.
- C. Gong, L. Li, Z. L. Li, H. W. Ji, A. Stern, Y. Xia, T. Cao, W. Bao, C. Z. Wang, Y. A. Wang, Z. Q. Qiu, R. J. Cava, S. G. Louie, J. Xia and X. Zhang, Nature, 2017, 546, 265–269 CrossRef CAS PubMed.
- Z. Y. Fei, B. Huang, P. Malinowski, W. B. Wang, T. C. Song, J. Sanchez, W. Yao, D. Xiao, X. Y. Zhu, A. F. May, W. D. Wu, D. H. Cobden, J. H. Chu and X. D. Xu, Nat. Mater., 2018, 17, 778–782 CrossRef CAS PubMed.
- A. M. Tokmachev, D. V. Averyanov, O. E. Parfenov, A. N. Taldenkov, I. A. Karateev, I. S. Sokolov, O. A. Kondratev and V. G. Storchak, Nat. Commun., 2018, 9, 1–9 CrossRef CAS PubMed.
- H. Kumar, N. C. Frey, L. Dong, B. Anasori, Y. Gogotsi and V. B. Shenoy, ACS Nano, 2017, 11, 7648–7655 CrossRef CAS PubMed.
- C. Long, T. Wang, H. Jin, H. Wang and Y. Dai, J. Phys. Chem. Lett., 2020, 11, 2158–2164 CrossRef CAS PubMed.
- B. Huang, G. Clark, E. Navarro-Moratalla, D. R. Klein, R. Cheng, K. L. Seyler, D. Zhong, E. Schmidgall, M. A. McGuire, D. H. Cobden, W. Yao, D. Xiao, P. Jarillo-Herrero and X. D. Xu, Nature, 2017, 546, 270–273 CrossRef CAS PubMed.
- G. Z. Qin, H. M. Wang, L. C. Zhang, Z. Z. Qin and M. Hu, J. Mater. Chem. C, 2020, 8, 3520–3526 RSC.
- Y. Q. Liu, Q. X. Liu, Y. Liu, X. Jiang, X. L. Zhang and J. J. Zhao, Nanoscale, 2021, 13, 7714–7722 RSC.
- M. Bonilla, S. Kolekar, Y. J. Ma, H. C. Diaz, V. Kalappattil, R. Das, T. Eggers, H. R. Gutierrez, M. H. Phan and M. Batzill, Nat. Nanotechnol., 2018, 13, 289–293 CrossRef CAS PubMed.
- X. Wang, D. A. Li, Z. J. Li, C. Z. Wu, C. M. Che, G. Chen and X. D. Cui, ACS Nano, 2021, 15, 16236–16241 CrossRef CAS PubMed.
- A. H. M. A. Wasey, S. Chakrabarty and G. P. Das, J. Appl. Phys., 2015, 117, 064313 CrossRef.
- H. R. Fuh, B. H. Yan, S. C. Wu, C. Felser and C. R. Chang, New J. Phys., 2016, 18, 113038 CrossRef.
- D. Staros, G. Hu, J. Tiihonen, R. Nanguneri, J. Krogel, M. C. Bennett, O. Heinonen, P. Ganesh and B. Rubenstein, J. Chem. Phys., 2022, 156, 014707 CrossRef CAS PubMed.
- J. W. Jiang, Nanoscale, 2014, 6, 8326–8333 RSC.
- L. Lindsay, D. A. Broido and T. L. Reinecke, Phys. Rev. Lett., 2013, 111, 025901 CrossRef CAS PubMed.
- T. G. Park, B. K. Choi, J. Park, J. Kim, Y. J. Chang and F. Rotermund, ACS Nano, 2021, 15, 7756–7764 CrossRef CAS PubMed.
- Z. Popov, N. Mikhaleva, M. Visotin, A. Kuzubov, S. Entani, H. Naramoto, S. Sakai, P. Sorokin and P. Avramov, Phys. Chem. Chem. Phys., 2016, 18, 33047–33052 RSC.
- H.-R. Fuh, C.-R. Chang, Y.-K. Wang, R. F. L. Evans, R. W. Chantrell and H.-T. Jeng, Sci. Rep., 2016, 6, 32625 CrossRef CAS PubMed.
- W. Nolting and A. Ramakanth, Quantum theory of magnetism, Springer Science & Business Media, 2009 Search PubMed.
- J. Li, X. Y. Zhang, Z. W. Chen, S. Q. Lin, W. Li, J. H. Shen, I. T. Witting, A. Faghaninia, Y. Chen, A. Jain, L. D. Chen, G. J. Snyder and Y. Z. Pei, Joule, 2018, 2, 976–987 CrossRef CAS.
- T. Wang, C. Zhang, H. Snoussi and G. Zhang, Adv. Funct. Mater., 2020, 30, 1906041 CrossRef CAS.
- W. Yu, J. Li, T. S. Herng, Z. Wang, X. Zhao, X. Chi, W. Fu, I. Abdelwahab, J. Zhou and J. Dan, Adv. Mater., 2019, 31, 1903779 CrossRef CAS PubMed.
- G. V. Pushkarev, V. G. Mazurenko, V. V. Mazurenko and D. W. Boukhvalov, Phys. Chem. Chem. Phys., 2019, 21, 22647–22653 RSC.
- P. M. Coelho, K. Nguyen Cong, M. Bonilla, S. Kolekar, M.-H. Phan, J. Avila, M. C. Asensio, I. I. Oleynik and M. Batzill, J. Phys. Chem. C, 2019, 123, 14089–14096 CrossRef CAS.
- A. O. Fumega, M. Gobbi, P. Dreher, W. Wan, C. González-Orellana, M. Peña-Díaz, C. Rogero, J. Herrero-Martín, P. Gargiani and M. Ilyn, J. Phys. Chem. C, 2019, 123, 27802–27810 CrossRef CAS.
- L. Yin, T. Berlijn, R. Juneja, L. Lindsay and D. S. Parker, Phys. Rev. B, 2022, 106, 085117 CrossRef CAS.
- X. Zhao, J. Wu, Z. Zhao, Z. He, J. Song, J. Zhao, X. Liu, X. Sun and X. Li, Appl. Phys. Lett., 2016, 108, 242405 CrossRef.
- K. Wang, W. X. Zhou, Y. A. Cheng, M. Zhang, H. Wang and G. Zhang, Nanoscale, 2021, 13, 10882–10890 RSC.
- Q. J. Li, Z. Y. Zhao, C. Fan, F. B. Zhang, H. D. Zhou, X. Zhao and X. F. Sun, Phys. Rev. B: Condens. Matter Mater. Phys., 2013, 87, 214408 CrossRef.
- X. M. Wang, C. Fan, Z. Y. Zhao, W. Tao, X. G. Liu, W. P. Ke, X. Zhao and X. F. Sun, Phys. Rev. B: Condens. Matter Mater. Phys., 2010, 82, 094405 CrossRef.
- R. Jin, Y. Onose, Y. Tokura, D. Mandrus, P. Dai and B. C. Sales, Phys. Rev. Lett., 2003, 91, 146601 CrossRef CAS PubMed.
- C. A. Pocs, I. A. Leahy, H. Zheng, G. Cao, E.-S. Choi, S. H. Do, K.-Y. Choi, B. Normand and M. Lee, Phys. Rev. Res., 2020, 2, 013059 CrossRef CAS.
- H. Q. Li, P. Zhang, T. Ouyang, H. M. Wang, J. Li, C. Y. He, C. X. Zhang and C. Tang, Appl. Phys. Lett., 2022, 120, 092403 CrossRef CAS.
- H. T. Huang, M. F. Lai, Y. F. Hou and Z. H. Wei, Nano Lett., 2015, 15, 2773–2779 CrossRef CAS PubMed.
- J. Kimling, R. B. Wilson, K. Rott, J. Kimling, G. Reiss and D. G. Cahill, Phys. Rev. B: Condens. Matter Mater. Phys., 2015, 91, 144405 CrossRef.
- H. Nakayama, B. Xu, S. Iwamoto, K. Yamamoto, R. Iguchi, A. Miura, T. Hirai, Y. Miura, Y. Sakuraba, J. Shiomi and K. Uchida, Appl. Phys. Lett., 2021, 118, 042409 CrossRef CAS.
- C. Cazorla and R. Rurali, Phys. Rev. B, 2022, 105, 104401 CrossRef CAS.
Footnote |
| † Electronic supplementary information (ESI) available. See DOI: https://doi.org/10.1039/d2nh00429a |
| This journal is © The Royal Society of Chemistry 2023 |

