 Open Access Article
Coupled transport of electrons and protons in a bacterial cytochrome c oxidase—DFT calculated properties compared to structures and spectroscopies
Louis
Noodleman
 *a,
Wen-Ge
Han Du
 a,
Duncan
McRee
 a,
Ying
Chen
 a,
Teffanie
Goh
 b and
Andreas W.
Götz
 b
b
aDepartment of Integrative Structural and Computational Biology, The Scripps Research Institute, 10550 North Torrey Pines Road, La Jolla, CA 92037, USA. E-mail: lou@scripps.edu
bSan Diego Supercomputer Center, University of California San Diego, 9500 Gilman Drive MC0505, La Jolla, CA 92093, USA
First published on 13th November 2020
Abstract
After a general introduction to the features and mechanisms of cytochrome c oxidases (CcOs) in mitochondria and aerobic bacteria, we present DFT calculated physical and spectroscopic properties for the catalytic reaction cycle compared with experimental observations in bacterial ba3 type CcO, also with comparisons/contrasts to aa3 type CcOs. The Dinuclear Complex (DNC) is the active catalytic reaction center, containing a heme a3 Fe center and a near lying Cu center (called CuB) where by successive reduction and protonation, molecular O2 is transformed to two H2O molecules, and protons are pumped from an inner region across the membrane to an outer region by transit through the CcO integral membrane protein. Structures, energies and vibrational frequencies for Fe–O and O–O modes are calculated by DFT over the catalytic cycle. The calculated DFT frequencies in the DNC of CcO are compared with measured frequencies from Resonance Raman spectroscopy to clarify the composition, geometry, and electronic structures of different intermediates through the reaction cycle, and to trace reaction pathways. X-ray structures of the resting oxidized state are analyzed with reference to the known experimental reaction chemistry and using DFT calculated structures in fitting observed electron density maps. Our calculations lead to a new proposed reaction pathway for coupling the PR → F → OH (ferryl-oxo → ferric-hydroxo) pathway to proton pumping by a water shift mechanism. Through this arc of the catalytic cycle, major shifts in pKa's of the special tyrosine and a histidine near the upper water pool activate proton transfer. Additional mechanisms for proton pumping are explored, and the role of the CuB+ (cuprous state) in controlling access to the dinuclear reaction site is proposed.
1. Introduction-overview
Cytochrome c oxidase (CcO) (Complex IV) is the terminal electron acceptor in the electron transport chain of mitochondria and of aerobic bacteria. It functions as an oxygen binding, redox driven proton pump across the mitochondrial or paraplasmic membrane, respectively. The functions, mechanisms, and kinetics of various types of CcO in various organisms ranging from aerobic bacteria to mitochondria in eukaryotic cells, including many types of mammalian cells are complex, and encompass both extensive similarities and important differences.1–6 As discussed below, CcO is part of the electron transport chain, and operates as part of a biological network of integral membrane proteins.7–12 Collectively, Complexes I–IV generate an electrochemical proton gradient which drives the synthesis of ATP.13 All cytochrome c oxidases of mitochondria (Type aa3), or in aerobic bacteria (different types aa3 or ba3) have closely related core subunits, which are the energy generating core of the system, combining redox driven catalytic cycling coupled to proton pumping in the intact membrane embedded protein complex. There are typically three different core energy subunits. Mitochondria also have a number of additional regulatory subunits. To explore the outstanding problems of mechanism and kinetics in these proteins requires a multimodal attack, including X-ray structures, spectroscopies, kinetics, physical properties, and theory/calculations. Our goal is to use quantum chemistry as a unifying framework for exploring important features of geometric and electronic structure throughout the catalytic reaction cycle, encompassing structures, energetics, dynamics, and spectroscopy, relating these to proton pumping mechanisms as well. We will look at one particular bacterial cytochrome c oxidase in detail, cytochrome ba3 from Thermus thermophilus (Tt).142. Mapping system structures, active elements, and pathways
2.1. Defining the paths and linkages of electron and proton transport through the electron transport chain in mitochondria and aerobic bacteria
The transport of electrons through the electron transport chain common to mammalian mitochondria and aerobic bacteria occurs using mobile electron and proton carriers interacting with the integral membrane Complexes I, II, III, IV (see Fig. 1) embedded in the mitochondrial inner membrane or the periplasmic membrane in aerobic bacteria.13 The linkage between these electron carriers and the integral membrane protein Complexes allows proton pumping to occur across the membrane, which lead to the build-up of a transmembrane electrochemical potential. This transmembrane potential difference is the source of most biological energy in the form of ATP. Protons entering the inside of the inner membrane from the outside pass through a rotor in the integral membrane protein Complex V (ATP Synthase) and ATP is synthesized from ADP and inorganic phosphate (Pi) driven by the transmembrane electrochemical potential.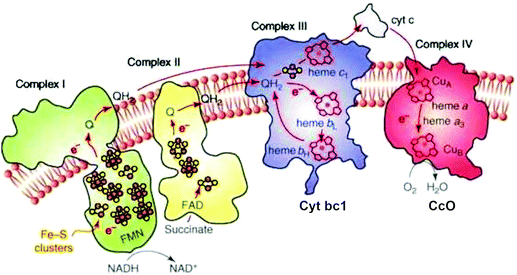 | ||
| Fig. 1 Schematic of the four integral membrane protein complexes I–IV in the electron transport chain in mitochondria. Reprint with permission from Fig. 1 of ref. 13, copyright© 2008 Elsevier. | ||
In the electron transport chain, there are two types of mobile carriers. Reduced ubiquinone (called QH2) is a relatively small amphiphilic organic cofactor that carries two electrons and two protons (2e−, 2H+). By contrast, cytochrome c is a mobile protein carrier of single electrons (1e−) only. Reduced ubiquinone is generated from the oxidized form by loss of (2e−, H+) from reduced NADH in the catalytic process NADH → NAD+ + 2e− + H+ in Complex I. Complex I also pumps protons across the membrane by a complicated electron linked proton transfer process. Complex II also generates QH2 from the oxidized form Q. Further along the electron transport chain, Complex III delivers electrons one at a time to the mobile metalloprotein cytochrome c, Cytc(ox) + 1e− → Cytc(red), for the oxidized (heme Fe3+) and reduced (heme Fe2+) forms respectively.
2.2. A comparison of two integral membrane proteins—complexes III and IV
While all of these complexes contribute to generating the membrane potential, and all but Complex II pump protons across the inner membrane, our focus here is on Complex IV, cytochrome c oxidase (CcO) in two relevant types, aa3 (A-type, found in mitochondria and in some aerobic bacteria), and ba3 (B-type, found in other aerobic bacteria, which will be our main focus).In the presence of these complicated biological networks, it is very helpful to compare and contrast different systems. A conceptually and historically important comparison and contrast is between Complex III and Complex IV.
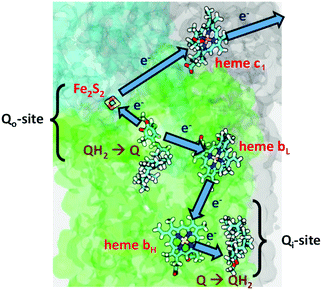
In Complex III (Cytochrome bc1), the redox and proton transfer cycle is called Mitchell's Proton Motive Q Cycle. It is a “Redox Loop Mechanism” with an internal mobile carrier ubiquinone, and large scale movements of membrane domains, in particular, the Rieske iron–sulfur cluster protein fragment, with the Fe2S2 cluster and nearby amino acid residues called the head group.15
The overall full cycle stoichiometry is
| 2QH2(outer) + Q(inner) + (2H+)in → 2Q(outer) + (2e−)out + (4H+)out + QH2(inner) | (1) |
There are two cycles in series where two separate QH2(outer) enter the protein, to pump (4H+ + 2e−) out, reduce two oxidized cytochrome c (Cytc) by 1e− each, and where Q(inner) picks up 2e− total from two cycles of QH2(outer), and 2Hin+ from the inside (n side, negative (−)) of the membrane. Outer means near the Qo binding site within the protein, toward the positive outer side of the membrane (p side), while inner means near the Qi binding site within the protein, near the negative inner side of the membrane (n side).
| (Cycle 1): QH2(outer) + Q(inner) → Q(outer) + (2H+)out + Q˙−(inner) + (1e−)out | (2) |
| (Cycle 2): QH2(outer) + Q˙−(inner) + 2Hin+ → Q(outer) + QH2(inner) + (2H+)out + (1e−)out | (3) |
The one Full Cycle (eqn (1)) is the sum of the two asymmetric Cycles 1 and 2 depicted below it. The molecule Q˙−(inner) is the semiquinone radical anion that is a common intermediate linking these cycles. Although it is not in the cycles summarized above, Q˙−(outer) is an unstable intermediate which facilitates the bifurcation of electron flow via heme bL. It is a product of the QH2(outer) oxidation and deprotonation which occurs through the interaction with the Rieske Fe2S2 cluster protein.
Fig. 2 depicts the electron transfers in more detail, but not the proton paths. The figure is schematic, and does not show the major conformational shift of the Fe2S2 head group moving to dock with the cytochrome c1 binding site.16–19
Anticipating our later discussion of CcO, the mechanism of CcO differs from that of Cyt bc1 in a number of important ways. In Cyt bc1, there is an internal mobile carrier of electrons and protons, QH2, which can move both within the membrane and within the protein forming two pools and having two binding sites labelled Qo and Qi, for electron and proton transfer. There is a bifurcation (splitting) of electron transfer pathways between an upper pathway, and a lower pathway, which occurs near Qo. As mentioned before, there is extensive mobility of the iron–sulfur fragment subunit. By contrast, in CcO, there are no mobile carrier molecules for electrons or protons; all electron and proton transfers are through the protein and water network, and all mobility involves either water or protein sidechains and backbone movements. The conformational changes are smaller, where present. The electron transfer path starts with 1e− transfer from cytochrome c, which was reduced by Cyt bc1. The subsequent electron transfer pathway is unidirectional, forming an approximate L shaped pathway from the CuA site (a copper-dimer complex) to heme a (or heme b) Fe to the heme a3 Fe, and then terminating in the CuB site. In CcO's, there is a splitting in proton pathways, which is, in part, a consequence of the difference between the so-called chemical protons, which react with electrons and bound oxygen species to finally produce water, and the pathways of pumped protons. There are also significant differences between the two families of CcO, the A-Family versus the B-Family.
2.3. Cytochrome c oxidases—similarities in the catalytic cycle, differences in the proton pumping and reaction pathways of ba3 (B-Family) vs. aa3 (A-Family)
In Fig. 3, we present a structural map of the overall path of reactants and products for the ba3 type (B-Family) of CcOs, specifically for the protein from Tt.14,20–23 The heme b and its Feb is not seen in Fig. 3, since it lies behind the dinuclear center CuB–Fea3–heme in this perspective. The positioning of heme a in aa3 CcO is similar.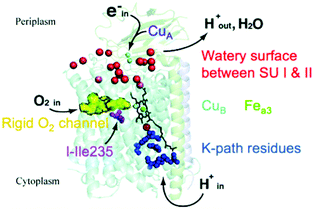 | ||
| Fig. 3 Schematic of cytochrome ba3 with noted functionalities. SU is subunit. Reprint with permission from Fig. 1 of ref. 24, https://pubs.acs.org/doi/10.1021/ic500363h, copyright© 2014 American Chemical Society (further permissions for reusing this figure should be directed to the ACS). | ||
The mechanism for the chemical reaction
| O2 + 4e− + 4Hin+ → 2H2O | (4) |
| O2 + 4e− + (4 + n)Hin+ → 2H2O + nHout+ | (5) |
Differences in proton pathways between aa3 Class27–32 (in mitochondria and in aerobic bacteria) versus ba3 Class14,20–23 (in other aerobic bacteria) are depicted in Fig. 4, showing these protein structures with the different proton paths superimposed, D and K Path in aa3, versus KB path, also called the K analogue path, in ba3. The different subunits are shown in purple (Subunit I) and yellow (Subunit II). The K-input path in aa3 (Rhodobacter sphaeroides)28 is named for a lysine (K362) along that pathway. In Tt ba3, there is no similar structural lysine present in the KB pathway, although there are other similar features, like the glutamic acid at the entrance, and the proton pathway exit point at a special tyrosine (Y288 in aa3 and Y237 in ba3). A more dramatic difference is the presence of a hydrophilic pathway with a line of waters (green) and a number of hydrophilic or charged residue sidechains in aa3 from R. sphaeroides, in contrast to the absence of this pathway in ba3 from Tt. Also, the position of the important and often charged glutamic acid (E286) in aa3 (R. sphaeroides) (Fig. 4) is structurally fairly homologous to that of the nonpolar isoleucine (I-Ile235) in ba3 (Tt) (Fig. 3).
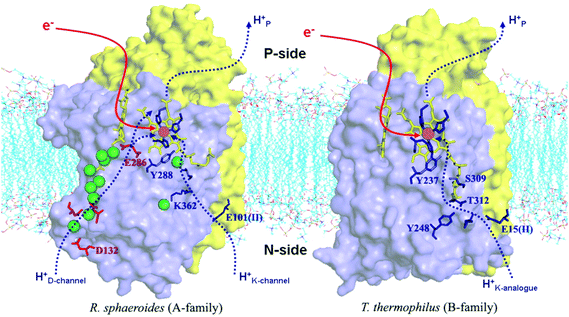 | ||
| Fig. 4 Comparison of the proton delivery pathways for the A- and B-types CcO's. Reprint with permission from Fig. 3 of ref. 33, H. Y. Chang, et al. 2009. | ||
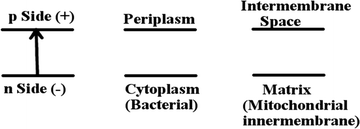
There is value in performing some simple bookkeeping analysis of differences in proton transport pathways in the different forms of CcO, aa3 Type vs. ba3 Type. First, we show a simple schematic Fig. 5 of the electrochemical potential difference (mainly a difference in the electrostatic potential) across the membrane. This is useful for clarity of language, and to show directionality of the potential across the membrane. The inside of the membrane is the n side (negative potential, −) while the outside is the p side (positive, +). Referring back to Fig. 3 and eqn (4) and (5), both the chemical reaction, where the electrons and protons react and combine with O2 (eqn (4)), and the proton pumping (eqn (5)) contribute proportionately (ratio 4![[thin space (1/6-em)]](https://www.rsc.org/images/entities/char_2009.gif) :
:![[thin space (1/6-em)]](https://www.rsc.org/images/entities/char_2009.gif) n charges) to the overall electrostatic potential (proportional to (4 + n) charges translocated). The reacting protons are called the Chemical (C) protons while the protons that are pumped are the Vector (V) protons.
n charges) to the overall electrostatic potential (proportional to (4 + n) charges translocated). The reacting protons are called the Chemical (C) protons while the protons that are pumped are the Vector (V) protons.
Table 1 shows the different sources of protons for chemical reaction (C) versus protons shuttled into the pumping pathways (V). This is a condensation of observations based on electrometry and kinetics with and without ionophores on lipid vesicles with embedded proteins, and also utilizing mutagenesis to sort out proton transfer pathways. Clearly, large differences exist here between aa3 type and ba3 type. The ba3 type has only one type of pathway in (K Path), which must account for both the Chemical protons entry into the reaction area (called the “reaction chamber”), and for the Vector protons to be pumped. There must be a bifurcation point (or region), where these pathways split. By contrast, the aa3 type has two different paths in, K and D. The K path analogue in ba3 must do all the work of supplying both the 4 Chemical and 2 to 4 Vector protons. By contrast, the experimental evidence available indicates that the K path makes a smaller (2 proton) contribution to the overall chemical reaction, and none at all to the proton pumping in aa3. In aa3, the mechanism of the D pathway remains a matter of controversy. Further, in the mitochondrial protein, as found in eukaryotes, there is also a proposed H pathway, which may do some or all of the proton pumping in place of the D path in aa3 type bacteria.
| Types | Chemical (C) | Vector (V) | Total over paths |
|---|---|---|---|
| aa 3 Type (bacterial and mitochondrial) | |||
| K path | 2 | 0 | 2 |
| D path | 2 | 4 | 6 |
| All paths | 4 | 4 | 8 |
| ba 3 Type (bacterial) | |||
| K path | 4 | 2–4 | 6–8 |
| D path | 0 | 0 | 0 |
| All paths | 4 | 2–4 | 6–8 |
2.4. Distinctive features of ba3 in spectroscopy and kinetics
For our purposes, it will be sufficient to explore some aspects of the chemical catalytic reaction cycle pathways, and potential mechanisms of proton pumping in the ba3 type from Tt, and to draw some comparisons and contrasts with aa3 type CcO's. In addition to the greater simplicity inherent in having all protons come in through the K pathway, there is a practical experimental advantage in tracing the reaction kinetics. In both aa3 and ba3 types, the electron pathway proceeds by 1e− transfer from cytochrome c (reduced, Fe2+, Cyt c), first to the CuA Complex (containing a 2Cu dimer), and then to an Fe heme b (in ba3) or heme a (in aa3) and on to the dinuclear (DNC) (also called binuclear BNC) Complex, containing an Fea3 heme closely associated with a CuB-(His)3 unit. The Fe heme b versus Fe heme a3 difference makes it easier to distinguish by optical difference spectroscopy between reduction of Febversus Fea3, while these bands are overlapping in Feaversus Fea3.2.5. Catalytic reaction cycle of CcO
The catalytic reaction cycle of the Dinuclear Complex (DNC) is depicted in Fig. 6. We include important intermediate states that have been identified spectroscopically as well as others that have been proposed linking observed states.34 To explore this cycle, we begin with State R, the reduced state, where Fea3 and CuB have respective oxidation states, Fe2+ and Cu+. For the entire CcO protein to be in the fully reduced state, the other metal centers also must be reduced. For CuA, the reduced copper dimer state is then Cu+–Cu+. The corresponding oxidized state is the unusual delocalized mixed valence dimer, Cu1.5+–Cu1.5+. The other mononuclear heme Fe center (either heme b or heme a depending on CcO type) has reduced state Fe2+ and is low spin S = 0. Both CuA and the mononuclear Fe are 1e− donors to the DNC, so there is a net of 4 electrons available to carry out the catalytic 4e− reduction of O2 to 2H2O in eqn (4) (or eqn (5)). We will refer to the mononuclear heme Fe center and CuA pair as Fe/CuA. The reaction cycle commences by coordination of O2 to Fea3 to form the adduct state A. The cycle then progresses quickly through the proposed Peroxo and Hydroperoxo states to the experimentally identified states PM/PR and further to state F. O2 has already been reduced by four electrons in states PM/PR, with three electrons provided by Fea3 and CuB and one electron provided by the special tyrosine in state PM, while one electron has been replenished from Fe/CuA in state PR. One chemical proton has been taken up at this point and uptake of a second chemical proton leads to state F. The subsequent reduction of the heme a3 ferryl-oxo complex via another electron from Fe/CuA and uptake of another proton is significantly slower and leads to active cycling oxidized state OHvia the postulated intermediate state FH. In summary, at this point, consumption of the 4 available electrons to reduce O2 results in the active cycling oxidized State OH. To continue cycling, two electrons must be delivered from Cytc to the DNC to reduce Fea3 and CuB transiting via CuA/Fe, and soon after two more electrons total from Cytc are needed at Fe/CuA to regenerate the fully reduced State R. Up to 4 vectorial protons are pumped across the membrane during the reaction cycle. The reaction cycle intermediates observed spectroscopically were characterized by optical difference spectroscopy35 and by Resonance Raman (RR) spectroscopy,36 but the detailed active site structures were only partly established this way. In the figure, the kinetic rate constants were taken from Einarsdottir's kinetics study using optical difference spectroscopy on the ba3 form of CcO from Tt,35while the RR frequencies presented are for Fe–O stretch vibrations for aa3 type from bovine mitochondria.37–52 For ba3, the corresponding RR spectra have not been done, but the catalytic mechanism and intermediates should be similar. The kinetics of ba3 are known to be different in detail from that in aa3 bacterial proteins and mitochondrial proteins by optical difference spectroscopy. One main difference is that the O2 binding affinity and rate constant are higher in ba3 than aa3. For proton transfers, the redox, oxygen binding species, and protonation states of intermediates are clearer than the detailed sequence and timing of pumping events, which also differ between ba3 and aa3.35 The mechanisms and reaction energetics (and kinetics) of proton transfer both within the catalytic cycle and for proton pumping have considerable uncertainties.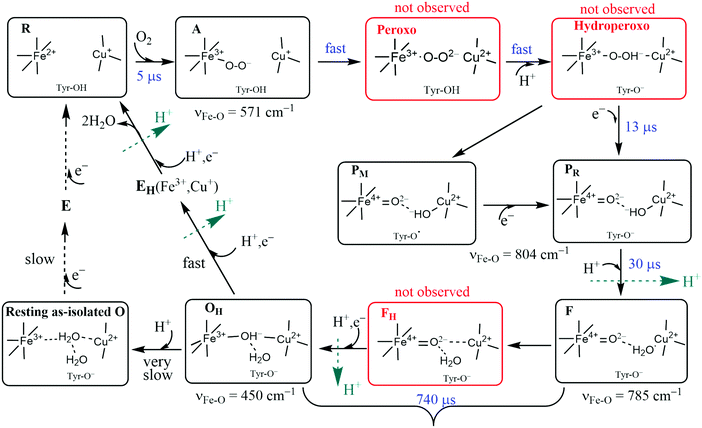 | ||
| Fig. 6 Feasible intermediate states of the DNC in the catalytic cycle, in which A, PM/PR, F, and OH were identified by resonance Raman experiments on A-type oxidases,37–52 and their DNC's are likely in the forms presented above. Although the Peroxo, Hydroperoxo, and FH states (drawn in red frames) were not observed experimentally, they may exist for a short time. Tyr is the special Y288 in aa3 and Y237 in ba3. | ||
In Table 2, we summarize known mechanisms for proton and electron transport in redox active proteins. Since both protons and electrons are quantum objects, both can exhibit tunneling through proteins by covalent pathways, by hydrogen bonded pathways, and also through space, the last with much more difficulty. The ranges quoted reflect the shorter tunneling range of protons, which are about 1800 times as massive as electrons. This tunneling is through barriers, but there are also adiabatic (bonded) pathways for electrons, and normal barrier transits for proton transfers. Both electrons and protons can be carried on mobile carriers like ubiquinone, and protons can be transferred by movement and protonation/deprotonation of amino acid side chains, or carried on water as H3O+ or OH−. Further, chains of waters and amino acid sidechains can perform effective fast long range proton transfer by concerted or partly coordinated proton transfers along a hydrogen bonded chain, as first proposed by Grotthuss.53 The more concerted form of this process requires a very ordered chain of H-bonded units, and a set of low barriers that can be only imperfectly attained in most biological systems. All of these different mechanisms need to be considered in redox driven proton pumps like CcO and Cytochrome bc1.
| The variety of electron and proton transport in proteins and membranes | |
|---|---|
| • Electron tunneling – max range about 11–14 Å | • Proton tunneling – max range about 1 Å |
| • Electron transport on mobile carrier | • Proton transport on mobile carrier |
| • Proton transport on amino acid sidechain | |
| • Proton transport by diffusion on water (H2O as carrier) | |
| • Grotthuss process53 – fast proton transfer along chains of water molecules, also in combination with amino acid sidechains (Bucket Brigade mechanism) | |
3. DFT methods, directions, and applications
3.1. DFT electronic structure and geometry optimization
The starting geometries for electronic and geometry optimization for the DNC intermediate states are based on the ba3 CcO X-ray crystal structure 3S8G14 for the “resting oxidized as-isolated” state.24,54–60 These atom arrangements and geometries are altered to those proposed for the various states of the catalytic cycle based on what is known from spectroscopies and kinetics, with subsequent geometry optimization and further exploration of alternative structures. The geometry optimizations are performed using the ADF61–63 codes with the spin-polarized broken-symmetry method.64–66 Different DFT functionals like PW91, B3LYP, B3LYP*, OPBE, and OLYP have been tested in our earlier work (see Section 3.9).24,34 While the OLYP-D3-BJ exchange–correlation potential with dispersion correction (D3-BJ force field)67 has been used in our recent studies,58–60 together with the triple-ξ-polarization (TZP) Slater type basis sets on the metals, and DZP (double-ξ-polarization) on all other atoms, and with the COSMO68–71 solvation model for the outer environment with dielectric constant (ε = 18.5), reflecting considerable polarity as found in the remaining protein complex and solvent outside the quantum cluster region. For some states of the catalytic cycle in our vibrational frequency calculations,59 we have added energy corrections for spin-projection effects using the Yamaguchi equation,72–74 but we have not tried to incorporate these into our very recent resting as-isolated State O calculations;60 we think that effects there will prove to be small, since the spin coupling between Fe2+,3+ and Cu2+ in those geometries is small.Fig. 7 gives our geometry optimized quantum cluster model for State A,59 the ferric-superoxide complex of the DNC, formed upon binding of molecular oxygen to the ferrous Fe2+ in State R which can be compared to the schematic form in Fig. 6. Notice also that Cu is in the reduced cuprous redox state, Cu+, which affects the subsequent reaction path.
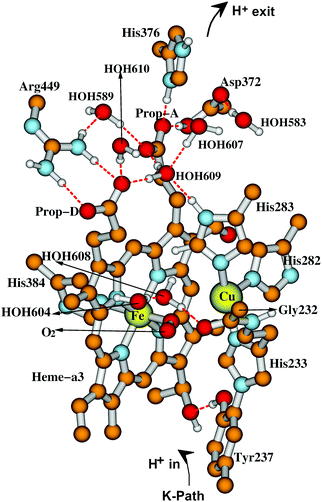 | ||
| Fig. 7 Our quantum cluster model for state A of the DNC, built from the X-ray crystal structure 3S8G of ba3 CcO from Tt.14 For more visibility, some apolar or link H atoms are not shown on the picture. Taken with permission from Fig. 3 of ref. 59, copyright© 2019 American Chemical Society. | ||
As already suggested in Fig. 6, for a good representation of the catalytic cycle, different binding states of oxygen species, different Fe and Cu redox states in the DNC, different protonation states (also tautomeric states), and different water locations must be evaluated. The presence of water as both a medium useful for stabilization of states and transit, and also as a reaction product introduces further essential complexities. As depicted in Fig. 7, Tyr237 in Tt ba3 (and the structurally homologous Tyr288 in aa3 enzymes) is special; the Tyr phenol is covalently linked to the His233 sidechain ring via a C–N covalent bond, and the His ring is a ligand to CuB. This linkage is universal in aa3 and ba3 CcO's and unique from all other metalloenzymes. At this point, we reflect also on the combination of different redox states and protonation states accessible for amino acid sidechains in CcO. For the special tyrosine, there are three states Tyr–O˙ (neutral radical), Tyr–O− (anion), and Tyr–OH (neutral protonated). The Tyr–O is also the end of the K pathway for protons. For other residues, we will see later that there is a potentially redox active tryptophan with states Trp (neutral) and Trp˙+ (radical cation). Histidine is usually considered to have three states His(neutral, protonated at δ), His(neutral, protonated at ε), and His+(cation, protonated at both). However, when bonded to a high oxidation state metal Cu2+, the His− (anion) state is also possible.
Turning now to the Fea3 sites, in addition to the relevant redox states Fe2+, Fe3+, Fe4+, there are different site spin states possible: high-spin (HS), intermediate-spin (IS), and low-spin (LS). For CuB, the redox states cycle between Cu+ and Cu2+ and connect to the linked redox and protonation states of the special His-Tyr pair.
3.2. Vibrational frequencies
For vibrational frequency calculations,59 we used two different complementary methods at the geometry optimized structures.61 From the original cluster model of about 200 atoms, we compute a partial Hessian (about 110 atoms) using analytic frequency calculations in the region surrounding the FeCu center, excluding atoms in the upper cluster region (Arg449, His376, Asp372, and four upper waters) plus two waters that are shifted up HOH604 and HOH608 in the intermediate states F, FH, and OH. We have also done comparative calculations with the numerical mobile block Hessian method,75,76 where the residue sidechains in the upper region and nearby waters are treated as individual mobile blocks. Both methods yield very similar vibrational frequencies for Fe–O stretching modes, and also for O–O or O–Fe–Por bending modes.3.3. Recent DFT work on ba3 in comparison with experimental spectroscopy (resonance Raman): Fe–O and O–O geometries versus stretch frequencies
In Fig. 8, we report a graph comparing calculated versus experimentally observed Resonance Raman frequencies for Fea3–O stretching frequencies over intermediate states of the catalytic cycle.59 In Fig. 9, we explore the accuracy of an old empirical correlation for bond lengths versus frequencies, called Badger's rule77 applied to examining Fe–O bond lengths versus stretch frequencies. We find that this correlation is very good and reliable based on our calculations. Also, Fig. 10 shows that the calculated O–O stretch frequencies correlate very well, linearly, with the O–O bond length; Fig. 11 shows that these same frequencies correlate similarly well with the calculated Mayer Bond Order.78 There are only a few structures in the cycle which have intact O–O bonds, but the frequencies for superoxide O–O in State A, and O–O in our Peroxo structure match those in related synthetic systems79–82 very well (see the discussion below).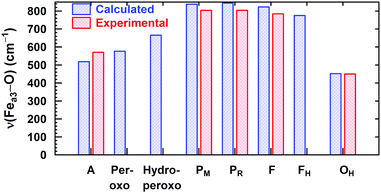 | ||
| Fig. 8 Calculated vs. available experimental Fea3–O vibrational stretching modes for the DNC intermediate states. Reprinted with permission from ref. 59, copyright© 2019 American Chemical Society. | ||
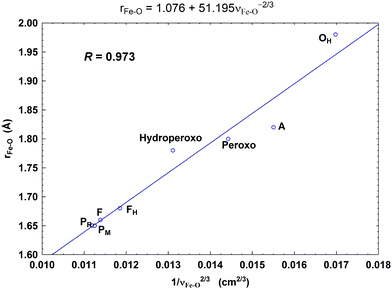 | ||
| Fig. 9 Correlation between the calculated Fea3–O bond lengths (rFe–O, Å) and the corresponding Fea3–O stretch frequencies (1/νFe–O2/3, based on Badger's rule) for the eight DNC state structures studied.59 Reprint with permission from Fig. 7 of ref. 59, copyright© 2019 American Chemical Society. | ||
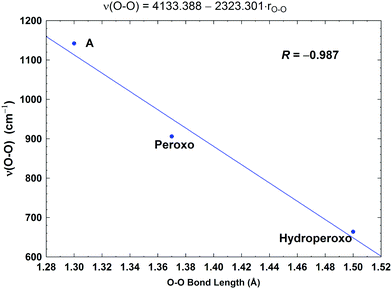 | ||
| Fig. 10 Correlation between the calculated O–O stretching frequencies (ν(O–O), cm−1) and the O–O bond lengths (rO–O, Å). Taken with permission from Fig. 6 of ref. 59, copyright© 2019 American Chemical Society. | ||
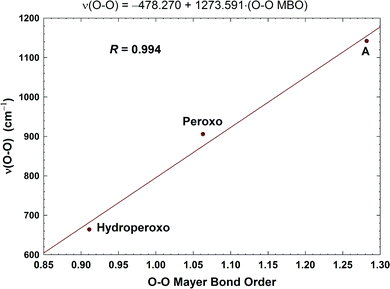 | ||
| Fig. 11 Correlation between the calculated O–O stretching frequencies (cm−1) and the Mayer O–O bond orders (MBO). Taken with permission from Fig. 6 of ref. 59, copyright© 2019 American Chemical Society. | ||
Starting from a map of the basic catalytic cycle (Fig. 6), we consider the changes in Fe–O bonding, and O–O bonding where present over the cycle.59 Beginning with the fully reduced State R (HS Fe2+ and Cu+), when molecular oxygen binds (O2 triplet, S = 1 spin state), the bound state is formally an iron-oxygen adduct (State A), but the electronic structure is closer to that of ferric LS Fe3+ bonded to superoxide radical anion O2˙−. The bonding represents a balance between a partial bond broken in O2, from loss of part of the O![[double bond, length as m-dash]](https://www.rsc.org/images/entities/char_e001.gif) O π bond, and the energy gained from one electron transfer from Fe2+ to O
O π bond, and the energy gained from one electron transfer from Fe2+ to O![[double bond, length as m-dash]](https://www.rsc.org/images/entities/char_e001.gif) O, plus the bonding energy from the forming σ-π hybrid to the Fe(3d) shell. The strong ligand field from O2− binding changes the Fe3+ spin state from HS → LS, and this also affects the Fe–O stretch frequency. The O2 binds in a bent end-on structure, and this description is very much like the bonding in oxymyoglobin (oxy-Mb).83,84 The calculated Fe–O frequencies in oxy-Mb are similar to those predicted in State A of CcO, and the experimental frequencies are also very similar between the two Fe metalloproteins (∼570 cm−1).37–44,85–87 The predicted Fe–O frequencies are in both cases less than the experimental frequencies by about 10% (50 cm−1) out of about 570 cm−1. This is the largest deviation in calculations from experiment for all Fe–O bonding species observed throughout the catalytic cycle. We also have excellent predictions for the O–O bond frequency in State A of CcO, but here the experimental data available are for synthetic porphyrin systems.79,88–91
O, plus the bonding energy from the forming σ-π hybrid to the Fe(3d) shell. The strong ligand field from O2− binding changes the Fe3+ spin state from HS → LS, and this also affects the Fe–O stretch frequency. The O2 binds in a bent end-on structure, and this description is very much like the bonding in oxymyoglobin (oxy-Mb).83,84 The calculated Fe–O frequencies in oxy-Mb are similar to those predicted in State A of CcO, and the experimental frequencies are also very similar between the two Fe metalloproteins (∼570 cm−1).37–44,85–87 The predicted Fe–O frequencies are in both cases less than the experimental frequencies by about 10% (50 cm−1) out of about 570 cm−1. This is the largest deviation in calculations from experiment for all Fe–O bonding species observed throughout the catalytic cycle. We also have excellent predictions for the O–O bond frequency in State A of CcO, but here the experimental data available are for synthetic porphyrin systems.79,88–91
After formation of State A, one electron transfer from Cu+ to Fe3+ bound superoxide leads to very fast steps that have not been directly seen either by optical difference spectroscopy or RR spectroscopy. We have calculated in sequence a Peroxo bridging state after 1e− transfer, and then a Hydroperoxo state following protonation. The Hydroperoxo state is probable, and the proton is thought to originate from the protonated Tyr237. For the Peroxo state, it is not evident if the bridging structure is formed before the following proton transfer occurs. In a structurally analogous synthetic Fe3+–O22−–Cu2+ complex, the measured O–O stretch frequency (870 cm−1) is close to the one we calculated (906 cm−1, 4% deviation).82 However, in the CcO protein, the initial O atom coordination to Cu could be looser, and the 1e− and 1H+ transfers may even occur concertedly. The proton position on the oxygen nearer the Cu2+ is needed for the next reaction steps. For the rapid cleavage of the O–O σ bond, one electron is transferred from Fe3+ to make the ferryl-oxo, Fe4+![[double bond, length as m-dash]](https://www.rsc.org/images/entities/char_e001.gif) O2−, while the other electron can come either from the Tyr237 by through-bond electron transfer to make State PM, or directly from the mononuclear heme b Fe2+ (equivalently from heme a Fe in aa3) to produce State PR. (If PM, the Tyr˙ radical state, is generated first, the next electron transfer to make PR again comes from Feb). In State PR, the bridge has the form of Fe4+
O2−, while the other electron can come either from the Tyr237 by through-bond electron transfer to make State PM, or directly from the mononuclear heme b Fe2+ (equivalently from heme a Fe in aa3) to produce State PR. (If PM, the Tyr˙ radical state, is generated first, the next electron transfer to make PR again comes from Feb). In State PR, the bridge has the form of Fe4+![[double bond, length as m-dash]](https://www.rsc.org/images/entities/char_e001.gif) O2− coordinated by a hydrogen bond to OH−–Cu2+. After the OH− is protonated, this changes to State F, and the Fe–O stretch frequency decreases by about 20 cm−1 in the experimental RR data from 804 cm−1 to 785 cm−1.45,47–52,92 A similar frequency shift is found in the DFT calculations, from 844 cm−1 to 823 cm−1 (5% deviation from experiment for the frequencies).59 There is a slight DFT calculated lengthening (+0.01 Å) of the Fe–O bond, but it is probably more important that the Fe4+
O2− coordinated by a hydrogen bond to OH−–Cu2+. After the OH− is protonated, this changes to State F, and the Fe–O stretch frequency decreases by about 20 cm−1 in the experimental RR data from 804 cm−1 to 785 cm−1.45,47–52,92 A similar frequency shift is found in the DFT calculations, from 844 cm−1 to 823 cm−1 (5% deviation from experiment for the frequencies).59 There is a slight DFT calculated lengthening (+0.01 Å) of the Fe–O bond, but it is probably more important that the Fe4+![[double bond, length as m-dash]](https://www.rsc.org/images/entities/char_e001.gif) O2−⋯H2O–Cu2+ hydrogen bond shortens (from 2.67 Å to 2.52 Å, calculated), and strengthens with H2O–Cu2+ coordination compared to OH−–Cu2+, consistent with a stronger electrostatic interaction. This shows that the Fe–O stretch frequency can reflect moderate local interactions in addition to the direct Fe–O bond length correlation.
O2−⋯H2O–Cu2+ hydrogen bond shortens (from 2.67 Å to 2.52 Å, calculated), and strengthens with H2O–Cu2+ coordination compared to OH−–Cu2+, consistent with a stronger electrostatic interaction. This shows that the Fe–O stretch frequency can reflect moderate local interactions in addition to the direct Fe–O bond length correlation.
The Fe–O vibrational frequency undergoes a major downshift (to 450 cm−1, experimental)50 when a (1e−, 1H+) addition to the active site (1e− coming from the heme b Fe, and 1H+ from the K pathway) produces the State OH, which is the active oxidized state ready for further cycling. This corresponds to a much longer Fe3+–O bond. We calculate a nearly symmetric Fe3+–OH−–Cu2+ geometry, with Fe–O, Cu–O distances of 1.98 Å and 1.99 Å found for HS-Fe3+. The bridging OH− group is hydrogen bonded to a water molecule that lies outside the line between Fe–OH−–Cu, allowing the near symmetric bridge. With the OLYP-D3-BJ potential, the IS-Fe3+ state is calculated lower in energy than HS-Fe3+ by 7 kcal mol−1, and has a very similar active site geometry (see Supporting information, Table S1 in Han Du, IC 2020).60
In this paper,60 we used a larger basis set TZP on all atoms. The geometries are similar to those with the smaller basis set. We very recently recalculated the OH(Fe–OH−–Cu) state vibrational frequencies. The Fe–O frequencies decrease by about 25 to 30 cm−1. The Fe–O stretch frequency is clearer in the HS-Fe3+ than in the IS-Fe3+ state, where there is more extensive mixing of Fe–O stretching with Fe–O bend modes and Fe–porphyrin modes. In both cases, the calculated frequencies are similar, for HS, Fe–O frequency 423 cm−1, and for IS, we identified a mode with some Fe–O stretch character at 413 cm−1. In earlier experimental work, Rousseau ruled out the LS Fe3+–OH− state because he expected a high Fe–O stretch frequency.50 Our calculations further support this result, with calculated LS Fe–O distance of 1.88 Å, and a high calculated stretch frequency of 514 cm−1 (14% deviation from exp.) for LS, versus (6%) for HS, and (8%) for IS. The LS state is also higher in energy than both the HS and IS states. Also, we wanted to evaluate whether a state of composition FeHS,3+–OH−⋯H2O–Cu2+ with a bridging hydroxyl–water hydrogen bond, and with the H2O coordinated to Cu2+ is feasible for State OH, since it has a similar Fe–O bond distance. Several Fe–O–H vibrational modes are obtained in the region 408–437 cm−1, still in good agreement with exp. 450 cm−1. However, the hydroxyl–water bridge state energetically lies well above the corresponding OH(Fe–OH−–Cu) structure, in which the bridging OH− has H-bonding interaction with an outer water molecule (see ref. 60 and Supporting material). We have paid close attention to State OH because it is an essential oxidized state for continued cycling, and also because of the contrast with the resting oxidized state, which is the oxidized state structurally characterized by synchrotron or X-ray Free Electron Laser (XFEL) structures.
3.4. The pathway from PR → F → OH
While exploring the reaction pathway from PR → F → OH, we found a probable proton pumping pathway using a water shift mechanism.58Fig. 12 displays relevant structures before a shift up of a water dimer (abeled HOH604, HOH608) from a hydrogen bonding position to the OH− (State PR) or H2O (State F) ligand on CuB2+ into the upper water pool adjacent to His376 (neutral or protonated cation). Fig. 13 presents a schematic of the entire reaction pathway from PR → F → OH including the initiation of the pumping process by proton loss from His376-H+. The important features of this detailed mechanism are: (1) proton transfers by H+ uptake from the K path onto Tyr237 and from there to the OH−–CuB2+ are needed to allow the water dimer shift to occur; (2) there is then an energetically favorable proton uptake by Tyr237−, in the transition c → d; (3) both the H2O–CuB2+ and neutral Tyr237 need to be present, and are energetically favored before the water dimer shift occurs with a small energy cost, calculated ΔG = +4.2 kcal mol−1. The calculated pKa shift of His376+ before and after the water dimer shift is large, from 12.2 to 6.5, ΔpKa = 5.7 equivalent to a relative ΔG = 7.8 kcal mol−1. Following the reaction pathway from d → e → f, after the proton loss from H376+, a subsequent proton transfer from Tyr376 (neutral) is favorable. It is important that the Tyr237 (neutral, protonated) does not lose its proton by back leakage into the K pathway after the water shift, because that water shift also lowers the pKa of Tyr237 strongly, from pKa = 11.0 to 5.5 when His376 is protonated. A general problem of this type has been considered by other groups. Knapp and coworkers have proposed, based on electrostatics and dynamics modeling, that when the Tyr237 is protonated (Y237-OH), the hydrogen bonded pathway (a Grotthuss type pathway) in the K path is broken so that backflow is inhibited.93 This appears reasonable as it stands, but there is considerably more to learn about the K path proton transfer mechanism both in ba3 and aa3 types of CcO.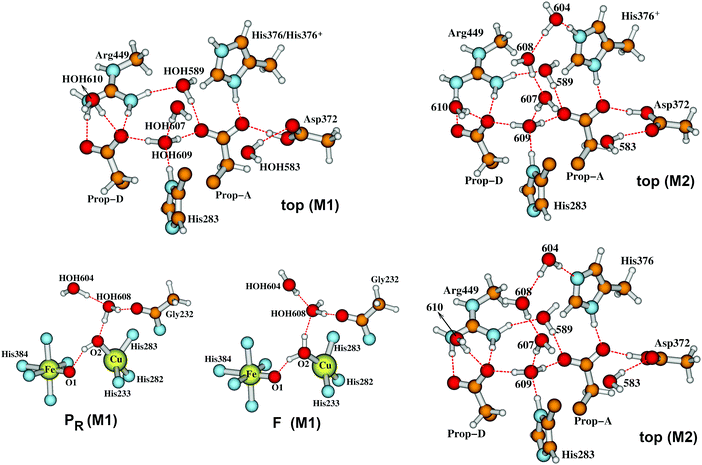 | ||
| Fig. 12 In our Model 1 (M1),58 the two water molecules HOH604 and HOH608 are within the DNC as observed in the X-ray crystal structure 3S8G.14 The size of our DNC model clusters are the same as state A shown in Fig. 7. A clearer view of the top portion of the cluster (top M1) and the central portions of states PR and F are given here. In Model 2 (M2), the two water molecules HOH604 and HOH608 are shifted to the upper part of the DNC to the positions as shown on the upper-right (top M2) for protonated His376-H+ and lower-right (top M2) for neutral His376 cases.58 | ||
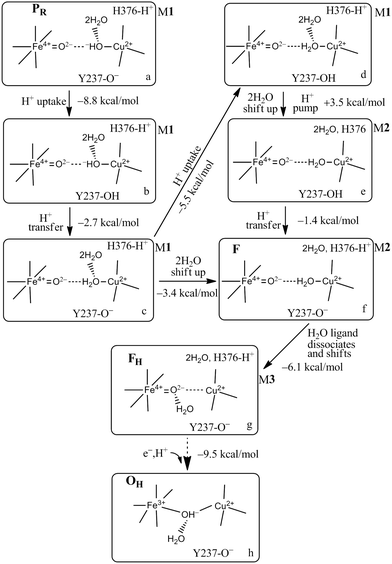 | ||
| Fig. 13 Feasible proton uptake/pumping processes connecting with the movement of water molecules in the DNC during the PR → F transition based on our current Models (M) 1–3 calculations. The 2H2O represents HOH604 and HOH608. In M1, the two water molecules are within the DNC H-bonded to the OH− or H2O CuB2+ ligands close to the positions observed in the X-ray crystal structure 3S8G.14 In M2, the 2H2O are shifted to the upper water pool of the DNC. In M3, the water molecule that is a ligand of CuB2+ in M2, now dissociates from CuB2+ but still has H-bonding interaction with the Fea3-ligand O2−. Figure is adapted with permission from Fig. 4 of ref. 58, copyright© 2018 American Chemical Society. | ||
We have analyzed this water dimer shift mechanism further with additional modeling. We find that if in the state just before the water dimer shift (pre-shift states are called M1 states), we add 2(H2O) to the upper water pool in our quantum cluster model and calculate the His376+ pKa for that (M1 + 2H2O) state, the value is pKa = 10.7, about 1.5 pH units below the corresponding M1 state discussed earlier, but still 4.2 pH units higher than the corresponding M2 state (after the 2H2O shift, but with no net added waters). Our conclusion is that the descreening of the H2O–CuB2+–(His)3 ligand group when the water dimer moves to the upper water pool is the primary effect causing a strong change in the His376+ pKa. The Tyr237 (neutral protonated) and the Fea34+![[double bond, length as m-dash]](https://www.rsc.org/images/entities/char_e001.gif) O2− are also descreened. Primarily, the descreening calculated at His376+ is a through space effect, while the effect on the Tyr237 pKa is a mixture of through bond and through space effects. We have focused on a water dimer shift for two reasons. First, given the initial structures (M1 states), moving a dimer into the upper water pool looked to be less disruptive of the hydrogen bond network. Further, we were intrigued by the possible connection to the expected net H2O molecule transport, since in each cycle 2(H2O) is produced, and an effective mechanism for removal of the water product would be to move two waters into the water pool region above the DNC in each cycle. Water exit pathways from the water pool above the DNC, in the region of the shifted water molecules, to the p side of the membrane have been identified by molecular dynamics simulations.57 Comparing the (M1 + 2H2O) state with the M2 state, one can imagine that the water dimer shifted up only replaces the (2H2O) already present in (M1 + 2H2O), which then is transferred to the bulk water pool above, and produces a net transit of 2(H2O). We have done a rough calculation of the extra free energy cost for moving 2H2O from (M1 + 2H2O) into bulk water and find that it is small.
O2− are also descreened. Primarily, the descreening calculated at His376+ is a through space effect, while the effect on the Tyr237 pKa is a mixture of through bond and through space effects. We have focused on a water dimer shift for two reasons. First, given the initial structures (M1 states), moving a dimer into the upper water pool looked to be less disruptive of the hydrogen bond network. Further, we were intrigued by the possible connection to the expected net H2O molecule transport, since in each cycle 2(H2O) is produced, and an effective mechanism for removal of the water product would be to move two waters into the water pool region above the DNC in each cycle. Water exit pathways from the water pool above the DNC, in the region of the shifted water molecules, to the p side of the membrane have been identified by molecular dynamics simulations.57 Comparing the (M1 + 2H2O) state with the M2 state, one can imagine that the water dimer shifted up only replaces the (2H2O) already present in (M1 + 2H2O), which then is transferred to the bulk water pool above, and produces a net transit of 2(H2O). We have done a rough calculation of the extra free energy cost for moving 2H2O from (M1 + 2H2O) into bulk water and find that it is small.
3.5. The resting State Oversus the cycling State OH60
As depicted in Fig. 6, the active cycling State OH can decay to the relaxed lower lying State O in a few milliseconds (in solution studies with RR) when the next one electron transfer (1e−) to the DNC is delayed (or absent entirely). In the associated Resonance Raman spectra, the State OH signal (whose observation is enhanced by comparing the normal 16O signal with the isotopic substitution 18O signal starting from reactant O2 binding to State R, following through the reaction cycle) is lost on formation of State O. The resting State O is expected to be the same as that found in the resting “as isolated” system as formed in oxidizing conditions. By comparison, State OH is a metastable catalytically active state. The different characters of State OHversus State O were initially observed in kinetics studies using a combination of optical difference spectroscopy and electrometry with laser photoactivation over the cycle to follow the 1e− redox transitions OH + 1e− → EH compared to O + 1e− → E.94,95 In the following redox step which regenerates State R, one additional electron is added to the active site, and if needed, a proton may move into the active site vicinity to protonate an OH−. The kinetics seen for OH → EH is different from that observed for O → E. The first gives more efficient electron transfer, with the electron terminating at CuB, and proton transfer is more effective as well for both ba3 and aa3 type enzymes. In aa3 type enzymes, proton pumping occurs just after State OH, but not after State O.96–98 Based on these differences in kinetics, some substantial structural differences are expected between OH and O, but these specific differences are not evident.There are various X-ray crystal structures of State O (as isolated oxidized species) early on and analyses of the solvent or oxygen species in the DNC based on the observed electron density between Fea3 and CuB, originally interpreted as a H2O and an OH− ligand between the metals. These include structures of bacterial aa3 type CcO's from Rhodobacter sphaeroides (Rs) and Paracoccus denitrificans (Pd).27,28 Later, based on higher-resolution X-ray crystal structures using synchrotron radiation of oxidized CcO's from Pd (PDB code 3HB3, 2.25 Å resolution),29 and from bovine heart mitochondria (PDB code 2ZXW, 1.95 Å resolution),30 two research groups identified an elongated electron density bridging Fea3 and CuB in the DNC, and proposed that this is a peroxide dianion (O22−). All of these systems were crystallized from a buffer solution. Following on earlier structures of ba3 CcO crystallized from cryogenically stabilized solvent,21 higher resolution (1.8–1.9 Å) synchrotron X-ray crystal structures (PDB entries 3S8G and 3S8F)14 of ba3 CcO from Tt were obtained in lipidic cubic phase (LCP), which is more membrane-like compared to buffered detergent solutions. These also showed a similar elongated electron density. The O1–O2 distances obtained by modeling the structure into the observed electron density maps range from 1.52 Å at the shortest for ba3Tt to a range of 1.6–1.9 Å for other structures in aa3 CcO enzymes.
A recent low-dose X-ray structure on oxidized resting state CcO from bovine heart mitochondria also showed an apparent peroxide type ligand in the DNC,31 and a similar species was seen in an X-ray free-electron laser (XFEL) experiment (1.9 Å resolution).32 While the absorbed power in this XFEL experiment is very high, the diffraction data is collected over the period of the XFEL pulse, which is extremely short, typically between 10 fs and 50 fs, well before the crystal explodes from the longer term radiation damage. The delivered radiation dose is much less than in synchrotron experiments, where the dose is delivered over a much longer time, and the diffraction pattern data is also collected over an extended period. There are ways of mitigating the radiation damage in synchrotron experiments, including using multiple crystals, or irradiating different locations on a crystal. In contrast to synchrotron X-ray diffraction experiments, which are strongly reducing at the metals, because of electron recombination preferentially at those sites, XFELs experiments are strongly oxidizing at the metal sites because after metal ionization, there is little time for the electrons to recombine over the pulse duration.
Despite the conclusions discussed above, there are good reasons to be doubtful about the proposed peroxide ligand between Fea3 and CuB. In our view, this concern is particularly strong if the peroxide is proposed to be pre-existing prior to X-ray irradiation. A pre-existing peroxide bonded to Fe and Cu does not fit well with the known chemistry of either aa3 type or ba3 type CcO. When oxidized CcO is exposed to HOOH in aa3 CcO proteins, it reaches the DNC, and reacts with the Fe–Cu center, generating the ferryl-oxo, Cu2+ tyrosine radical State PM. By contrast, in ba3 type CcO, HOOH does not have access to the Fe–Cu site at all. X-ray structures of the as isolated resting oxidized state (State O) showing a non-reactive peroxide or hydroperoxide then are contrary to this reaction chemistry. The active site positioning of the peroxide or hydroperoxide is also surprising. In the lipidic cubic phase structure solved for ba3 CcO, the apparent Fe–O1 distance is about 2.4 Å and the Cu–O2 distance is about 2.25 Å, both fairly weak. Further, the apparent O–O distance in the LCP ba3 is 1.5 Å or more; in other structures from aa3 type enzymes, the observed range is very long 1.6–1.9 Å; these last distances are not consistent with any known peroxo or hydroperoxo type species, and yet these are much too short for hydrogen bonding between waters or OH−⋯H2O bonds. In our earlier work on this problem,54 our group proposed that the peroxide or hydroperoxide (preferably the latter) could be formed by X-ray radiation induced radical reactions near the metals, and further stabilized by the cryogenic temperatures near that of liquid nitrogen. We learned later that X-ray absorption and ionization is enhanced for photon energies near and above the metal K-edge energy, and the X-ray irradiation photon energy typically used is above both the Fe and Cu K edge ionization threshold. Fe and Cu K edge ionization can lead to Auger ionization at the metals, and to various transferred Auger effects producing radicals in bonded or nearby atoms. These effects can be very fast, even on the 10–50 fs XFEL time scale,99 and may be observable, depending on the total radiation flux absorbed. However, the total X-ray radiation absorbed in the recent XFEL experiments is comparatively low, so that only about 10% or less of the Fe and Cu atoms will undergo core M(1s) ionization. While some effects due to X-ray irradiation in the XFEL experiments may be observable with careful attention to the time course, these effects are not likely to be the dominant effects in the observed diffraction pattern, since this pattern represents an average over many billions of DNC Fe–Cu sites in the crystal. Instead, we have explored the possibility that a single water molecule is weakly bonded alternatively to Fea33+ and CuB2+ in the resting oxidized state.60 The apparent peroxide molecule is then predicted to be a consequence of a superposition of H2O positions between Fe and Cu from static and dynamic disorder. We have found that the potential energy surface between the Fea3 and CuB is very flat and the H2O to metal bonding is weak. This holds true whether or not this H2O is hydrogen bonded to another water molecule outside of the direct path between Fe and Cu. Fig. 14 presents a superposition of our DFT calculated structures along this path with the observed electron density map derived from the published LCP high resolution (1.8 Å) synchrotron X-ray structure of ba3 CcO.14
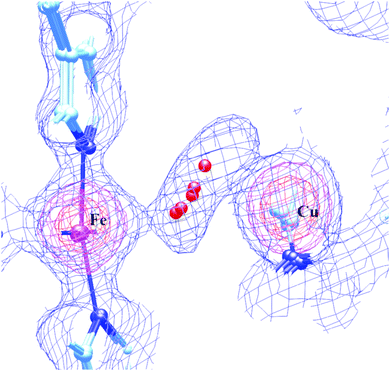 | ||
| Fig. 14 The overlap of the electron density map that was reconstructed from the oxidized Tt ba3 X-ray crystal structure 3S8G14 data file with our calculated resting O state DNC structures, in which a water molecule resides in different locations between the Fea33+ and CuB2+ sites with very similar energies. Reprinted from Fig. 7 of ref. 60, https://pubs.acs.org/doi/10.1021/acs.inorgchem.0c00724, copyright© 2020 American Chemical Society (further permissions for reusing this figure should be directed to the ACS). | ||
Our conclusion here is that the State OH → State O transition is probably a slow protonation of the bridging OH− in State OH, resulting in a water (H2O) weakly coordinated alternatively to Fea3 or CuB. This apparently disrupts the electron transfer path to CuB.
3.6. Features of state O and state R synchrotron X-ray structures in Tt ba3 CcO
Very recently, our group, in collaboration with a group at SSRL completed new high resolution synchrotron X-ray structures of State O and State R in ba3 CcO from Tt. This work is undergoing final analysis now. We do want to emphasize some features that we have observed in common with earlier structures of ba3 and found also in aa3 structures. Confirming previous lower resolution work,22 we find that Fe sites both in heme b and heme a3 are rapidly X-ray reduced from the original Fe3+ to Fe2+ based on microspectrophotometer absorption spectra, and these are the heme Fe states in the final X-ray structure. The State O structure is then referred to as State O(PR), since it is at least partially reduced in the dinuclear complex region. The optical absorption observed at heme a3 is consistent with having a 6-coordinate Fe2+, and we expect that this reflects Fe2+–H2O binding. The CuB site does not have an observable optical spectroscopic signal at present, and so we cannot determine its redox state in this X-ray structure. After chemical reduction of the crystal at room temperature over an extended time, and freezing in liquid nitrogen, the fully reduced State R ((also called R(CR) to indicate Chemical Reduction)) exhibits different optical spectra at Fea3, consistent with a 5-coordinate Fe2+, and the solved X-ray structure shows no waters directly between Fea3 and CuB, again consistent with the structure determined at lower resolution. This structure of State R has features in common with the chemically reduced forms of bovine mitochondrial aa3 and of Rhodobacter sphaeroides aa3 CcO.100,101A new water (W1) is observed in State R within close hydrogen bonding distance to Tyr237 compared to State O(PR). W1 is located about 4 Å from CuB and Fea3, and similarly about 4.3 Å from the oxygen position in the next states of the reaction cycle. It is also about 4 Å from the Thr302(O) which is H-bonded to His282, a CuB ligand. This hydrogen bond positioning indicates two possible input pathways for protons binding to oxygen species or hydroxyl groups in the DNC reaction chamber area between Fea3 and CuB.
3.7. The path from State R → State A → Peroxo → Hydroperoxo
From State R, molecular O2 binding produces State A. How then are the next States Peroxo and Hydroperoxo formed, and what is the proton pathway in? In recent work by Schaefer et al.102 and earlier work by Adam et al.,82 this group proposed that after formation of the Peroxo state, a proton enters via an H-bonded chain from the special tyrosine to a water essentially like W1 discussed above, and this pathway leads to proton transfer to the O1 bonded to Fea33+ and then shifting to O2 bonded to CuB2+ prior to O–O cleavage with the latter proton transfer being rate limiting. Although this pathway looks reasonable, we would like to propose an alternative, which does not require a pre-existing Peroxo bridge state, and uses some distinctive features of CuB+ coordination chemistry. The Cu+ redox state often exhibits lability in ligand binding, and we propose, starting from the State A (Superoxide bound) that His283 (see Fig. 15) dissociates from CuB+ and protonates to His+, taking this proton from His282 via a ring flip, leaving His282− as an unstable anion; flipping back, there will be a proton transfer from Thr302, generating Thr302−, whose proton is restored by H-bonded waters or amino acid sidechains, going back to Tyr237 at the end of the proton uptake K-pathway. The His283+ state, once formed may be further stabilized by a cation–π interaction with the nearby Trp229 ring. Meanwhile, electron transfer from CuB+ to the superoxide ligand bonded to Fea33+ will be quickly followed by proton transfer from His283+, and then the CuB2+ bond to His283 will reform. This mechanism is fairly analogous to one that we found for the reaction center in CuZn superoxide dismutase, which also involves a Cu+–His protonation and bond breakage, and then subsequent Cu2+–His bond formation after proton loss.103–107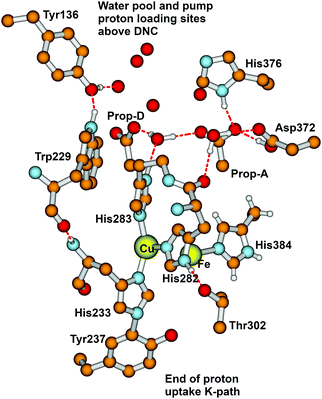 | ||
| Fig. 15 Major residues and water molecules in the DNC of the Tt ba3 X-ray crystal structure 3S8G.14 For clarity, only prop-A and prop-D of the heme ring are presented here, the whole heme ring is not shown. | ||
3.8 Radical transfer and proton pumping in State PM
Based on EPR spectra for two different tyrosine radicals that they observed in State PM, Yu et al.108 proposed that a radical transfer mechanism in State PM could be essential to a proton pumping step in the transition PM → PR. A similar mechanism could be operating in ba3 CcO from Tt. (See Fig. 15) In Tt ba3, the relevant tyrosines are Tyr237 and Tyr136, the latter lying in the upper water pool with closely associated polar or charged amino acids capable of proton transfer. The tryptophan (Trp229) lies along a covalently bonded path from Tyr237 and His233 and further on, while the His233 main chain amide is also hydrogen bonded to the Trp229 carbonyl. One electron transfer from Trp229 to the Tyr237 radical will produce a Trp229˙+ cation radical and a Tyr237− anion. There is again an electronic stabilization of His283–Trp229, but now His is the π system and Trp is the cation. The Trp229˙+ radical will exert a strong electrostatic interaction with the Tyr136, causing the loss of its proton, becoming Tyr136−, and the proton can then enter the upper pool of waters and polar amino acids. Whether or not there is a radical transfer between Tyr136− and the Trp229˙+ cation radical, there will later be an electron transfer from the heme b Fe2+.To reset the system, there must be a proton resupplied from an effective proton pathway to Tyr136−. Here the pathways differ between aa3 type, involving the D pathway (or perhaps the H pathway in mammalian mitochondria), while we have found a different proton pathway in ba3 from Tt (see Fig. 15–17). The resupply pathway includes Asp372, Proprionate A (Prop A), His376 based on prior work.57 There are always at least two protons in this network, and sometimes three as we saw in the peroxide cleavage calculations56 and our MD simulations.57 The proton pumping pathway from His376 to Tyr136 and out along water transport pathways is displayed in Yang et al., BBA, 2016 (see Fig. 16 and 17).57 Notably, the conformation of Tyr136 is sensitive to the protonation state of His376, either opening or blocking a water exit pathway, potentially acting as conformational gate against proton backflow. The proton exit path(s) are probably similar in the water shift proton pumping mechanism, but these may differ in detail. We see that the description of the proton pumping process requires attention to the entire proton loading network (PLN) and associated pumping network, and not only a proton loading site (PLS).
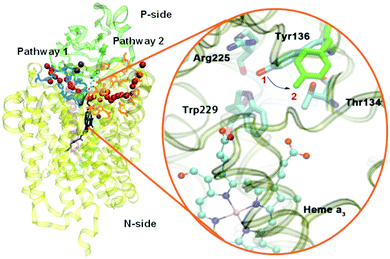 | ||
| Fig. 16 Water exit pathways in Tt ba3 CcO identified from MD simulations.57 Tyr136 acts as a conformational gate. | ||
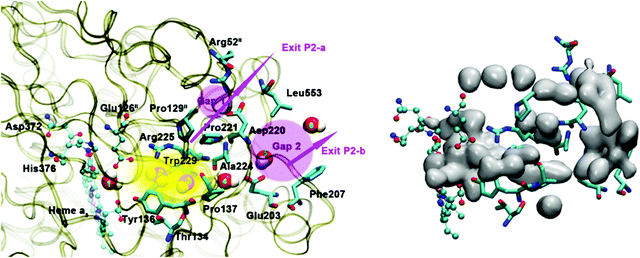 | ||
| Fig. 17 Water exit pathway P2 obtained from MD simulations.57 Left: Detailed water pathway highlighting relevant residues. The pathway connects the water pool above the DNC to the outer side of the membrane via a water pocket (yellow) and two regions (pink, Gap1 and Gap2) that open towards the bulk solvent. Gap 1 is surrounded by residues Arg52II, Pro129II, Pro221, Asp220 and Leu553; Gap 2 is surrounded by residues Leu553, Asp220, Ala224, Glu203 and Phe207. Right: Water occupancy averaged over the entire trajectory (isosurface plot at 25% occupancy), showing the path that connects the water pool to the protein exterior. Figure is taken with permission from Fig. 8 of ref. 57. https://doi.org/10.1016/j.bbabio.2016.06.005, copyright© 2016 Elsevier. | ||
3.9 Limitations in current DFT calculations
Our work and that from other groups have used a variety of standard DFT methods and exchange–correlation potentials. For our work, recent studies have used OLYP plus dispersion corrections,58–60 while in earlier papers,24,34 we tested PW91, B3LYP, B3LYP*, OPBE, OLYP for oxygen thermochemistry, and PW91 and B3LYP* for redox potentials for Fe3+,2+ and Cu2+,1+ of Fea3 and CuB.For the O2 thermochemistry, we evaluated the overall gas phase reaction
| O2 + 2H2 → 2H2O | (6) |
| O2 + H2 → H2O2 | (7) |
| H2O2 + H2 → 2H2O | (8) |
4. Concluding remarks
In this work, we have followed the catalytic reaction cycle of the dinuclear complex in CcO with particular focus on the ba3 enzyme in Thermus thermophilus. Comparisons of proposed reaction pathways, including DFT calculated geometries, redox and protonation states, energies, and spectroscopic properties can be closely related to experimental X-ray structural and spectroscopic observations, clarifying the physical properties of various intermediates. Calculations of specific vibrational modes over the catalytic cycle in comparison with resonance Raman spectra have proven particularly valuable.59 We have developed some insights on proton transfers both into the reaction center Fea3–CuB active site and into the potential pathways for proton pumping. In ba3 CcO, protons are delivered from the K pathway to the special Tyr237, and potentially on to Thr302, as we have proposed.24,34 At that point, the proton may move through an outer pathway to Asp372 and then to His376 or farther. Alternatively, it may reprotonate His282 which earlier transferred a proton to His283 in some states, in preparation for protonating intermediates within the reaction chamber. We have presented this proposal in some detail for the State A → Hydroperoxo transition, where the CuB starts in the Cu+ cuprous state, emphasizing the lability of Cu+–histidine bonding.55 While this is perhaps the clearest and most likely example of a labile CuB coordination, there are a number of other states of the catalytic cycle that are formally Cu2+–Tyr−.When we look at these states with spin density population analysis, we see that all of these states have significant spin density on both CuB and Tyr237.59,60 This spin distribution is indicative of a quantum admixed state involving a resonance between Cu2+–Tyr− (anion) and Cu+–Tyr˙ (radical). If the lower electronic ground state is mainly Cu2+–Tyr− (anion), then the activated intermediate state is mainly Cu+–Tyr˙ (radical), and the main question becomes how high in energy this latter state lies for specific intermediates and transitions in the reaction pathway, and to what extent each promotes proton transfer into the reaction chamber. There remains a great deal more work to be done involving reaction energetics, pathways and dynamics in ba3 CcO and the connections and contrasts with pathways in aa3 from mitochondria and aerobic bacteria.
Conflicts of interest
There are no conflicts to declare.Acknowledgements
This work is dedicated to the memory of Jim Fee and Dave Stout who made major contributions to the fields of metallobiochemistry and X-ray crystallography. They are and will be missed. Early on, LN appreciates the contribution of Dave Case to our first paper with J. A. Fee. We benefited also from discussions and emails with Per Siegbahn and Laura Hunsicker-Wang, and later from extensive emails with Abhishek Dey and Marten Wikstrom. Most recently, we had very helpful email exchanges with Ken Karlin and Dennis Rousseau. For an extended period, we have had advice and collaboration on synchrotron X-ray structures with a group at Stanford Synchrotron Radiation Lightsource, in particular Tzanko Doukov and Aina Cohen. We also acknowledge discussions with Ross Walker, Åge Skjevik, Attila Fekete and Vinicius Cruzeiro. We thank the NIH for financial support (R01 GM100934) to L. N. and A. W. G., and thank The Scripps Research Institute for computational resources. This work also used the Extreme Science and Engineering Discovery Environment (XSEDE), which is supported by the National Science Foundation (grant number ACI-1053575, resources at the San Diego Supercomputer Center through award TG-CHE130010 to AWG).References
- O. M. H. Richter and B. Ludwig, Rev. Physiol., Biochem. Pharmacol., 2003, 147, 47–74 CrossRef CAS.
- V. M. Luna, Y. Chen, J. A. Fee and C. D. Stout, Biochemistry, 2008, 47, 4657–4665 CrossRef CAS.
- S. Iwata, C. Ostermeier, B. Ludwig and H. Michel, Nature, 1995, 376, 660–669 CrossRef CAS.
- T. Tsukihara, H. Aoyama, E. Yamashita, T. Tomizaki, H. Yamaguchi, K. Shinzawa-Itoh, R. Nakashima, R. Yaono and S. Yoshikawa, Science, 1996, 272, 1136–1144 CrossRef CAS.
- M. Svensson-Ek, J. Abramson, G. Larsson, S. Tornroth, P. Brzezinski and S. Iwata, J. Mol. Biol., 2002, 321, 329–339 CrossRef CAS.
- J. M. Zee and D. M. Glerum, Biochem. Cell Biol., 2006, 84, 859–869 CrossRef CAS.
- G. T. Babcock and M. Wikström, Nature, 1992, 356, 301–309 CrossRef CAS.
- S. Ferguson-Miller and G. T. Babcock, Chem. Rev., 1996, 96, 2889–2907 CrossRef CAS.
- B. G. Malmström, J. Biol. Inorg. Chem., 1998, 3, 339–343 CrossRef.
- D. G. Nicholls and S. J. Ferguson, Bioenergetics 3, Academic Press, San Diego, CA, 2002 Search PubMed.
- J. Prebble, Trends Biochem. Sci., 2002, 27, 209–212 CrossRef CAS.
- M. K. F. Wikström, Nature, 1977, 266, 271–273 CrossRef.
- T. A. Rouault and W. H. Tong, Trends Genet., 2008, 24, 398–407 CrossRef CAS.
- T. Tiefenbrunn, W. Liu, Y. Chen, V. Katritch, C. D. Stout, J. A. Fee and V. Cherezov, PLoS One, 2011, 6, e22348 CrossRef CAS.
- F. Francia, B. Khalfaoui-Hassani, P. Lanciano, F. Musiani, L. Noodleman, G. Venturoli and F. Daldal, Biochim. Biophys. Acta, Bioenerg., 2019, 1860, 167–179 CrossRef CAS.
- G. M. Ullmann, L. Noodleman and D. A. Case, J. Biol. Inorg. Chem., 2002, 7, 632–639 CrossRef CAS.
- M. E. Konkle, S. K. Muellner, A. L. Schwander, M. M. Dicus, R. Pokhrel, R. D. Britt, A. B. Taylor and L. M. Hunsicker-Wang, Biochemistry, 2009, 48, 9848–9857 CrossRef CAS.
- L. I. Krishtalik, Biochim. Biophys. Acta, 2003, 1604, 13–21 CrossRef CAS.
- Y. B. Zu, M. M. J. Couture, D. R. J. Kolling, A. R. Crofts, L. D. Eltis, J. A. Fee and J. Hirst, Biochemistry, 2003, 42, 12400–12408 CrossRef CAS.
- T. Soulimane, G. Buse, G. P. Bourenkov, H. D. Bartunik, R. Huber and M. E. Than, EMBO J., 2000, 19, 1766–1776 CrossRef CAS.
- L. M. Hunsicker-Wang, R. L. Pacoma, Y. Chen, J. A. Fee and C. D. Stout, Acta Crystallogr., Sect. D: Biol. Crystallogr., 2005, 61, 340–343 CrossRef.
- B. Liu, Y. Chen, T. Doukov, S. M. Soltis, C. D. Stout and J. A. Fee, Biochemistry, 2009, 48, 820–826 CrossRef CAS.
- R. Andersson, C. Safari, R. Dods, E. Nango, R. Tanaka, A. Yamashita, T. Nakane, K. Tono, Y. Joti, P. Bath, E. Dunevall, R. Bosman, O. Nureki, S. Iwata, R. Neutze and G. Branden, Sci. Rep., 2017, 7, 4518 CrossRef.
- L. Noodleman, W.-G. Han Du, J. A. Fee, A. W. Götz and R. C. Walker, Inorg. Chem., 2014, 53, 6458–6472 CrossRef CAS.
- S. A. Siletsky, I. Belevich, A. Jasaitis, A. A. Konstantinov, M. Wikström, T. Soulimane and M. I. Verkhovsky, Biochim. Biophys. Acta, 2007, 1767, 1383–1392 CrossRef CAS.
- V. Rauhamäki and M. Wikström, Biochim. Biophys. Acta, 2014, 1837, 999–1003 CrossRef.
- C. Ostermeier, A. Harrenga, U. Ermler and H. Michel, Proc. Natl. Acad. Sci. U. S. A., 1997, 94, 10547–10553 CrossRef CAS.
- L. Qin, C. Hiser, A. Mulichak, R. M. Garavito and S. Ferguson-Miller, Proc. Natl. Acad. Sci. U. S. A., 2006, 103, 16117–16122 CrossRef CAS.
- J. Koepke, E. Olkhova, H. Angerer, H. Muller, G. H. Peng and H. Michel, Biochim. Biophys. Acta, 2009, 1787, 635–645 CrossRef CAS.
- H. Aoyama, K. Muramoto, K. Shinzawa-Itoh, K. Hirata, E. Yamashita, T. Tsukihara, T. Ogura and S. Yoshikawa, Proc. Natl. Acad. Sci. U. S. A., 2009, 106, 2165–2169 CrossRef CAS.
- G. Ueno, A. Shimada, E. Yamashita, K. Hasegawa, T. Kumasaka, K. Shinzawa-Itoh, S. Yoshikawa, T. Tsukihara and M. Yamamoto, J. Synchrotron Radiat., 2019, 26, 912–921 CrossRef CAS.
- K. Hirata, K. Shinzawa-Itoh, N. Yano, S. Takemura, K. Kato, M. Hatanaka, K. Muramoto, T. Kawahara, T. Tsukihara, E. Yamashita, K. Tono, G. Ueno, T. Hikima, H. Murakami, Y. Inubushi, M. Yabashi, T. Ishikawa, M. Yamamoto, T. Ogura, H. Sugimoto, J. R. Shen, S. Yoshikawa and H. Ago, Nat. Methods, 2014, 11, 734–U174 CrossRef CAS.
- H. Y. Chang, J. Hemp, Y. Chen, J. A. Fee and R. B. Gennis, Proc. Natl. Acad. Sci. U. S. A., 2009, 106, 16169–16173 CrossRef CAS.
- J. A. Fee, D. A. Case and L. Noodleman, J. Am. Chem. Soc., 2008, 130, 15002–15021 CrossRef CAS.
- I. Szundi, C. Funatogawa, J. A. Fee, T. Soulimane and O. Einarsdottir, Proc. Natl. Acad. Sci. U. S. A., 2010, 107, 21010–21015 CrossRef CAS.
- T. Egawa, Y. Chen, J. A. Fee, S. R. Yeh and D. L. Rousseau, Biochim. Biophys. Acta, 2012, 1817, 666–671 CrossRef CAS.
- S. Yoshikawa and A. Shimada, Chem. Rev., 2015, 115, 1936–1989 CrossRef CAS.
- M. Wikström, K. Krab and V. Sharma, Chem. Rev., 2018, 118, 2469–2490 CrossRef.
- I. Ishigami, M. Hikita, T. Egawa, S. R. Yeh and D. L. Rousseau, Biochim. Biophys. Acta, Bioenerg., 2015, 1847, 98–108 CrossRef CAS.
- S. Han, Y. C. Ching and D. L. Rousseau, Proc. Natl. Acad. Sci. U. S. A., 1990, 87, 2491–2495 CrossRef CAS.
- S. H. Han, Y. C. Ching and D. L. Rousseau, Biochemistry, 1990, 29, 1380–1384 CrossRef CAS.
- T. Ogura, S. Takahashi, K. Shinzawa-Itoh, S. Yoshikawa and T. Kitagawa, J. Am. Chem. Soc., 1990, 112, 5630–5631 CrossRef CAS.
- T. Ogura, S. Takahashi, S. Hirota, K. Shinzawa-Itoh, S. Yoshikawa, E. H. Appelman and T. Kitagawa, J. Am. Chem. Soc., 1993, 115, 8527–8536 CrossRef CAS.
- C. Varotsis, W. H. Woodruff and G. T. Babcock, J. Am. Chem. Soc., 1989, 111, 6439–6440 CrossRef CAS.
- D. A. Proshlyakov, T. Ogura, K. Shinzawa-Itoh, S. Yoshikawa, E. H. Appelman and T. Kitagawa, J. Biol. Chem., 1994, 269, 29385–29388 CAS.
- D. A. Proshlyakov, M. A. Pressler and G. T. Babcock, Proc. Natl. Acad. Sci. U. S. A., 1998, 95, 8020–8025 CrossRef CAS.
- T. Ogura and T. Kitagawa, Biochim. Biophys. Acta, 2004, 1655, 290–297 CrossRef CAS.
- E. Pinakoulaki, V. Daskalakis, T. Ohta, O. M. H. Richter, K. Budiman, T. Kitagawa, B. Ludwig and C. Varotsis, J. Biol. Chem., 2013, 288, 20261–20266 CrossRef CAS.
- S. W. Han, Y. C. Ching and D. L. Rousseau, Nature, 1990, 348, 89–90 CrossRef CAS.
- S. Han, S. Takahashi and D. L. Rousseau, J. Biol. Chem., 2000, 275, 1910–1919 CrossRef CAS.
- T. Kitagawa, J. Inorg. Biochem., 2000, 82, 9–18 CrossRef CAS.
- C. Varotsis and G. T. Babcock, Biochemistry, 1990, 29, 7357–7362 CrossRef CAS.
- C. J. T. de Grotthuss, Ann. Chim., 1806, 58, 54–73 Search PubMed.
- W.-G. Han Du and L. Noodleman, Inorg. Chem., 2013, 52, 14072–14088 CrossRef.
- W.-G. Han Du and L. Noodleman, Inorg. Chem., 2015, 54, 7272–7290 CrossRef CAS.
- W.-G. Han Du, A. W. Götz, L. H. Yang, R. C. Walker and L. Noodleman, Phys. Chem. Chem. Phys., 2016, 18, 21162–21171 RSC.
- L. H. Yang, A. A. Skjevik, W.-G. Han Du, L. Noodleman, R. C. Walker and A. W. Götz, Biochim. Biophys. Acta, Bioenerg., 2016, 1857, 1594–1606 CrossRef CAS.
- W.-G. Han Du, A. W. Götz and L. Noodleman, Inorg. Chem., 2018, 57, 1048–1059 CrossRef CAS.
- W.-G. Han Du, A. W. Götz and L. Noodleman, Inorg. Chem., 2019, 58, 13933–13944 CrossRef.
- W.-G. Han Du, D. McRee, A. W. Götz and L. Noodleman, Inorg. Chem., 2020, 59, 8906–8915 CrossRef CAS.
- E. J. Baerends, T. Ziegler, A. J. Atkins, J. Autschbach, O. Baseggio, D. Bashford, A. Bérces, F. M. Bickelhaupt, C. Bo, P. M. Boerrigter, L. Cavallo, C. Daul, D. P. Chong, D. V. Chulhai, L. Deng, R. M. Dickson, J. M. Dieterich, D. E. Ellis, M. van Faassen, L. Fan, T. H. Fischer, A. Förster, C. Fonseca Guerra, M. Franchini, A. Ghysels, A. Giammona, S. J. A. van Gisbergen, A. Goez, A. W. Götz, J. A. Groeneveld, O. V. Gritsenko, M. Grüning, S. Gusarov, F. E. Harris, P. van den Hoek, Z. Hu, C. R. Jacob, H. Jacobsen, L. Jensen, L. Joubert, J. W. Kaminski, G. van Kessel, C. König, F. Kootstra, A. Kovalenko, M. V. Krykunov, E. van Lenthe, D. A. McCormack, A. Michalak, M. Mitoraj, S. M. Morton, J. Neugebauer, V. P. Nicu, L. Noodleman, V. P. Osinga, S. Patchkovskii, M. Pavanello, C. A. Peeples, P. H. T. Philipsen, D. Post, C. C. Pye, H. Ramanantoanina, P. Ramos, W. Ravenek, M. Reimann, J. I. Rodríguez, P. Ros, R. Rüger, P. R. T. Schipper, D. Schlüns, H. van Schoot, G. Schreckenbach, J. S. Seldenthuis, M. Seth, J. G. Snijders, M. Solà, M. Stener, M. Swart, D. Swerhone, V. Tognetti, G. te Velde, P. Vernooijs, L. Versluis, L. Visscher, O. Visser, F. Wang, T. A. Wesolowski, E. M. van Wezenbeek, G. Wiesenekker, S. K. Wolff, T. K. Woo and A. L. Yakovlev, ADF 2017, SCM, Theoretical Chemistry, Vrije Universiteit, Amsterdam, The Netherlands, http://www.scm.com Search PubMed.
- G. te Velde, F. M. Bickelhaupt, E. J. Baerends, C. F. Guerra, S. J. A. Van Gisbergen, J. G. Snijders and T. Ziegler, J. Comput. Chem., 2001, 22, 931–967 CrossRef CAS.
- C. F. Guerra, O. Visser, J. G. Snijders, G. te Velde and E. J. Baerends, in Methods and techniques for computational chemistry, ed. E. Clementi and C. Corongiu, STEF, Cagliari, 1995, pp. 303–395 Search PubMed.
- L. Noodleman, J. Chem. Phys., 1981, 74, 5737–5743 CrossRef CAS.
- L. Noodleman and D. A. Case, Adv. Inorg. Chem., 1992, 38, 423–470 CrossRef CAS.
- L. Noodleman, T. Lovell, W.-G. Han, T. Liu, R. A. Torres and F. Himo, in Comprehensive Coordination Chemistry II, From Biology to Nanotechnology, ed. A. B. Lever, Elsevier Ltd, 2003, vol. 2, pp. 491–510 Search PubMed.
- S. Grimme, S. Ehrlich and L. Goerigk, J. Comput. Chem., 2011, 32, 1456–1465 CrossRef CAS.
- A. Klamt and G. Schüürmann, J. Chem. Soc., Perkin Trans. 2, 1993, 799–805 RSC.
- A. Klamt, J. Phys. Chem., 1995, 99, 2224–2235 CrossRef CAS.
- A. Klamt and V. Jonas, J. Chem. Phys., 1996, 105, 9972–9981 CrossRef CAS.
- C. C. Pye and T. Ziegler, Theory Chem. Acc., 1999, 101, 396–408 CrossRef CAS.
- T. Soda, Y. Kitagawa, T. Onishi, Y. Takano, Y. Shigeta, H. Nagao, Y. Yoshioka and K. Yamaguchi, Chem. Phys. Lett., 2000, 319, 223–230 CrossRef CAS.
- M. Radoń and K. Pierloot, J. Phys. Chem. A, 2008, 112, 11824–11832 CrossRef.
- K. H. Hopmann, L. Noodleman and A. Ghosh, Chem. – Eur. J., 2010, 16, 10397–10408 CrossRef CAS.
- A. Ghysels, D. Van Neck, V. Van Speybroeck, T. Verstraelen and M. Waroquier, J. Chem. Phys., 2007, 126, 224102 CrossRef CAS.
- A. Ghysels, D. Van Neck and M. Waroquier, J. Chem. Phys., 2007, 127, 164108 CrossRef CAS.
- R. M. Badger, J. Chem. Phys., 1935, 3, 710–714 CrossRef CAS.
- I. Mayer, Chem. Phys. Lett., 1983, 97, 270–274 CrossRef CAS.
- J. P. Collman, J. I. Brauman, T. R. Halbert and K. S. Suslick, Proc. Natl. Acad. Sci. U. S. A., 1976, 73, 3333–3337 CrossRef CAS.
- J. P. Collman, K. E. Berg, C. J. Sunderland, A. Aukauloo, M. A. Vance and E. I. Solomon, Inorg. Chem., 2002, 41, 6583–6596 CrossRef CAS.
- J. P. Collman, C. J. Sunderland, K. E. Berg, M. A. Vance and E. I. Solomon, J. Am. Chem. Soc., 2003, 125, 6648–6649 CrossRef CAS.
- S. M. Adam, I. Garcia-Bosch, A. W. Schaefer, S. K. Sharma, M. A. Siegler, E. I. Solomon and K. D. Karlin, J. Am. Chem. Soc., 2017, 139, 472–481 CrossRef CAS.
- S. E. V. Phillips, J. Mol. Biol., 1980, 142, 531–554 CrossRef CAS.
- S. E. V. Phillips and B. P. Schoenborn, Nature, 1981, 292, 81–82 CrossRef CAS.
- H. E. Van Wart and J. Zimmer, J. Biol. Chem., 1985, 260, 8372–8377 CAS.
- S. Hirota, T. S. Li, G. N. Phillips, J. S. Olson, M. Mukai and T. Kitagawa, J. Am. Chem. Soc., 1996, 118, 7845–7846 CrossRef CAS.
- M. Tsubaki, K. Nagai and T. Kitagawa, Biochemistry, 1980, 19, 379–385 CrossRef CAS.
- K. Nakamoto, I. R. Paeng, T. Kuroi, T. Isobe and H. Oshio, J. Mol. Struct., 1988, 189, 293–300 CrossRef CAS.
- T. Watanabe, T. Ama and K. Nakamoto, J. Phys. Chem., 1984, 88, 440–445 CrossRef CAS.
- W. D. Wagner, I. R. Paeng and K. Nakamoto, J. Am. Chem. Soc., 1988, 110, 5565–5567 CrossRef CAS.
- Y. Mizutani, S. Hashimoto, Y. Tatsuno and T. Kitagawa, J. Am. Chem. Soc., 1990, 112, 6809–6814 CrossRef CAS.
- J. E. Morgan, M. I. Verkhovsky, G. Palmer and M. Wikström, Biochemistry, 2001, 40, 6882–6892 CrossRef CAS.
- A. L. Woelke, A. Wagner, G. Galstyan, T. Meyer and E. W. Knapp, Biophys. J., 2014, 107, 2177–2184 CrossRef CAS.
- S. A. Siletsky, I. Belevich, N. P. Belevich, T. Soulimane and M. Wikstrom, Biochim. Biophys. Acta, 2017, 1858, 915–926 CrossRef CAS.
- M. I. Verkhovsky, A. Jasaitis, M. L. Verkhovskaya, J. E. Morgan and M. Wikstrom, Nature, 1999, 400, 480–483 CrossRef CAS.
- D. Bloch, I. Belevich, A. Jasaitis, C. Ribacka, A. Puustinen, M. I. Verkhovsky and M. Wikström, Proc. Natl. Acad. Sci. U. S. A., 2004, 101, 529–533 CrossRef CAS.
- I. Belevich, D. A. Bloch, N. Belevich, M. Wikström and M. I. Verkhovsky, Proc. Natl. Acad. Sci. U. S. A., 2007, 104, 2685–2690 CrossRef CAS.
- S. A. Siletsky, I. Belevich, M. Wikström, T. Soulimane and M. I. Verkhovsky, Biochim. Biophys. Acta, Bioenerg., 2009, 1787, 201–205 CrossRef CAS.
- V. Stumpf, K. Gokhberg and L. S. Cederbaum, Nat. Chem., 2016, 8, 237–241 CrossRef CAS.
- I. Ishigami, A. Lewis-Ballester, A. Echelmeier, G. Brehm, N. A. Zatsepin, T. D. Grant, J. D. Coe, S. Lisova, G. Nelson, S. Zhang, Z. F. Dobson, S. Boutet, R. G. Sierra, A. Batyuk, P. Fromme, R. Fromme, J. C. H. Spence, A. Ros, S. R. Yeh and D. L. Rousseau, Proc. Natl. Acad. Sci. U. S. A., 2019, 116, 3572–3577 CrossRef CAS.
- L. Qin, J. Liu, D. A. Mills, D. A. Proshlyakov, C. Hiser and S. Ferguson-Miller, Biochemistry, 2009, 48, 5121–5130 CrossRef CAS.
- A. W. Schaefer, A. C. Roveda, Jr., A. Jose and E. I. Solomon, J. Am. Chem. Soc., 2019, 141, 10068–10081 CrossRef CAS.
- J. A. Tainer, E. D. Getzoff, J. S. Richardson and D. C. Richardson, Nature, 1983, 306, 284–287 CrossRef CAS.
- P. J. Hart, M. M. Balbirnie, N. L. Ogihara, A. M. Nersissian, M. S. Weiss, J. S. Valentine and D. Eisenberg, Biochemistry, 1999, 38, 2167–2178 CrossRef CAS.
- D. S. Shin, M. Didonato, D. P. Barondeau, G. L. Hura, C. Hitomi, J. A. Berglund, E. D. Getzoff, S. C. Cary and J. A. Tainer, J. Mol. Biol., 2009, 385, 1534–1555 CrossRef CAS.
- J. J. Perry, D. S. Shin, E. D. Getzoff and J. A. Tainer, Biochim. Biophys. Acta, 2010, 1804, 245–262 CrossRef CAS.
- R. Konecny, J. Li, C. L. Fisher, V. Dillet, D. Bashford and L. Noodleman, Inorg. Chem., 1999, 38, 940–950 CrossRef CAS.
- M. A. Yu, T. Egawa, K. Shinzawa-Itoh, S. Yoshikawa, V. Guallar, S. R. Yeh, D. L. Rousseau and G. J. Gerfen, J. Am. Chem. Soc., 2012, 134, 4753–4761 CrossRef CAS.
- M. R. A. Blomberg, Biochemistry, 2019, 58, 2028–2038 CrossRef CAS.
| This journal is © the Owner Societies 2020 |

