An X-state solid–liquid mixture with unusual mechanical properties formed by water and coordination polymer nanosheet nanoarchitectonics†
Chunjing
Shi
ab,
Qi
Dang
a,
Wei
Zhang
a,
Jiwei
Cui
 *c,
Jian
Liu
*b and
Ming
Hu
 *a
*a
aEngineering Research Center for Nanophotonics and Advanced Instrument (MOE), School of Physics and Electronic Science, East China Normal University, Shanghai 200241, China. E-mail: mhu@phy.ecnu.edu.cn
bState Key Laboratory of Catalysis, Dalian Institute of Chemical Physics, Chinese Academy of Sciences, and Dalian National Laboratory for Clean Energy, 457 Zhongshan Road, Dalian 116023, P. R. China. E-mail: jianliu@dicp.ac.cn
cKey Laboratory of Colloid and Interface Chemistry of the Ministry of Education, School of Chemistry and Chemical Engineering, Shandong University, Jinan, Shandong 250100, China. E-mail: jwcui@sdu.edu.cn
First published on 19th April 2022
Abstract
Removal of water from a mixture of water and inorganic solids usually leads to a drastic change in the mechanical properties from liquid-like to brittle solid type. Here, we demonstrate that there is an unusual state, the X state, formed by naturally drying up a dough which is composed of Ni(H2O)2[(Ni(CN)4]·H2O nanosheets and water. This X-state mixture shows mechanical characteristics different from both pure liquids and brittle solids. The deformation curve of the X-state mixture contains three linear parts. However, the deformation is recoverable because the deformation curve can be repeated as long as fracture does not occur. The ice-like water formed among the nanosheets is believed to be an important reason for generating this X-state mixture. The unique properties of the X-state mixture may find applications, such as impact absorbents, which require materials with considerable strength, modulus and toughness.
Introduction
Mixtures of liquids and inorganic solids, which are generated naturally or intentionally, are widely used in a broad range of fields such as cosmetics, pharmaceutics, construction, chemical engineering, etc.1–3 The mixtures usually deform like liquids under applied stress due to the existence of a continuous liquid phase, and therefore can be categorized as a liquid- or fluid-like state (Table S1†).1–5 In general, removal of water from the water–solid mixture leads to a change of the deformation behavior from liquid-like to solid-like, while the mixtures become solutions, slurries, doughs, brittle solids, etc.1–5 Dough is generally recognized as the boundary state between the liquid state and the solid state.5–7 However, the deformation behaviors of doughs are non-specific but versatile.5–7 Fluidic, highly plastic or viscoelastic behaviors are observed, because the amount of water in the doughs is undefined.5–7 The mechanical properties of doughs are relatively unstable and they can be changed to brittle solids eventually upon evaporation of the water content.7 So far, whether there is a specific and defined state between doughs and brittle solids has remained an open question, and is worth exploring fundamentally.7,8Recently, an unusual adhesion and cohesion effect was found by drying up an aqueous dispersion of a coordination polymer, Ni(H2O)2[Ni(CN)4] nanosheets naturally.8,9 A similar effect was confirmed by drying up the dispersion of nanocellulose as well.10,11 In these cases, the modulus and strengths of the adhesives are significantly higher than those of liquids or semi-solids, suggesting that the adhesives are close to solids. However, we should note that the adhesives still contain residual water molecules because the evaporation processes usually happen in the ambient environment. This means that these adhesives are actually an assembly of water and nanoscale solids although with the properties more close to solids than the other doughs. Therefore, a new boundary state, which is neither solid-like nor liquid-like, may exist formed by water and low-dimension nanoscale solid nanoarchitectonics. However, it is still hard to validate the existence of this new boundary state between the doughs and brittle solids on the basis of the above reports because of three reasons: (1) the adhesion strengths in these cases varied about 400%, making the main origin of the mechanical strength confusing;8–11 (2) the shear–strain deformation curves in these cases were different, making the deformation mechanism hard to understand; (3) the initial states of the reports started from the aqueous dispersions, therefore many possible transition stages may exist before reaching the eventual state.
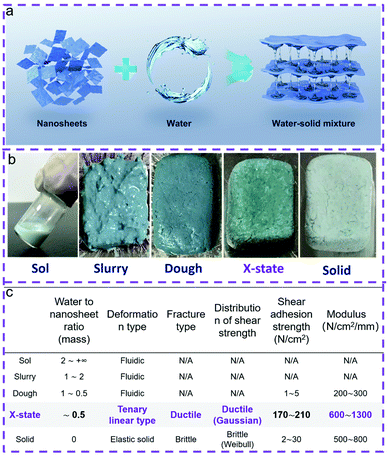
Here, we demonstrate that there is an X-state which is different from liquids or solids formed by water and coordination polymer nanoarchitectonics. In this case, the solid phase is composed of Ni(H2O)2[(Ni(CN)4]·H2O nanosheets, and the liquid phase is water (Fig. 1). This X-state mixture deforms in a non-linear way. The force–displacement curves contain three linear parts, which are different from both a dough and brittle solid. The ice-like water formed between the nanosheets is believed to be one of the reasons for generating this X-state mixture. The unique properties of the X-state mixture may be useful in applications which require materials with considerable strength and toughness.
Results and discussion
The Ni(H2O)2[(Ni(CN)4]·H2O nanosheets were of uniform size and shape (Fig. S1†). The lateral size is about 180 ± 20 nm. The thickness is about 14 ± 6 nm. The recorded powder XRD patterns reveal that Ni(H2O)2[(Ni(CN)4]·H2O is consistent with the orthorhombic structure (L1 phase) (Fig. S2†).12 Non-coordinated water molecules are found among the infinite coordinated layers (Fig. S3†). The coordinated water molecules distribute at both sides of a given layer.We mixed the nanosheets with water to form solid–liquid mixtures. The concentration of the nanosheets is in the range of 20–600 mg mL−1. The mixtures looked like liquids (Fig. S4a–d†). The rheological properties of the liquid mixtures were characterized. Fig. S5† illustrates that an appreciable escalation of the modulus is obtained with the increase of the nanosheet concentration at low shear stress. A decrease of the shear modulus happened in all the samples when the shear stress became higher, suggesting a pseudo plastic behavior which is usually observed in fluids containing colloidal particles.2 The viscosity versus shear strain rate curves suggest that all the mixtures present typical shear thinning behavior (Fig. S6†). This behavior has been observed in many colloids or macromolecule solutions, confirming that the mixtures with a concentration of the solids from 20 to 600 mg mL−1 are fluids.
By further increasing the concentration of the nanosheets to 800–1000 mg mL−1, the mixtures were changed from the liquid form to the slurry form (Fig. S4e and f†). The slurry form mixture can temporarily keep the shape; however, it is easily deformed permanently under weak shear stress. The mixtures became tougher when the concentrations of the nanosheets were in the range of 1200–2000 mg mL−1 (Fig. S4g–j†). These mixtures are doughs which present partially recoverable deformation under shear stress. Particularly when the external shear stress is low, the shear deformation can be greatly recovered after the removal of the shear stress. Doughs have been commonly observed in daily life such as wheat food.5 The wet doughs became fragile solids once the water molecules have been completely removed.
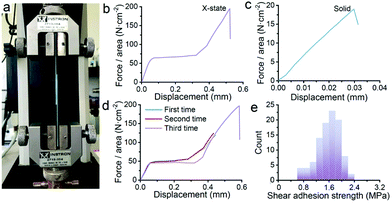
Surprisingly, the dough reported here can be converted into a new form, an X-state mixture, by naturally drying up the dough under ambient conditions (25 °C, 40% RH) for 12 h. The mechanical properties were characterized by sandwiching the X-state mixture between two pieces of glass slides. A shear tensile test was employed as shown in Fig. 2a. A force–displacement curve shows a non-linear characteristic (Fig. 2b). The first part presents a linear relationship which is caused by elastic deformation. The second part starts from a yielding point. The displacement increases under the constant shear force, forming a horizontal line. This part is analogous to flow deformation which is a typical fluidic behavior. The third part comes after the second part. A linear increase of the shear force with the displacement happens again. The straight line keeps elongating until a rupture occurs at 200 N cm−2. The sudden failure is typical of the failure of the brittle sample. The three-part deformation is totally different from that of a dried solid. Fig. 2c illustrates a typical force–displacement curve of the solid obtained after drying the dough under vacuum conditions. The curve suggests an elastic deformation with almost no plastic deformation. In addition, the shear adhesion strength and the displacement are much lower and shorter than those of the X-state sample. This is typically for brittle ceramics or glass.
Apparently, the X-state sample behaves in a complicated way. To understand whether the second and third parts in Fig. 2b come from plastic deformation, we repeat the shear tensile tests on one sample several times. Fig. 2d shows the force–displacement curves. All the curves stack on each other if we do not break the sample. For the first two rounds, the curves were carefully recorded by stopping stretching before the failure point. After relief of the loading force, the third round curve is still similar to the curve of the first round test. This result means that the deformation of the X-state sample is recoverable when the deformation is within the limit. This behavior is very close to viscoelastic materials.1
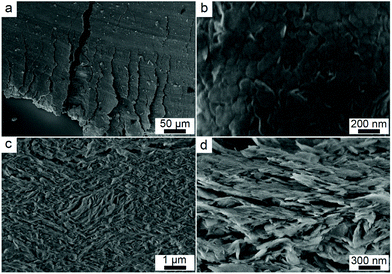
Fracture analysis suggests a ductile characteristic of the X-state sample. The statistic shear adhesion strength matches with a typical Gaussian distribution, which is a sign for ductile solids (Fig. 2e).1 The ductility is not caused by a slip between the glass slides and the sample. We took photos of the fracture samples (Fig. S7†). All the glass slides have nanosheets on the surfaces after the test, suggesting that failure happens inside the mixtures themselves rather than at the interface between the mixtures and the glass slides. The microstructures of the mixtures before and after the fracture explain the ductile behavior. Fig. 3a and b are top-view images of the facture surface. The surface is smooth with the nanosheets densely packed together. Fig. 3c and d are the side-view images of the fracture surface. The nanosheets were laminarly locked together, suggesting the movement and re-arrangement of the nanosheets during the deformation process. The SEM images explain the non-linear deformation curve of the X-state mixture. At first, the nanosheets were bound tightly, showing elastic deformation behavior (Fig. 2b). Then, the nanosheets slid along each other, presenting a horizontal curve in Fig. 2b. After that, the nanosheets formed several domains and were locked with each other. Therefore, another elastic deformation curve was observed before the final failure of the mixture.
The mechanical properties obtained from the shear tensile test confirm that the X-state sample is different from the dough and brittle solids. The specific deformation behavior and the ductile fracture characteristic probably come from dynamic interactions among nanosheets. Therefore, we need to understand the interactions among nanosheets.
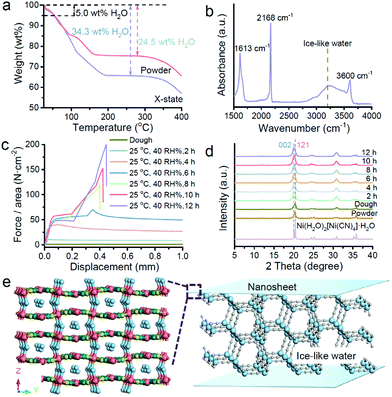
Because the X state is between the dough state and solid state, we employ thermoanalysis to confirm the existence of water first. Fig. 4a compares the thermogravimetric (TG) curves of the powdery nanosheets and the X-state sample. The water content of the powder sample matches with the chemical formula, Ni(H2O)2[(Ni(CN)4]·H2O. For the X-state sample, extra water exists in the solid. According to the water amount, the calculated chemical formula of the X-state sample should be close to Ni(H2O)2[(Ni(CN)4]·4.4H2O. We characterized the crystal structure of the X-state sample by XRD. Fig. S8† illustrates that the sample remains an orthorhombic structure, matching with the structure of Ni(H2O)2[(Ni(CN)4]·H2O. This structure is different from the structure of Ni(H2O)2[(Ni(CN)4]·4H2O, suggesting that the extra water molecules may not be inserted between the infinite 2D networks, but in the interspaces among the naonosheets which contain 5–10 layers of 2D networks.12 The configuration of the water molecules is characterized using IR spectra (Fig. 4b). The absorption band is a broad single peak at 3230 cm−1 which suggests the existence of ice-like water molecules.13–15 These ice-like water molecules should be located among the nanosheets. One side of the ice-like water may strongly coordinate with the Ni sites in the nanosheets, and the other side may form hydrogen bonding with other water molecules, providing strength and modulus for the X-state sample.
To confirm our deduction, we recorded the dynamic change of the force–displacement curves during the dough to X-state mixture conversion process (Fig. 4c). The conversion was realized by gradual evaporation under ambient conditions (25 °C, 40% RH) in a constant chamber. The dough state sample shows almost no shear adhesion strength. It deforms under shear stress and keeps deformation without suffering fracture. After two hours of drying, the yield strength emerged. An elastic deformation part is observed. After yielding, the sample deformed continuously under the shear stress. After drying for 6 hours, the yield strength further increased. The deformation after yielding was temporarily stopped with a small increase of the strength again. The second increase of the strength did not last long. A second yielding point emerged soon after, leading to continuous deformation again. By continuing to increase the drying time, the force–displacement curves became three-part lines which are similar to the X-state shown in Fig. 2b. The shear adhesion strengths were enlarged with elongation of the evaporation time until 12 h. Fig. S9† shows that the shear adhesion strength was up to 2 MPa after 12-hour evaporation. This value is very stable as the shear adhesion strength was almost unchanged up to 720 h.
We tried to clarify the correlation between the mechanical properties and the possible structural change. Evolution of the structure of the nanosheets was recorded by in situ X-ray diffraction (Fig. 2d). All the diffraction patterns match with the simulated diffraction pattern from a cif file of Ni(H2O)2[(Ni(CN)4]·H2O, implying no crystal structure change. However, the increase of the diffraction intensity of the (002) facets can be observed with elongation of the evaporation time, indicating preferential stacking of the nanosheets in a laminar fashion. We can deduce that the free water molecules in the dough state gradually go into air. The remaining water molecules can attach on the surface of the nanosheets, attracting the nanosheets to stack laminarly. We should note that there is no other ordering at the mesoscale. Small-angle X-ray diffraction profiles suggest that the X-state and powder samples are very similar (Fig. S10†).
The time-course deformation curves and the in situ X-ray diffraction profiles suggest the probable role and structure of the water molecules in the X-state samples. In the initial dough sample, there are both liquid water and ice-like water molecules. The nanosheets are separated by a continuous liquid layer. Under shear stress, the nanosheets instantly slide on the liquid water layer, leading to no significant strength. After natural evaporation, the amount of the liquid water molecules is reduced. The distance among the nanosheets should be reduced, enhancing interparticle interactions. Because the ice-like water molecules attach on the nanosheets, hydrogen bonds among the ice-like water molecules and the coordination bonds between the water molecules and the nanosheets can crosslink the nanosheets, hindering the deformation of the bulk solid under shear stress.12,14,15 Therefore, the adhesion strength of the solids becomes high, leading to a maximized shear strength. On the basis of our analysis, the possible structure of the X-state sample is illustrated in Fig. 4e. The ice-like water molecules connect the nanosheets.
To confirm this deduction, we naturally dried the dough state sample to the X-state and recorded the IR and Raman spectra of the samples during the evaporation process. Fig. S11a† shows that the ice-like and liquid water molecules co-exist in the dough state sample.16 The amount of both the ice-like and liquid water molecules decreases upon evaporation. After 12 h, the obtained sample contains more ice-like water molecules than liquid water molecules (Fig. S11d†). The residual liquid water molecules may form a liquid layer for sliding, but are not enough to separate the nanosheets far. The ice-like water molecules on the nanosheets can bring the nanosheets together. Therefore, the water structures correspond to the fact that the X-state sample can slide but need larger shear forces.
Fig. S12† shows the Raman spectra of the sample during the evaporation process. The peaks at 2154 and 2186 cm−1 are attributed to the bending vibrations of the CN group.17 The peaks at 272 and 528 cm−1 correspond to the stretching and bending mode of Ni–CN–Ni.18 The complexity of the vibrational spectrum of water is illustrated in Fig. S12b.† The Raman spectra have two main broad bands around 2900 cm−1 and 3500 cm−1, which are assigned to the symmetric stretching vibration of the OH group.19,20 This result suggests the existence of water molecules among the nanosheets.
Based on the structure of the X-state mixture, the ice-like water molecules may be removed, changing the X-state sample into a brittle solid. Fig. S13† shows that the dough state sample becomes the X-state sample after naturally drying. However, if the evaporation occurred at 100 °C under vacuum, the sample became brittle. Only a short linear part can be observed, corresponding to elastic deformation and brittle fracture. According to Fig. 4a, the ice-like and free water molecules can be removed under this condition. Therefore, this result clearly suggests that the shear strength of the X-state mixture should be attributed to bonding among the ice-like water molecules and the nanosheets.
The mechanical properties of the samples are characterized by sandwiching the samples between glass slides. The possible contribution from the interaction between the ice-like water molecules and the glass slides or the coordination interaction between the Ni of the nanosheets and the oxygen of the glass slide may have to be counted. We compared two sets of conditions. Fig. S14 and S15† compare the mechanical properties of the X-state samples which are sandwiched between the Si plates with and without HF treatment. The HF treatment can remove the surface oxygen, minimizing both the interaction between the ice-like water molecules and the oxygen of the substrates and the coordination interaction between the Ni of the nanosheets and the oxygen on the substrates. In both cases, we observe the typical three-part deformation behavior. However, the shear adhesion strengths of the samples, which are sandwiched between the HF treated Si plates, are 0.3–0.4 MPa lower than that of the non-treated plates. Fig. S16 and S17† further compare the mechanical properties of the samples which are sandwiched between the Si plates which are treated/non-treated by HF. The samples are dried from the X-state mixture. The shear adhesion strength difference is about 0.03–0.04 MPa. The shear adhesion strength differences in Fig. S16 and S17† correspond to the coordination interaction between the Ni sites of the nanosheets and the oxygen atoms on the substrates. The shear adhesion strength differences in Fig. S14 and S15† correspond to the sum of the interaction between the ice-like water molecules and the oxygen of the substrates and the coordination interaction between the Ni of the nanosheets and the oxygen on the substrates. We can deduce that the total strength contribution from the substrates is less than 20%.
To verify whether other hydrophilic nanosheets can form an X-state sample, TiO2 nanosheets were tested. Fig. S18† presents the TiO2 sample which is composed of nanoplates with thicknesses of 10–20 nm. The hydrophilicity of the nanosheets is confirmed by the wetting test. Fig. S19† shows that water droplets can be spread on the surface of the TiO2 sample, indicating that the sample is hydrophilic. We evaporated the TiO2 dough between two glass slides under ambient conditions (25 °C, 40% RH) for 12 h, and then performed shear tensile tests. Fig. S20† shows that the shear force vs. displacement curve is composed of three parts, which is similar to the curve of the X-state sample. However, the shear strength is 1% of the X-state sample formed by Ni(H2O)2[(Ni(CN)4]·H2O nanosheets. The horizontal line suggests that water layers probably exist among the TiO2 nanoplates; therefore, sliding can happen during the tensile test. The shape of the shear force vs. displacement curve indicates that the X-state may exist in other hydrophilic nanosheet systems. However, due to the very low shear adhesion strength, further investigation needs to be performed in the future.
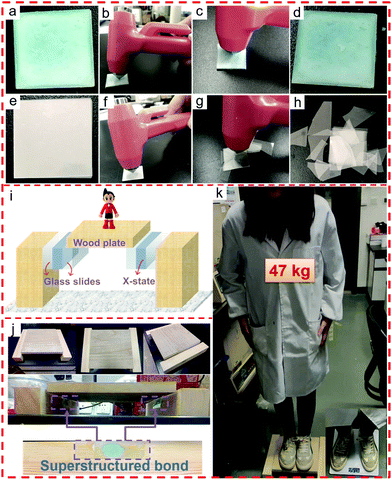
The unique mechanical properties of the X-state mixture make it a potential adhesive for anti-impact applications. We fabricated a laminated glass by sandwiching the dough among ten glass slides. Then, the laminated glass was naturally dried under ambient conditions (25 °C, 40% RH) in a constant temperature humidity climatic chamber over 1 day. As a result, the X-state mixtures were sandwiched among the glass slides (Fig. 5a). Impact testing was employed by using a hammer to hit the laminated glass slides (Fig. 5b). After hitting, the laminated glass slides were still bonded together (Fig. 5c). Close investigation on the hit point reveals that a pit is formed at the hit point. In the laminated glass panels, the fragments produced a small residual puncture (Fig. 5d). However, most of the slides are completely protected. For comparison, 10 glass slides were stacked together without using any adhesive (Fig. 5e). Impact testing was employed using a hammer to hit the laminated glass as well (Fig. 5f). All the glass slides were almost broken into ten to twenty large fragments with multiple catastrophic cracks emanating from the loading point to the edge of the panel (Fig. 5g and h). We can clearly conclude that the X-state mixture can provide ductile deformation; thus the impacting energy can be absorbed to protect the very fragile glass slides.
To further demonstrate the significance of the high modulus and strength of the X-state mixture in other cases, the X-state mixture was sandwiched between two pieces of glass slides. Fig. 5i shows a scheme to show how the bonded glass slides were placed as the support for a piece of wood plate (25 cm × 25 cm × 5 cm). Basically, one side of the wood plate is supported by one piece of the bonded glass slide. The modulus and strength should only be provided by the X-state mixture. This illustration is realized experimentally as shown in Fig. 5j–k. A person with a body weight of 47 kg could be supported by the wood plate. The step on/off process did not destroy the X-state mixture. This result demonstrates that the X-state mixture has considerable modulus, strength and toughness for practical applications.
We should note that the thickness of the X-state samples needs to be considered during practical use. Fig. S21† shows the shear force vs. displacement curves of X-state samples. With the increase of the thickness, the horizontal line is shortened. For the sample with a thickness of 2.83 nm, the horizontal line disappears. The shortening and disappearance of the horizontal line probably mean that the orientations of the domains formed by nanosheets are too different to allow sliding among nanosheets. Without sliding, flaws in the thicker samples cannot be fixed. Therefore, the shear adhesion strength may be reduced because of the increased probability of flaw growth. Fig. S22† confirms that the shear adhesion strength is reduced upon increase of the thickness of samples. The shear adhesion strength is reduced from ∼200 N cm−2 to ∼60 N cm−2 after increasing the thickness of samples to 2.83 nm. Therefore, for adhesives, it would be important to use the X-state sample with a thickness of about 1.6 mm.
Conclusions
In summary, an X-state liquid–solid mixture was obtained when a dough formed from Ni(H2O)2[(Ni(CN)4]·H2O nanosheets and water was dried naturally. This X-state mixture deforms in a specific non-linear way. The force–displacement curves contain three linear parts, which is caused by interactions between the nanosheets and the ice-like water. The unique properties of the X-state mixture presented a new state of the coordination polymer based composite. The considerable strength and toughness allow the X-state mixture to be used as an impact absorbent.Materials and methods
Synthesis of Ni(H2O)2[Ni(CN)4]·H2O nanosheets
In a typical experiment, 0.3 mmol dihydrate trisodium citrate and 0.4 mmol NiCl2·6H2O were added to a glass bottle with 20 mL of deionized water to form solution A. Meanwhile, 0.4 mmol K2[Ni(CN)4] was dissolved in 20 mL of deionized water to prepare another clear solution (solution B). After that, solution A was transferred into solution B and aged at room temperature for 1 day. Then, the blue product was harvested by centrifugation, washed with deionized water and ethanol several times, and finally dried at room temperature in air for subsequent operation.Tensile test
30 mg of the nanosheets was dispersed in 25 μL of deionized water to obtain a dough. The dough was sandwiched between two glass slides and incubated in a constant temperature humidity climatic chamber (25 °C, 40% RH) for 24 h. Lap-shear tests were performed on an Instron 2344 machine at a speed of 1 mm min−1. The overlap areas were measured in each case.Characterization
SEM observations were performed using a Hitachi 4800 FESEM. Wide-angle PXRD patterns were obtained with a Rigaku RINT 2500 X diffractometer using monochromated Cu Kα radiation (40 kV, 40 mA) at a scanning rate of 1° min−1. The shear strain observation was performed on a HAAKE RS6000 (25 °C, C35/1° Ti L07116, diameter: 35 mm, core angle: 1°).Conflicts of interest
The authors declare no competing financial interest.Acknowledgements
The work is supported by the National Natural Science Foundation of China (No. 52173252).Notes and references
- M. A. Meyers and K. K. Chawla, in Mechanical Behavior of Materials, Cambridge University Press, Cambridge, 2009 Search PubMed.
- T. F. Tadros, in Colloids in Paints, Wiley-VCH Verlag GmbH & Co. KGaA, 2010 Search PubMed.
- H. G. Merkus, in Particulate Products, ed. H. G. Merkus and G. M. H. Meesters, Springer International Publishing, Switzerland, 2014 Search PubMed.
- S.-T. Tsai, Appl. Math. Mech., 1981, 2, 291–296 CrossRef.
- A. Baltsavias, Thesis, Landbouwuniversiteit, Wageningen, 1996.
- M. G. Scanlon and J. H. Page, Cereal Chem., 2015, 92, 121–133 CrossRef CAS.
- C.-N. Yeh, H. Huang, A. T. O. Lim, R.-H. Hang, C.-H. Chen and J. Huang, Nat. Commun., 2019, 10, 422 CrossRef CAS.
- Y. Y. Zhao, W. W. Li, X. F. Jiang, F. Q. Li, X. Li, W. Zhang, J.-S. Jiang, J. Liu, K. Ariga and M. Hu, ACS Nano, 2017, 11, 3662–3670 CrossRef CAS.
- Y. Y. Zhao, X. Li and M. Hu, Chin. Chem. Lett., 2019, 30, 630–633 CrossRef CAS.
- B. L. Tardy, J. J. Richardson, L. G. Greca, J. Guo, H. Ejima and O. J. Rojas, Adv. Mater., 2020, 32, 1906886 CrossRef CAS PubMed.
- H. Liu, Y. Feng, X. Cao, B. Luo and M. Liu, ACS Appl. Mater. Interfaces, 2021, 13, 11356–11368 CrossRef CAS.
- J. Rodríguez-Hernández, A. A. Lemus-Santana, C. N. Vargas and E. Reguera, C. R. Chim., 2012, 15, 350–355 CrossRef.
- D. B. Asay and S. H. Kim, J. Phys. Chem. B, 2005, 109, 16760–16763 CrossRef CAS PubMed.
- T. Igarashi, M. Hoshi, K. Nakamura, T. Kaharu and K.-I. Murata, J. Phys. Chem. C, 2020, 124, 4196–4201 CrossRef CAS.
- X. B. Chen, A. Sagara, K. Gandrud, M. Murata, J. A. Steele, H. Yabe, T. Hantschel, M. Roeffaers, M. Tomiyama, H. Arase, Y. Kaneko, M. Shimada, M. Mees and P. M. Vereecken, Sci. Adv., 2020, 6, eaav3400 CrossRef CAS PubMed.
- B. Torun, C. Kunze, C. Zhang, T. D. Kuhne and G. Grundmeier, Phys. Chem. Chem. Phys., 2014, 16, 7377–7384 RSC.
- S. F. A. Kettle, E. Diana, E. M. C. Marchese, E. Boccaleri and P. L. Stanghellini, J. Raman Spectrosc., 2011, 42, 2006–2014 CrossRef CAS.
- T. Huang, G. Du, Y. Qi, J. Li, W. Zhong, Q. Yang, X. Zhang and M. Xu, Inorg. Chem. Front., 2020, 7, 3938–3944 RSC.
- L. Shi, S. M. Gruenbaum and J. L. Skinner, J. Phys. Chem. B, 2012, 116, 13821–13830 CrossRef CAS.
- M. H. Brooker, G. Hancock, B. C. Rice and J. Shapter, J. Raman Spectrosc., 1989, 20, 683494 CrossRef.
Footnote |
| † Electronic supplementary information (ESI) available. See DOI: https://doi.org/10.1039/d1nr08114d |
| This journal is © The Royal Society of Chemistry 2022 |

