 Open Access Article
Impact of ablation cell design in LA-ICP-MS quantification
Pascal
Becker
 ,
Joachim
Koch
 and
Detlef
Günther
 *
*
Laboratory of Inorganic Chemistry, Department of Chemistry and Applied Biosciences, ETH Zurich, Vladimir-Prelog-Weg 1, 8093 Zürich, Switzerland. E-mail: detlef.guenther@sl.ethz.ch
First published on 21st July 2022
Abstract
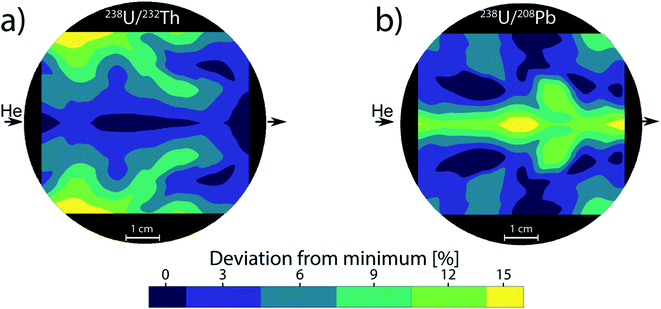
Bulk analysis in laser ablation inductively coupled plasma mass spectrometry (LA-ICP-MS) has commonly made use of large one-volume ablation cells of various geometries. These ablation cells offer significant dispersion of aerosols, resulting in stable signals but a loss of spatial and temporal resolution. In recent years, low dispersion ablation cells, most commonly two-volume cells, have been invented for the purposes of depth profiling and imaging due to their capabilities to resolve individual laser pulses. In this study, the differences between the two types of ablation cells were studied based on ICP-MS analysis, optical particle sizing and computational fluid dynamics. Differences in particle size distributions (PSD) and elemental ratios were investigated with respect to positional dependence within an ablation cell. 3D-gas flow patterns by CFD formed in a plain large one-volume cylindrical cell (30 cm3) revealed inhomogeneous gas flow patterns, where the location of ablation has an impact on the aerosol residence time within the cell. As a consequence, the mean particle size that is transported to the ICP varies from 80 nm to 150 nm for a cylindrical ablation cell. Correlating with the PSD, the ratio of 238U/232Th and 238U/208Pb varied by up to 15% using the same parameters but different ablation locations within the cell. As this deviation directly affects quantification, methods for matching in provenance studies, geochronology and forensics are especially vulnerable to these errors. For the low dispersion cell experiments, the recently described parallel flow ablation cell (PFAC) was used as an exemplary model. Mean particle sizes were significantly lower by a factor of more than 2, and the variation of the elemental ratios depending on the location within the cell was significantly reduced from 15% to 5%. Through use of longer transport tubing, it is possible to change from resolved laser pulses to continuous stable signal akin to large volume ablation cells, while still using the PFAC. This smoothing of the aerosol showed no effect on element ratios, resulting in comparable results as the resolved measurements. This work indicated that low dispersion ablation is more successful in achieving reproducible element ratios. It was also found that a decrease in aerosol dispersion within the ablation cell helps to suppress plasma induced fractionation effects originating from incomplete ionization.
Introduction
Laser ablation inductively coupled plasma mass spectrometry (LA-ICP-MS) has been established as a state-of-the-art method for the analysis of elements or isotopes in a wide variety of solid materials.1–3 This method has found applications in forensics, materials sciences, geology, biology and medicine. It is especially suitable for the analysis of samples that cannot be digested, require spatial information, or necessitate a quasi-non-destructive approach.4–8 LA-ICP-MS allows for the determination of element concentrations with low limits of detection, as well as simultaneous isotope-ratio analysis.9 Samples are placed inside an air-tight ablation cell, which is connected to the ICP through a system of tubing and the laser generated aerosol is then transported using a carrier gas (commonly He or Ar).10–15Numerous ablation cells have been described and used for routine analysis.11,12,16 Among those, medium-to-large volume cells of cylindrical or rectangular shape have been proven to provide stable signals, and offer sufficient space to fit several samples and standards at once, preventing a reopening of the ablation cell during an experiment.17 However, medium-to-large volume cells show non-uniform gas flow patterns, the effect of which can be increased when macroscopic samples of different sizes and shapes are analyzed. As gas flows become turbulent or irregular, the washout time increases. This results in a decrease of the signal to noise ratio and a loss of particles, which lowers the sensitivity.18 A different approach are the so-called two-volume cells, which consist of a large sample chamber equipped with an XYZ-stage, and a small volume ablation cell with a small opening at the bottom that is placed on top of the sample. These ablation cells are commonly used to achieve short washout times (“low dispersion ablation cells”) for purposes of imaging or single pulse analysis, mostly in combination with ICP-TOFMS instruments.19–21 Wang et al.22 described a two-volume low-dispersion cell referred to as the tube cell, which inspired several future cells for the purposes of short washout times.20–23 Since the openings are often smaller than the sample itself, these cells allow for the most similar local gas flow for all sample positions. While this does not prevent the loss of particles, it results in more reproducible sample transport.18,24
During the process of laser ablation, the solid material undergoes a phase change from solid to liquid to gaseous. This transformation is then reversed through adiabatic expansion to recombine into mostly neutral particles due to ambient pressure.25–29 Several particle formation mechanisms during laser irradiation have been described previously in the literature,25 but this work will focus on the dominant generation of nanoparticles and their transport and vaporization within the ICP. During and after LA, the ablated material is vaporized and forms the laser plasma plume. As the plume expands into the ambient atmosphere, the vapor is cooled. This results in condensation, nucleation and formation of particles which can range from a few to several hundreds of nanometers. This process of particle growth depends on several parameters, such as laser fluence, wavelength, gas pressure, sample gas and ablated material.30–35 The resulting particle size distribution (PSD) can vary significantly if any of these parameters change during a measurement series. As this process depends on atomic and particle collision, a turbulent flow can further increase the average particle sizes.25,36,37 Furthermore, agglomeration of particles can happen if the particle number concentration is high enough.38 Particles that are larger than a critical size (varies depending on material and ICP conditions) are no longer fully atomized and ionized in the ICP. This results in potential fractionation effects and a loss of sensitivity.39,40 Additionally, it is possible to have a separation of larger and smaller particles during the aerosol transport within the cell,41 and during the transport afterwards.42 Previous works have shown that larger particles show different elemental distributions than smaller ones, which enhances elemental fractionation effects and results in inaccurate or imprecise quantification.39,43 The particle number concentration is highest at the ablation site, which indicates possible agglomeration immediately after particle formation.44 However, changes of the particle/aerosol structure due to agglomeration (or break-up of agglomerates within sections of turbulent flow) during the washout and transport to the ICP, or during the deposition onto TEM grids, while unlikely, cannot be excluded.
Particle sizes are commonly measured using laser-light scattering, which cannot differentiate between agglomerates and particles. All particles are assumed to be spherical, which is true for the laser generated particles, but not for agglomerates, which have been shown by previous studies using TEM grids indicating the formation of cotton-like structures.45 However, laser-light scattering offers online measurement of particles, and thus reduces the risk of further agglomeration, especially processes during deposition onto the filter. As such, it offers the closest approximation to the behavior of particles before entering the ICP.45
As previous works recognized a sample position dependent effect on quantification within the ablation cell,27,29,46 this work reassesses these findings in the context of particle agglomeration within two ablation cell geometries caused by gas dynamics. Special focus was put into experimental data for fast washout cells (in this case, a tube cell variation), which is shown and compared to data acquired on more common cylindrical ablation cells. The comparisons are based on particle size measurements and the element ratios, respectively.
Experimental
Instrumentation
Experiments were carried out using an ArF excimer laser (193 nm, GeoLas C, Lambda Physik, Göttingen) equipped with a cylindrical ablation cell previously described by Koch et al.17 The cell was equipped with a jet nozzle inlet (0.5 mm diameter) for high gas velocity at the center of the ablation cell. The cell was operated using helium gas (99.999%, PanGas AG, Dagmersellen, Switzerland) and mixed with argon gas (99.999%, PanGas AG, Dagmersellen, Switzerland) using a laminar flow adapter in front of the ICP torch. The measurements were carried out using an Agilent 7500cs quadrupole ICP-MS (Agilent, USA). For the particle size measurements, an Ultra-High Sensitivity Aerosol Spectrometer (Droplet Measurement Technologies, Longmont, CO, USA) was used.For the low dispersion experiments, a modified parallel flow ablation cell (PFAC),47 was operated using the same gas mixture consisting of He and Ar. The PFAC is a two-volume ablation cell based on the tube-cell design described by Wang as mentioned previously.22 and used here as a model case for other two-volume cells. The opening slit of the cell was widened from 1.5 mm to 3.5 mm to reduce turbulence and allow better transport of particles generated when using larger spot sizes. This resulted in slightly longer but more reproducible washout durations. Due to the still fast washout nature of the ablation cell (<30 ms for 44 μm ablation spot diameter), it was coupled to a TOFMS mass analyzer (icpTOF2R, TOFWERK AG, Thun, Switzerland) for quasi-simultaneous detection of the entire mass range.48 The ICP-TOFMS instrument was operated in reaction cell mode using hydrogen (99.9999%, PanGas AG, Dagmersellen, Switzerland). The operating conditions for the laser and the ICP-TOFMS are summarized in Table 1. PSD measurements were also carried out for the low dispersion cell. Unfortunately, the generated aerosols were below the size limit of detection of the particle spectrometer. As only the upper size limit of the particle distributions could be measured, a direct comparison of the PSD was not possible. However, this will be discussed in detail in the results and discussion section.
| Laser ablation | PSD | ICP-QMS | ICP-TOFMS |
|---|---|---|---|
| a Used for aerosol smoothing. | |||
| Repetition rate | 1 Hz | 10 Hz | 4 Hz/10 Hza |
| Spot size | 44 μm | 44 μm | 44 μm |
| Laser fluence | ∼15 J cm−2 | ∼15 J cm−2 | ∼15 J cm−2 |
| Sample gas (He) | 0.9 L min−1 | 0.9 L min−1 | 1.5 L min−1 |
| Carrier gas (Ar) | 0.7–0.75 L min−1 | 0.7–0.75 L min−1 | 0.7–0.75 L min−1 |
| ICP-MS | PSD | ICP-QMS | ICP-TOFMS |
|---|---|---|---|
| Cooling gas (Ar) | — | 15 L min−1 | 16 L min−1 |
| Auxiliary gas (Ar) | — | 0.9 L min−1 | 0.8 L min−1 |
| Sampling depth | — | 5–5.5 mm | 5–5.5 mm |
| RF power | — | 1450 W | 1550 W |
Analysis procedure
Eight NIST SRM 612 samples of approx. 1.5 cm diameter each were placed at equal height directly below the jet nozzle gas entrance (0.4 mm diameter). The samples were arranged in a semi-circle, as the results could be mirrored due to symmetric gas flows. PSD measurements were conducted in a laminar flow hood, preventing the influence of background particles. Since the optical spectrometer was operated at 50 ml min−1 of input gas, three Y-piece Legris adapters were used in series to allow for a gas outlet and prevent back pressure. The Y-pieces were connected using approx. 30 cm long pieces of PVC tubing (4 mm inner diameter) to increase the active volume and thus dilute the aerosol further through diffusion. This dilution method was chosen because it has the lowest effect on agglomeration and negligible particle loss within the tubing.42 In preliminary experiments, it was verified that the length of the transport tubing had no measurable effect on the agglomeration of particles. 5 laser pulses at 1 Hz frequency were used to clean the surface and to prevent crater formation effects which are known to show larger particle distributions.49 The cell was flushed for 2 minutes afterwards to ensure that there was no aerosol remaining in the ablation cell, before 5 pulses were applied to the same spot. The aerosol spectrometer measurements were started concurrently with the laser ablation and lasted for 2 minutes each run. For the ICP-QMS measurements using the cylindrical cell, the cell was connected to the ICP using PVC tubing of comparable length to those applied during the PSD measurements. A measurement sequence started with 40 s of background signal acquisition before starting the ablation for 60 s. The ICP-TOFMS single pulse measurements were acquired using 205 laser pulses at 4 Hz laser frequency, where the first 5 laser pulses were discarded as cleaning pulses and to avoid crater formation effects as done in the previous experiments, due to their significantly different elemental ratios. For the aerosol smoothing experiments, the same approach was used as described for the quadrupole ICP-MS measurements. After every measurement series, the first position was analyzed again to correct for instrumental drift.Ablation cell fluid field modelling
The 1st proof of concept of 3D comprehensive fluid field modelling of LA cells (and attached aerosol transport systems) date from the early 2000s when the use of so-called computational fluid dynamics (CFD) for analytical equipment and, in particular, the design adaptation of ICPMS nebulizer/spray chamber assemblies was reviewed.50 Therein, the authors not only outlined the advantages CFD may offer beyond the conventional trial-and-error principle but also suggested domain parametrization and co-use of evolutionary algorithms as optimization tools.51 Since then, remarkable advances have been made in cell design, whereas the main focus of CFD has shifted towards the visualization/illustration and understanding of a LA cell's flow field features, rather than performing systematic optimization of its design, as initially suggested.18,52,53CFD simulations of the fluid field formed inside the LA cell were done in steady-state mode using the CFX software package by ANSYS [Canonsburg, PA, USA] which, in essence, makes use of the Navier–Stokes equation system. The full set of governing equations are not recapitulated here for brevity. Neither add-on thermodynamic nor specific turbulence model relations are given. All theoretical background information can be found in, e.g., textbooks dealing with Newtonian fluid mechanics,54 the ANSYS CFX theory guide (online access through license), or in aforementioned scientific publications and references therein.
A computer-aided design (CAD)-model of the cell inner domain was drawn to scale and partitioned into a numerical grid consisting of approximately 2 × 10⁶ finite volume elements allowing resolution of features in an approximate size range of 0.25 mm. Low error-tolerance solver convergence control settings were made prior to executing simulation jobs: 10–6 residuals for mass, momentum, energy, and turbulence using 2500 (minimum number) of iterations each run. Both Ar and He were defined as sub-components of the domain's fluid, i.e., gaseous phase with buoyant forces and binary diffusion enabled. Turbulent flow was accounted for by selecting the so-called shear stress transport (SST) model. Notably, no aerosol or discrete solid phase was assumed to coexist.
Such phases are used for tracking of individual particles/aerosols and, thus, for determining, e.g., the degree of spatial and temporal dispersion of aerosols, whereby input of the following boundary conditions are required: mean size, mass, density, and initial velocity of particles as well as position and size of the source volume. The latter is crucial but difficult to specify with sufficient accuracy, in particular, when the inner dimensions of the aerosol extraction compartment become comparable with the size of the particle source volume. In fact, the source volume may stay small-size or reach the LA cell's inner dimensions depending on the portion of laser pulse energy absorbed by the target and the target material's thermodynamic properties which pre-define or, more precisely, split the absorbed energy into portions consumed by material decomposition, particle formation etc. and, eventually, aerosol expansion.
Fluid field features in brief
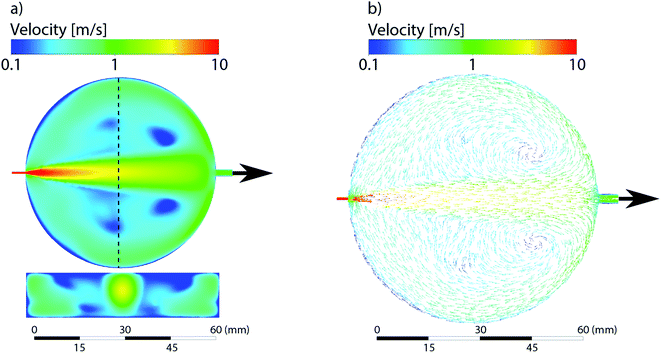
Reynolds numbers within and downstream of the cell's LA compartment referred to as aerosol extraction channel in the following were below critical, mainly due to use of He. Vector/streamline plots revealed little-to-no turbulent patterns, which suggested laminar flow throughout the domain under the conditions chosen. The gas mean velocities along the aerosol extraction channel reached values of more than 5 m s−1 and were, therefore, far greater than those arising from the diffusion-driven motion of He/Ar. In fact, spreading rates by diffusion were found to be in an approximate range of <0.05 m s−1 and, thus, still two orders of magnitude lower when compared with gas velocities. As a result, the intermixing of He and Ar within the LA cell remained incomplete.Results and discussion
Position dependent laser ablation
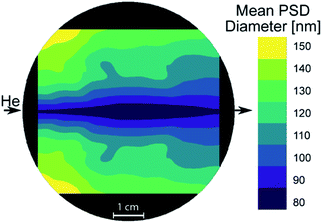
First experiments focused on the classical cylindrical ablation cells which have been used for a long period of time in LA-ICP-MS. Ablation at the center of the cylindrical ablation cell shows narrow distributions of smaller particles, when compared to ablation at the edge of the ablation cell (Fig. 1). Edge ablation results in larger measured particles and a wider PSD distribution. Comparing the local gas velocities to the mean particle diameter reveals that particles that are generated at a higher gas flow regime are smaller than particles generated at a lower gas flow regime (Fig. 2). Please note that particles and agglomerates cannot be distinguished using this measurement setup.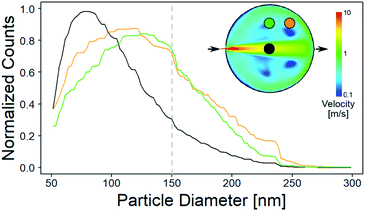 | ||
| Fig. 1 Normalized PSDs for different ablation positions in a cylindrical ablation cell. Top right shows the simulated gas velocities and the sample positions. The colored circles within the ablation cell schematic correspond to the position of the colored lines within the plots. The dotted line represents the threshold of complete ionization. At higher gas velocities, the PSD is narrower and smaller than for low gas velocities. A bigger image of the simulation can be found in Fig. 5. | ||
Assuming that a faster gas flow regime results in faster transport out of the cell implies that there is a direct correlation between the retention time within the cell and particle agglomeration. Additionally, the gas flow in the center represents a laminar flow, which reduces particle collision and agglomeration, which is in contrast to the more turbulent behavior that has been described outside the central gas channel.17 The turbulent behavior results in irregular agglomeration and particle loss, which leads to wider PSDs. As the agglomerates increase in size, they approach and exceed the limit for complete atomization in the ICP of approximately 150 nm diameter, as already shown for glass.40 Since the particle composition is inhomogeneous and varies depending on size, elemental fractionation is observed when larger particles are no longer fully analyzed.
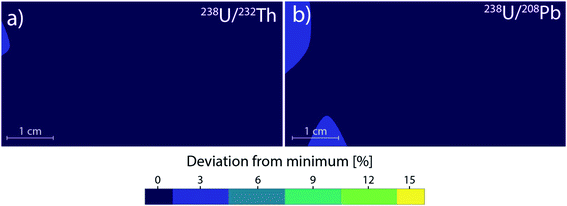
Therefore, the 238U/232Th and 238U/208Pb systems were chosen as an indicator for fractionation in LA-ICPMS as commonly used in geology.55 Compared to the mean particle diameter, their ratios increase with larger average particle or agglomerate size. The effect of changing PSD due to different location-dependent residence times appear to be negligible, until a significant amount of particles grow big enough to approach the complete ionization limit of 150 nm. Once this limit is exceeded, the 238U/232Th and 238U/208Pb ratios change by up to 15% compared to the center (Fig. 3). This deviation directly translates to a 15% error for quantifications as well. In the case of forensics,56 geochronology57 or provenance studies,58 a 15% change in concentration can significantly affect the matching capabilities and change the outcome of decisions. Previous works have shown that with deeper ablation craters, the PSD moves towards smaller particles if the ratio of depth-to-diameter of the crater exceeds 1–2.49,59 When ablation takes place in the central gas channel of the ablation cell, the resulting transported PSD contains small particles that will be fully ionized within the ICP. As the PSD moves towards smaller particles with deeper craters, the resulting ICP signal is barely affected as there is still a complete ionization of the aerosol. For ablation outside the central channel, the PSD becomes broader and contains larger particles, which are no longer completely ionized within the ICP. With deeper craters, the PSD will move towards smaller particles and thus decrease the amount of incompletely ionized material. This change from less to more efficient ionization can cause elemental fractionation and has been shown to reach a value of up to 50% at a depth-to-diameter ratio of 6.60 If the depth-to-diameter ratio does not exceed the critical limit of 1–2 during ablation, then the change in PSD due to position dependence and resulting agglomeration behavior is assumed to be a dominant source of plasma induced elemental fractionation.
Position dependence in a low-dispersion ablation cell
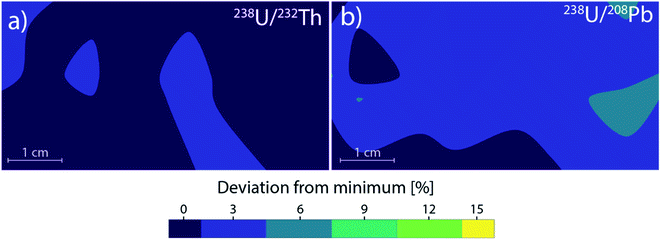
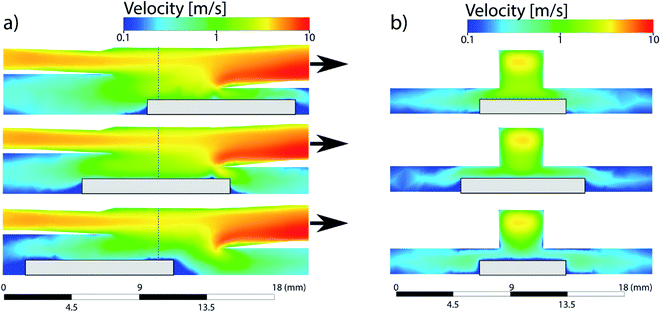
As most ablation cell developments within recent years focused on fast washout, low-dispersion cells were studied in detail with a focus on cells based on the tube geometry. The 3D-movable stage for the low-dispersion ablation cell setup reported by Neff et al.47 was filled with 8 separate NIST SRM 612 disks. The disks were evenly spaced to cover the area of a standard microscope slide with a cell to sample distance (CSD) of 0.8 mm. Ablation locations were chosen near the edges of the disks for “worst-case” turbulence formation. Using a total of 32 different sampling positions, contour plots were calculated to determine any variations on the elemental ratios for a 5 cm by 2.5 cm area. Compared to the cylindrical cell, the resulting largest variations were smaller than 5%, corresponding to the standard deviation of the measurement (Fig. 4). No trend was observed between sampling position and the resulting elemental ratios. Since two-volume ablation cells provide comparable gas velocities and turbulences for every sample position, it can be demonstrated that the stable ratios are a direct consequence of a similar aerosol transport behavior (<6% deviations versus 15%). Unfortunately, PSDs could not be measured due to the majority of generated particles within this ablation cell being too small, which however suggests complete ionization of the aerosol within the ICP was likely as no particles larger than approx. 100 nm could be found in the measurement range of the particle spectrometer (50–1000 nm diameter). As such, the growth of larger particles in an ablation cell is likely closely related to the aerosol residence time within the ablation cell. Therefore, for fast washout cells and two-volume cells, the particles will experience less fractionation effects caused by varying PSDs. Due to the small nature of the particles for the PFAC, agglomeration would have to be increased by a factor of 2–3 to reach the critical limit of 150 nm before plasma-induced fractionation is observed. In two-volume cells with a larger second volume, the PSD starts out with bigger particles compared to the PFAC. Therefore the critical ionization threshold will be reached sooner, but be more independent of sample location with respect to fractionation effects, when compared to one-volume ablation cells.Gas simulation comparison between large volume cells and two-volume cells
The simulations of the cylindrical cell have been previously published by Koch et al.17 and are added here for the sake of comparison. The cylindrical ablation cell shows significant deviations in the gas flow directions and velocities depending on the location (Fig. 4). The higher gas velocity in the middle results in faster washout times and the aerosol is more likely to be directly transported. Deviations in the position from the middle axis results in slower transport and an extended dwell time within the ablation cell where the aerosol can circulate around the edges. As laminar flow is only achieved in the centermost path, the aerosol experiences turbulent flow and as such more collisions. This further promotes the formation of larger agglomerates. With changes in gas directions, the washout duration is extended as the aerosol is distributed in the cell and transport to the exit requires longer paths. Due to the symmetrical nature of the gas flows, it is preferable to fill the ablation cell symmetrically as well, mirroring it along the central axis, where the reference material is parallel to the unknown sample. The parallel nature can be affected, if the samples are of different sizes and shapes, as they cause further deviations in the gas flows.In the case of the PFAC (and generally two-volume cells), the ablation position relative to the opening remains the same for every measurement. The only deviations are the relative position of the samples within the bigger chamber. The edges of the samples can induce areas of irregular gas flows which are relevant in the case of ablation near those edges (Fig. 5). As the aerosol is ejected perpendicular to the ablated surface and the local gas flows are slow, the generated aerosol is directly transported into the fast laminar flow regime within the smaller chamber. Gas flows at the sample surface can vary slightly based on the sample shape. Since they remain slow and the aerosol is ejected at high speed, they result in only minor deviations of the sample transport. The negligible effect is confirmed by the small deviations in elemental ratios shown previously. As a result, a two-volume approach is preferable for reproducible and precise measurements.
Proof of concept for bulk analysis
Low dispersion laser ablation cannot be used in combination with the more common sequential mass analyzers for multi-elemental analysis as the signal duration is too short for sequential mass analyzers. By using a long transport tube (in this case 2.5 m, 4 mm inner diameter), it is possible to “smooth out” the laser generated aerosol in a low dispersion cell by means of diffusion. This moves the signal from resolved laser pulses to a stable continuous signal, like in the case of large volume ablation cells. With this approach, low dispersion cells can then be used for the same purposes. The longer tubing takes over the role of a larger second volume, with the added benefit of laminar flow minimizing further agglomeration. As an alternative to the longer tubing, a signal smoothing device61 like the “squid” described by Müller et al.16 could be used to smooth the signal instead. Preliminary experiments for this work showed that using the “squid” results in a longer time required for stable element ratios. Stable element ratios were achieved after approx. 20 seconds of continuous ablation using the “squid”, in comparison to approx. 5 seconds using the longer tubing. This is assumed to be caused by early crater formation effects resulting in larger particles, whose arrival is extended in duration as the aerosol is split to tubing of different lengths.As the gas flow patterns of the low dispersion ablation cell are still comparable at every sampling position, there are no significant deviations in particle agglomeration or losses in transport efficiency based on location. As a result, the elemental ratios show no significant variations over the entire stage area (Fig. 6) with a maximal deviation for 238U/232Th of <3%, with the 238U/208Pb ratio showing a maximal deviation of <5% (Fig. 7). These deviations correspond to the standard deviation of a measurement.
With this approach, low dispersion ablation can be combined with sequential mass analyzers as the stable signal no longer requires the fast scanning capabilities of a TOF instrument for multi-elemental analysis. Meanwhile, the advantages of low dispersion ablation cells in regards to reproducibility can be maintained. It follows that other two-volume cells with a much larger second volume would behave similarly since the travel path of the aerosol is comparable at every ablation location. Even if the second volume is large enough to result in more agglomeration, it will be a reproducible process and potentially correctable.
Conclusion
The agglomeration of aerosols depends heavily on the aerosol residence time within the ablation cell. PSDs vary depending on the location within a cylindrical ablation cell. As the PSD moves towards larger and broader distributions, the 238U/232Th ratio increases once a significant amount of particles exceed the critical threshold for complete ionization of 150 nm for glass samples. The resulting distributions match well with simulated gas flows, where areas with slower gas velocities show larger mean particle diameters and higher 238U/232Th and 238U/208Pb ratios.For two-volume cells, the same experiment showed no significant changes of the elemental ratios for different positions in the larger volume where ablation takes place. This is assumed to be due to the fast transport into a second volume, where the local gas flows are independent of the sample position below. As a result, the ablation and transport takes place under similar conditions for all sample positions, with only minor deviations that can be caused by the sample shape. Fluid dynamics simulations revealed slow gas velocities near the sample surface, allowing for a direct transport of the ablated material into the consistent fast laminar flow of the second chamber. As a result, the two-volume approach was found to have higher reproducibility of measurements across the cell area and lower plasma induced fractionation effects, compared to large volume ablation cells.
These results suggest that for accurate quantification, a low-dispersion ablation cell is preferable. If a continuous, stable laser ablation signal is required for sequential mass analyzers, the aerosol can be smoothed by adding longer transport tubing to connect the ablation cell and ICP. As long as laminar flows are maintained, the amount of collisions are minimized. This results in a reduced amount of aerosol agglomeration37,62 and plasma induced fractionation caused by incomplete ionization being kept at a minimum.
Conflicts of interest
There are no conflicts to declare.Acknowledgements
This work was funded and supported by ETH Zürich. The authors would like to gratefully acknowledge the assistance of Roland Mäder from the ETHZ workshop in assisting with the 3D models of the ablation cells for simulations. Additionally, we would like to acknowledge the help of Christoph Neff for helpful scientific discussions and Chiara Fabbretti for proofreading.References
- A. Limbeck, P. Galler, M. Bonta, G. Bauer, W. Nischkauer and F. Vanhaecke, Anal. Bioanal. Chem., 2015, 407, 6593–6617 CrossRef CAS PubMed
.
- D. Günther and B. Hattendorf, Trends Anal. Chem., 2005, 24, 255–265 CrossRef
.
- J. Koch and D. Günther, Appl. Spectrosc., 2011, 65, 155–162 CrossRef
.
- R. J. Watling, B. F. Lynch and D. Herring, J. Anal. At. Spectrom., 1997, 12, 195–203 RSC
.
- J. S. Becker, Spectrochim. Acta, Part B, 2002, 57, 1805–1820 CrossRef
.
- M. Burger, A. Gundlach-Graham, S. Allner, G. Schwarz, H. A. O. Wang, L. Gyr, S. Burgener, B. Hattendorf, D. Grolimund and D. Günther, Anal. Chem., 2015, 87, 8259–8267 CrossRef CAS PubMed
.
- D. Pozebon, G. L. Scheffler, V. L. Dressler and M. A. G. Nunes, J. Anal. At. Spectrom., 2014, 29, 2204–2228 RSC
.
- J. S. Becker, J. S. Becker, M. V. Zoriy, J. Dobrowolska and A. Matusch, Eur. J. Mass Spectrom., 2007, 13, 1–6 CrossRef CAS
.
- J. Hoogewerff, D. Gunther, C. Latkoczy, R. J. Watling, J. Buscaglia, R. D. Koons, J. R. Ehleringer and S. Kelly, Forensic Sci. Int., 2003, 136, 1 Search PubMed
.
- I. Horn and D. Günther, Appl. Surf. Sci., 2003, 207, 144–157 CrossRef CAS
.
- J. Pisonero, D. Fliegel and D. Günther, J. Anal. At. Spectrom., 2006, 21, 922–931 RSC
.
- M. B. Fricker, D. Kutscher, B. Aeschlimann, J. Frommer, R. Dietiker, J. Bettmer and D. Günther, Int. J. Mass Spectrom., 2011, 307, 39–45 CrossRef CAS
.
- E. L. Gurevich and R. Hergenröder, J. Anal. At. Spectrom., 2007, 22, 1043–1050 RSC
.
- A. M. Leach and G. M. Hieftje, Appl. Spectrosc., 2002, 56, 62–69 CrossRef CAS
.
- D. B. Aeschliman, S. J. Bajic, D. P. Baldwin and R. S. Houk, J. Anal. At. Spectrom., 2003, 18, 872–877 RSC
.
- W. Müller, M. Shelley, P. Miller and S. Broude, J. Anal. At. Spectrom., 2009, 24, 209–214 RSC
.
- J. Koch, M. Wälle, R. Dietiker and D. Günther, Anal. Chem., 2008, 80, 915–921 CrossRef CAS PubMed
.
- D. Autrique, A. Bogaerts, H. Lindner, C. C. Garcia and K. Niemax, Spectrochim. Acta, Part B, 2008, 63, 257–270 CrossRef
.
- A. Gundlach-Graham and D. Günther, Anal. Bioanal. Chem., 2016, 408, 2687–2695 CrossRef CAS PubMed
.
- T. Van Acker, S. J. M. Van Malderen, T. Van Helden, C. Stremtan, M. Šala, J. T. Van Elteren and F. Vanhaecke, J. Anal. At. Spectrom., 2021, 36, 1201–1209 RSC
.
- S. J. M. Van Malderen, T. Van Acker and F. Vanhaecke, Anal. Chem., 2020, 92, 5756–5764 CrossRef CAS PubMed
.
- H. A. O. Wang, D. Grolimund, C. Giesen, C. N. Borca, J. R. H. Shaw-Stewart, B. Bodenmiller and D. Günther, Anal. Chem., 2013, 85, 10107–10116 CrossRef CAS
.
- D. N. Douglas, A. J. Managh, H. J. Reid and B. L. Sharp, Anal. Chem., 2015, 87, 11285–11294 CrossRef CAS
.
- P. Sylvester, Econ. Geol., 2008, 40, 356 Search PubMed
.
- L. V. Zhigilei, Appl. Phys. A: Mater. Sci. Process., 2003, 76, 339–350 CrossRef CAS
.
- R. Huang, Q. Yu, Q. Tong, W. Hang, J. He and B. Huang, Spectrochim. Acta, Part B, 2009, 64, 255–261 CrossRef
.
- T. Luo, Z. Hu, W. Zhang, D. Günther, Y. Liu, K. Zong and S. Hu, J. Anal. At. Spectrom., 2018, 33, 1655–1663 RSC
.
- R. Glaus, R. Kaegi, F. Krumeich and D. Günther, Spectrochim. Acta, Part B, 2010, 65, 812–822 CrossRef
.
- T. Luo, Y. Wang, Z. Hu, D. Günther, Y. Liu, S. Gao, M. Li and S. Hu, J. Anal. At. Spectrom., 2015, 30, 941–949 RSC
.
- H. R. Kuhn and D. Günther, Anal. Chem., 2003, 75, 747–753 CrossRef CAS
.
- R. E. Russo, X. L. Mao, O. V. Borisov and L. Haichen, J. Anal. At. Spectrom., 2000, 15, 1115–1120 RSC
.
- A. Kar and J. Mazumder, Phys. Rev. E: Stat. Phys., Plasmas, Fluids, Relat. Interdiscip. Top., 1994, 49, 410–419 CrossRef CAS PubMed
.
- J. Koch, M. Wälle, S. Schlamp, T. Rösgen and D. Günther, Spectrochim. Acta, Part B, 2008, 63, 37–41 CrossRef
.
- H. Schittenhelm, G. Callies, A. Straub, P. Berger and H. Hügel, J. Phys. D: Appl. Phys., 1998, 31, 418–427 CrossRef CAS
.
- G. Cailles, H. Schittenhelm, P. Berger and H. Hügel, Appl. Surf. Sci., 1998, 127–129, 134–141 CrossRef
.
-
M. M. R. Williams and S. K. Loyalka, Aerosol Science: Theory and Practice with Special Applications to Nuclear Industry, Pergamon Press, New York, 1991 Search PubMed
.
- R. Hergenröder, Spectrochim. Acta, Part B, 2006, 61, 284–300 CrossRef
.
- D. B. Geohegan, A. A. Puretzky, G. Duscher and S. J. Pennycook, Appl. Phys. Lett., 1998, 72, 2987–2989 CrossRef CAS
.
- H. R. Kuhn and D. Gunther, J. Anal. At. Spectrom., 2004, 19, 1158–1164 RSC
.
- H. R. Kuhn, M. Guillong and D. Günther, Anal. Bioanal. Chem., 2004, 378, 1069–1074 CrossRef CAS PubMed
.
- Z. Hu, Y. Liu, S. Gao, S. Hu, R. Dietiker and D. Günther, J. Anal. At. Spectrom., 2008, 23, 1192–1203 RSC
.
- J. Koch, A. Von Bohlen, R. Hergenröder and K. Niemax, J. Anal. At. Spectrom., 2004, 19, 267–272 RSC
.
- M. Guillong, H. R. Kuhn and D. Günther, Spectrochim. Acta, Part B, 2003, 58, 211–220 CrossRef
.
- J. Koch, S. Heiroth, T. Lippert and D. Günther, Spectrochim. Acta, Part B, 2010, 65, 943–949 CrossRef
.
- H. R. Kuhn and D. Günther, Anal. Bioanal. Chem., 2005, 383, 434–441 CrossRef CAS PubMed
.
- D. Bleiner and D. Günther, J. Anal. At. Spectrom., 2001, 16, 449–456 RSC
.
- C. Neff, P. Becker and D. Gunther, J. Anal. At. Spectrom., 2022, 37, 677–683 RSC
.
- O. Borovinskaya, B. Hattendorf, M. Tanner, S. Gschwind and D. Günther, J. Anal. At. Spectrom., 2013, 28, 226–233 RSC
.
- M. Guillong and D. Günther, J. Anal. At. Spectrom., 2002, 17, 831–837 RSC
.
- J. Koch, G. Schaldach, B. Harald and K. Niemax, Anal. Bioanal. Chem., 2004, 76, 130A–136A CAS
.
- G. Schaldach, L. Berger, I. Razilov and H. Berndt, J. Anal. At. Spectrom., 2002, 17, 334–344 RSC
.
- S. J. M. Van Malderen, A. J. Managh, B. L. Sharp and F. Vanhaecke, J. Anal. At. Spectrom., 2016, 31, 423–439 RSC
.
- D. Bleiner and A. Bogaerts, Spectrochim. Acta, Part B, 2007, 62, 155–168 CrossRef
.
-
L. D. Landau and E. M. Lifshitz, Fluid Mechanics, Pergamon Press, 2nd edn, 2013 Search PubMed
.
- J. Koch, M. Wälle, J. Pisonero and D. Günther, J. Anal. At. Spectrom., 2006, 21, 932–940 RSC
.
- P. Becker, C. Neff, S. Hess, P. Weis and D. Günther, J. Anal. At. Spectrom., 2020, 35, 2248–2254 RSC
.
- Z. Chang, J. D. Vervoort, W. C. McClelland and C. Knaack, Geochem., Geophys., Geosyst., 2006, 7, 1–14 CrossRef
.
- M. F. Guerra, C. O. Sarthre, A. Gondonneau and J. N. Barrandon, J. Archaeol. Sci., 1999, 26, 1101–1110 CrossRef
.
- I. Horn, R. L. Rudnick and W. F. McDonough, Chem. Geol., 2000, 164, 281–301 CrossRef CAS
.
- A. J. G. Mank and P. R. D. Mason, J. Anal. At. Spectrom., 1999, 14, 1143–1153 RSC
.
- J. M. G. Shelley, S. M. Eggins and L. P. J. Kinsley, Appl. Surf. Sci., 1998, 127–129, 278–286 Search PubMed
.
- J. J. Gonzalez, C. Liu, S. B. Wen, X. Mao and R. E. Russo, Talanta, 2007, 73, 567–576 CrossRef CAS PubMed
.
| This journal is © The Royal Society of Chemistry 2022 |

